Research on Diesel Engine Fault Status Identification Method Based on Synchro Squeezing S-Transform and Vision Transformer
Abstract
1. Introduction
- (1)
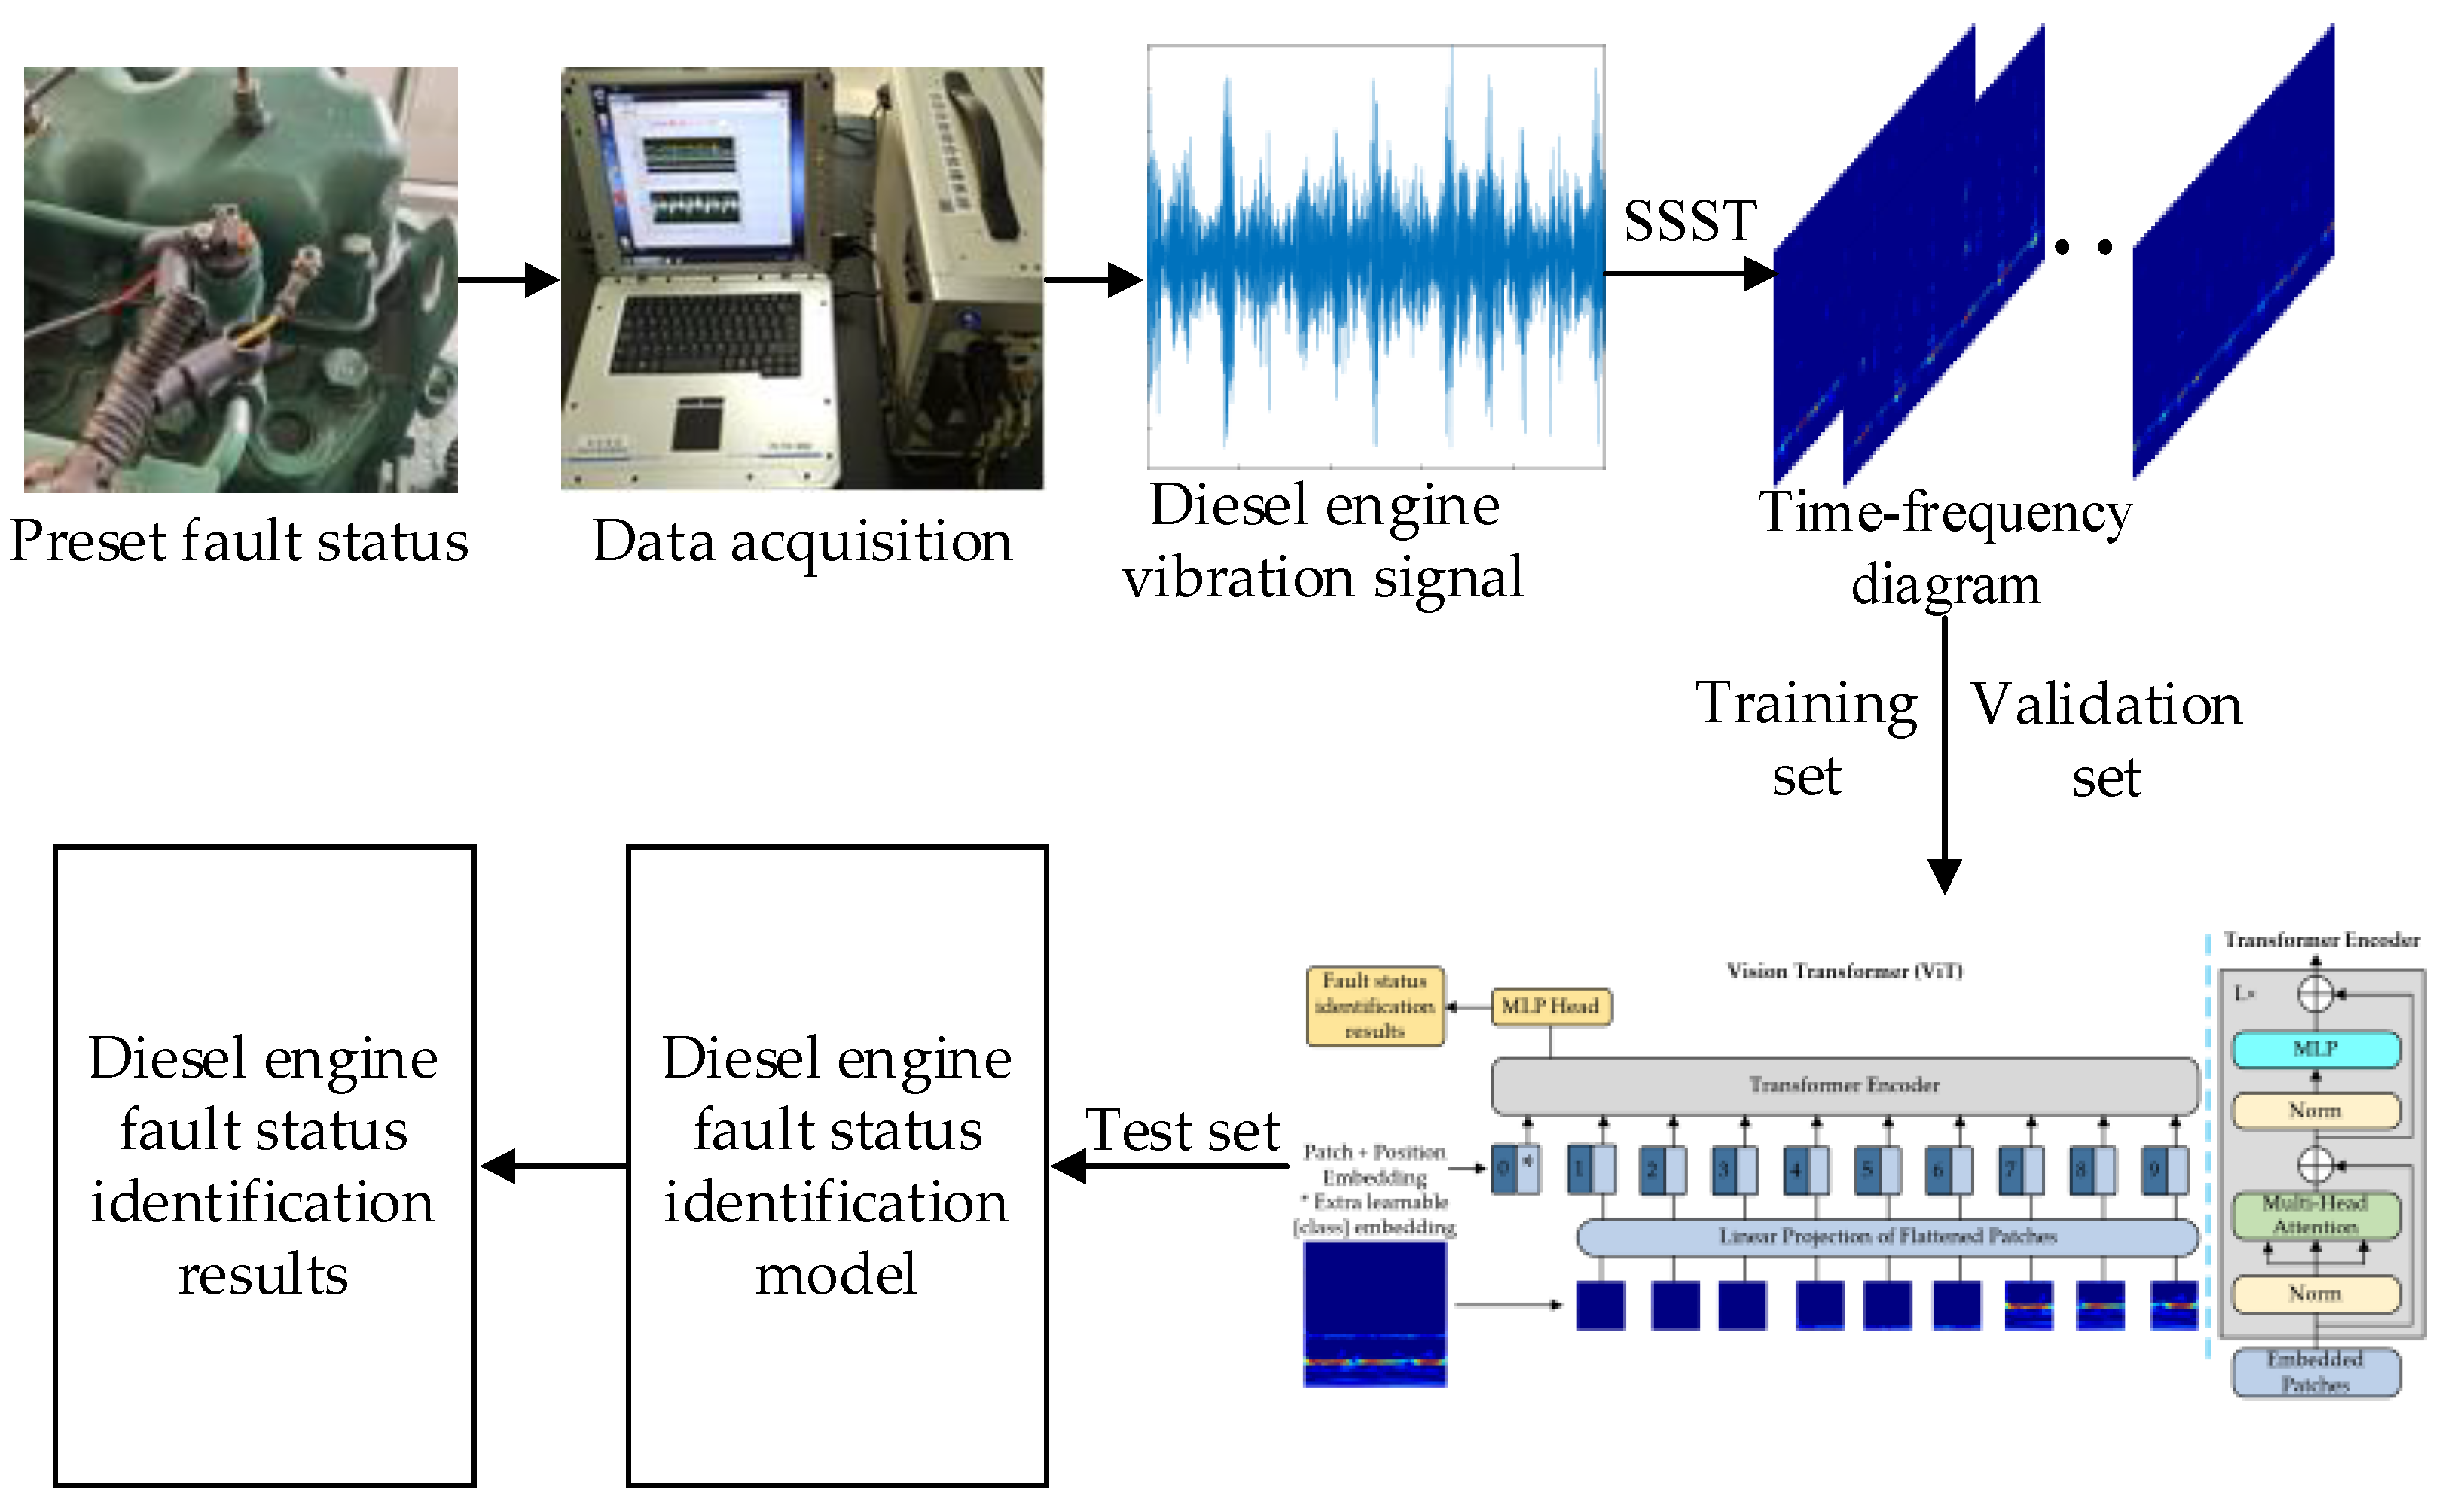
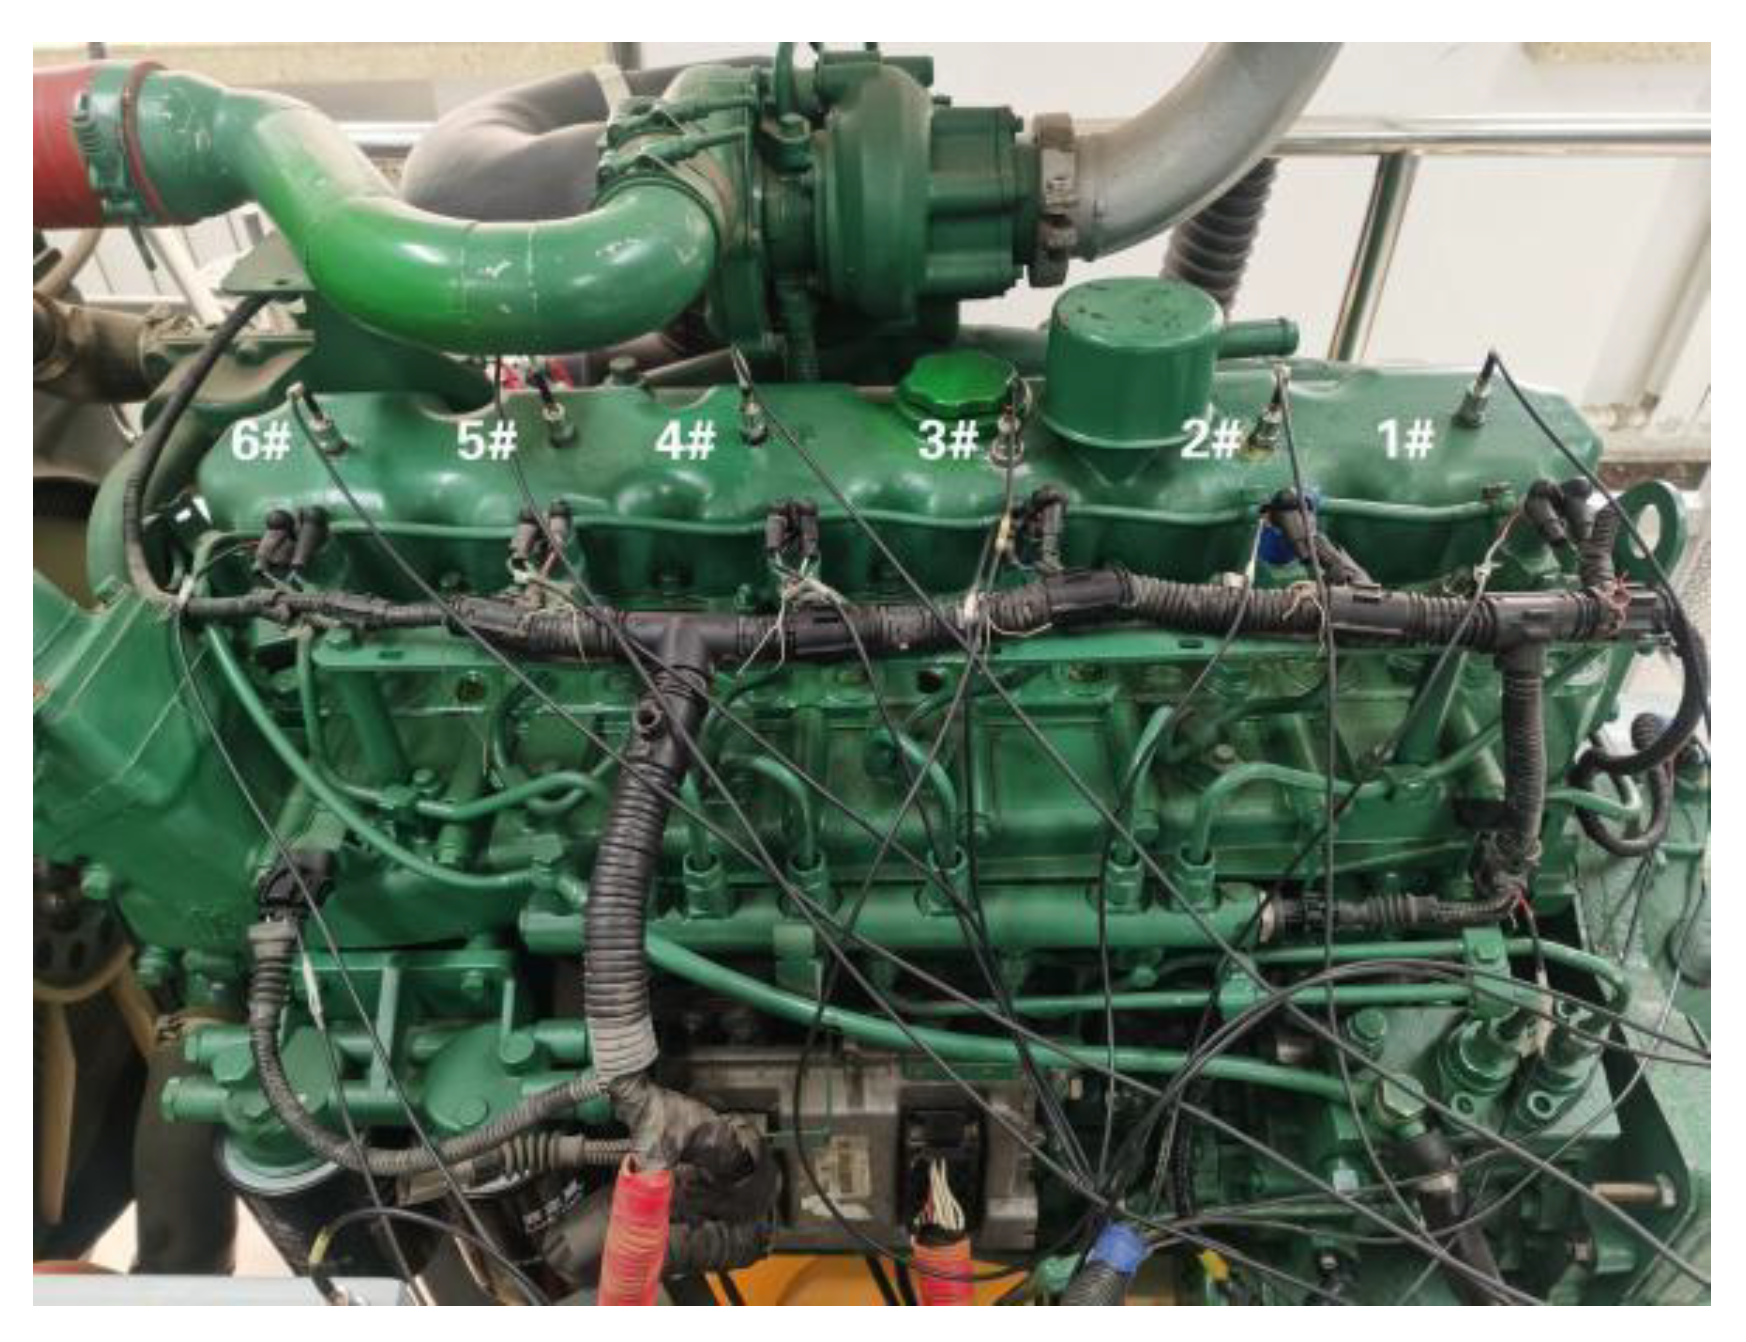
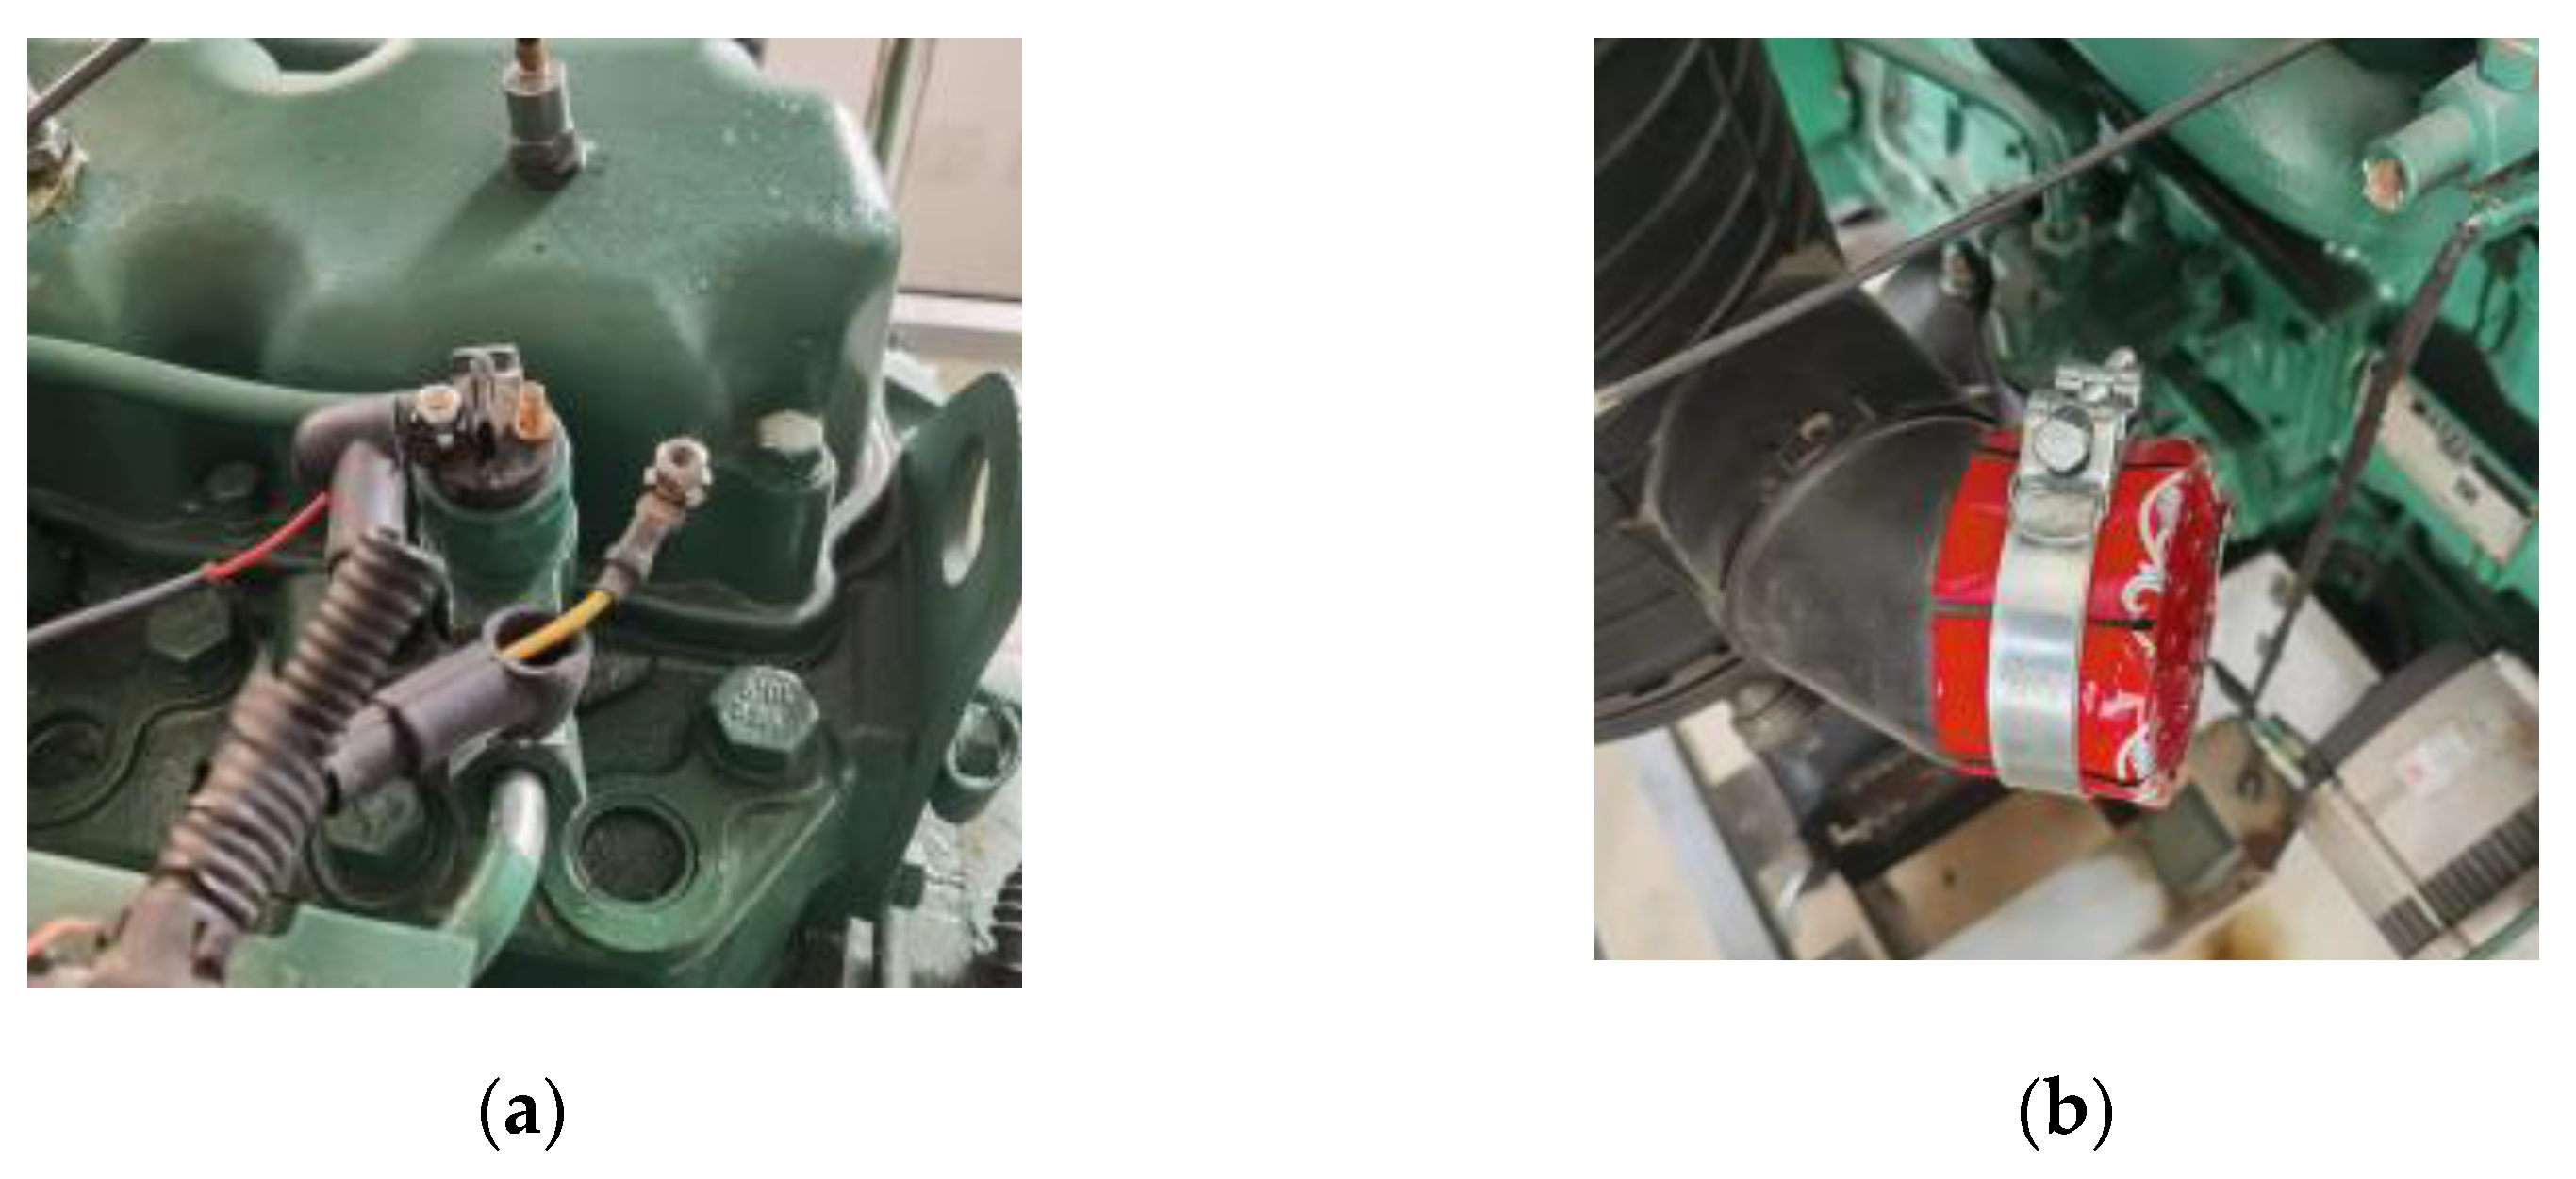
- Relying on the existing conditions in the laboratory, a pre-set fault experiment was carried out to realize the acquisition of diesel engine cylinder head vibration signals.
- (2)
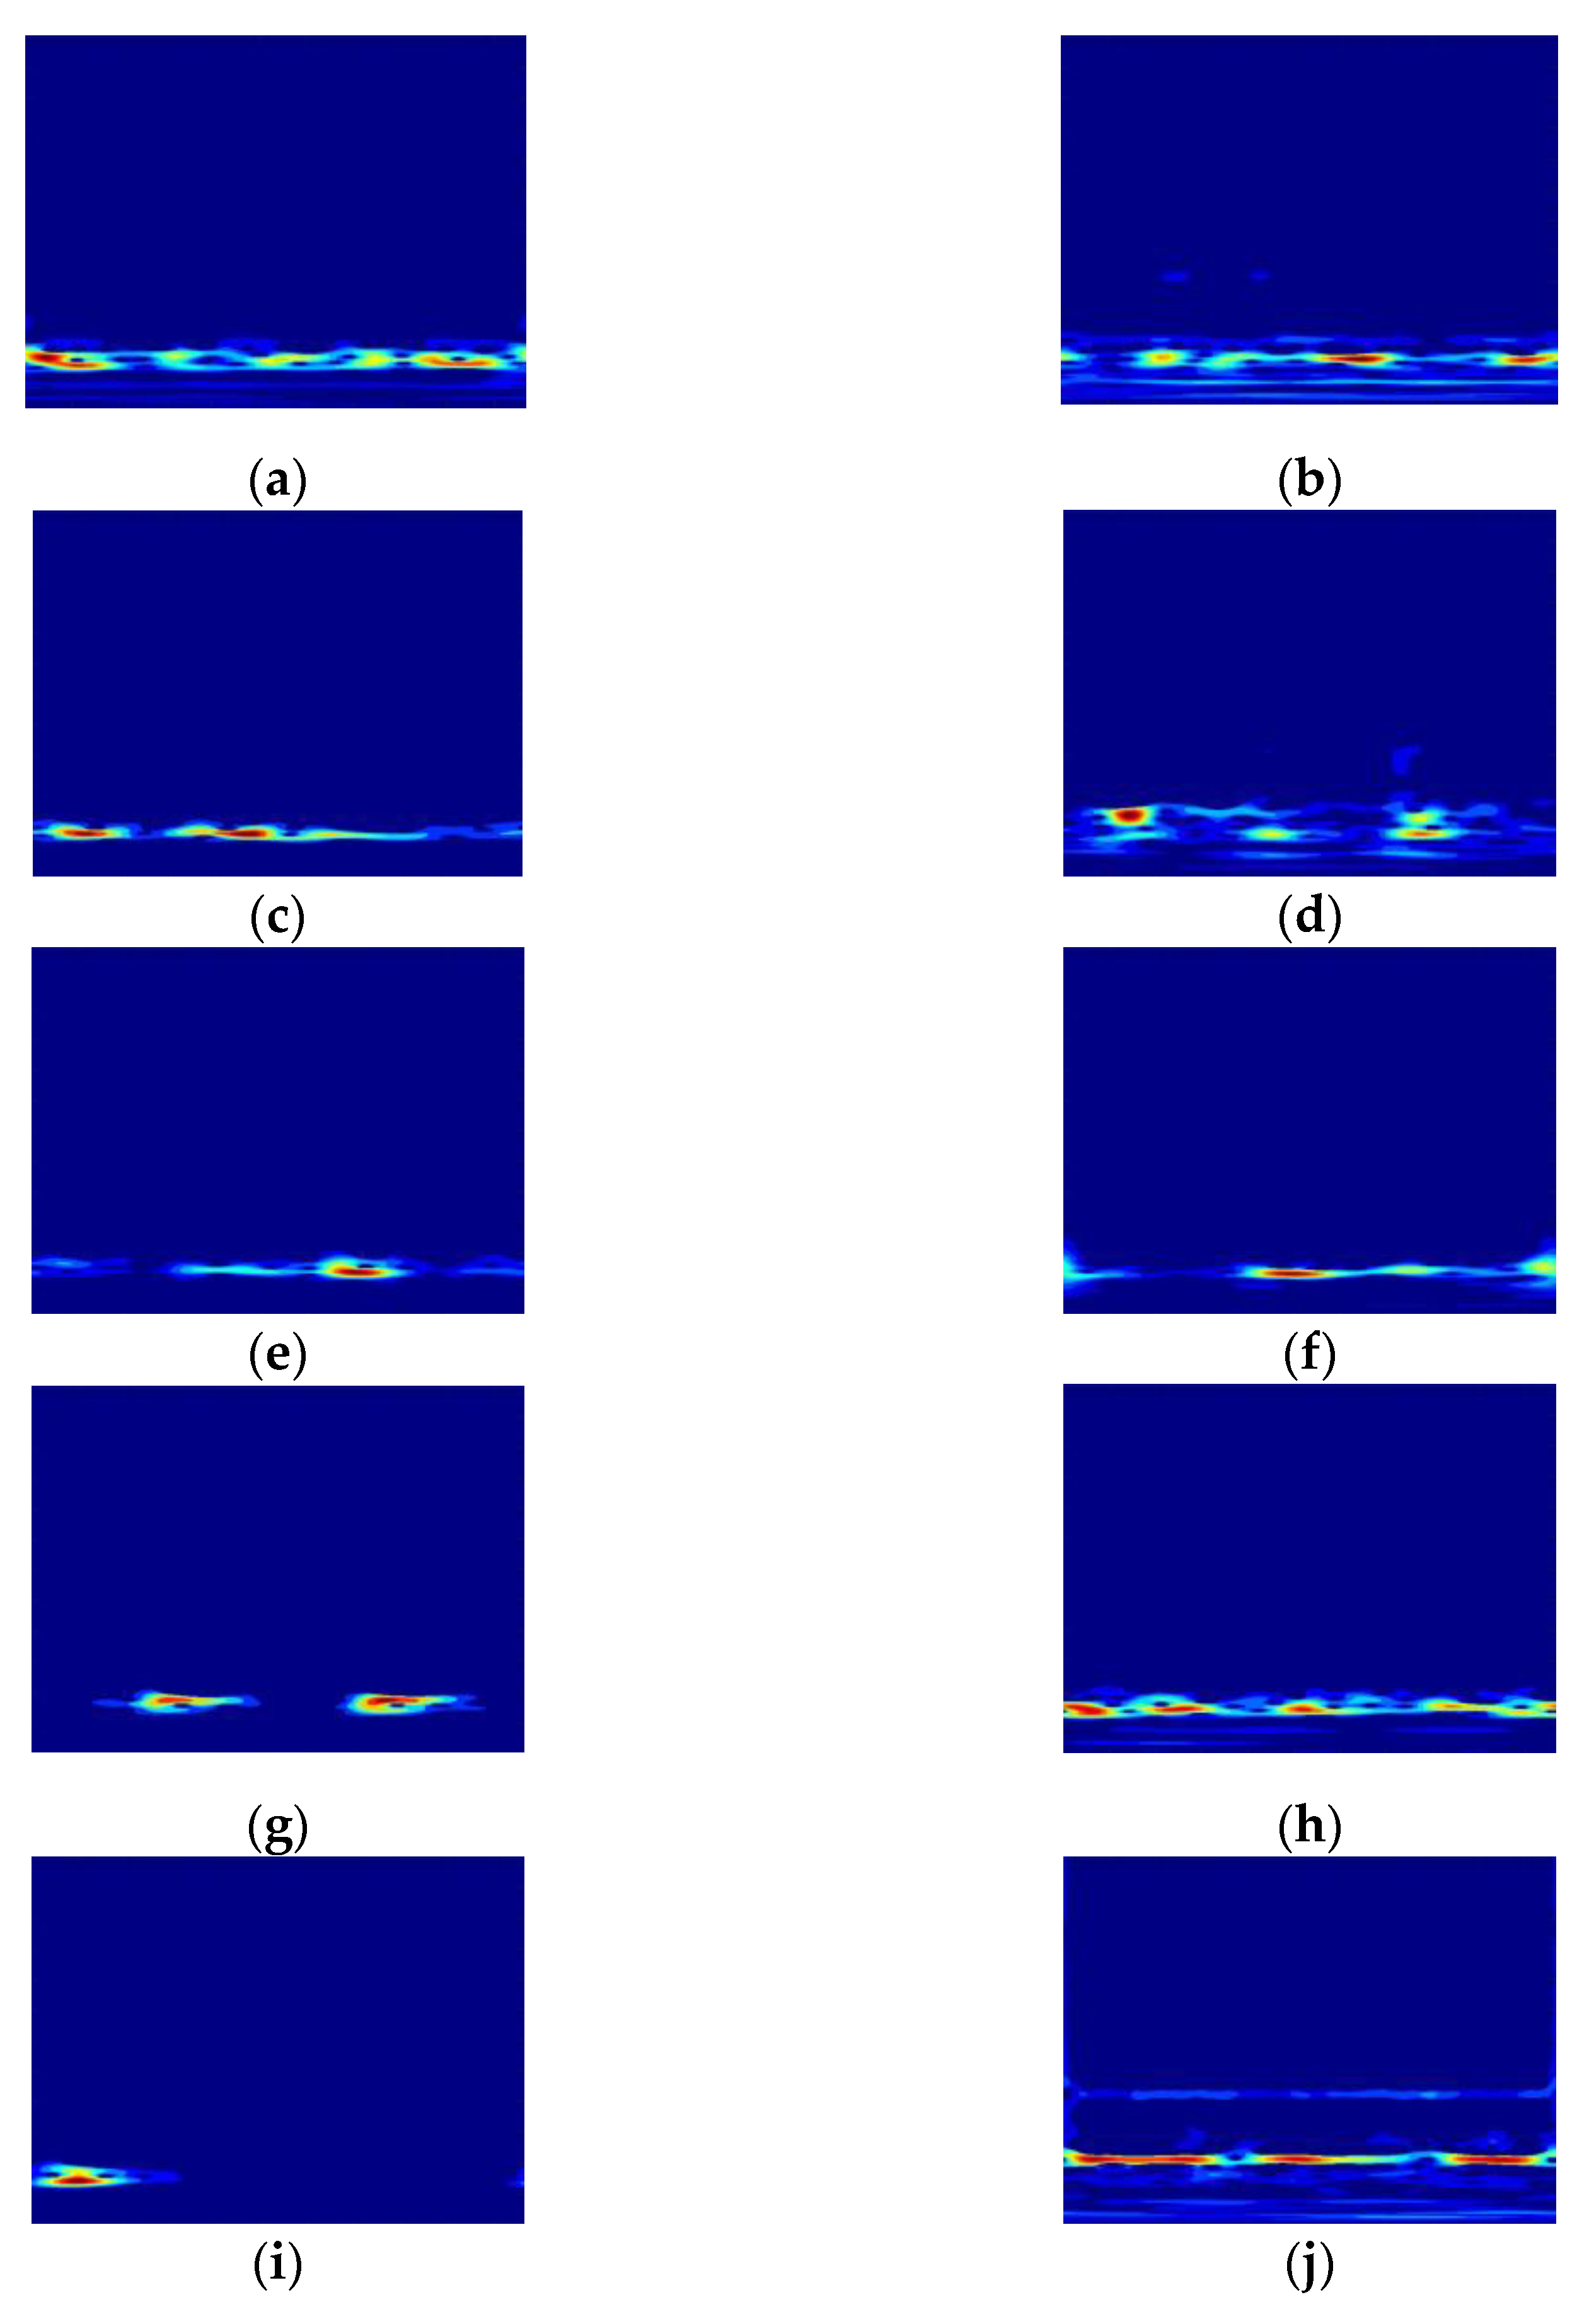
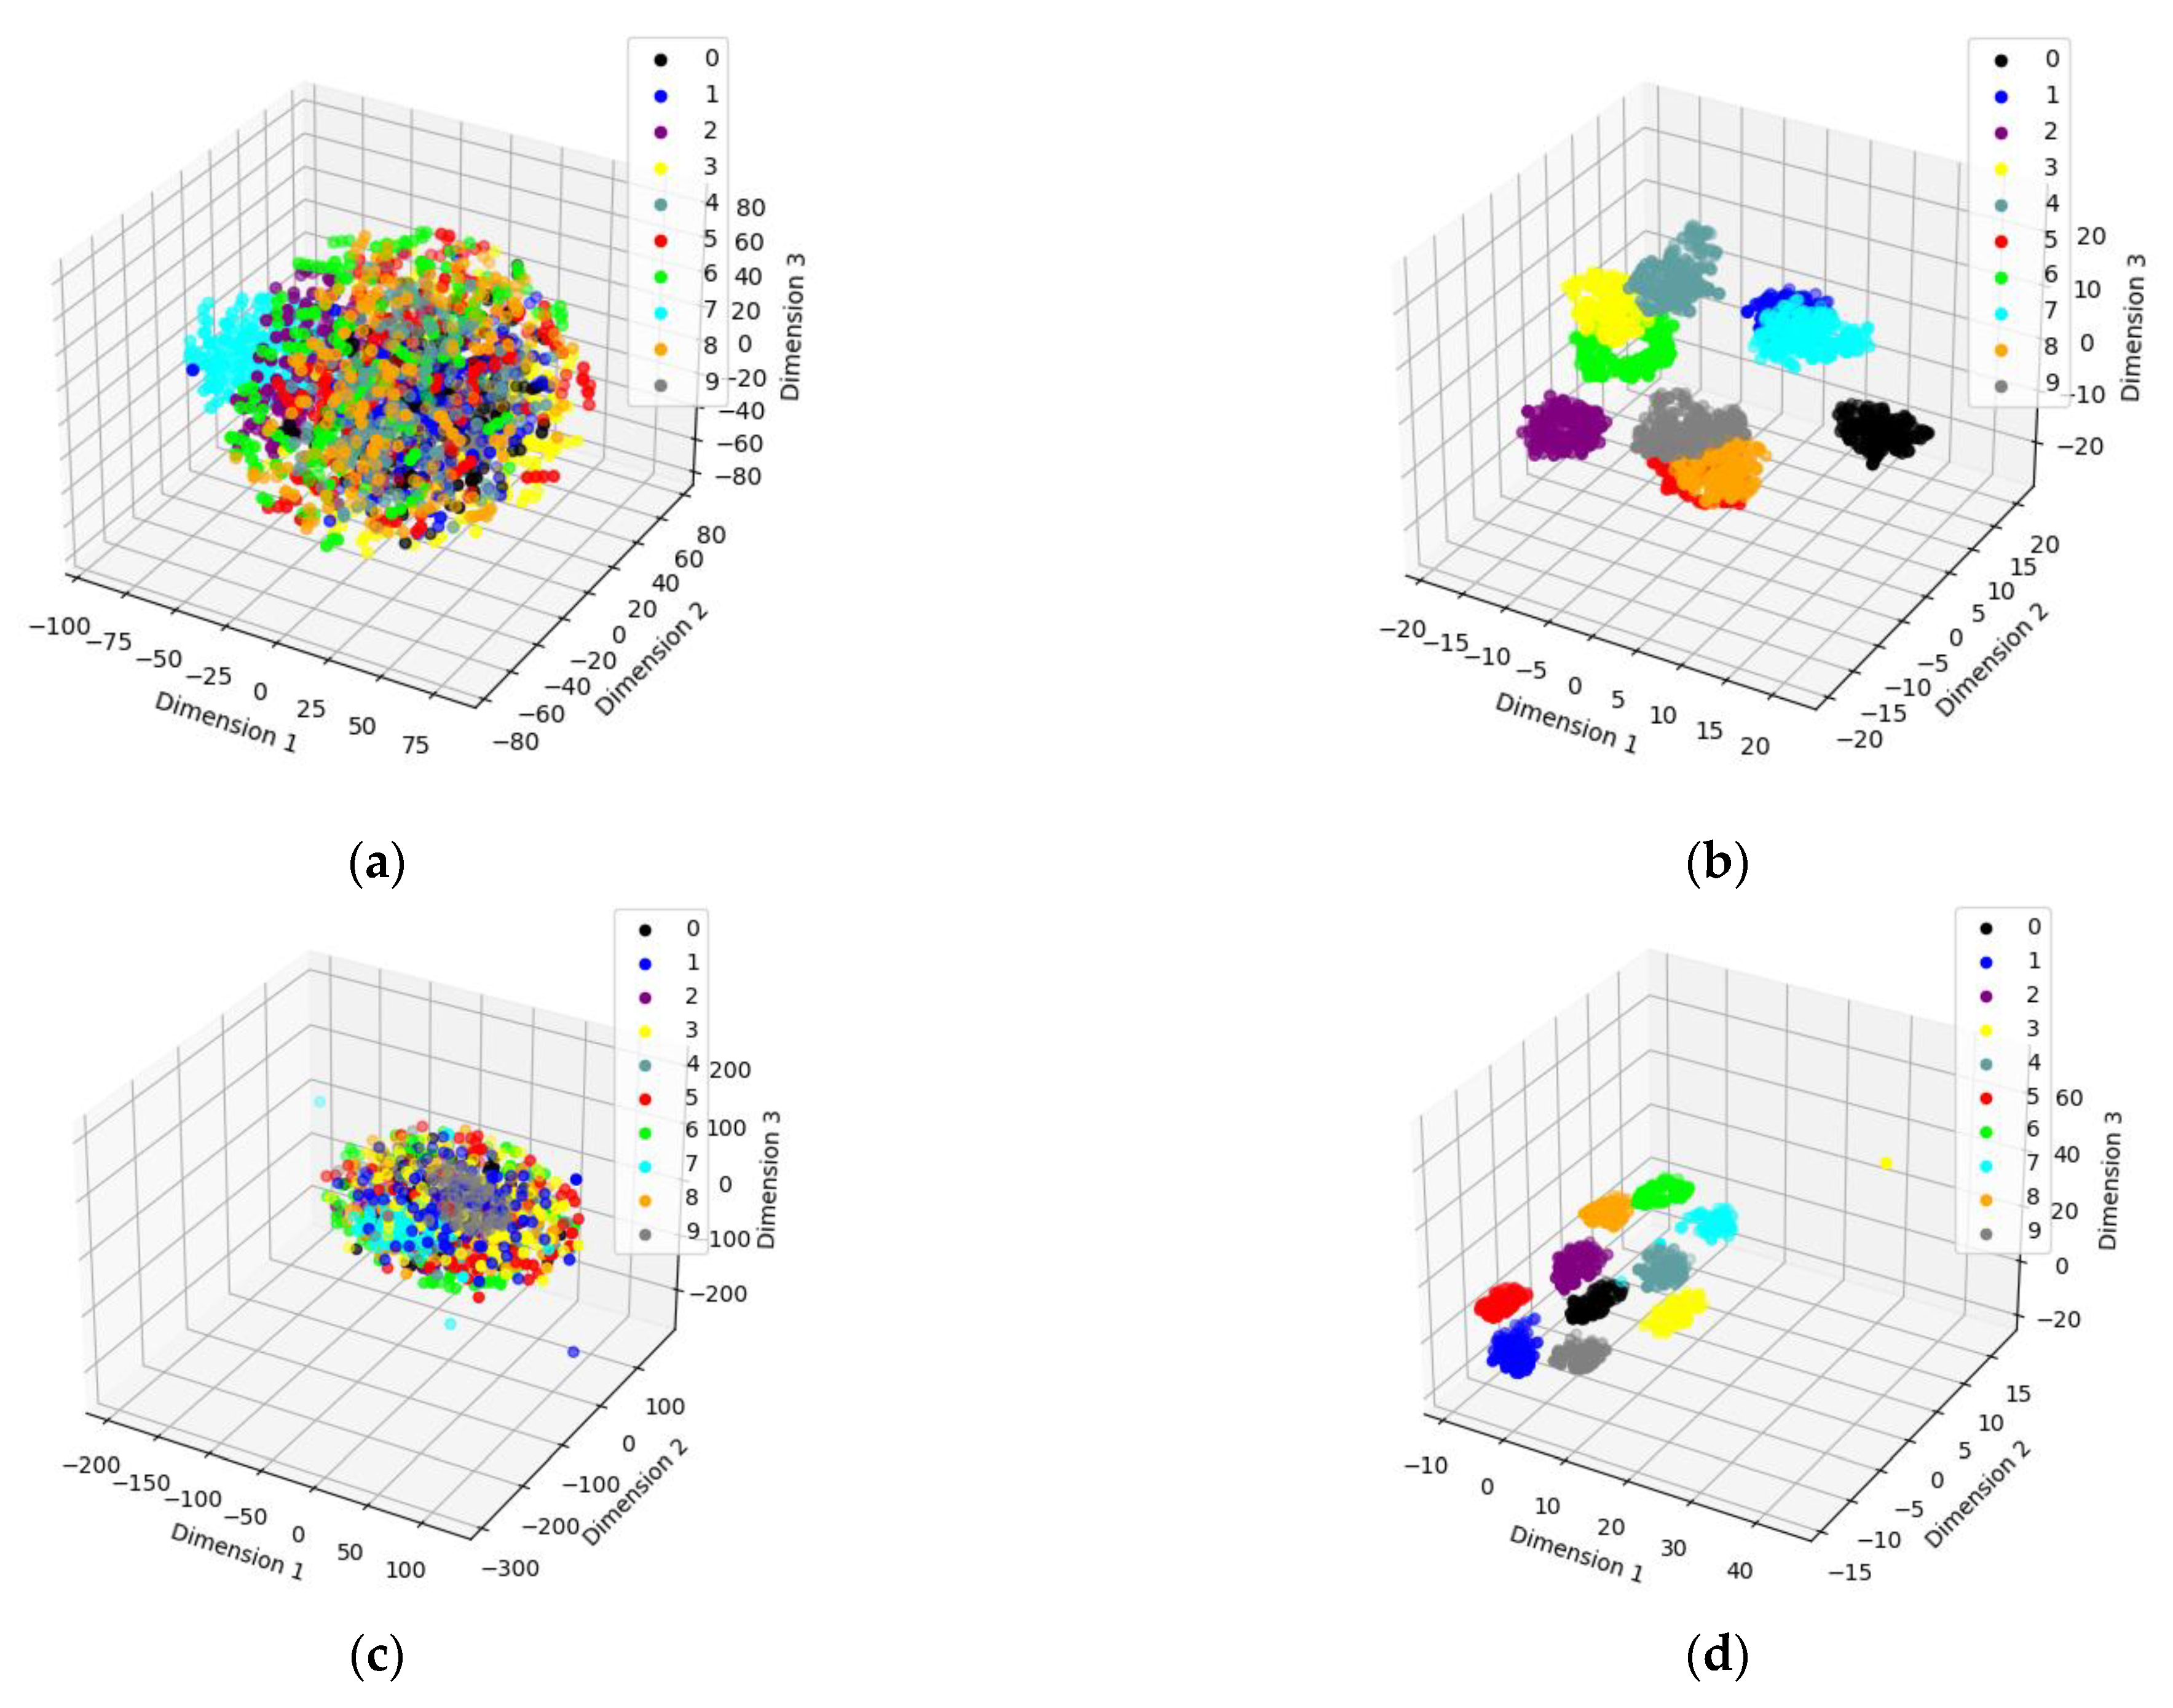
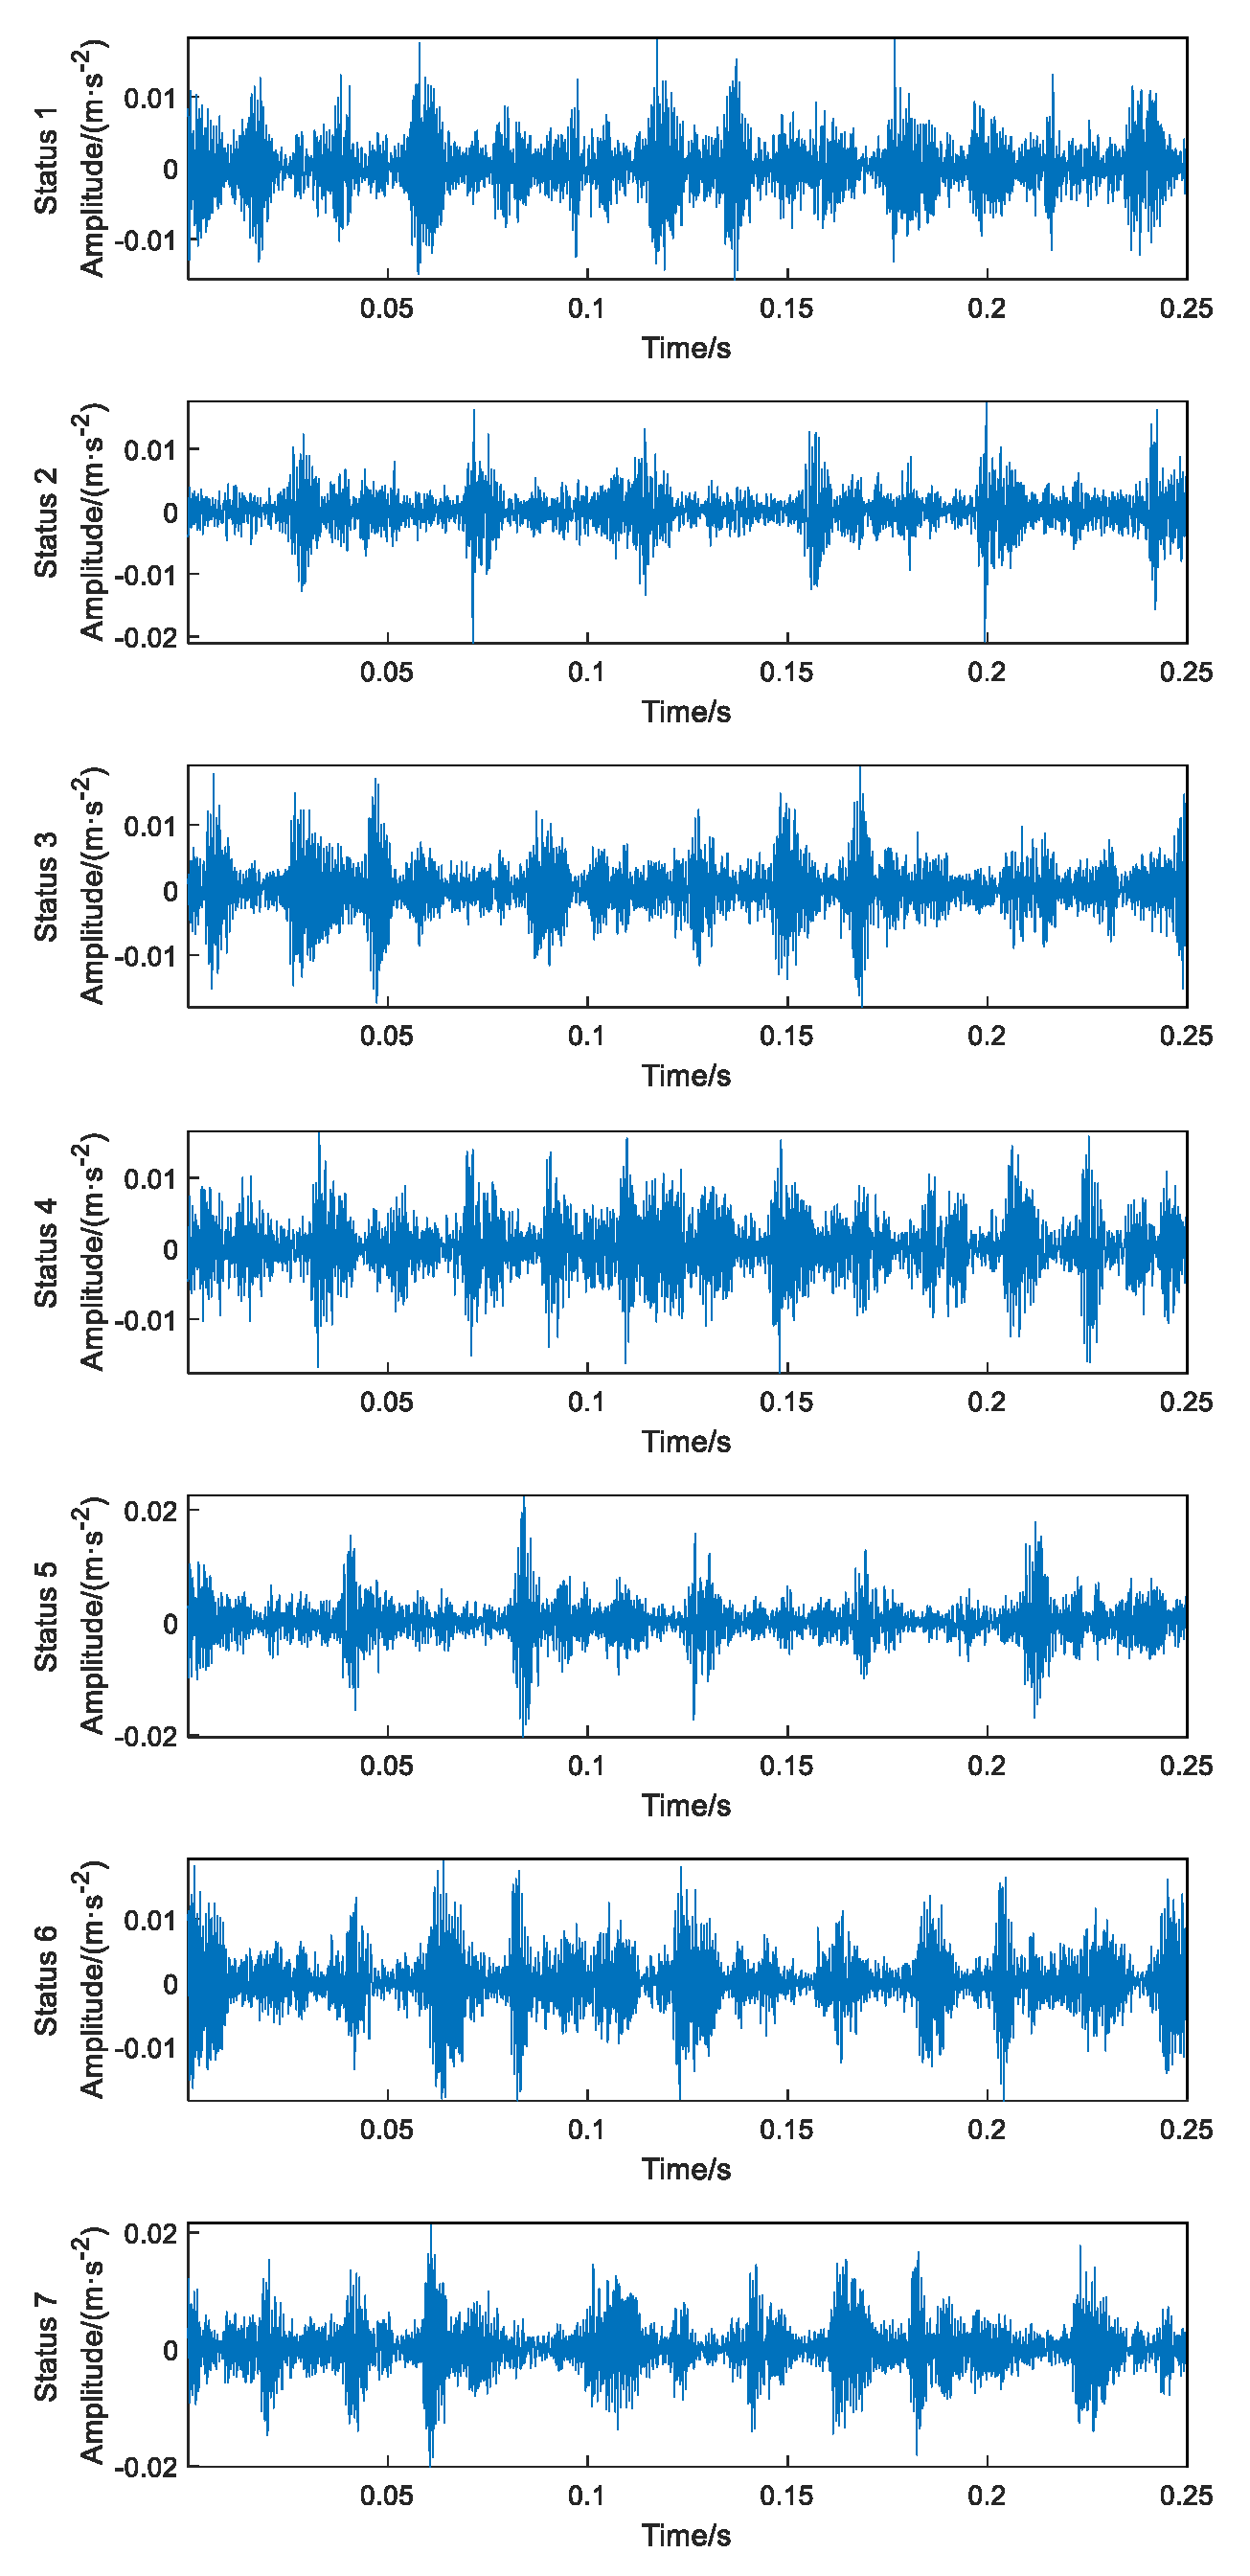
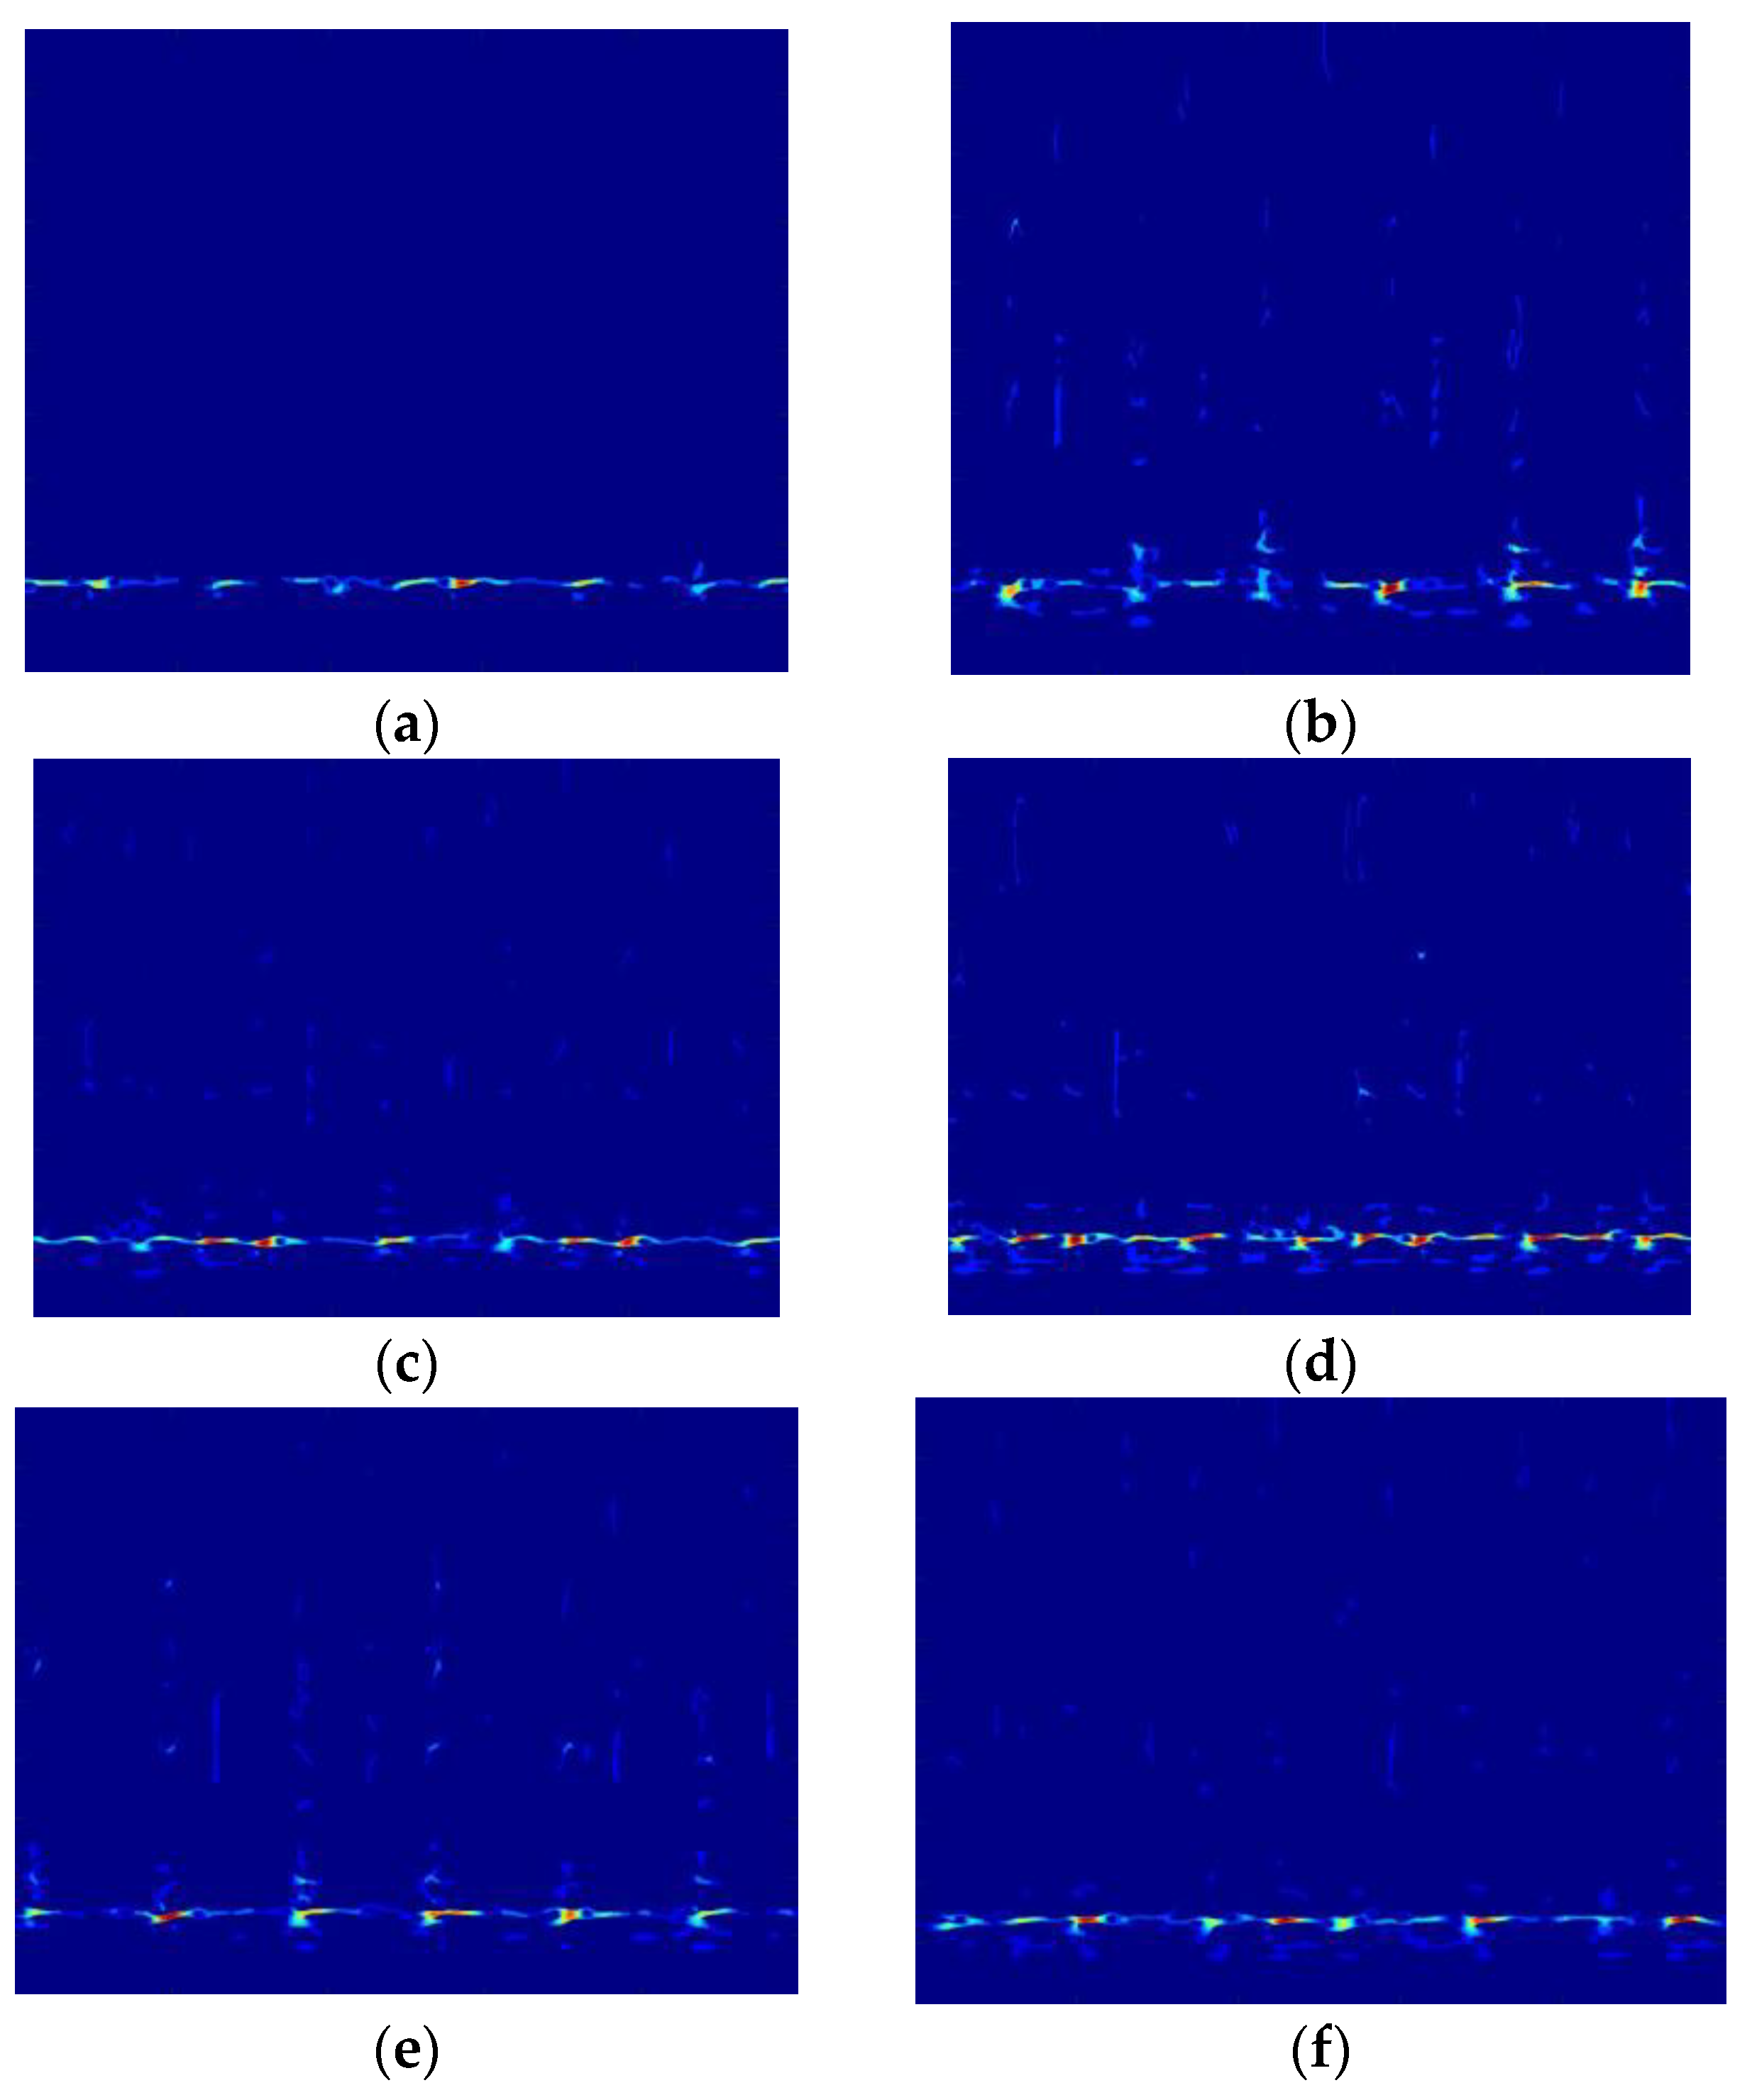
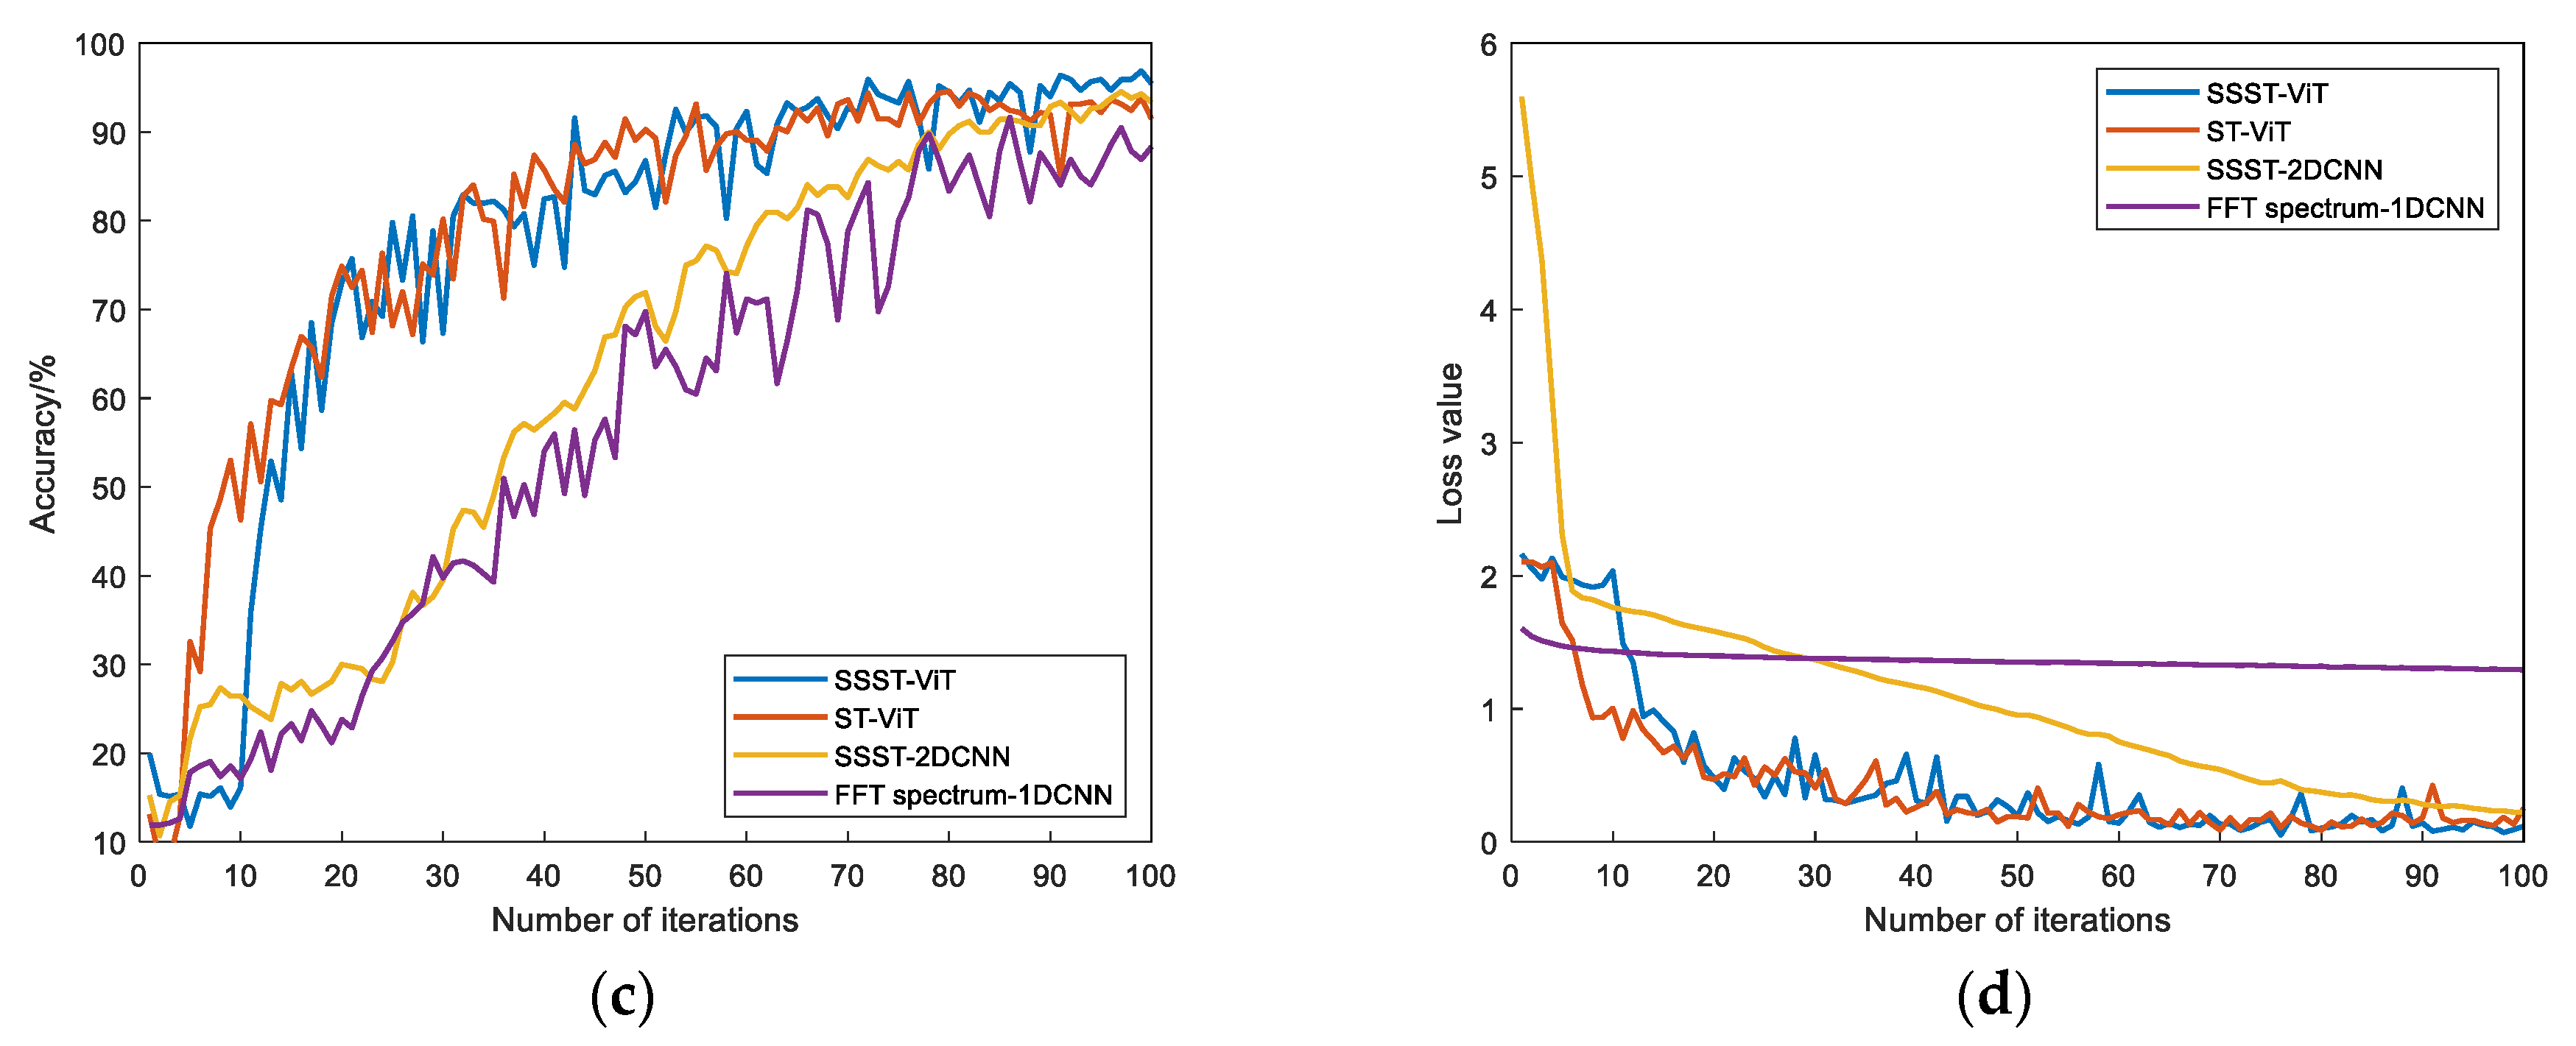
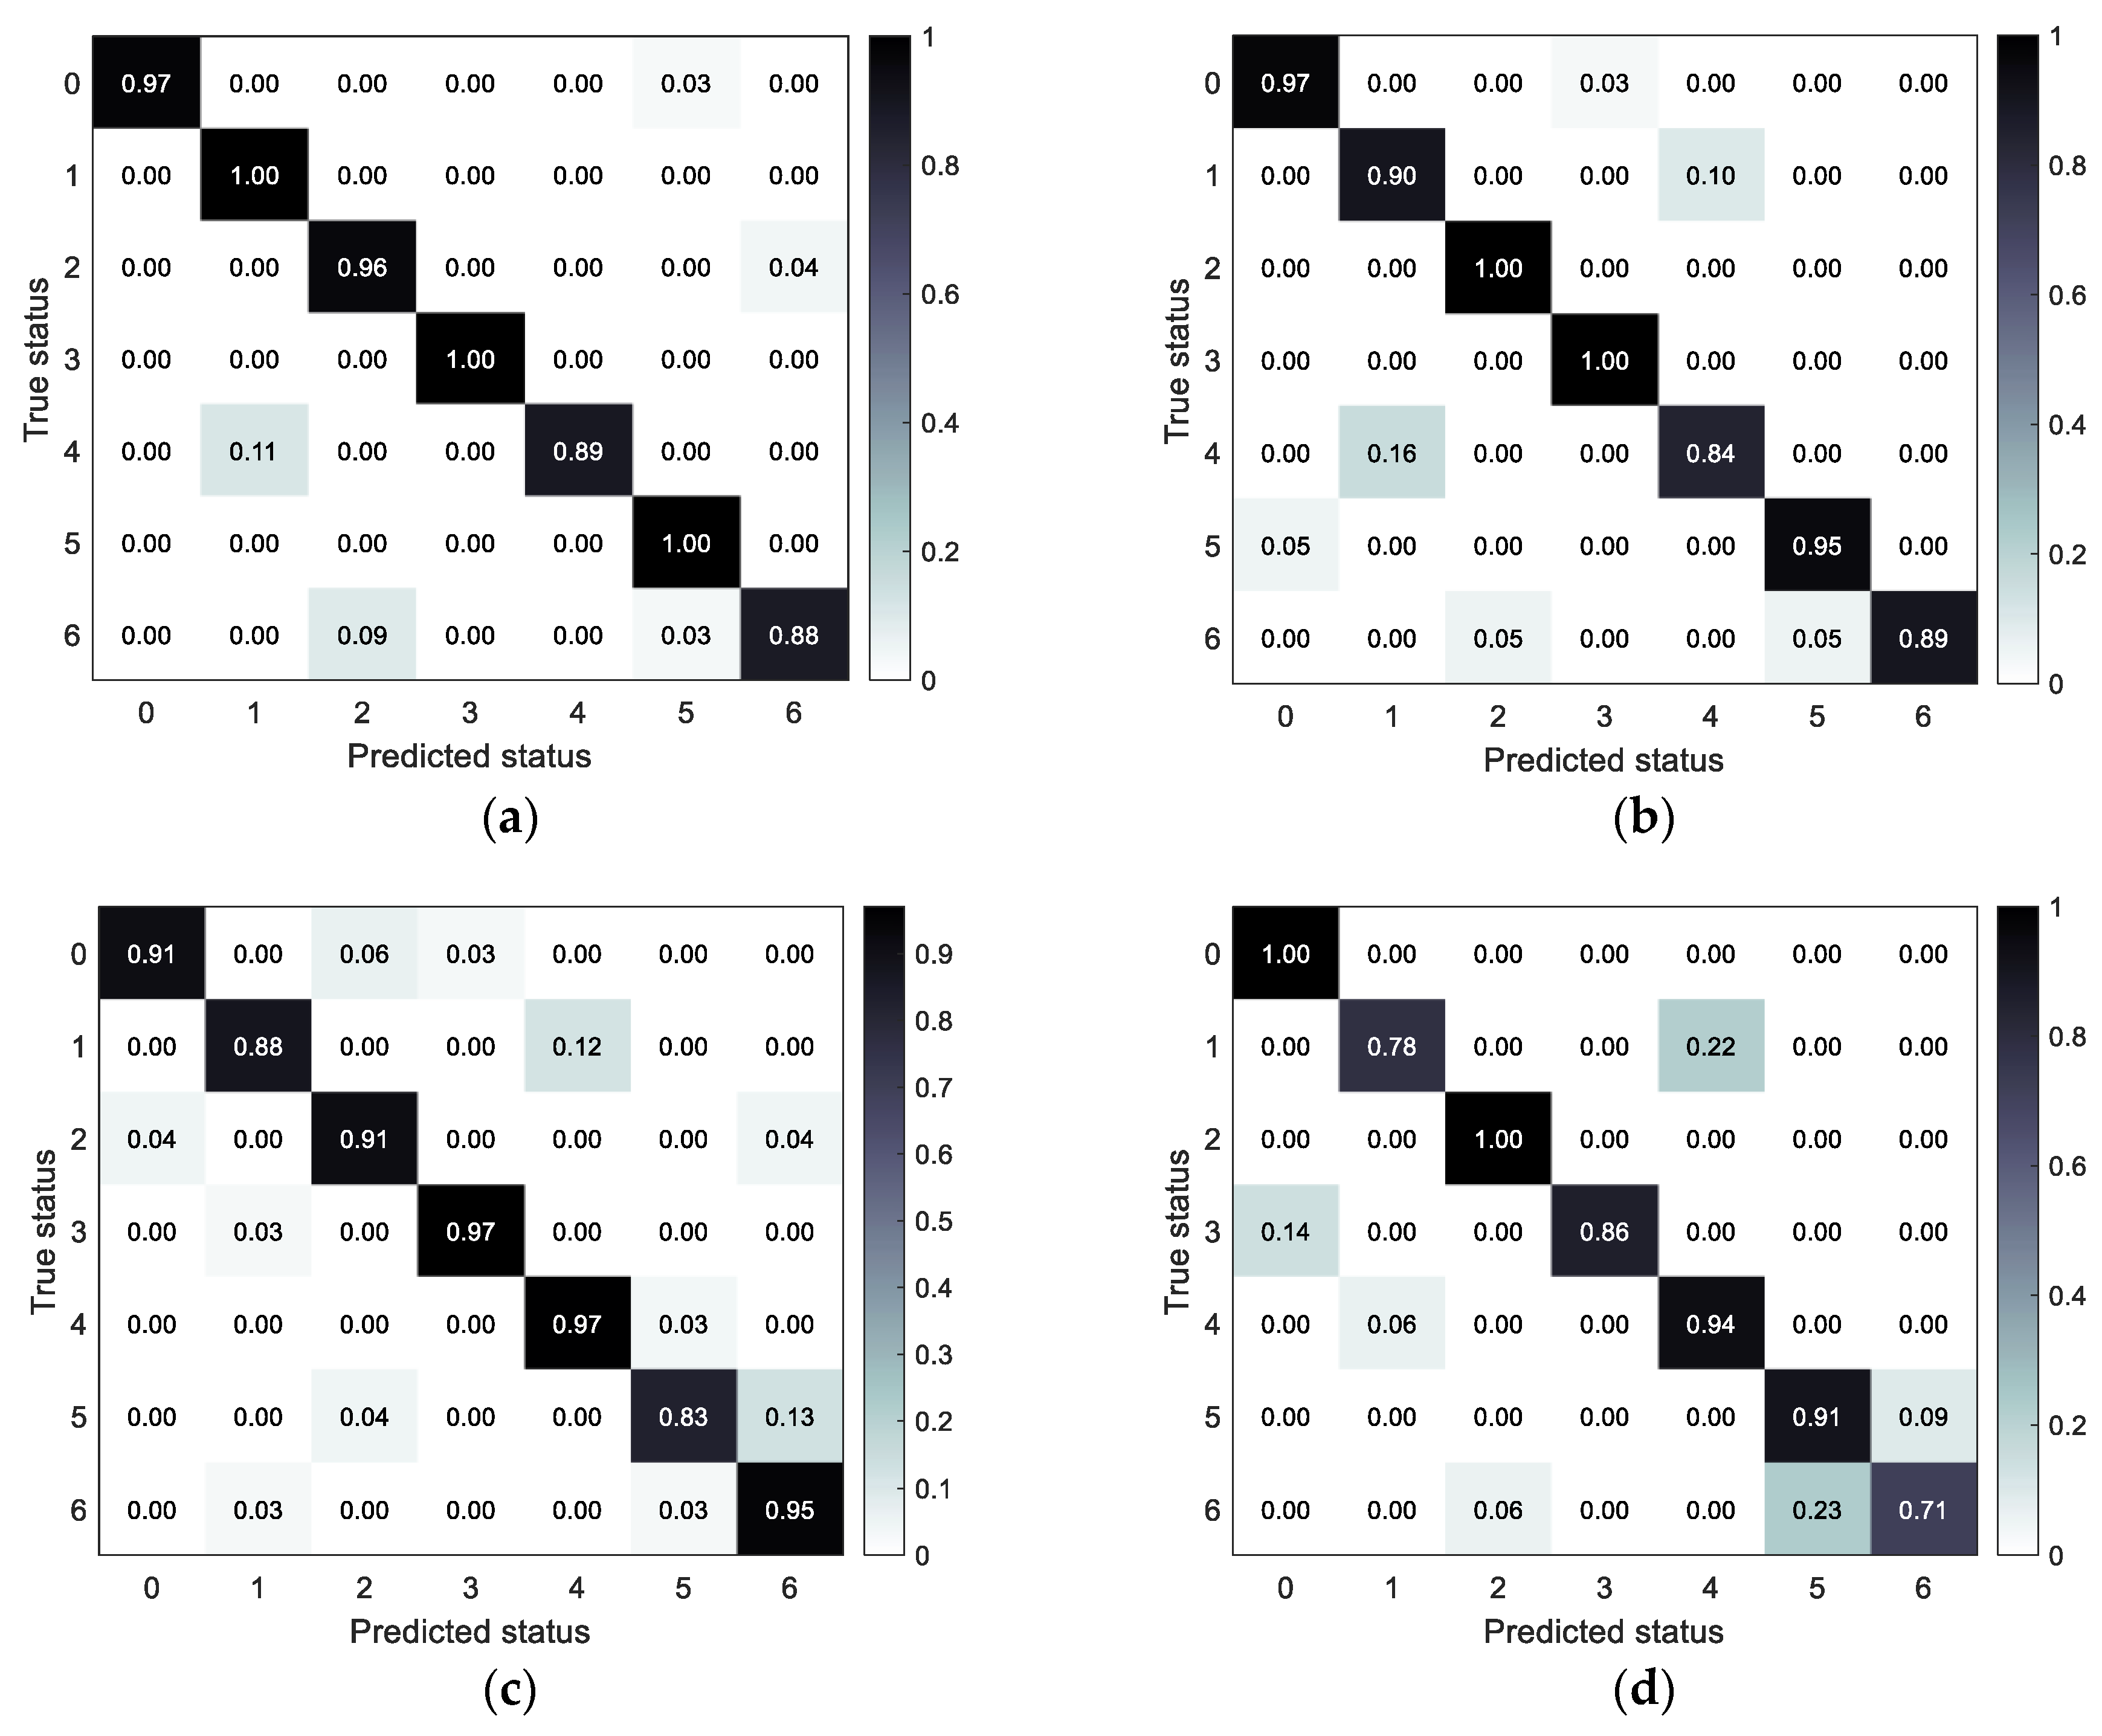
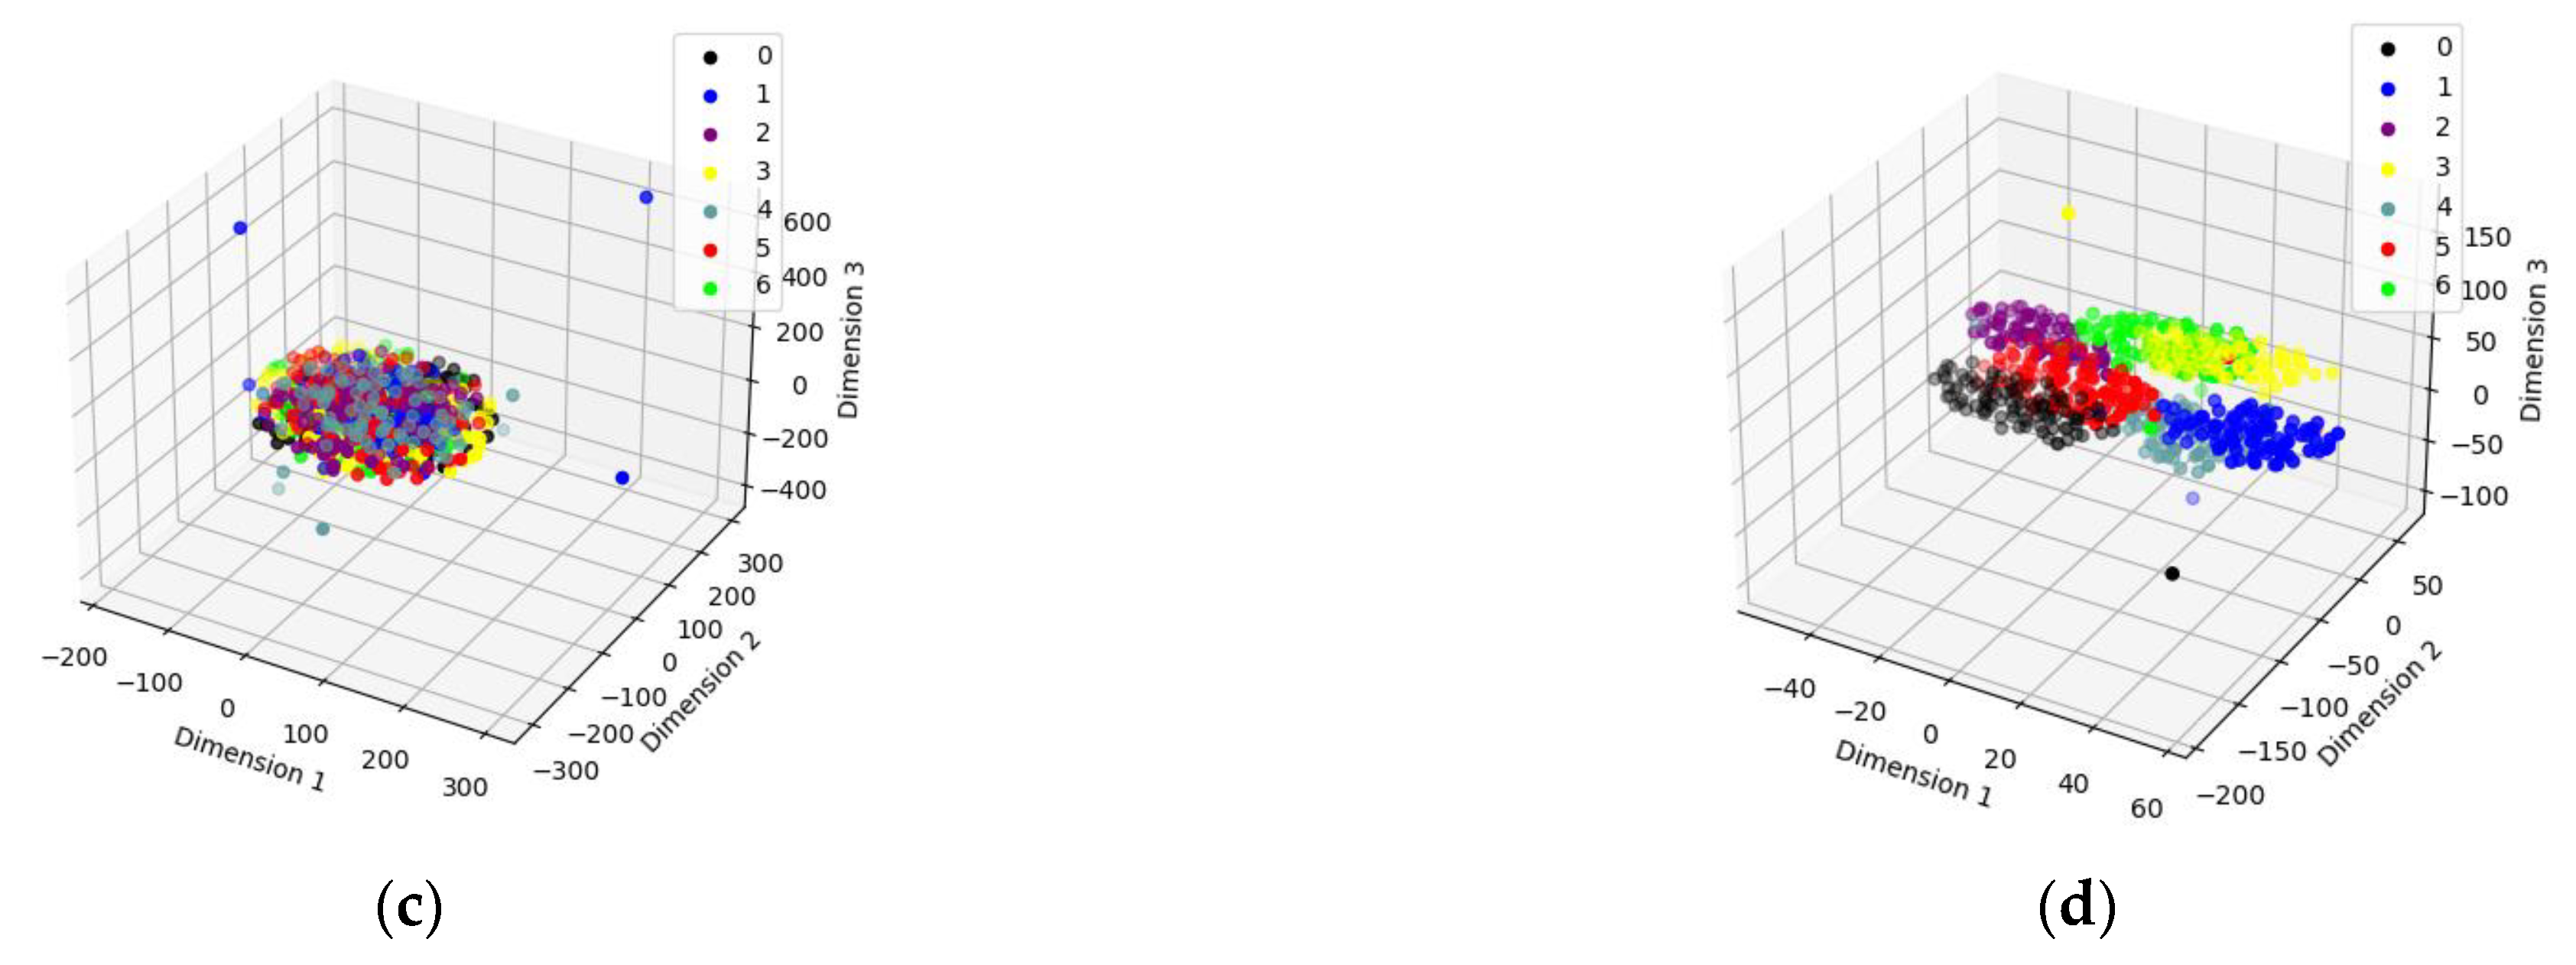
- The original diesel engine vibration signal is represented as a time-frequency image by SSST, and the dependence of the vibration signal on time is mapped into the image feature space, so that the original feature information is retained in the time-frequency map as much as possible. Then, after applying the powerful learning ability of ViT to automatically extract the temporal and spatial features in the images, the fault status identification is completed.
- (3)
- The feasibility and effectiveness of the proposed diesel engine status recognition method is verified by means of public datasets and actual laboratory measurements.
2. Diesel Engine Fault Status Identification Method
2.1. Synchro Squeezing S-Transform
2.2. Vision Transformer Network Model
2.3. Diesel Engine State Identification Based on SSST-ViT
3. Experimental Results and Comparative Analysis
3.1. CWRU Dataset to Verify the Feasibility of SSST-ViT Method
3.2. The Validity of the SSST-ViT Method Is Verified by the Measured Data
4. Conclusions
- (1)
- SSST combines the high time-frequency aggregation of SST and the adaptive nature of ST, with better time-frequency aggregation and resolution.
- (2)
- The method is the first to apply SSST, which can effectively characterize the original signal features, and the ViT model, which has excellent image classification capability, to the field of diesel engine fault status identification, and can effectively extract time-frequency image features.
- (3)
- The method can provide theoretical and technical support for the research of diesel engine fault status recognition, which is of great military significance and realistic demand for improving the reliability and maintenance support capability of diesel engines.
Author Contributions
Funding
Institutional Review Board Statement
Informed Consent Statement
Data Availability Statement
Conflicts of Interest
References
- Ke, Y.; Song, E.Z.; Yao, C.; Dong, Q. A review: Ship diesel engine prognostics and health management technology. J. Harbin Eng. Univ. 2020, 41, 125–131. [Google Scholar] [CrossRef]
- Li, Y.F.; Han, T. Deep learning based industrial equipment prognostics and health management: A review. J. Vib. Meas. Diagn. 2022, 42, 835–847. [Google Scholar] [CrossRef]
- Jiang, Z.N.; Wang, Z.J.; Zhang, J.J.; Huang, Y.F.; Mao, Z.W. Fault diagnosis method of EDG in nuclear power plants based on energy operator gradient neighborhood feature extraction. Chin. Mech. Eng. 2021, 32, 617–623. [Google Scholar] [CrossRef]
- Liu, Z.; Zhang, C.; Dong, E.; Wang, R.; Li, S.; Han, Y. Research Progress and Development Trend of Prognostics and Health Management Key Technologies for Equipment Diesel Engine. Processes 2023, 11, 1972. [Google Scholar] [CrossRef]
- Li, X.D. Research on Fault Diagnosis of Rotating Components Based on Deep Learning. Ph.D. Thesis, University of Chinese Academy of Sciences, Beijing, China, 2021. [Google Scholar] [CrossRef]
- Liu, Z.; Bai, Y.S.; Li, S.Y.; Zhang, K.; Liu, M.; Jia, X.S. Assessment of diesel engine valve performance degradation status based on synchro extracting enhanced generalized S-transform. Acta Armamentarii 2023, in press. Available online: http://kns.cnki.net/kcms/detail/11.2176.tj.20230629.1006.008.html (accessed on 12 July 2023).
- He, Z.Y.; Shao, H.D.; Zhong, X.; Yang, Y.; Cheng, J.S. An intelligent fault diagnosis method for rotor-bearing system using small labeled infrared thermal images and enhanced CNN transferred from CAE. Adv. Eng. Inform. 2020, 46, 101150. [Google Scholar] [CrossRef]
- Cai, Y.P.; Xu, G.H.; Zhang, H.; Fan, Y.; Li, A.H. Visual identification and diagnosis based on IC engine vibration signals. J. Vib. Shock 2019, 38, 150–157. [Google Scholar] [CrossRef]
- Wei, K.Z. Research on Assessment Method of Diesel Engine Health Condition Based on Multi-Parameter Fusion. Master’s Thesis, Beijing University of Chemical Technology, Beijing, China, 2019. [Google Scholar] [CrossRef]
- Ke, Y.; Hu, Y.H.; Song, E.Z.; Yao, C.; Dong, Q. A method for degradation features extraction of diesel engine valve clearance based on modified complete ensemble empirical mode decomposition with adaptive noise and discriminant correlation analysis feature fusion. J. Vib. Control 2022, 28, 2570–2584. [Google Scholar] [CrossRef]
- Liu, Y.S.; Kang, J.S.; Guo, C.M.; Bai, Y.J. Diesel engine small-sample transfer learning fault diagnosis algorithm based on STFT time–frequency image and hyperparameter autonomous optimization deep convolutional network improved by PSO–GWO–BPNN surrogate model. Open Phys. 2022, 20, 993–1018. [Google Scholar] [CrossRef]
- Xi, W.K.; Li, Z.X.; Tian, Z.; Duan, Z.H. A feature extraction and visualization method for fault detection of marine diesel engines. Measurement 2018, 116, 429–437. [Google Scholar] [CrossRef]
- Shen, H.; Zeng, R.L.; Yang, W.C.; Zhou, B.; Ma, W.P.; Zhang, L.L. Diesel engine fault diagnosis based on polar coordinate enhancement of time-frequency diagram. J. Vib. Meas. Diagn. 2018, 38, 27–33. [Google Scholar] [CrossRef]
- Mu, W.J.; Shi, L.S.; Cai, Y.P.; Zheng, Y.; Liu, H. Diesel engine fault diagnosis based on the global and local features fusion of time-frequency image. J. Vib. Shock 2018, 37, 14–19. [Google Scholar] [CrossRef]
- Zhao, Z.H.; Li, L.H.; Yang, S.P.; Zhao, J.J. Denoising method of stacked denoising auto-encoder for vibration signal. J. Vib. Meas. Diagn. 2022, 42, 315–321. [Google Scholar] [CrossRef]
- He, X.Z.; Zhou, X.Q.; Yu, W.N.; Hou, Y.X.; Mechefske, C.K. Adaptive variational mode decomposition and its application to multi-fault detection using mechanical vibration signals. ISA Trans. 2021, 111, 360–375. [Google Scholar] [CrossRef]
- Chen, Y.C. Health Assessment for Marine Medium-Speed Diesel Engine Based on Instantaneous Speed. Master’s Thesis, Wuhan University of Technology, Wuhan, China, 2020. [Google Scholar] [CrossRef]
- Bai, Y.J.; Jia, X.S.; Liang, Q.H.; Bai, Y.S. Evaluation of diesel engine valve health status based on deep learning. Sci. Technol. Eng. 2022, 22, 3941–3950. [Google Scholar]
- Jiang, Z.; Lai, Y.; Zhang, J.; Zhao, H.; Mao, Z. Multi-Factor Operating Condition Recognition Using 1D Convolutional Long Short-Term Network. Sensors 2019, 19, 5488. [Google Scholar] [CrossRef]
- Zhan, X.; Bai, H.; Yan, H.; Wang, R.; Guo, C.; Jia, X. Diesel Engine Fault Diagnosis Method Based on Optimized VMD and Improved CNN. Processes 2022, 10, 2162. [Google Scholar] [CrossRef]
- Chen, S.; Lu, S.; Wang, S.; Ni, Y.; Zhang, Y. Shifted Window Vision Transformer for Blood Cell Classification. Electronics 2023, 12, 2442. [Google Scholar] [CrossRef]
- Zhu, X.; Jia, Y.; Jian, S.; Gu, L.; Pu, Z. ViTT: Vision Transformer Tracker. Sensors 2021, 21, 5608. [Google Scholar] [CrossRef]
- Xu, Y.G.; Deng, Y.J.; Zhao, J.Y.; Tian, W.K.; Ma, C.Y. A novel rolling bearing fault diagnosis method based on empirical wavelet transform and spectral trend. IEEE Trans. Instrum. Meas. 2020, 69, 2891–2904. [Google Scholar] [CrossRef]
- Sandoval, S.; De Leon, P.L. Recasting the (Synchrosqueezed) Short-Time Fourier Transform as an Instantaneous Spectrum. Entropy 2022, 24, 518. [Google Scholar] [CrossRef] [PubMed]
- Zhou, J. Research on the Intelligent Diagnosis Method of Rolling Bearing Faults Based on CYCBD and HRE. Master’s Thesis, North University of China, Taiyuan, China, 2020. [Google Scholar] [CrossRef]
- Lai, D.K.-H.; Yu, Z.-H.; Leung, T.Y.-N.; Lim, H.-J.; Tam, A.Y.-C.; So, B.P.-H.; Mao, Y.-J.; Cheung, D.S.K.; Wong, D.W.-C.; Cheung, J.C.-W. Vision Transformers (ViT) for Blanket-Penetrating Sleep Posture Recognition Using a Triple Ultra-Wideband (UWB) Radar System. Sensors 2023, 23, 2475. [Google Scholar] [CrossRef] [PubMed]
- Sonain, J.; Arunabha, M.R. An efficient and robust Phonocardiography (PCG)-based Valvular Heart Diseases (VHD) detection framework using Vision Transformer (ViT). IEEE Comput. Biol. Med. 2023, 158, 106734. [Google Scholar] [CrossRef]
- Cheng, Z.Y.; Wang, R.J. Enhanced symplectic characteristics mode decomposition method and its application in fault diagnosis of rolling bearing. Measurement 2020, 166, 108108. [Google Scholar] [CrossRef]
- Ma, R.Z. Research on Wear Diagnosis of Piston-Cylinder Based on Block Surface Vibration Signal. Master’s Thesis, Shandong University, Jinan, China, 2022. [Google Scholar] [CrossRef]
- Bi, X.Y. Research on Intelligent Diagnosis Methods for Typical Diesel Engine Faults Based on Analytic Single Channel Vibration Signals. Ph.D. Thesis, Tianjin University, Tianjin, China, 2019. [Google Scholar] [CrossRef]
- Du, K.N.; Ning, S.H.; Deng, G.Y. Intelligent fault diagnosis of rolling bearings based on Vision Transformer. Modul. Mach. Tool Autom. Manuf. Tech. 2023, 4, 96–99. [Google Scholar]
- Liao, Y.C.; Zhao, J.H.; An, S.J.; Zhou, L. Fault diagnosis of abnormal diesel engine fuel supply advance angle based on 2DCNN. J. Ordnance Equip. Eng. 2021, 42, 250–255. [Google Scholar]
- Bai, Y.J.; Jia, X.S.; Liang, Q.H.; Ma, Y.F.; Bai, H.J. Diesel engine fault diagnosis based on one-dimensional convolutional neural network and dual-channel information fusion. Veh. Engine 2021, 6, 76–81. [Google Scholar]






| Serial Number | Fault Location | Fault Diameter (mm) | Load (hp) | Rotational Speed (r/min) |
|---|---|---|---|---|
| 1 | Normal | — | 0 | 1797 |
| 2 | Inner ring failure | 0.1778 | 0 | 1797 |
| 3 | Inner ring failure | 0.3556 | 0 | 1797 |
| 4 | Inner ring failure | 0.5443 | 0 | 1797 |
| 5 | Outer ring failure | 0.1778 | 0 | 1797 |
| 6 | Outer ring failure | 0.3556 | 0 | 1797 |
| 7 | Outer ring failure | 0.5443 | 0 | 1797 |
| 8 | Rolling body failure | 0.1778 | 0 | 1797 |
| 9 | Rolling body failure | 0.3556 | 0 | 1797 |
| 10 | Rolling body failure | 0.5443 | 0 | 1797 |
| Models | Accuracy/ (%) | Loss Value | ||
|---|---|---|---|---|
| Training Set | Validation Set | Training Set | Validation Set | |
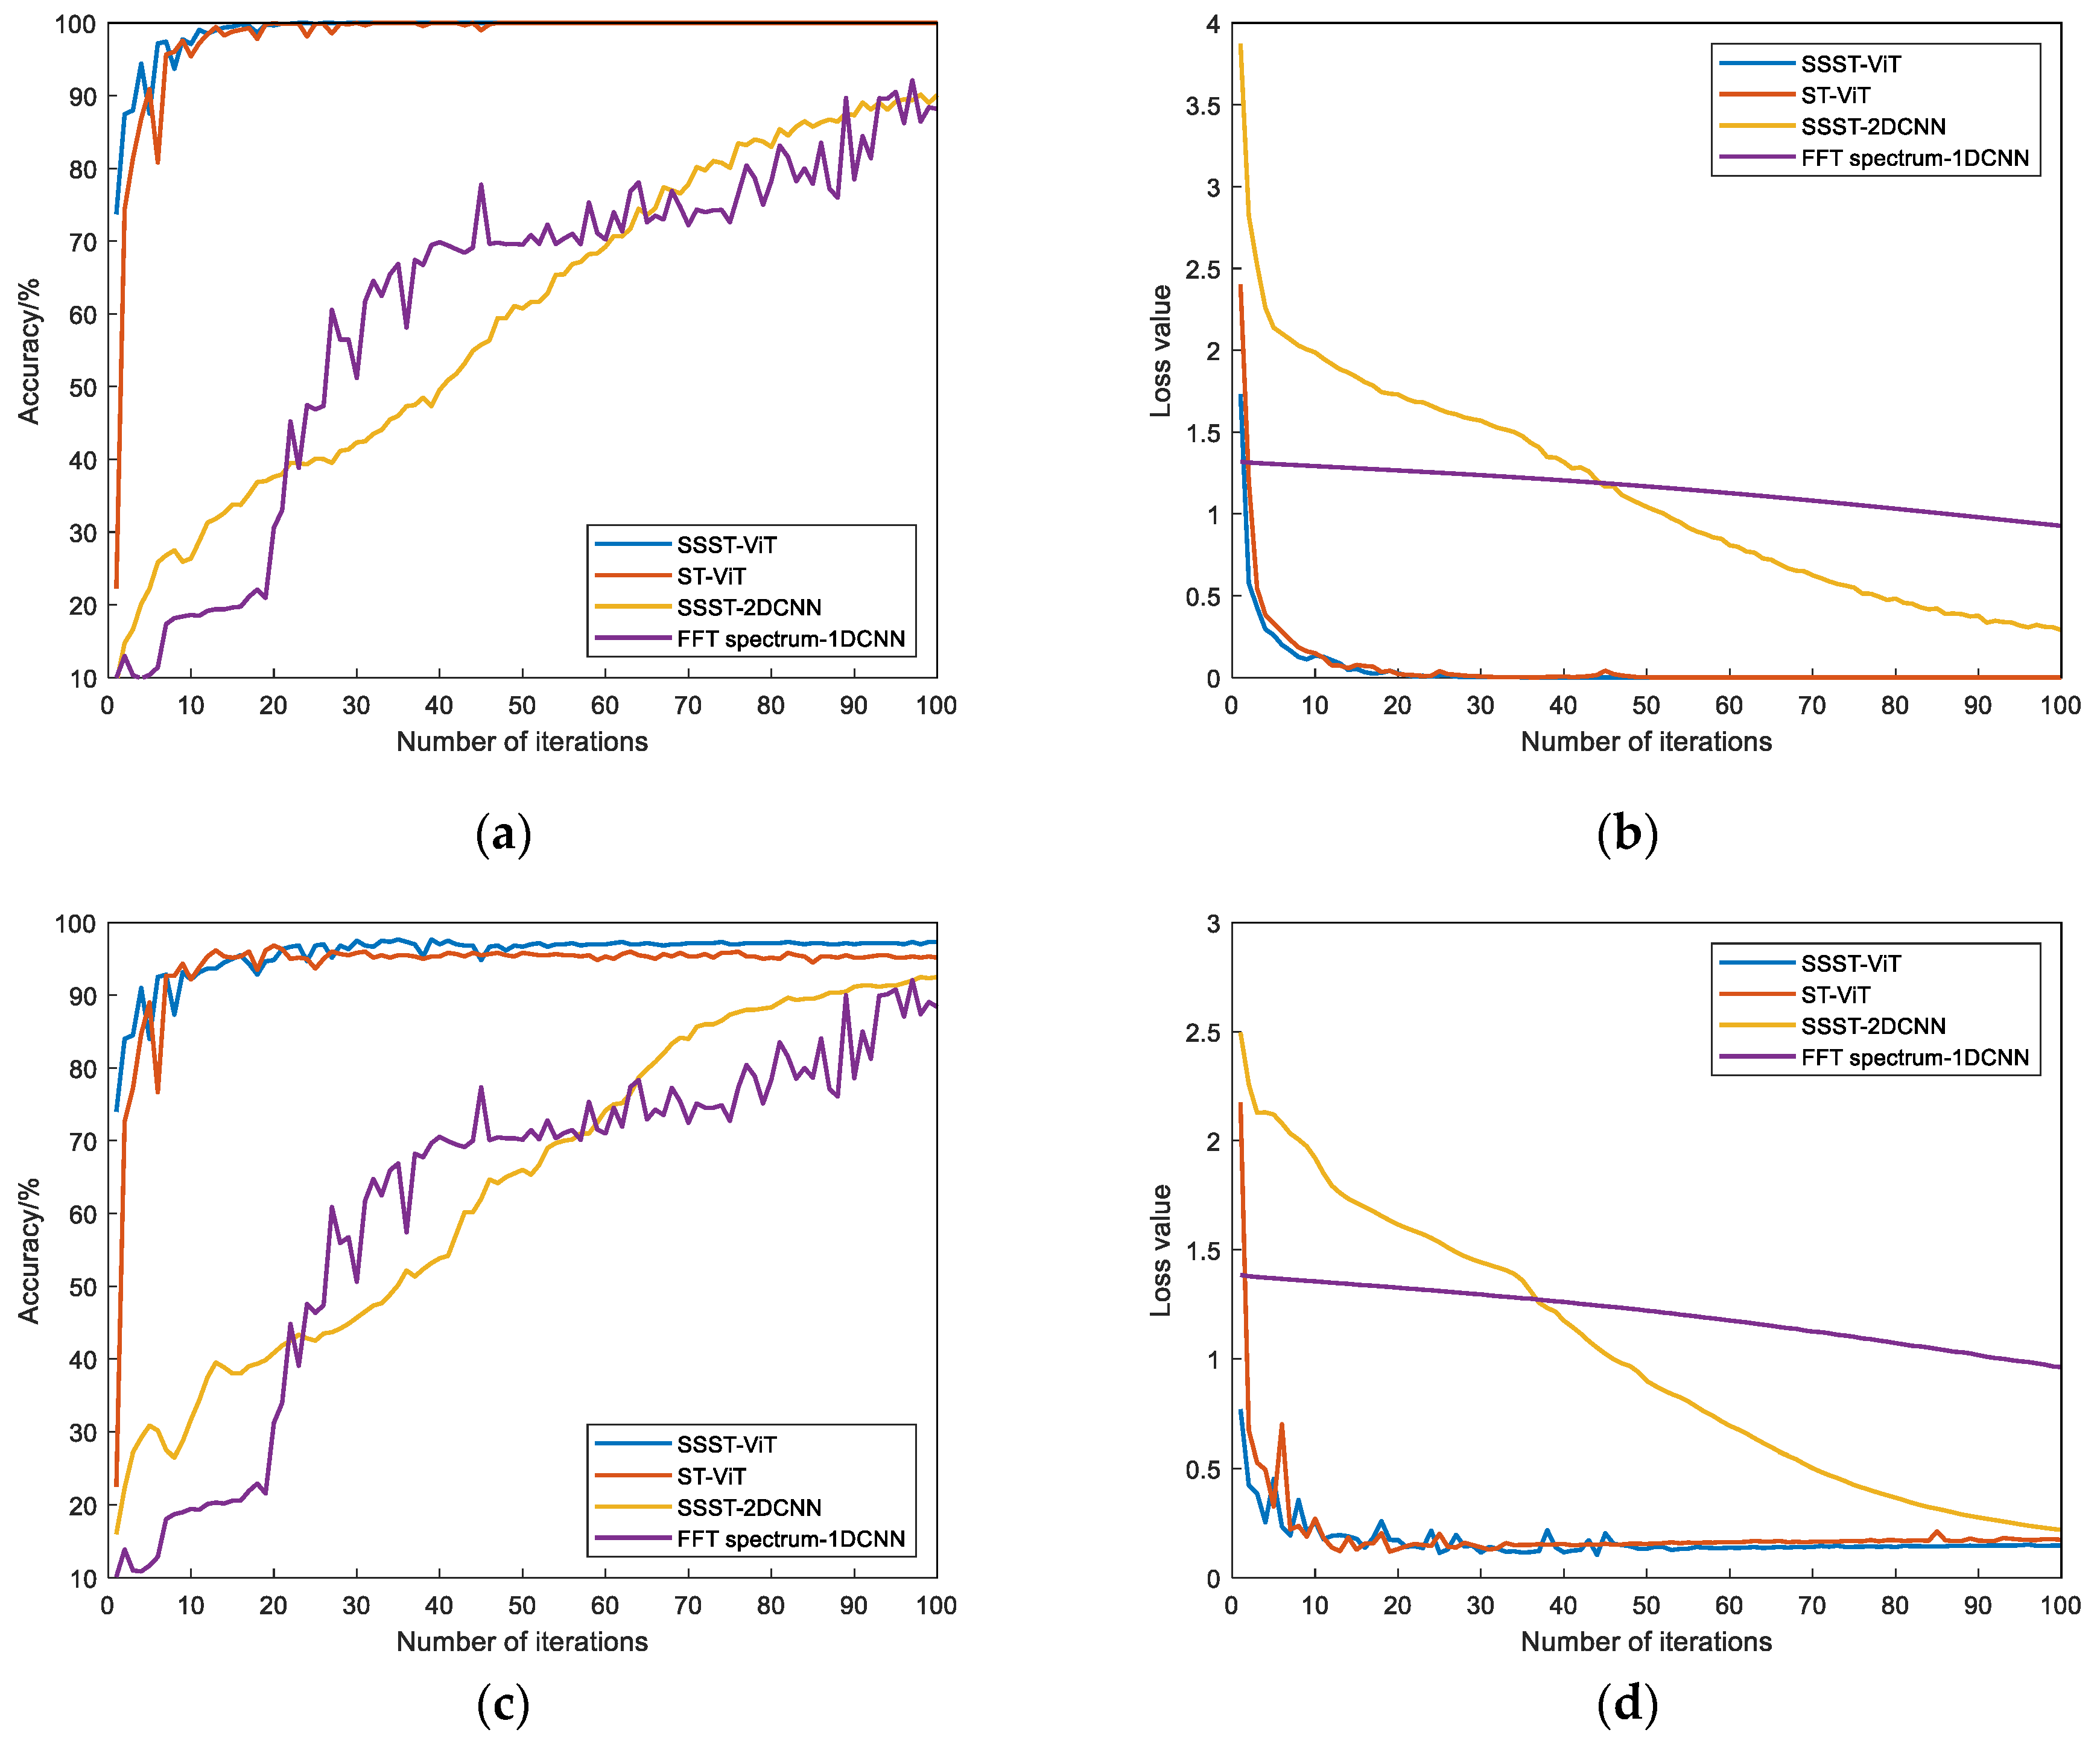
| Model 1 | 100.00 | 97.33 | 2.08 × 10⁻⁴ | 1.47 × 10⁻¹ |
| Model 2 | 100.00 | 95.17 | 2.27 × 10⁻⁴ | 1.74 × 10⁻¹ |
| Model 3 | 90.09 | 92.50 | 2.89 × 10⁻¹ | 2.19 × 10⁻¹ |
| Model 4 | 88.17 | 88.40 | 9.27 × 10⁻¹ | 9.62 × 10⁻¹ |
| Models | Accuracy |
|---|---|
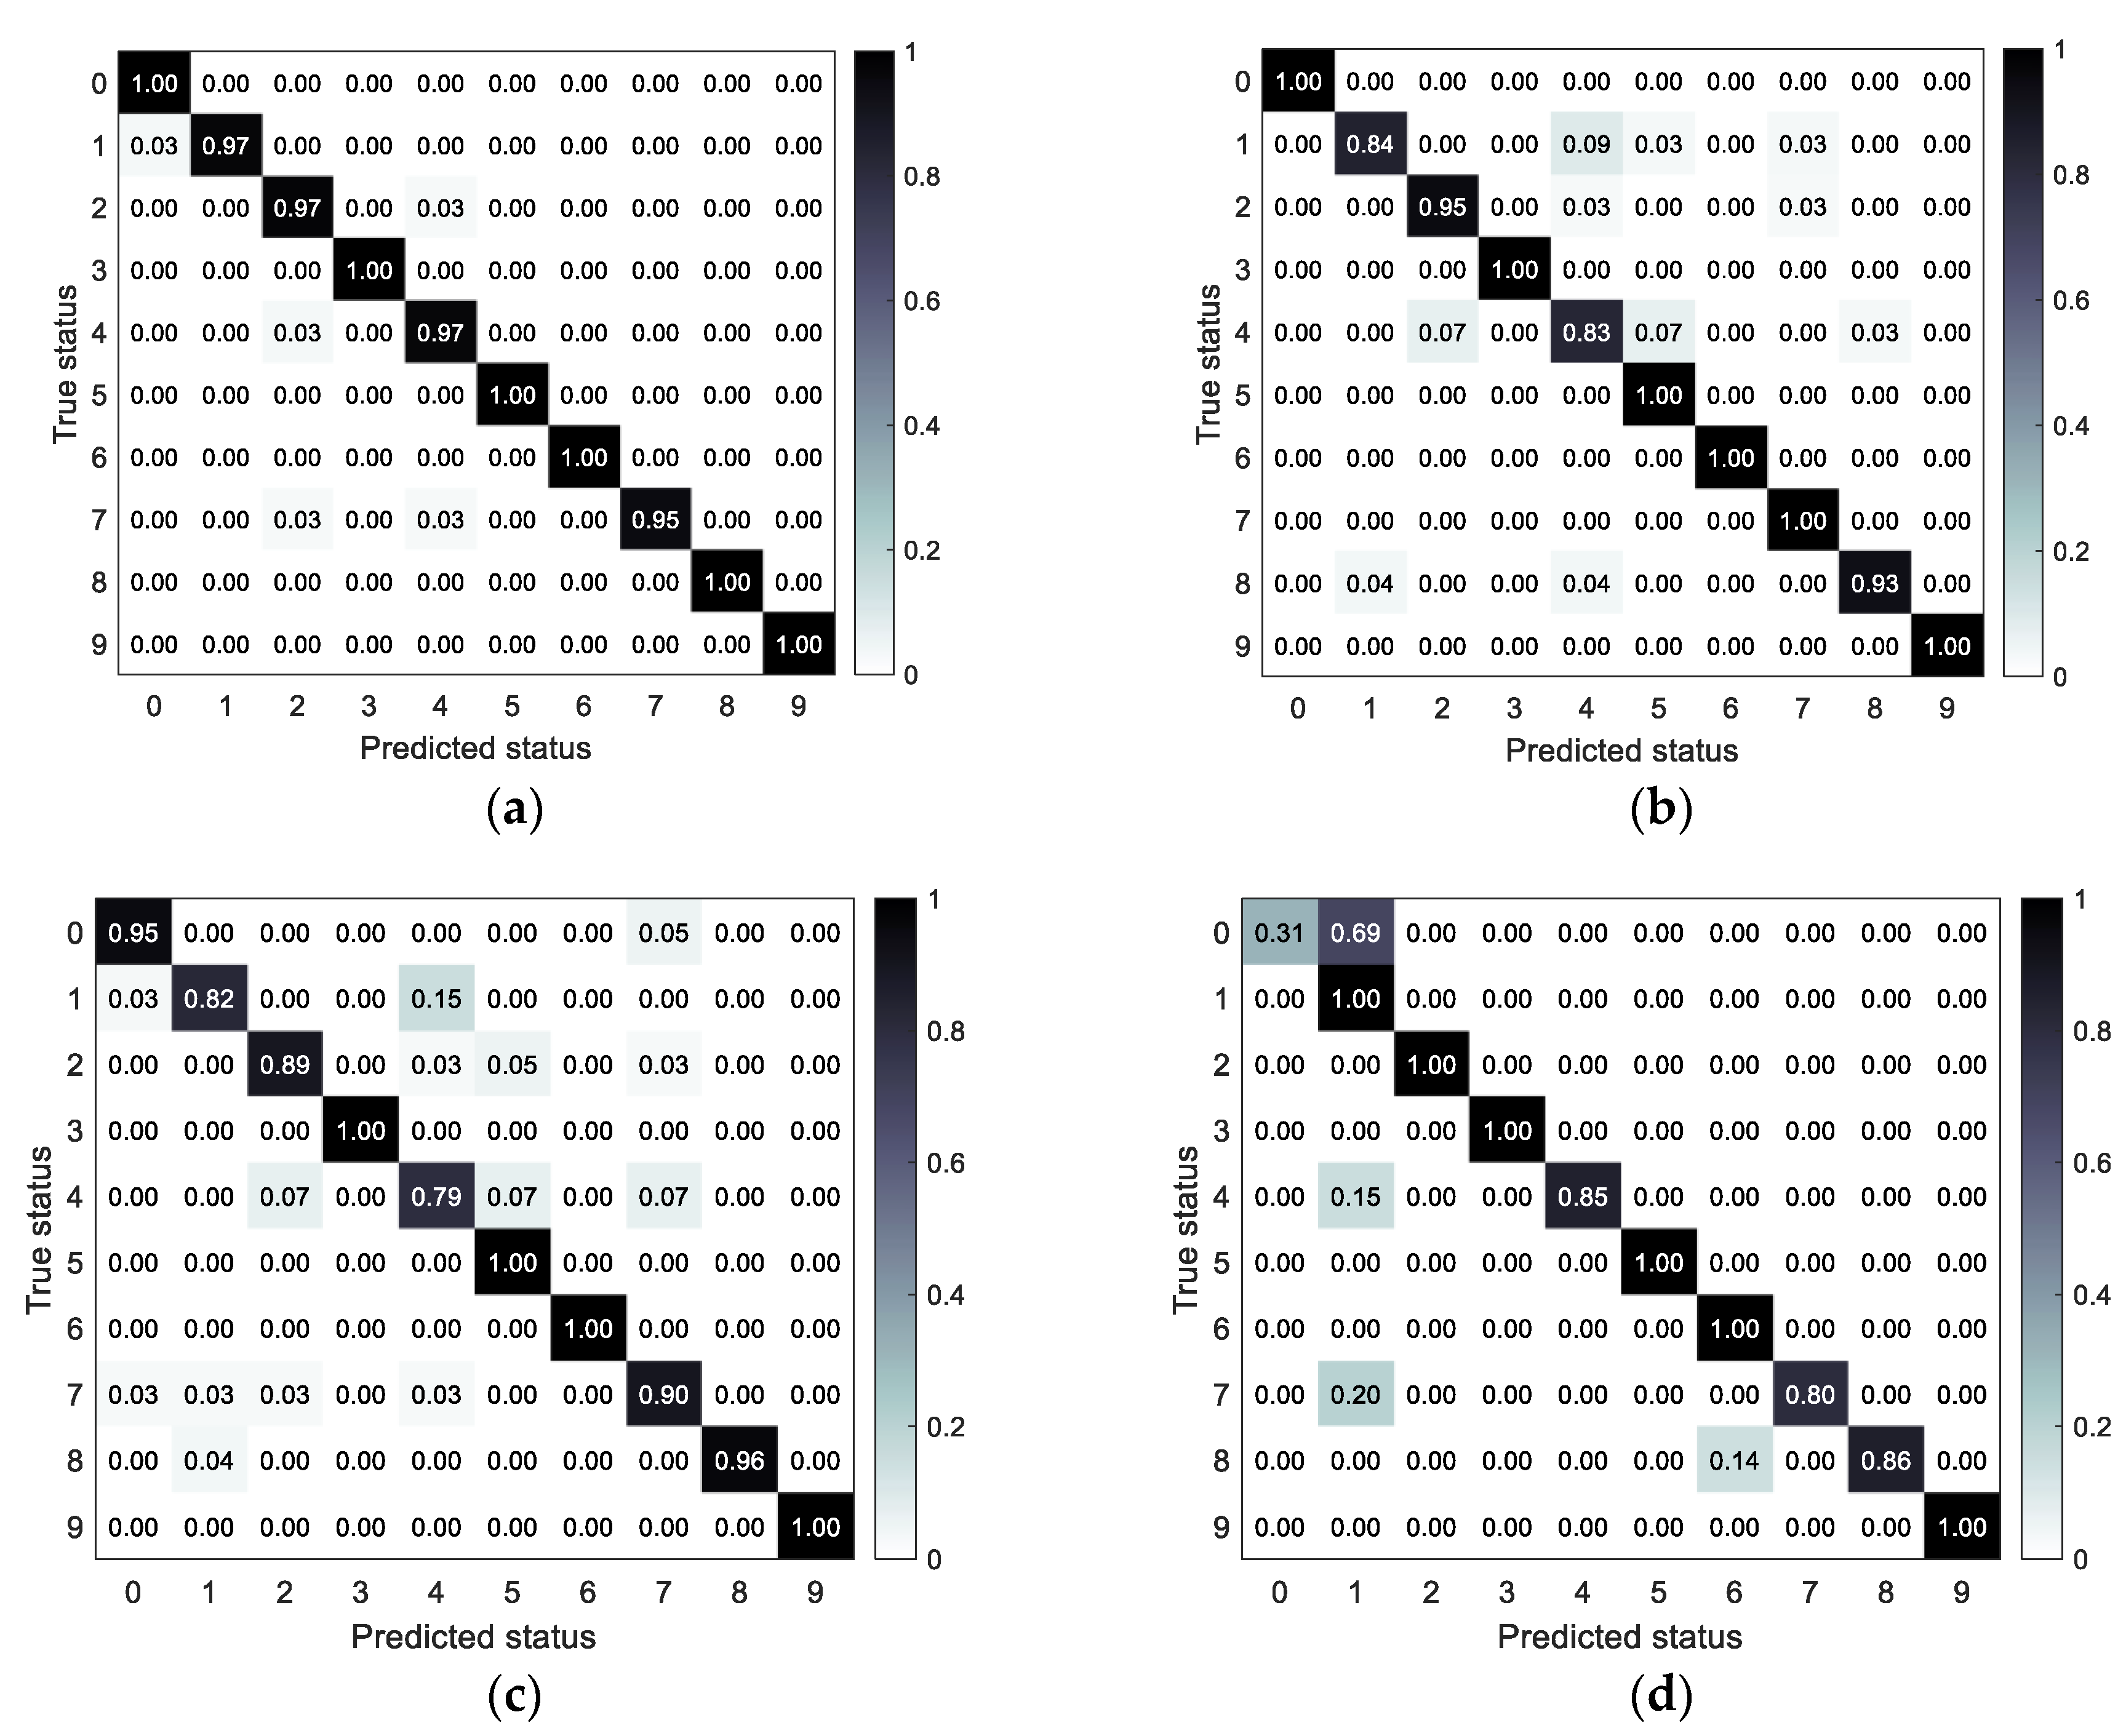
| SSST-ViT | 98.31% |
| ST-ViT | 95.27% |
| SSST-2DCNN | 92.33% |
| FFT spectrum-1DCNN | 88.50% |
| Serial Number | Failure Mode |
|---|---|
| 1 | Normal |
| 2 | Fire in the first cylinder |
| 3 | Second cylinder fire |
| 4 | Clogged air filter |
| 5 | First cylinder and second cylinder misfire |
| 6 | Clogged air filter and first cylinder misfire |
| 7 | Clogged air filter and second cylinder misfire |
| Models | Accuracy/ (%) | Loss Value | ||
|---|---|---|---|---|
| Training Set | Validation Set | Training Set | Validation Set | |
| Model 1 | 99.86 | 95.43 | 6.46 × 10⁻² | 1.69 × 10⁻¹ |
| Model 2 | 96.70 | 91.47 | 4.10 × 10⁻² | 2.53 × 10⁻¹ |
| Model 3 | 92.00 | 93.33 | 2.48 × 10⁻¹ | 2.25 × 10⁻¹ |
| Model 4 | 90.68 | 88.33 | 9.85 × 10⁻¹ | 1.29 |
| Models | Accuracy |
|---|---|
| SSST-ViT | 95.67% |
| ST-ViT | 94.23% |
| SSST-2DCNN | 91.90% |
| FFT spectrum-1DCNN | 87.62% |
Disclaimer/Publisher’s Note: The statements, opinions and data contained in all publications are solely those of the individual author(s) and contributor(s) and not of MDPI and/or the editor(s). MDPI and/or the editor(s) disclaim responsibility for any injury to people or property resulting from any ideas, methods, instructions or products referred to in the content. |
© 2023 by the authors. Licensee MDPI, Basel, Switzerland. This article is an open access article distributed under the terms and conditions of the Creative Commons Attribution (CC BY) license (https://creativecommons.org/licenses/by/4.0/).
Share and Cite
Li, S.; Liu, Z.; Yan, Y.; Wang, R.; Dong, E.; Cheng, Z. Research on Diesel Engine Fault Status Identification Method Based on Synchro Squeezing S-Transform and Vision Transformer. Sensors 2023, 23, 6447. https://doi.org/10.3390/s23146447
Li S, Liu Z, Yan Y, Wang R, Dong E, Cheng Z. Research on Diesel Engine Fault Status Identification Method Based on Synchro Squeezing S-Transform and Vision Transformer. Sensors. 2023; 23(14):6447. https://doi.org/10.3390/s23146447
Chicago/Turabian StyleLi, Siyu, Zichang Liu, Yunbin Yan, Rongcai Wang, Enzhi Dong, and Zhonghua Cheng. 2023. "Research on Diesel Engine Fault Status Identification Method Based on Synchro Squeezing S-Transform and Vision Transformer" Sensors 23, no. 14: 6447. https://doi.org/10.3390/s23146447
APA StyleLi, S., Liu, Z., Yan, Y., Wang, R., Dong, E., & Cheng, Z. (2023). Research on Diesel Engine Fault Status Identification Method Based on Synchro Squeezing S-Transform and Vision Transformer. Sensors, 23(14), 6447. https://doi.org/10.3390/s23146447


