

Aromatic Fingerprints: VOC Analysis with E-Nose and GC-MS for Rapid Detection of Adulteration in Sesame Oil


 ,
,  and
and 
Abstract
1. Introduction
2. Materials and Methods
2.1. Sample Preparation
2.2. Olfactory Machine (Electronic Nose)
2.3. Data Preprocessing Prior to Feature Extraction
2.4. Data Analysis Method
2.5. Chemical Analysis of Oil Samples
2.6. Model Evaluation Metrics
3. Results
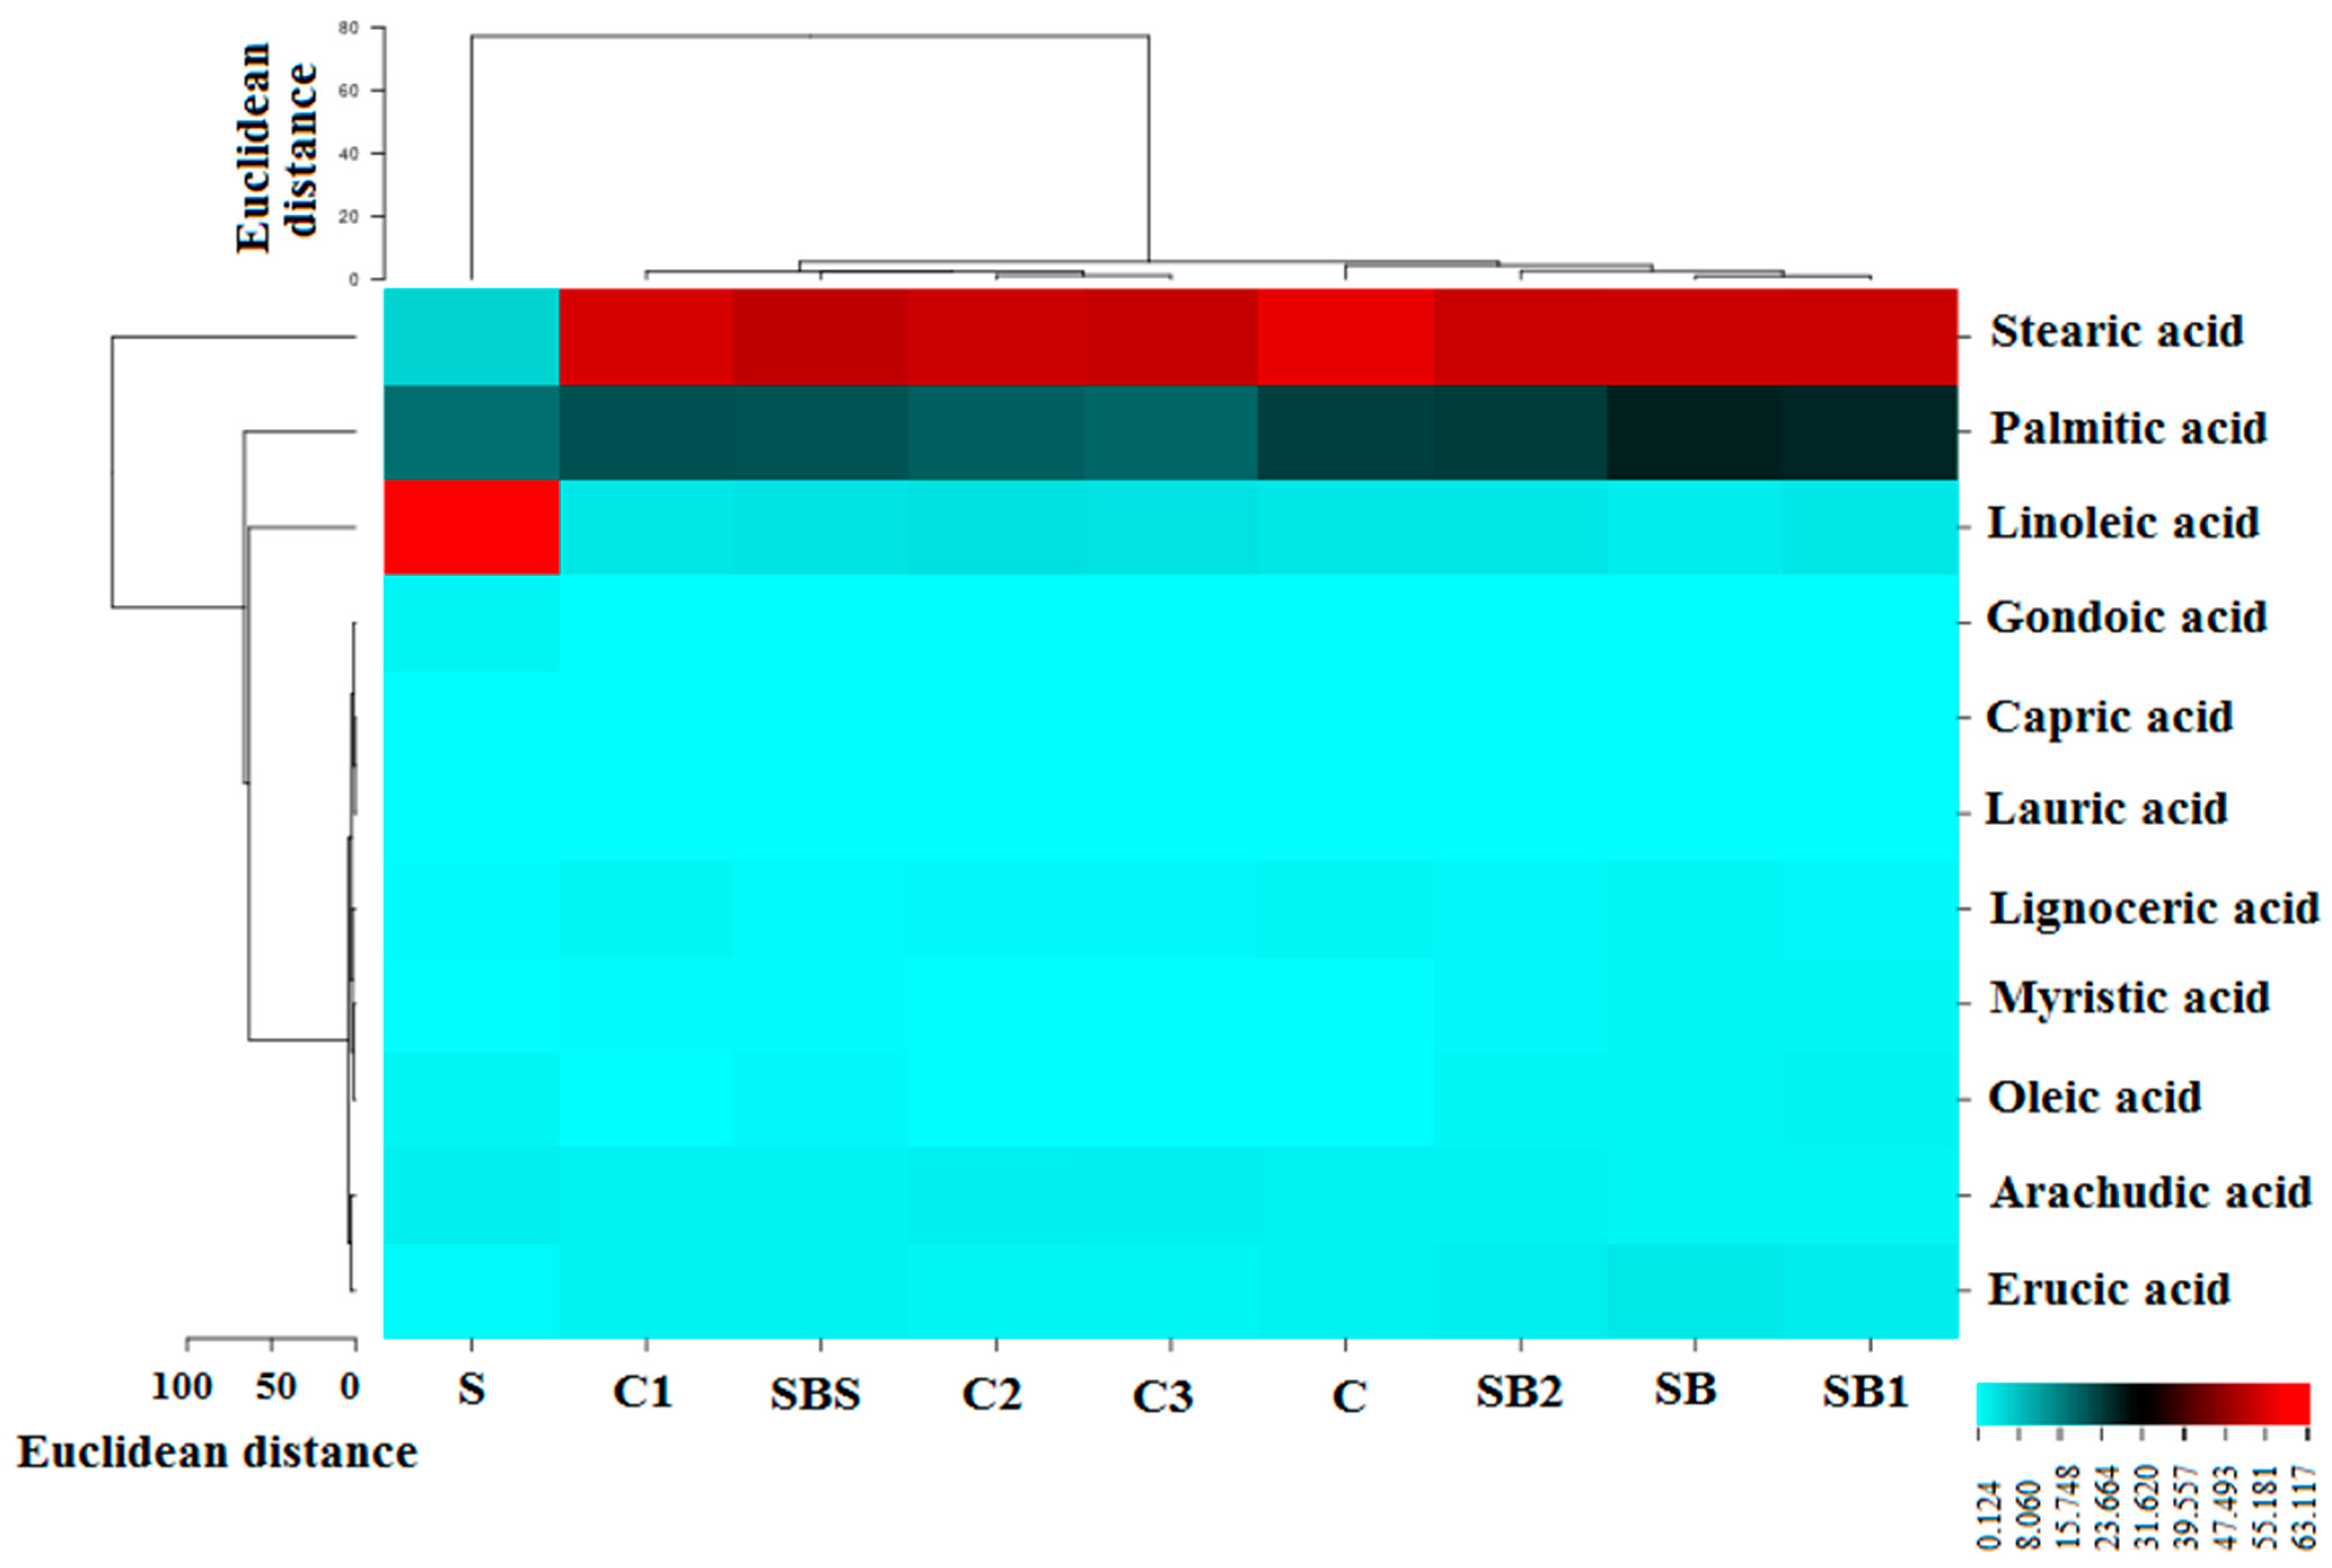
3.1. GC-MS Results
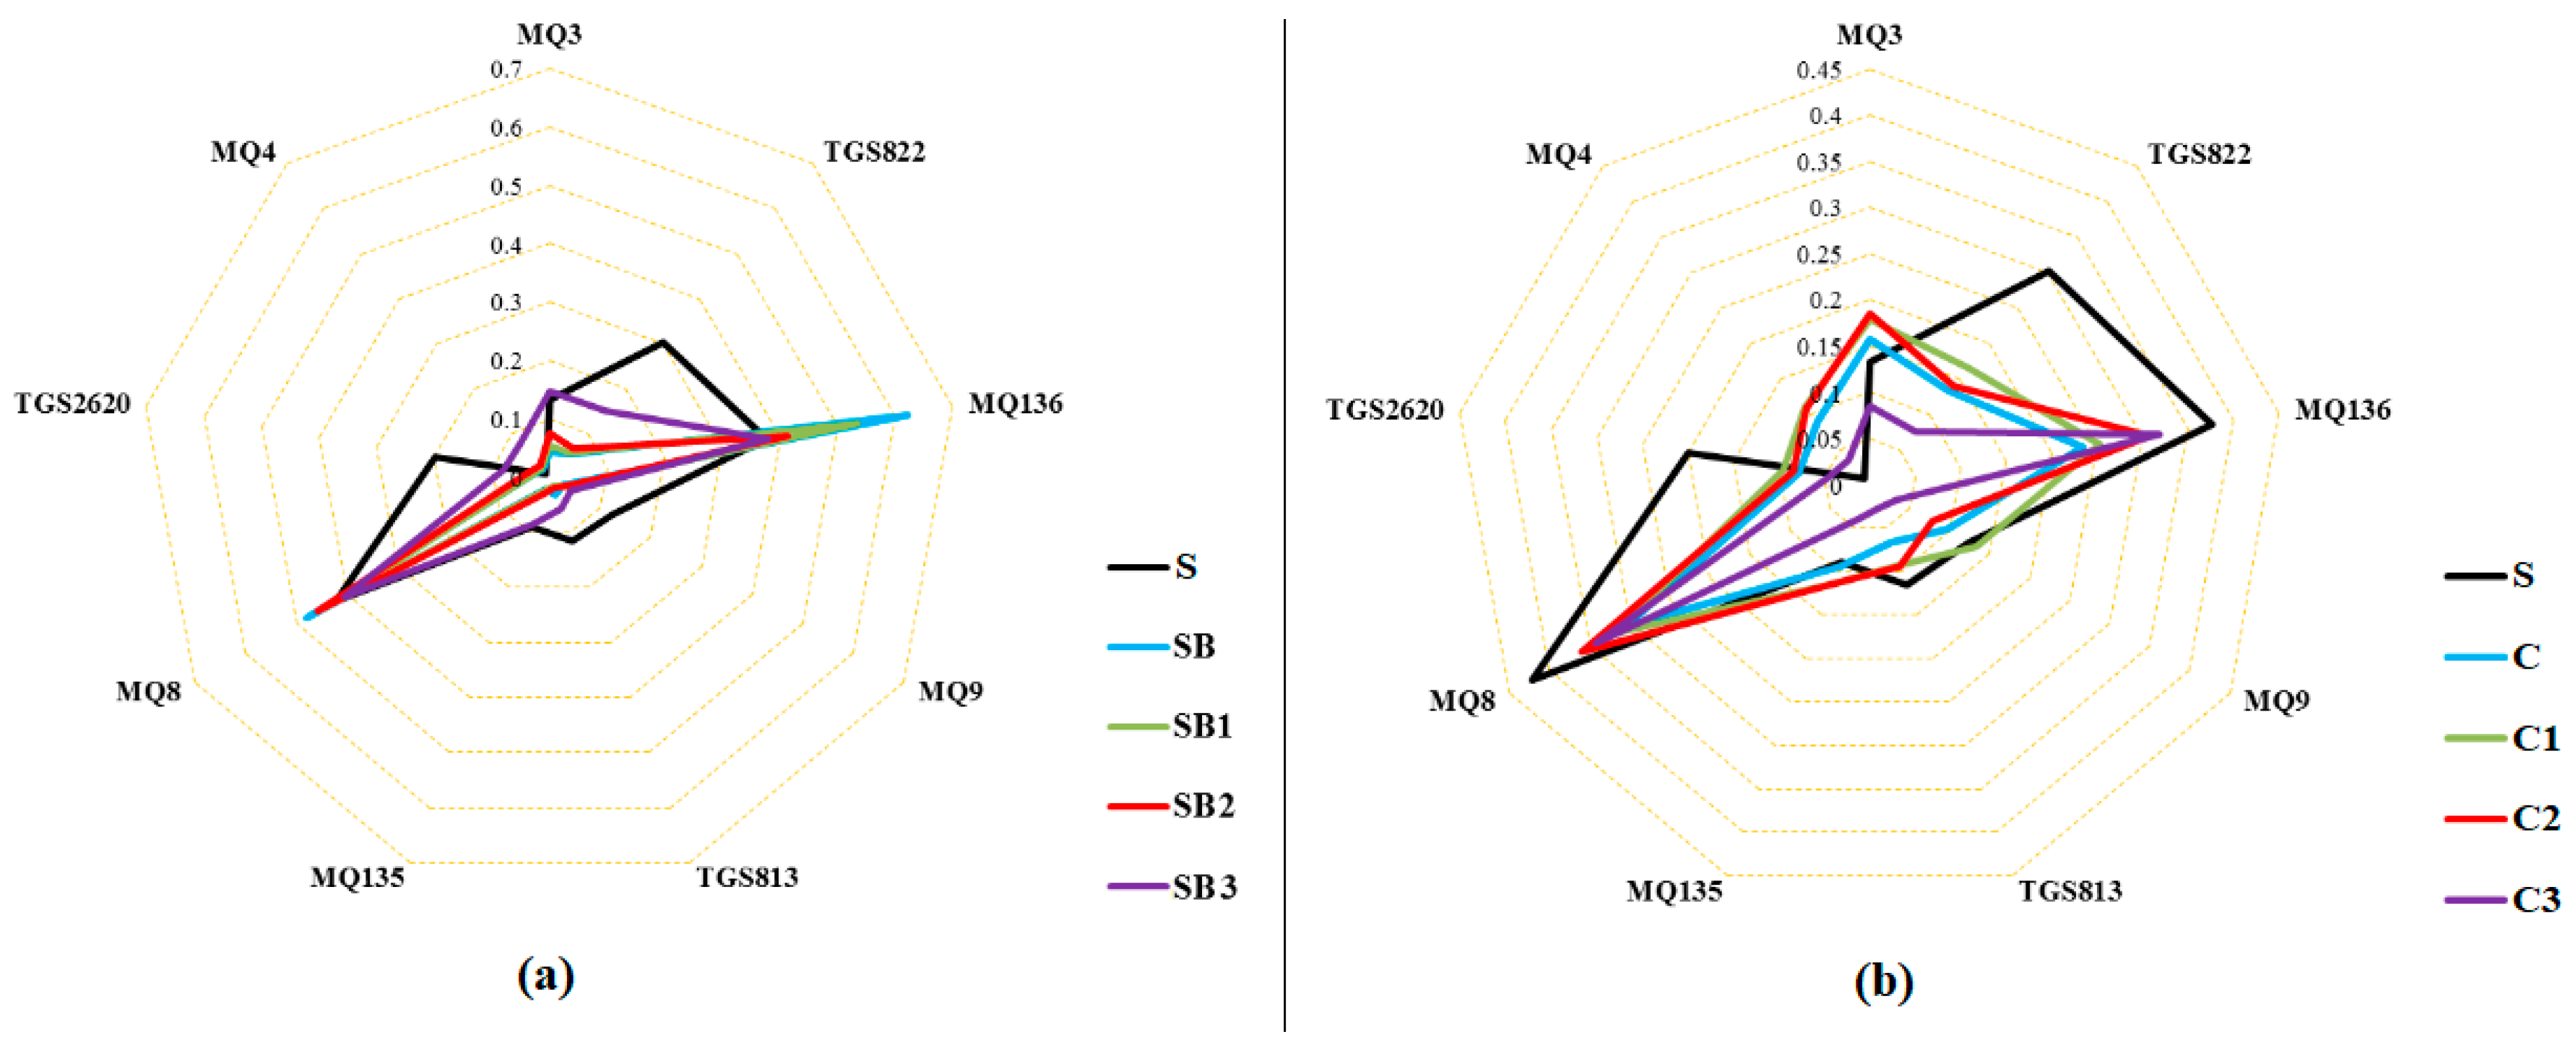
3.2. E-Nose Analysis Combined with PCA and LDA
3.3. Machine Learning Classification
4. Discussion
5. Conclusions
Author Contributions
Funding
Institutional Review Board Statement
Informed Consent Statement
Data Availability Statement
Acknowledgments
Conflicts of Interest
References
- Aghili, N.S.; Rasekh, M.; Karami, H.; Azizi, V.; Gancarz, M. Detection of fraud in sesame oil with the help of artificial intelligence combined with chemometrics methods and chemical compounds characterization by gas chromatography–mass spectrometry. LWT 2022, 167, 113863. [Google Scholar] [CrossRef]
- Hai, Z.; Wang, J. Electronic nose and data analysis for detection of maize oil adulteration in sesame oil. Sens. Actuators B Chem. 2006, 119, 449–455. [Google Scholar] [CrossRef]
- Jayaraj, P.; Narasimhulu, C.A.; Rajagopalan, S.; Parthasarathy, S.; Desikan, R. Sesamol: A powerful functional food ingredient from sesame oil for cardioprotection. Food Funct. 2020, 11, 1198–1210. [Google Scholar] [CrossRef]
- Wan, Y.; Li, H.; Fu, G.; Chen, X.; Chen, F.; Xie, M. The relationship of antioxidant components and antioxidant activity of sesame seed oil. J. Sci. Food Agric. 2015, 95, 2571–2578. [Google Scholar] [CrossRef]
- Aslam, F.; Iqbal, S.; Nasir, M.; Anjum, A.A.; Swan, P.; Sweazea, K. Evaluation of white sesame seed oil on glucose control and biomarkers of hepatic, cardiac, and renal functions in male Sprague-Dawley rats with chemically induced diabetes. J. Med. Food 2017, 20, 448–457. [Google Scholar] [CrossRef]
- Yang, J.; Wu, Y.; Li, B.; Liu, L.; Ouyang, J. Fourier transform near infrared spectroscopy in the authentication and adulteration of sesame oil. J. Chin. Cereals Oils Assoc. 2014, 29, 114–119. [Google Scholar]
- Moore, J.C.; Spink, J.; Lipp, M. Development and application of a database of food ingredient fraud and economically motivated adulteration from 1980 to 2010. J. Food Sci. 2012, 77, R118–R126. [Google Scholar] [CrossRef]
- Yuan, Y.-Y.; Wang, S.-T.; Wang, J.-Z.; Cheng, Q.; Wu, X.-J.; Kong, D.-M. Rapid detection of the authenticity and adulteration of sesame oil using excitation-emission matrix fluorescence and chemometric methods. Food Control 2020, 112, 107145. [Google Scholar] [CrossRef]
- Karami, H.; Rasekh, M.; Mirzaee-Ghaleh, E. Qualitative analysis of edible oil oxidation using an olfactory machine. J. Food Meas. Charact. 2020, 14, 2600–2610. [Google Scholar] [CrossRef]
- Soltani Firouz, M.; Rashvand, M.; Omid, M. Rapid identification and quantification of sesame oils adulteration using low frequency dielectric spectroscopy combined with chemometrics. LWT 2021, 140, 110736. [Google Scholar] [CrossRef]
- Zhao, Z.; Wu, X.; Liu, H. Vision transformer for quality identification of sesame oil with stereoscopic fluorescence spectrum image. LWT 2022, 158, 113173. [Google Scholar] [CrossRef]
- Filoda, P.F.; Fetter, L.F.; Fornasier, F.; Schneider, R.d.C.d.S.; Helfer, G.A.; Tischer, B.; Teichmann, A.; da Costa, A.B. Fast methodology for identification of olive oil adulterated with a mix of different vegetable oils. Food Anal. Methods 2019, 12, 293–304. [Google Scholar] [CrossRef]
- Jiang, J.; Dou, X.; Zhang, L.; Mao, J.; Yu, L.; Ma, F.; Li, P. Rapid authentication of sesame oil using ion mobility spectrometry and chemometrics. Oil Crop Sci. 2020, 5, 161–165. [Google Scholar] [CrossRef]
- Zhang, L.; Huang, X.; Li, P.; Na, W.; Jiang, J.; Mao, J.; Ding, X.; Zhang, Q. Multivariate adulteration detection for sesame oil. Chemom. Intell. Lab. Syst. 2017, 161, 147–150. [Google Scholar] [CrossRef]
- Lyu, W.; Yuan, B.; Liu, S.; Simon, J.E.; Wu, Q. Assessment of lemon juice quality and adulteration by ultra-high performance liquid chromatography/triple quadrupole mass spectrometry with interactive and interpretable machine learning. J. Food Drug Anal. 2021, 29, 275–286. [Google Scholar] [CrossRef]
- Roy, M.; Doddappa, M.; Yadav, B.K.; Shanmugasundaram, S. A novel technique for detection of vanaspati (hydrogenated fat) in cow ghee (clarified butter fat) using flash gas chromatography electronic nose combined with chemometrics. J. Food Process. Preserv. 2022, 46, e16667. [Google Scholar] [CrossRef]
- Xing, C.; Yuan, X.; Wu, X.; Shao, X.; Yuan, J.; Yan, W. Chemometric classification and quantification of sesame oil adulterated with other vegetable oils based on fatty acids composition by gas chromatography. LWT 2019, 108, 437–445. [Google Scholar] [CrossRef]
- Luo, Q.; Chen, Y.; Xu, Q.; Yu, Y.; Zheng, X. Near-infrared-based identification of sesame oil authenticity. IOP Conf. Ser. Mater. Sci. Eng. 2018, 452, 022053. [Google Scholar] [CrossRef]
- Giacomino, A.; Inaudi, P.; Silletta, G.; Diana, A.; Bertinetti, S.; Gaggero, E.; Malandrino, M.; Stilo, F.; Abollino, O. Analytical methods for the characterization of vegetable oils. Molecules 2023, 28, 153. [Google Scholar] [CrossRef]
- Conrado, J.A.M.; Sequinel, R.; Dias, B.C.; Silvestre, M.; Batista, A.D.; Petruci, J.F.d.S. Chemical QR Code: A simple and disposable paper-based optoelectronic nose for the identification of olive oil aroma. Food Chem. 2021, 350, 129243. [Google Scholar] [CrossRef]
- Majchrzak, T.; Wojnowski, W.; Dymerski, T.; Gębicki, J.; Namieśnik, J. Electronic noses in classification and quality control of edible oils: A review. Food Chem. 2018, 246, 192–201. [Google Scholar] [CrossRef]
- Huang, Z.-M.; Xin, J.-X.; Sun, S.-S.; Li, Y.; Wei, D.-X.; Zhu, J.; Wang, X.-L.; Wang, J.; Yao, Y.-F. Rapid identification of adulteration in edible vegetable oils based on low-field nuclear magnetic resonance relaxation fingerprints. Foods 2021, 10, 3068. [Google Scholar] [CrossRef]
- Sysoev, V.V.; Strelcov, E.; Kolmakov, A. Multisensor micro-arrays based on metal oxide nanowires for electronic nose applications. In Metal Oxide Nanomaterials for Chemical Sensors; Carpenter, M.A., Mathur, S., Kolmakov, A., Eds.; Springer: New York, NY, USA, 2013; pp. 465–502. [Google Scholar]
- Boeker, P. On ‘electronic nose’ methodology. Sens. Actuators B Chem. 2014, 204, 2–17. [Google Scholar] [CrossRef]
- Rasekh, M.; Karami, H.; Wilson, A.D.; Gancarz, M. Classification and identification of essential oils from herbs and fruits based on a MOS electronic-nose technology. Chemosensors 2021, 9, 142. [Google Scholar] [CrossRef]
- Röck, F.; Barsan, N.; Weimar, U. Electronic nose: Current status and future trends. Chem. Rev. 2008, 108, 705–725. [Google Scholar] [CrossRef]
- Rasekh, M.; Karami, H.; Wilson, A.D.; Gancarz, M. Performance analysis of MAU-9 electronic-nose MOS sensor array components and ANN classification methods for discrimination of herb and fruit essential oils. Chemosensors 2021, 9, 243. [Google Scholar] [CrossRef]
- Gutierrez-Osuna, R.; Nagle, H.T.; Kermani, B.; Schiffman, S.S. Chapter 5—Signal Conditioning and Preprocessing. In Handbook of Machine Olfaction: Electronic Nose Technology; Pearce, T.C., Schiffman, S.S., Nagle, H.T., Gardner, J.W., Eds.; Wiley-VCH: Weinheim, Germany, 2002; pp. 105–132. [Google Scholar] [CrossRef]
- Tang, X.; Yu, Z. Rapid evaluation of chicken meat freshness using gas sensor array and signal analysis considering total volatile basic nitrogen. Int. J. Food Prop. 2020, 23, 297–305. [Google Scholar] [CrossRef]
- Karami, H.; Rasekh, M.; Mirzaee-Ghaleh, E. Comparison of chemometrics and AOCS official methods for predicting the shelf life of edible oil. Chemom. Intell. Lab. Syst. 2020, 206, 104165. [Google Scholar] [CrossRef]
- Jolliffe, I.T.; Cadima, J. Principal component analysis: A review and recent developments. Philos. Trans. R. Soc. A 2016, 374, 20150202. [Google Scholar] [CrossRef]
- Abu-Khalaf, N.; Masoud, W. Electronic nose for differentiation and quantification of yeast species in white fresh soft cheese. Appl. Bionics Biomech. 2022, 2022, 8472661. [Google Scholar] [CrossRef]
- Puertas, G.; Cazón, P.; Vázquez, M. A quick method for fraud detection in egg labels based on egg centrifugation plasma. Food Chem. 2023, 402, 134507. [Google Scholar] [CrossRef] [PubMed]
- Latif, G.; Ben Brahim, G.; Iskandar, D.N.F.A.; Bashar, A.; Alghazo, J. Glioma tumors’ classification using deep-neural-network-based features with SVM classifier. Diagnostics 2022, 12, 1018. [Google Scholar] [CrossRef]
- Ding, W.; Zhang, Y.; Kou, L.; Jurick, W.M., II. Electronic nose application for the determination of penicillin G in Saanen goat milk with Fisher discriminate and multilayer perceptron neural network analyses. J. Food Process. Preserv. 2015, 39, 927–932. [Google Scholar] [CrossRef]
- Schmidhuber, J. Deep learning in neural networks: An overview. Neural Netw. 2015, 61, 85–117. [Google Scholar] [CrossRef] [PubMed]
- Savage, G.P.; McNeil, D.L. Chemical composition of hazelnuts (Corylus avellana L.) grown in New Zealand. Int. J. Food Sci. Nutr. 1998, 49, 199–203. [Google Scholar] [CrossRef]
- Mohammadian, N.; Ziaiifar, A.M.; Mirzaee-Ghaleh, E.; Kashaninejad, M.; Karami, H. Nondestructive technique for identifying adulteration and additives in lemon juice based on analyzing volatile organic compounds (VOCs). Processes 2023, 11, 1531. [Google Scholar] [CrossRef]
- Zhao, M.; Chen, B. Corn Oil. In Sustainable Food Science—A Comprehensive Approach; Ferranti, P., Ed.; Elsevier: Oxford, UK, 2023; pp. 104–119. [Google Scholar]
- Kong, W.; Baeyens, J.; De Winter, K.; Urrutia, A.R.; Degrève, J.; Zhang, H. An energy-friendly alternative in the large-scale production of soybean oil. J. Environ. Manag. 2019, 230, 234–244. [Google Scholar] [CrossRef]
- Fan, S.; Chang, J.; Zong, Y.; Hu, G.; Jia, J. GC-MS Analysis of the composition of the essential oil from Dendranthema indicum Var. Aromaticum using three extraction methods and two columns. Molecules 2018, 23, 576. [Google Scholar] [CrossRef]
- Zunin, P.; Boggia, R.; Salvadeo, P.; Evangelisti, F. Geographical traceability of West Liguria extra virgin olive oils by the analysis of volatile terpenoid hydrocarbons. J. Chromatogr. A 2005, 1089, 243–249. [Google Scholar] [CrossRef]
- Bougrini, M.; Tahri, K.; Haddi, Z.; Saidi, T.; El Bari, N.; Bouchikhi, B. Detection of adulteration in argan oil by using an electronic nose and a voltammetric electronic tongue. J. Sens. 2014, 2014, 245831. [Google Scholar] [CrossRef]
- Lerma-García, M.J.; Simó-Alfonso, E.F.; Bendini, A.; Cerretani, L. Metal oxide semiconductor sensors for monitoring of oxidative status evolution and sensory analysis of virgin olive oils with different phenolic content. Food Chem. 2009, 117, 608–614. [Google Scholar] [CrossRef]
- Xu, L.; Yu, X.; Liu, L.; Zhang, R. A Novel method for qualitative analysis of edible oil oxidation using an electronic nose. Food Chem. 2016, 202, 229–235. [Google Scholar] [CrossRef] [PubMed]
- Cerrato Oliveros, M.C.; Pérez Pavón, J.L.; García Pinto, C.; Fernández Laespada, M.E.; Moreno Cordero, B.; Forina, M. Electronic nose based on metal oxide semiconductor sensors as a fast alternative for the detection of adulteration of virgin olive oils. Anal. Chim. Acta 2002, 459, 219–228. [Google Scholar] [CrossRef]
- Roy, M.; Yadav, B.K. Electronic nose for detection of food adulteration: A review. J. Food Sci. Technol. 2022, 59, 846–858. [Google Scholar] [CrossRef]
- Men, H.; Chen, D.; Zhang, X.; Liu, J.; Ning, K. Data fusion of electronic nose and electronic tongue for detection of mixed edible-oil. J. Sens. 2014, 2014, 840685. [Google Scholar] [CrossRef]
- Marina, A.M.; Che Man, Y.B.; Amin, I. Use of the SAW sensor electronic nose for detecting the adulteration of virgin coconut oil with RBD palm kernel olein. J. Am. Oil Chem. Soc. 2010, 87, 263–270. [Google Scholar] [CrossRef]
- Hong, E.J.; Park, S.J.; Choi, J.Y.; Noh, B.S. Discrimination of palm olein oil and palm stearin oil mixtures using a mass spectrometry based electronic nose. Food Sci. Biotechnol. 2011, 20, 809–816. [Google Scholar] [CrossRef]
- Man, Y.C.; Gan, H.L.; NorAini, I.; Nazimah, S.A.H.; Tan, C.P. Detection of lard adulteration in RBD palm olein using an electronic nose. Food Chem. 2005, 90, 829–835. [Google Scholar] [CrossRef]
- Wei, X.; Shao, X.; Wei, Y.; Cheong, L.; Pan, L.; Tu, K. Rapid detection of adulterated peony seed oil by electronic nose. J. Food Sci. Technol. 2018, 55, 2152–2159. [Google Scholar] [CrossRef]


| Fatty Acids | Common Name | RT (min) | Vegetable Oil Type * | ||||||||
|---|---|---|---|---|---|---|---|---|---|---|---|
| S 1 | SB | SB1 | SB2 | SB3 | C | C1 | C2 | C3 | |||
| Decanoic acid | Capric acid (C10:0) | 17.5 | 0 | 0.007 | 0.007 | 0.009 | 0.002 | 0 | 0 | 0 | 0 |
| Dodecanoic acid | Lauric acid (C12:0) | 24 | 0.006 | 0.202 | 0.189 | 0.138 | 0.056 | 0.002 | 0.002 | 0.011 | 0.005 |
| Tetradecanoic acid | Myristic acid (C14:0) | 29 | 0.074 | 1.188 | 1.076 | 0.83 | 0.394 | 0.239 | 0.28 | 0.127 | 0.192 |
| Hexadecanoic acid | Palmitic acid (C16:0) | 33.5 | 17.918 | 26.805 | 26.298 | 24.028 | 21.112 | 23.454 | 21.364 | 19.872 | 18.882 |
| 8,11-Octadecadienoic acid | Linoleic acid (C18:2) | 36.5 | 63.241 | 2.407 | 3.058 | 3.133 | 3.35 | 3.156 | 3.184 | 3.759 | 3.69 |
| 9-Octadecenoic acid | Oleic acid (C18:1) | 36.9 | 1.02 | 1.02 | 1.274 | 1.023 | 0.936 | 0 | 0 | 0 | 0 |
| Octadecanoic acid | Stearic acid (C18:0) | 38.2 | 5.516 | 53.474 | 53.218 | 53.12 | 52.146 | 56.412 | 54.458 | 53.372 | 52.757 |
| 11-Eicosenoic acid | Gondoic acid (C20:1) | 39.5 | 1.035 | 0 | 0 | 0 | 0 | 0 | 0 | 0 | 0 |
| Eicosanoic acid | Arachudic acid (C20:0) | 40 | 2.045 | 1.185 | 1.136 | 1.244 | 1.349 | 1.719 | 1.525 | 1.817 | 2.009 |
| Docosanoic acid | Erucic acid (C22:0) | 42.5 | 0.588 | 2.815 | 2.331 | 2.07 | 1.313 | 1.271 | 1.411 | 0.992 | 1.184 |
| Tetracosanoic acid, | Lignoceric acid (C24:0) | 44.8 | 0.359 | 1.049 | 0.889 | 0.848 | 0.623 | 1.081 | 1.238 | 0.886 | 0.802 |
| Total% | 91.802 | 91.721 | 91.106 | 88.361 | 83.745 | 89.497 | 86.128 | 83.134 | 82.526 | ||
| Other compounds | 7.198 | 8.279 | 8.894 | 11.639 | 16.255 | 10.503 | 13.872 | 16.866 | 17.474 | ||
| Kernel Function | C-SVM | Nu-SVM | |||||||
|---|---|---|---|---|---|---|---|---|---|
| C | γ | Training | Validation | nu | γ | Training | Validation | ||
| Linear ** | 100 | 1 | 97.18 | 93.33 | 0.5 | 1 | 96.78 | 93.07 | |
| Polynomial | 10 | 1 | 80.74 | 77.04 | 0.5 | 1 | 88.15 | 83.70 | |
| Radial basis function | 100 | 0.1 | 96.48 | 92.07 | 0.5 | 0.01 | 94.78 | 92.33 | |
| sigmoid | 100 | 0.1 | 95.55 | 88.15 | 0.745 | 0.01 | 92.59 | 91.11 | |
| Topology * | Training | Test | CCR (%) ** | ||
|---|---|---|---|---|---|
| RMSE | R2 | RMSE | R2 | ||
| 9-5-9 | 0.074 | 0.844 | 0.088 | 0.823 | 84.4 |
| 9-6-9 | 0.046 | 0.899 | 0.059 | 0.849 | 88.3 |
| 9-7-9 | 0.054 | 0.901 | 0.065 | 0.878 | 89.5 |
| 9-8-9 | 0.035 | 0.930 | 0.039 | 0.901 | 91.7 |
| 9-9-9 | 0.027 | 0.928 | 0.042 | 0.911 | 92.6 |
| 9-10-9 | 0.001 | 0.956 | 0.018 | 0.930 | 95.6 |
| 9-11-9 | 0.038 | 0.925 | 0.423 | 0.915 | 92 |
Disclaimer/Publisher’s Note: The statements, opinions and data contained in all publications are solely those of the individual author(s) and contributor(s) and not of MDPI and/or the editor(s). MDPI and/or the editor(s) disclaim responsibility for any injury to people or property resulting from any ideas, methods, instructions or products referred to in the content. |
© 2023 by the authors. Licensee MDPI, Basel, Switzerland. This article is an open access article distributed under the terms and conditions of the Creative Commons Attribution (CC BY) license (https://creativecommons.org/licenses/by/4.0/).
Share and Cite
Aghili, N.S.; Rasekh, M.; Karami, H.; Edriss, O.; Wilson, A.D.; Ramos, J. Aromatic Fingerprints: VOC Analysis with E-Nose and GC-MS for Rapid Detection of Adulteration in Sesame Oil. Sensors 2023, 23, 6294. https://doi.org/10.3390/s23146294
Aghili NS, Rasekh M, Karami H, Edriss O, Wilson AD, Ramos J. Aromatic Fingerprints: VOC Analysis with E-Nose and GC-MS for Rapid Detection of Adulteration in Sesame Oil. Sensors. 2023; 23(14):6294. https://doi.org/10.3390/s23146294
Chicago/Turabian StyleAghili, Nadia Sadat, Mansour Rasekh, Hamed Karami, Omid Edriss, Alphus Dan Wilson, and Jose Ramos. 2023. "Aromatic Fingerprints: VOC Analysis with E-Nose and GC-MS for Rapid Detection of Adulteration in Sesame Oil" Sensors 23, no. 14: 6294. https://doi.org/10.3390/s23146294
APA StyleAghili, N. S., Rasekh, M., Karami, H., Edriss, O., Wilson, A. D., & Ramos, J. (2023). Aromatic Fingerprints: VOC Analysis with E-Nose and GC-MS for Rapid Detection of Adulteration in Sesame Oil. Sensors, 23(14), 6294. https://doi.org/10.3390/s23146294