
Modeling and Optimization of Laser Cladding Fixation Process for Optical Fiber Sensors in Harsh Environments


Abstract
:1. Introduction
2. Theory and Computational Model of Laser Cladding Fixation for Optical Fiber Sensors
2.1. Powder Flow Concentration Modeling
- (1)
- The speed parameters of the powder particles and the carrier gas leaving the nozzle have reached equilibrium, and the solid powder particles are not affected by gravity and inter-particle drag forces during the falling process;
- (2)
- The powder particles in the carrier air stream sprayed from the nozzle are spherical with uniform volume distribution;
- (3)
- Because the volume fraction of powder particles in the gas–solid two-phase flow is very low, the reflection and refraction of the laser, the mutual heating between the particles and the convection heat transfer between the particles are ignored; at the same time, it is assumed that there is no mutual shielding effect between the solid particles during the falling process of the particles;
- (4)
- The energy distribution of the laser beam is uniform.
2.2. The Laser Energy Attenuation Rate β
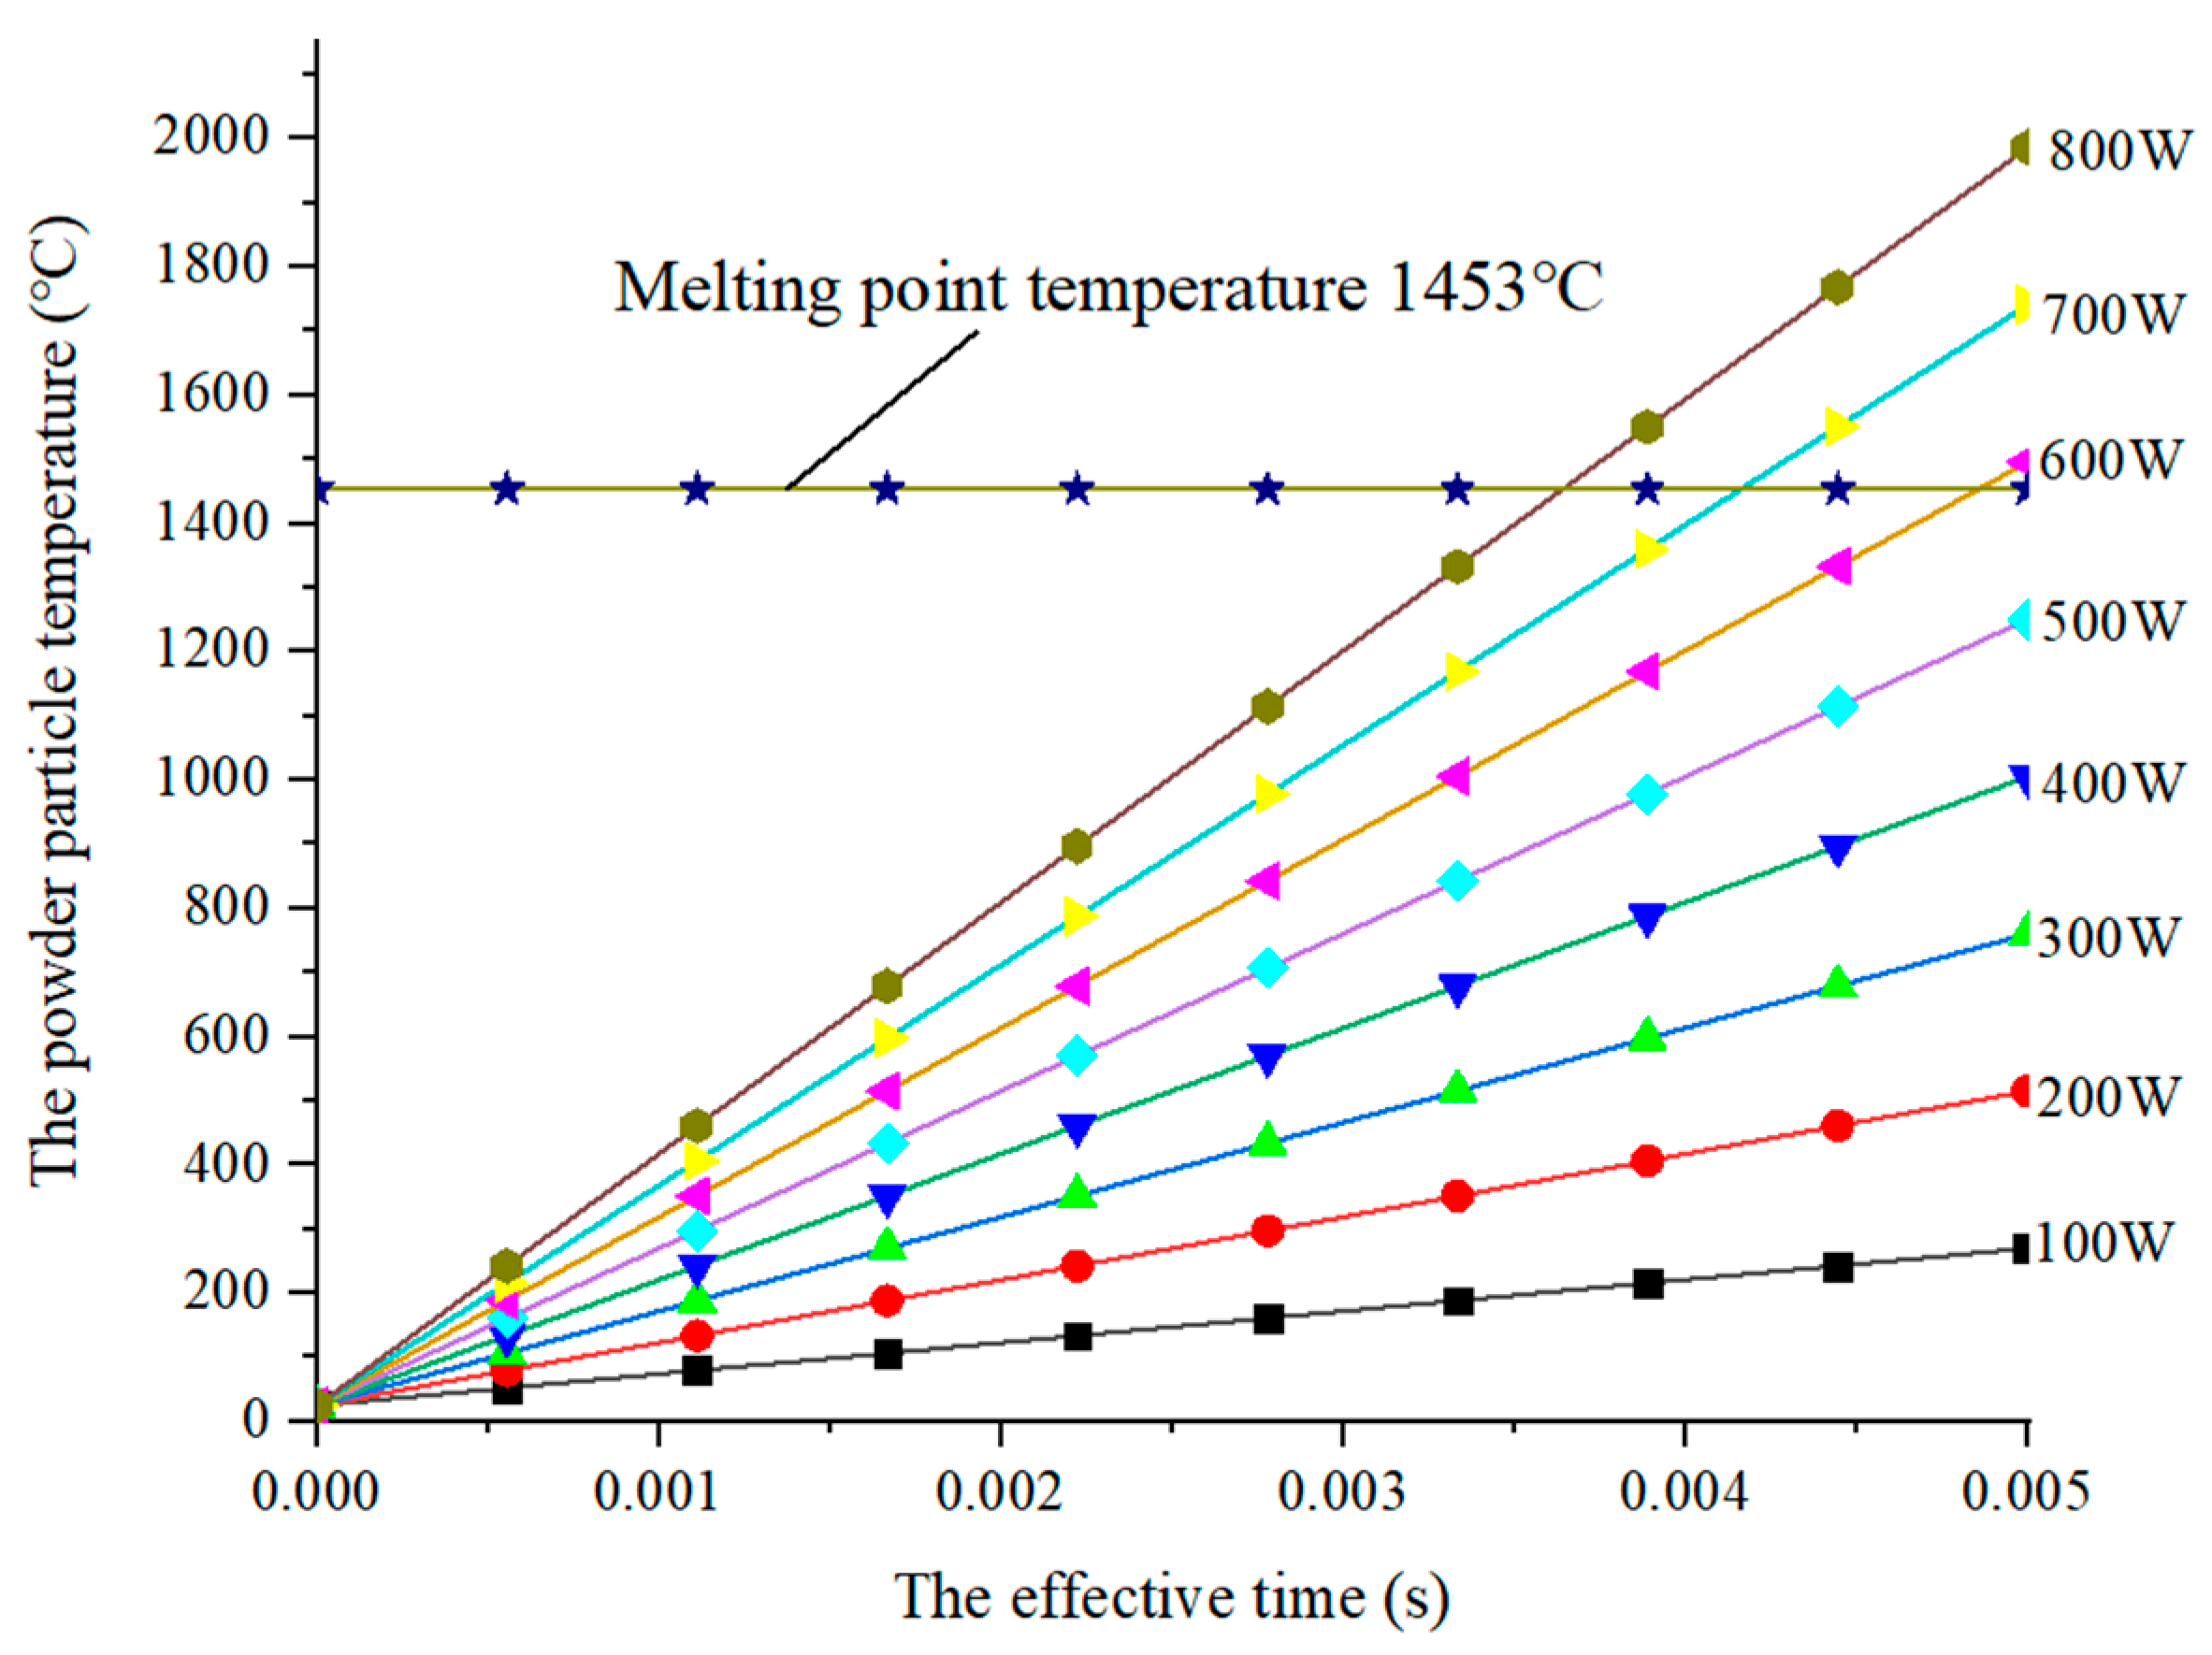
2.3. The Temperature T of a Single Particle
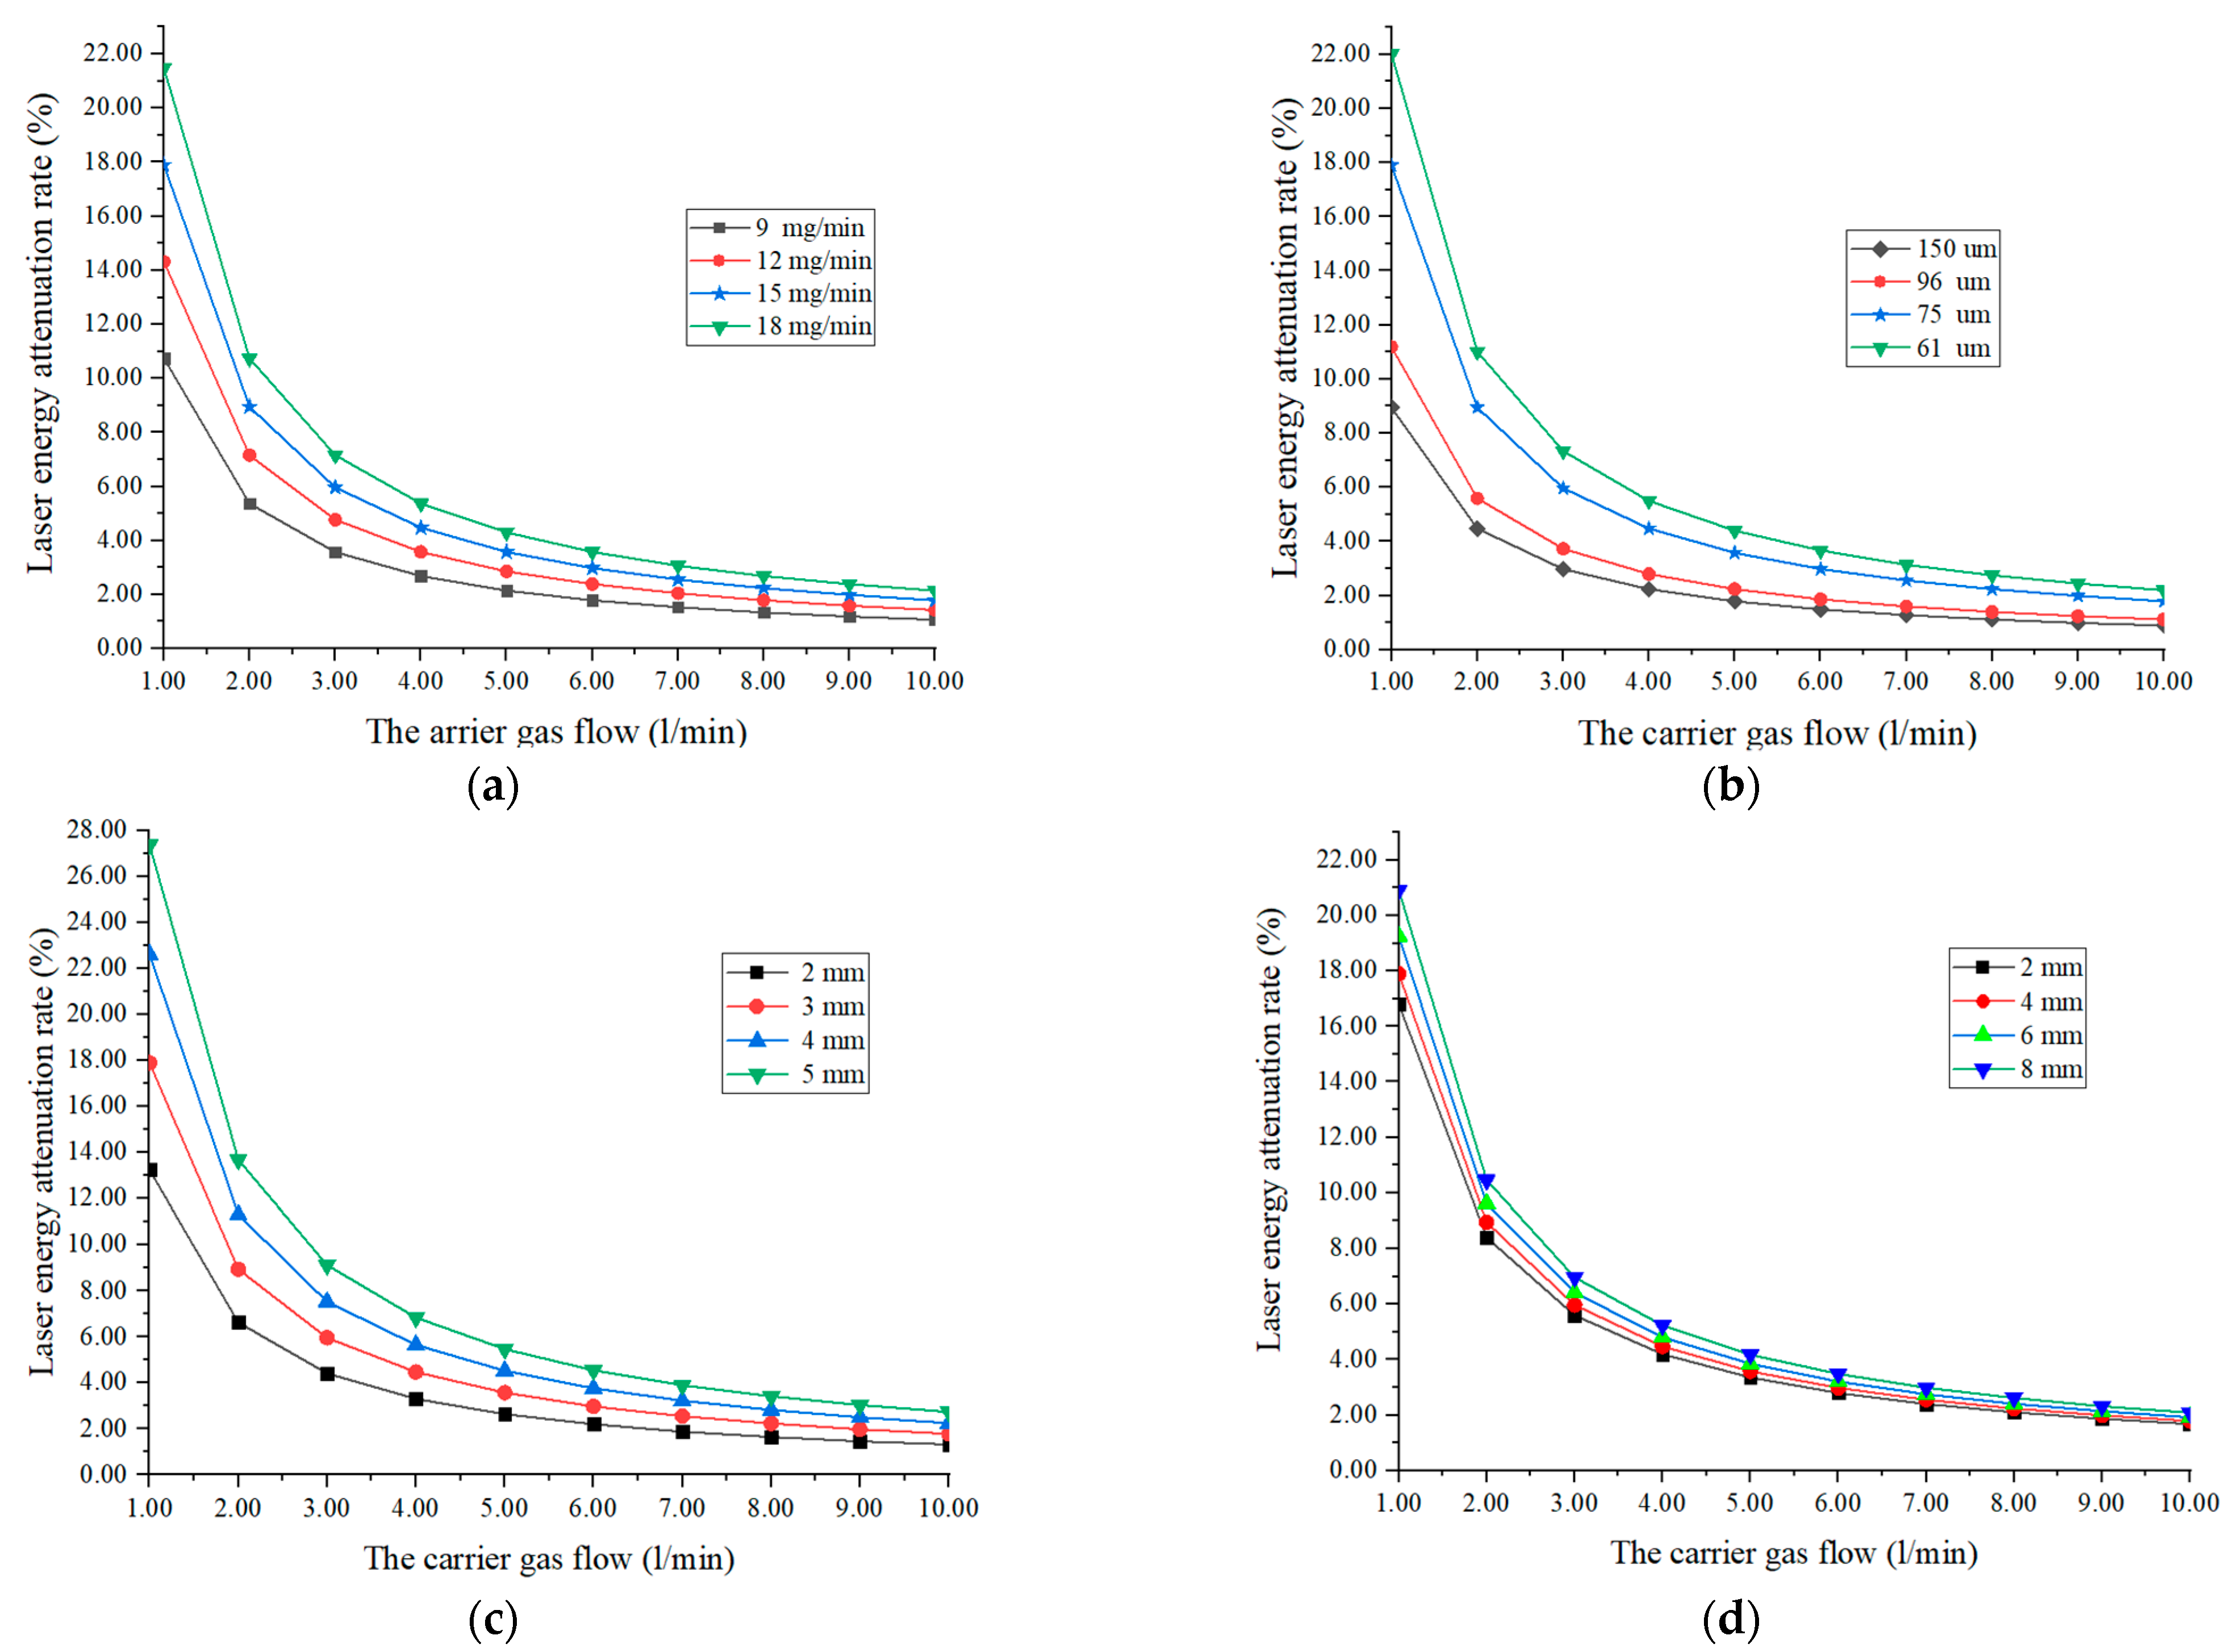
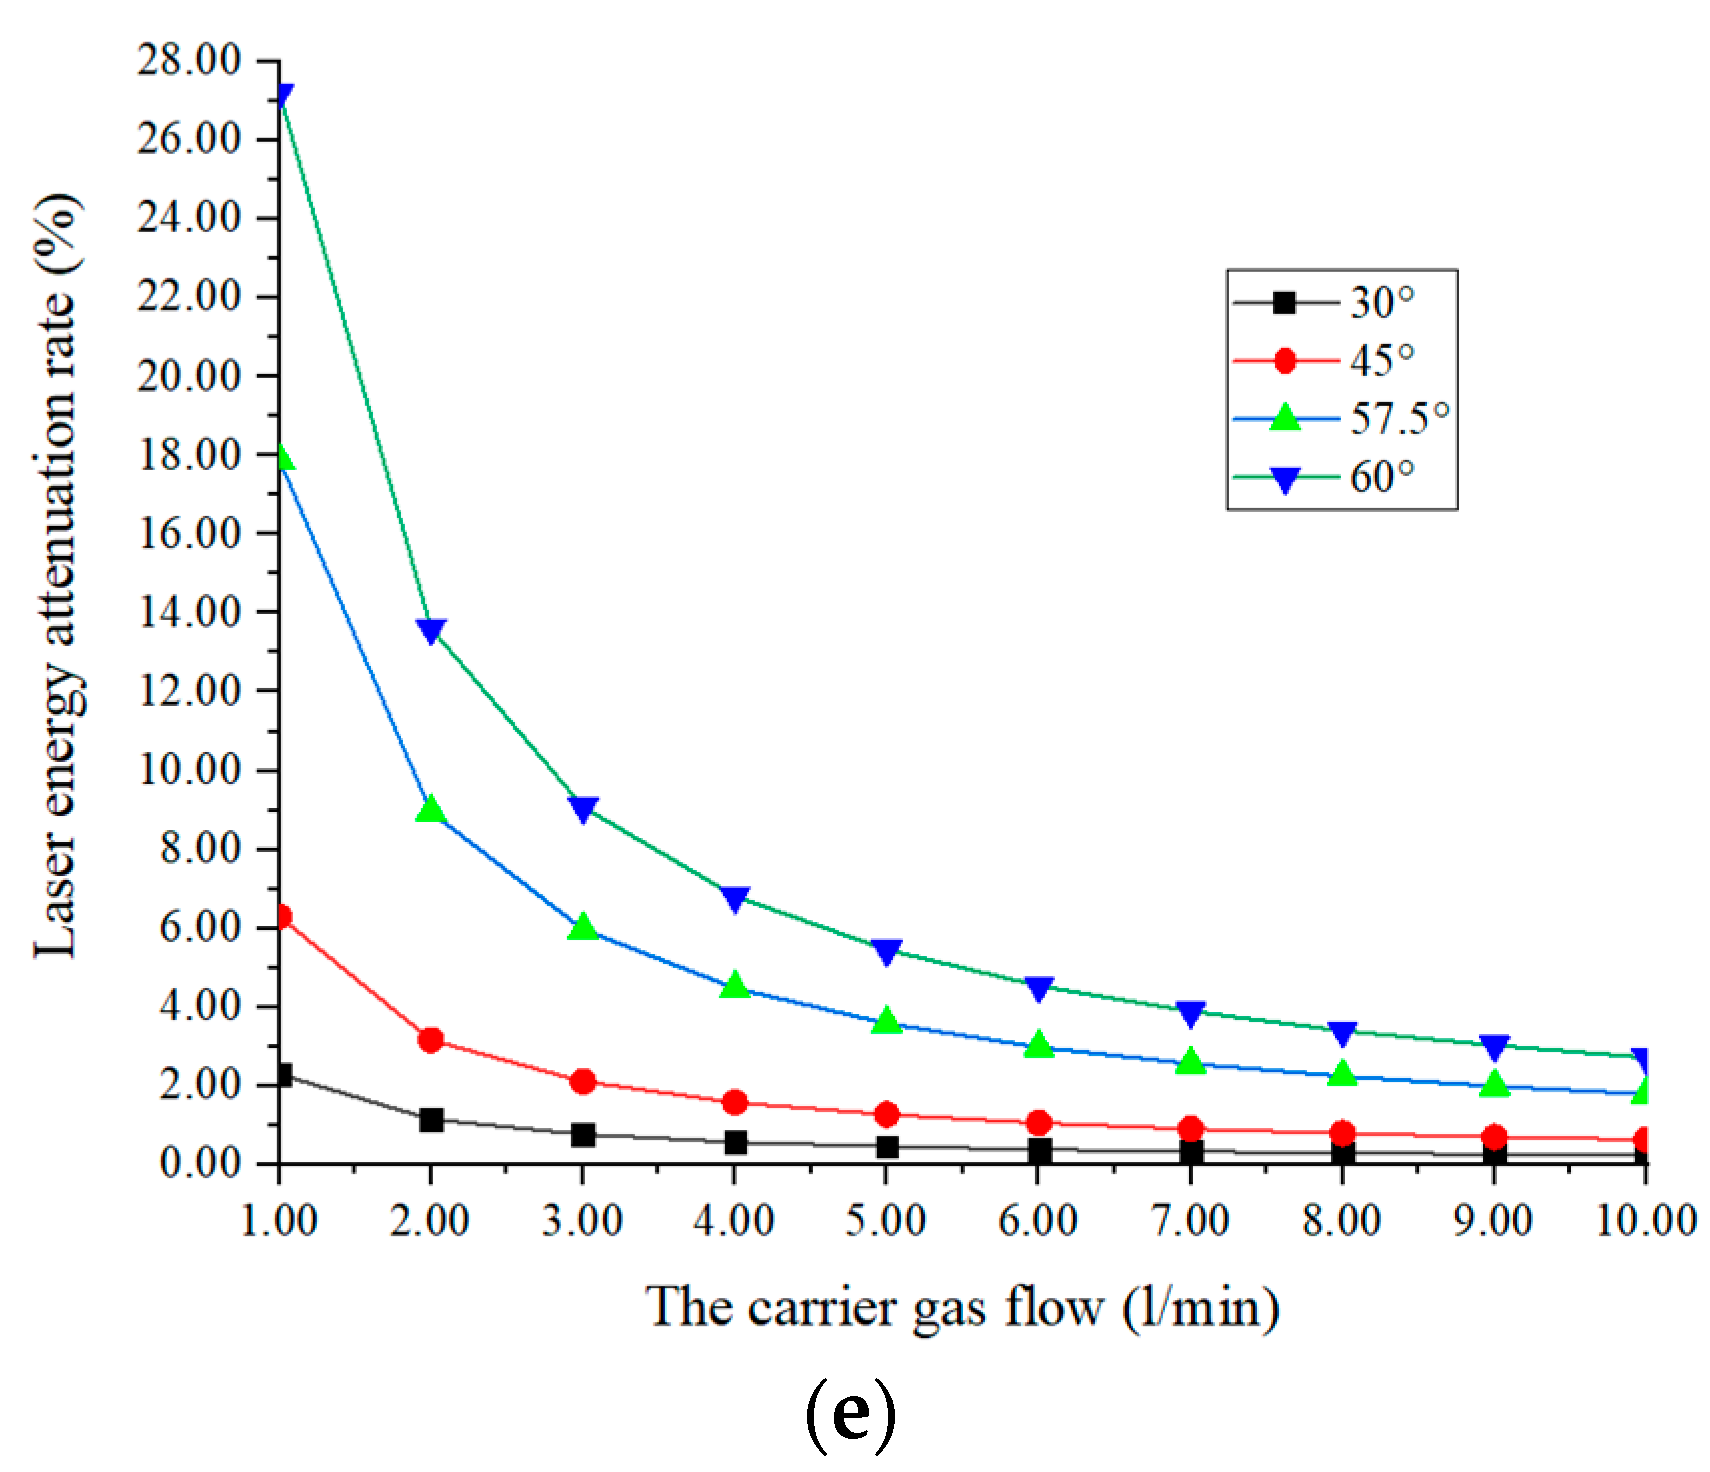
3. Simulation and Analysis of Energy Attenuation Model of Laser Cladding Fixation for Optical Fiber Sensors
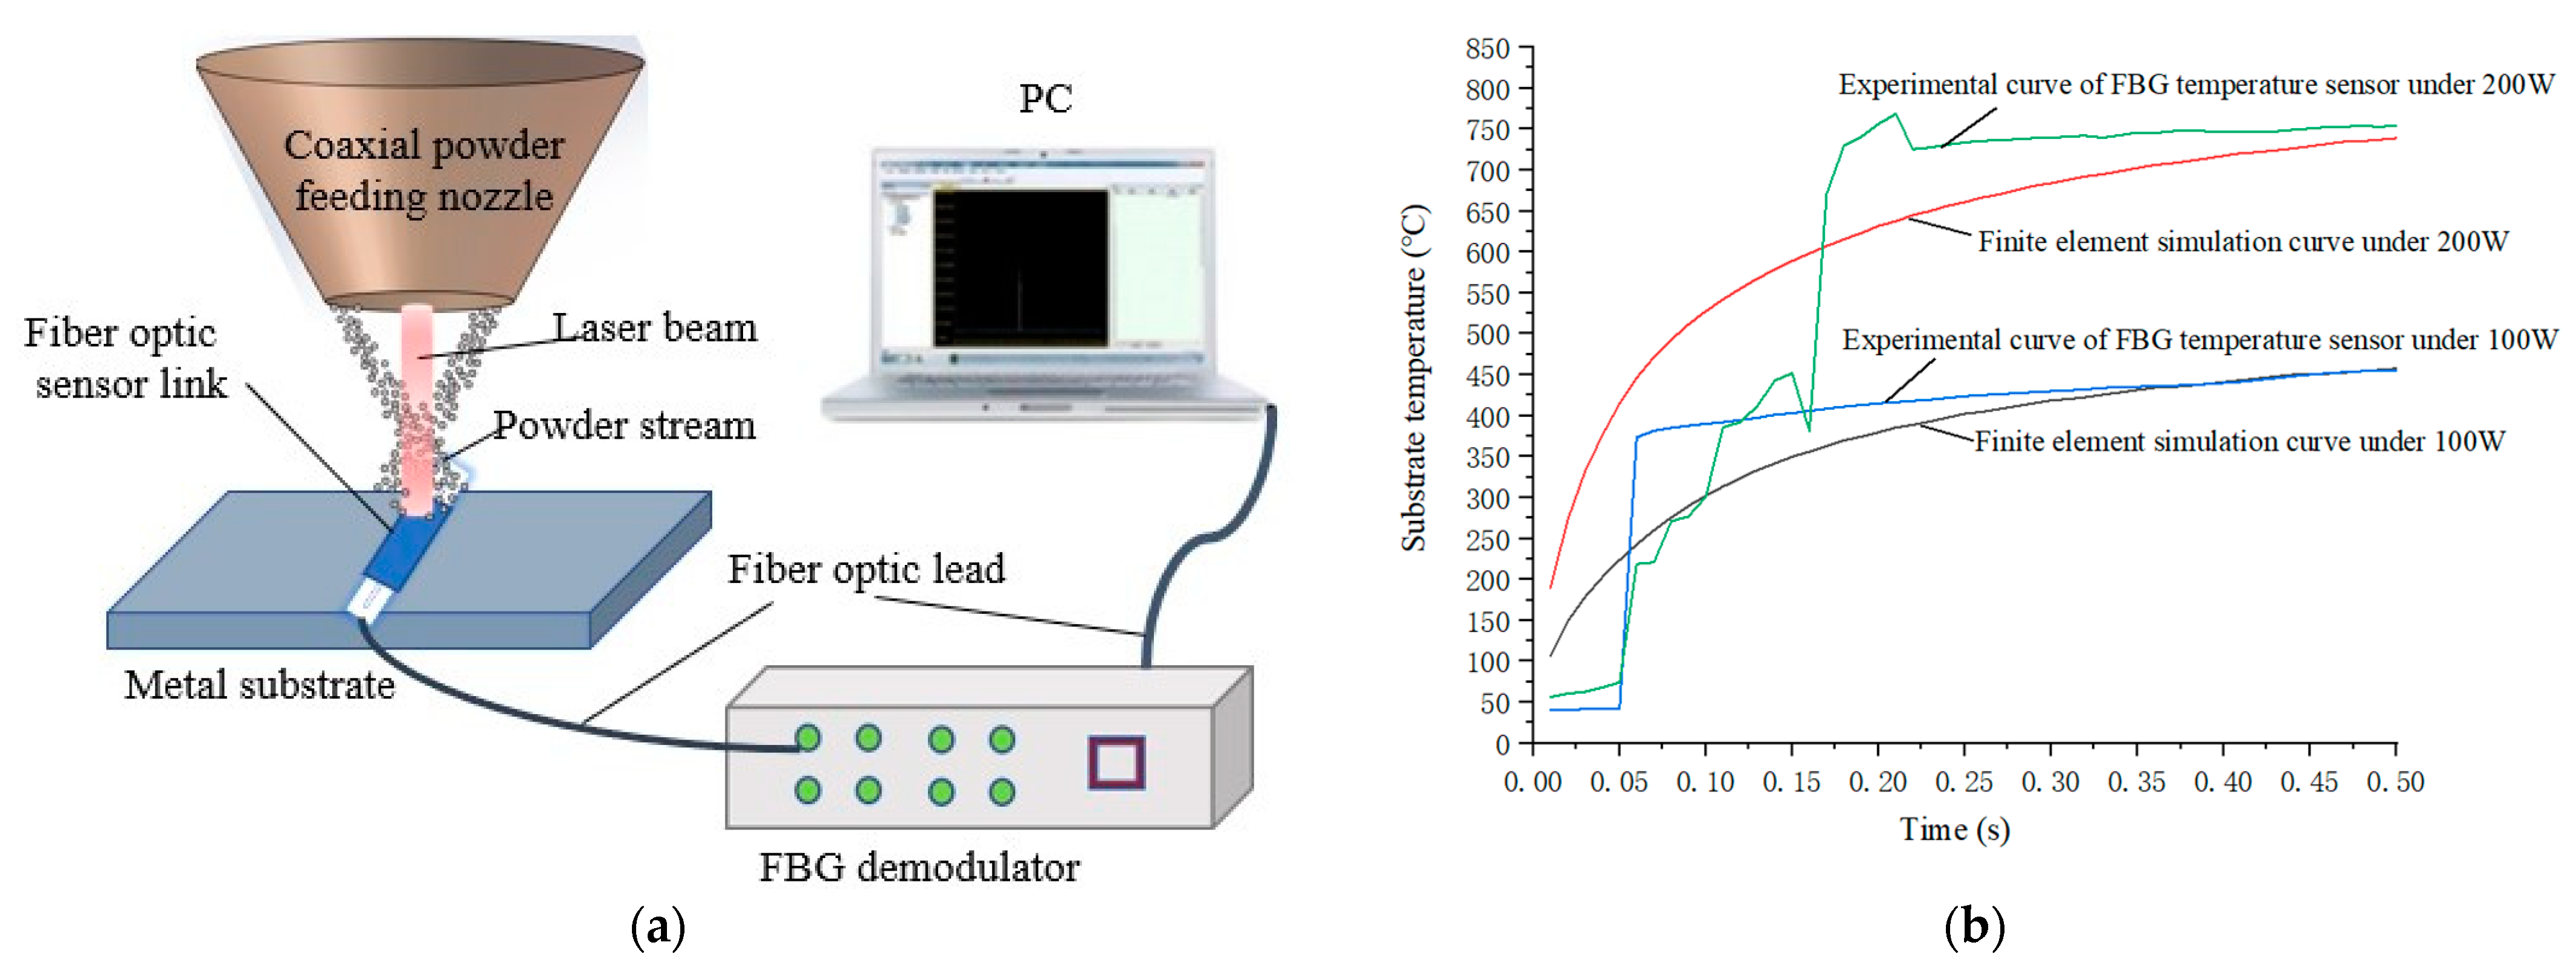
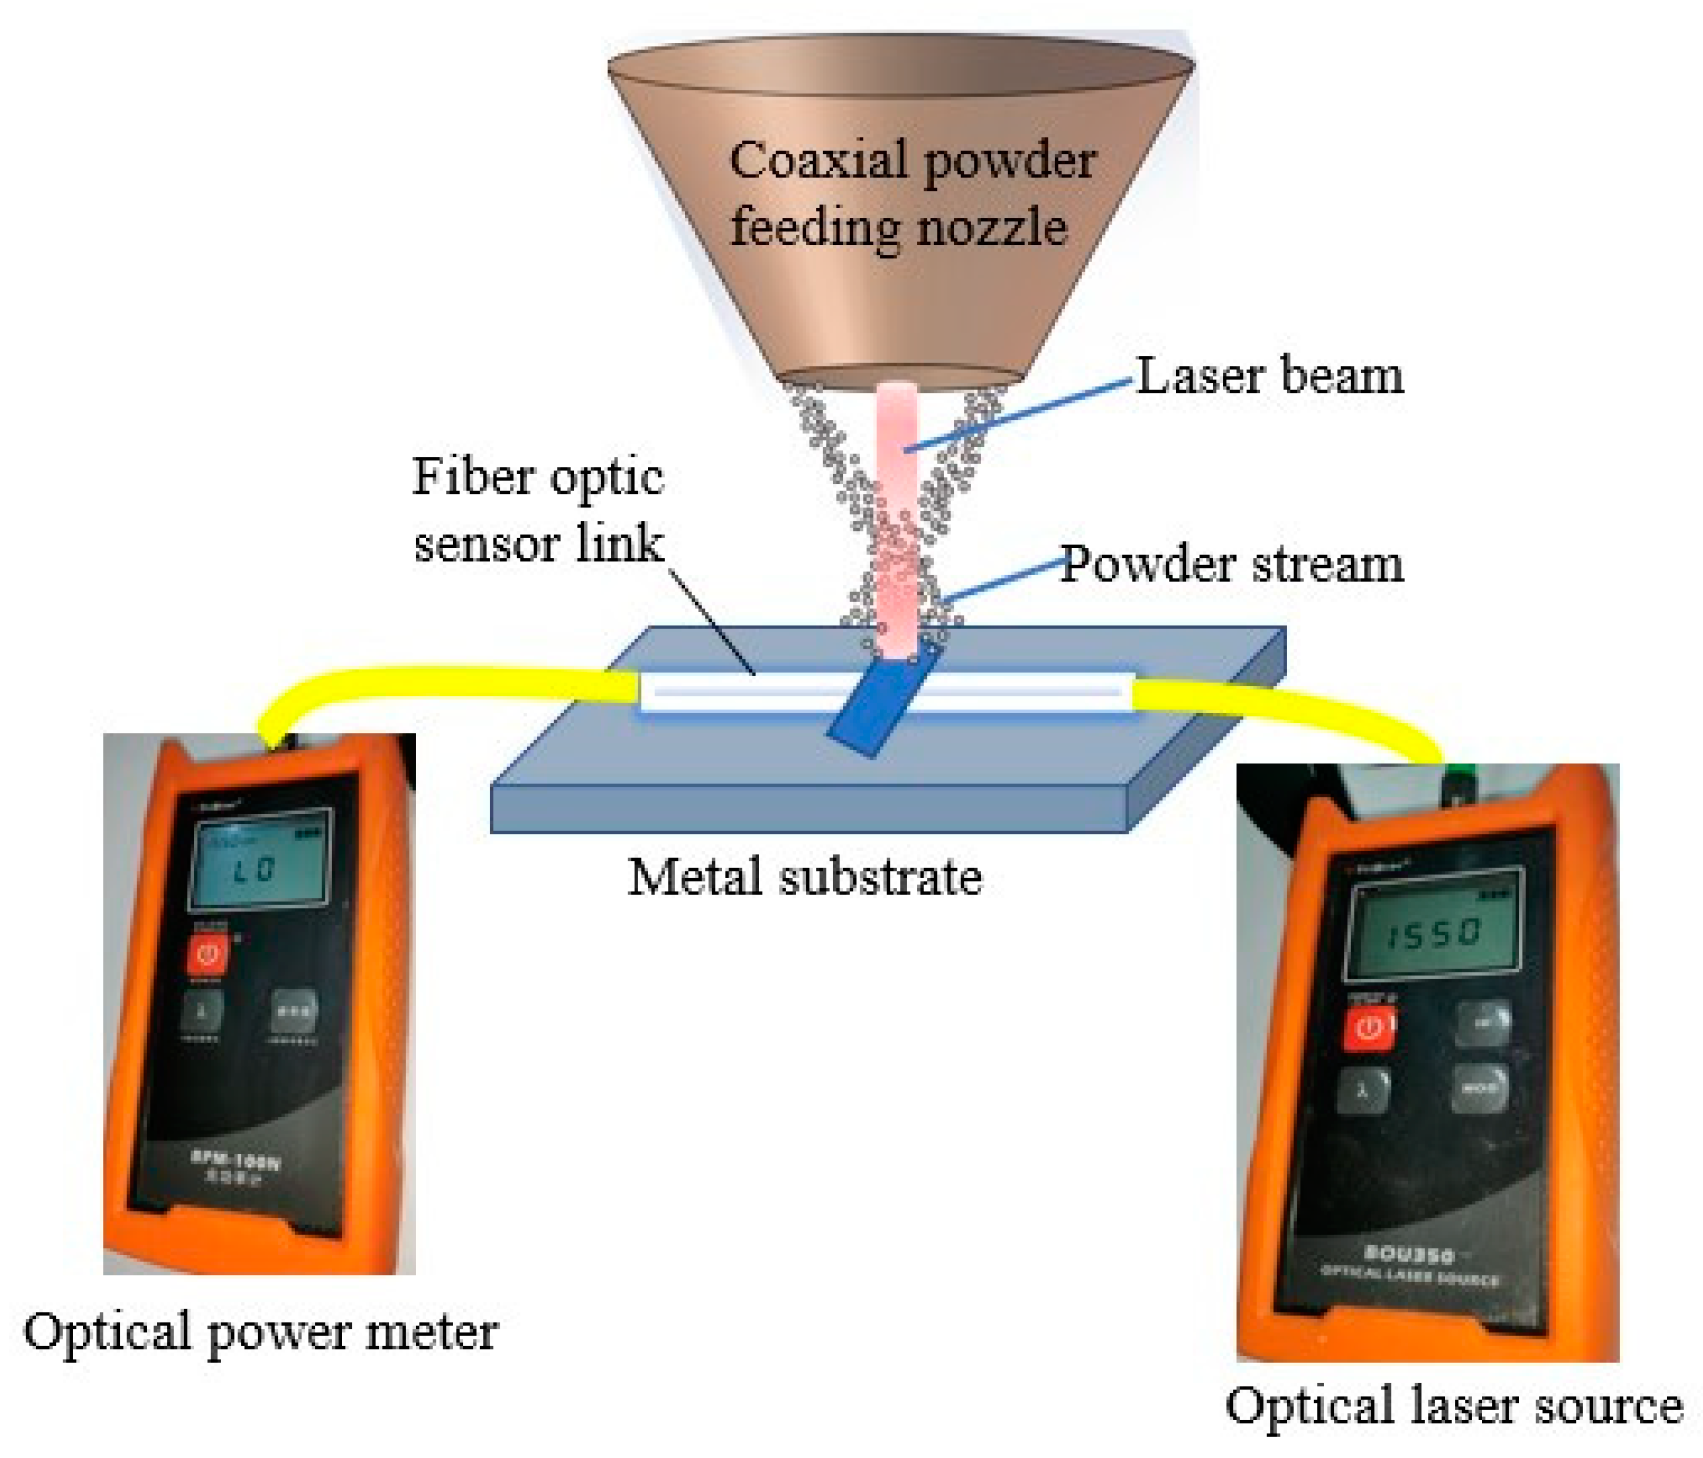
4. Experimental Methods and Materials
4.1. Experiment Verification
4.2. Experiment and Parameter Optimization
5. Conclusions
Author Contributions
Funding
Institutional Review Board Statement
Informed Consent Statement
Data Availability Statement
Conflicts of Interest
Abbreviations
| Nomenclature | |
| Carrier gas flow (L/min) | |
| Powder feeding speed (mg/min) | |
| Powder nozzle-to-center distance (mm) | |
| Powder particle volume (mm3) | |
| Laser power (W) | |
| The effective volume (mm3) | |
| Laser beam diameter (mm) | |
| Plane powder concentration at point z (mg/mm3) | |
| The effective number of powder particles | |
| Powder particle diameter (mm) | |
| Powder initial temperature (°C) | |
| Powder melting temperature (°C) | |
| Latent heat of powder melting (J/g) | |
| Nozzle exit radius (mm) | |
| The heat flux density of the laser heat source (J/m2·s) | |
| The distance between the nozzle and the substrate in the vertical direction along the z-axis (mm) | |
| Greek Symbols | |
| The angle between the x-axis and the center of the nozzle | |
| Absorption coefficient of powder particles | |
| Powder density (mg/mm3) | |
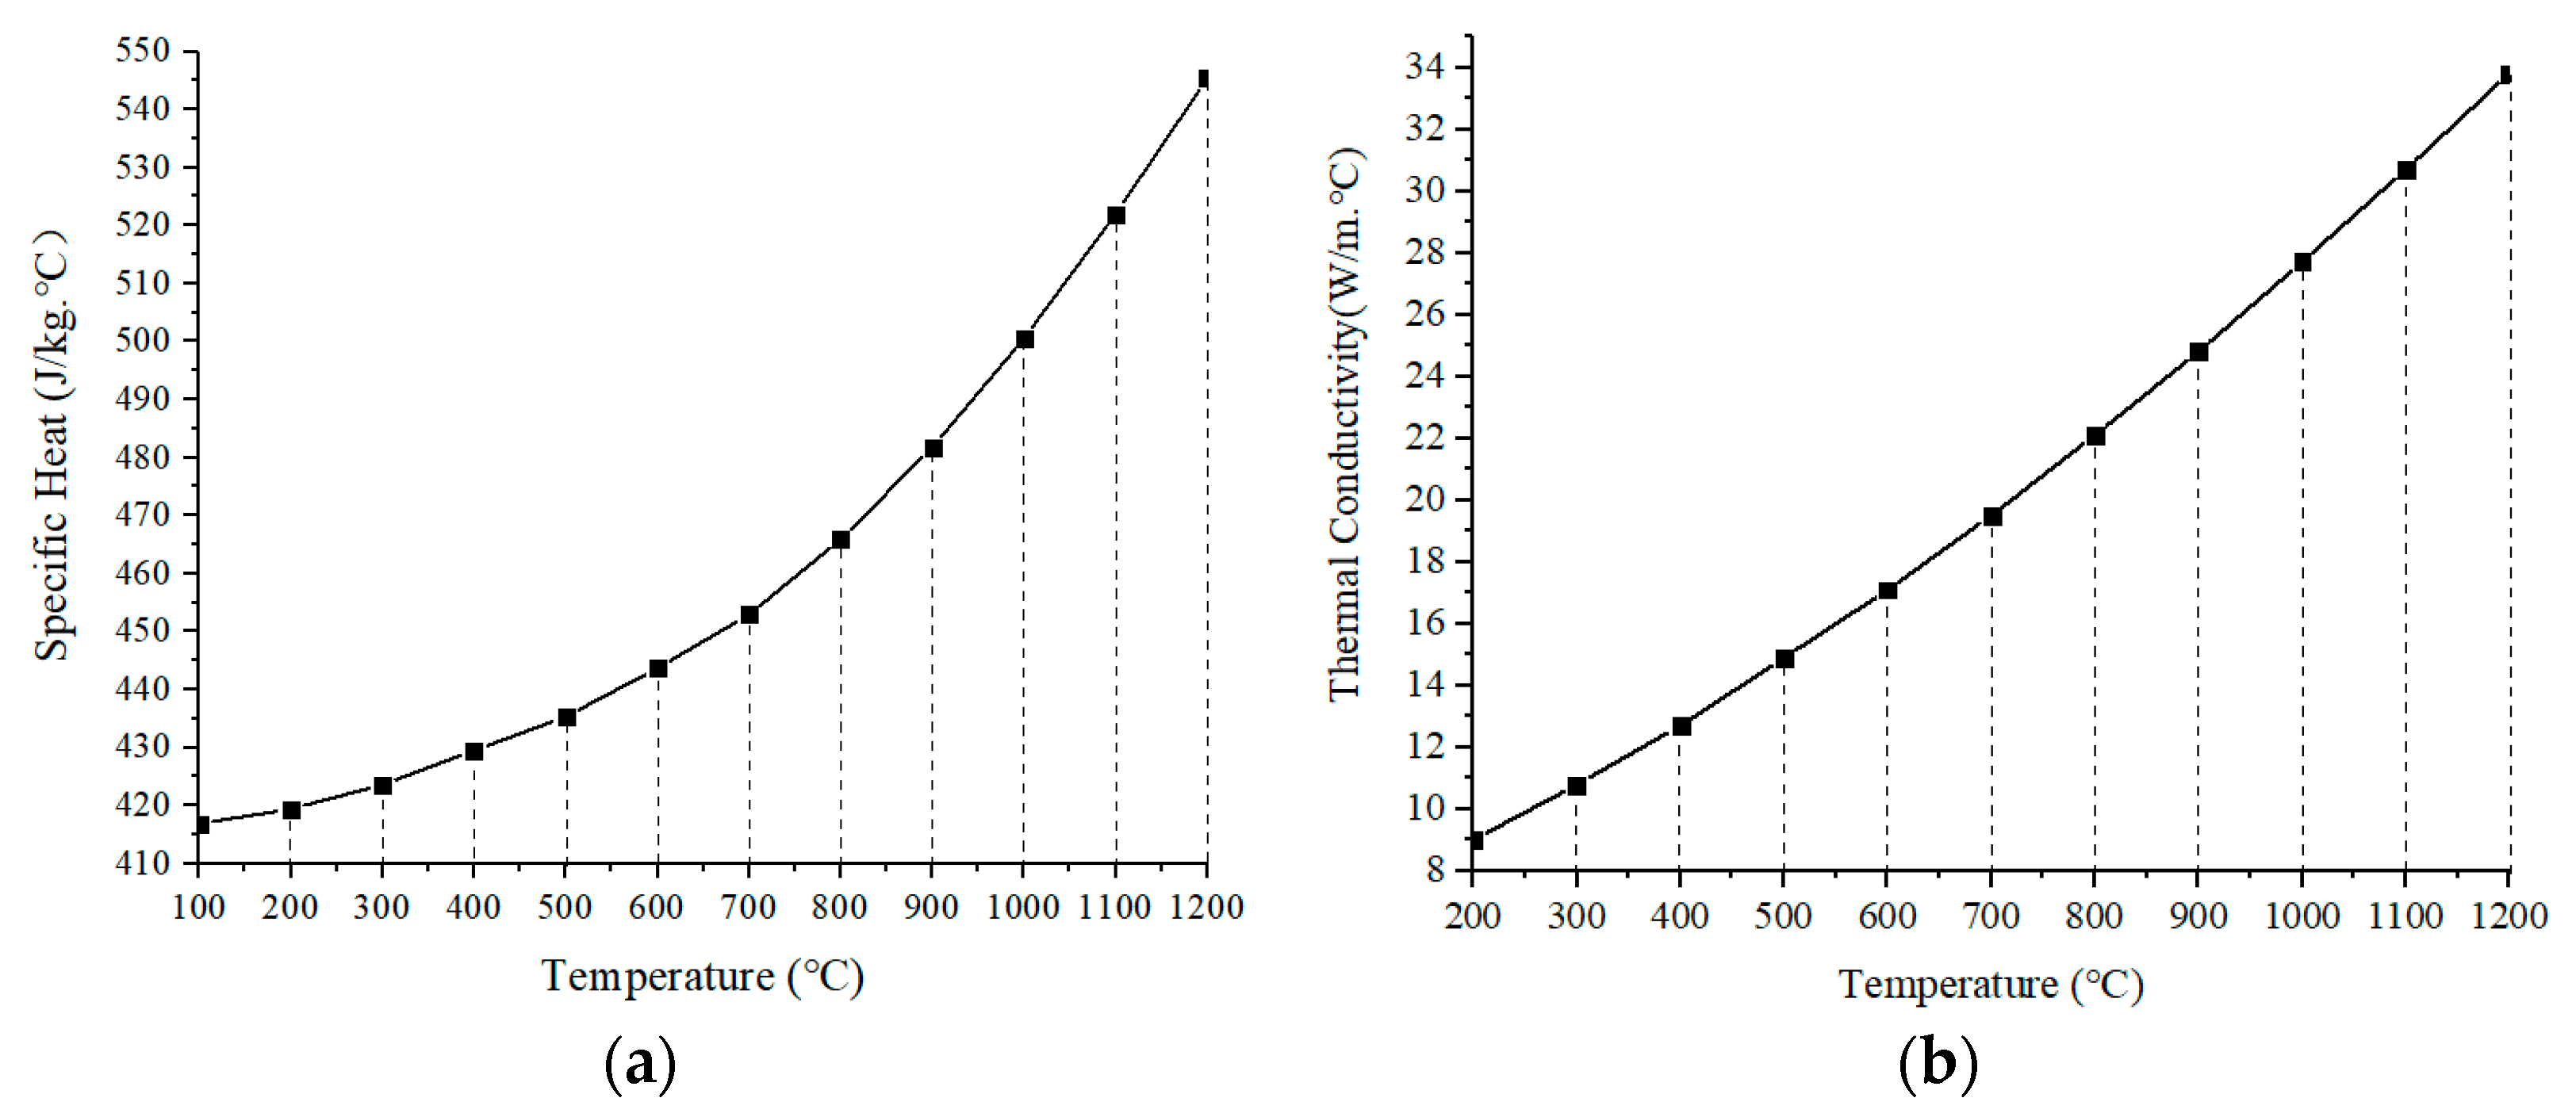
| Specific heat capacity of nickel (J/kg·°C) | |
| The laser energy attenuation rate | |
References
- Wang, J.J.; Dong, B.; Lally, E.; Gong, J.M.; Han, M.; Wang, A.B. Multiplexed high temperature sensing with sapphire fiber air gap-based extrinsic Fabry–Perot interferometers. Opt. Lett. 2010, 35, 619–621. [Google Scholar] [CrossRef] [PubMed]
- Du, C.; Xie, W.; Meng, S.; Yin, Y.; Jiao, L.; Song, L. The connection technology based on high temperature silica fiber optic sensor. Sens. Smart Struct. Technol. Civ. Mech. Aerosp. Syst. 2012, 8345, 823–830. [Google Scholar]
- Ngoi, B.K.A.; Paul, J.; Zhao, L.P.; Fang, Z.P. Enhanced lateral pressure tuning of fiber Bragg gratings by polymer packaging. Opt. Commun. 2004, 242, 425–430. [Google Scholar] [CrossRef]
- Zhan, Y.G.; Xiang, S.Q.; He, H.; Zhu, R.D.; Wang, X.Z. Study on high temperature optic fiber grating sensor. Chin. J. Lasers 2005, 32, 1236–1238. [Google Scholar]
- Bilro, L.; Alberto, N.; Pinto, J.L. A simple and low-cost cure monitoring system based on a side-polished plastic optical fiber. Meas. Sci. Technol. 2010, 21, 117001. [Google Scholar] [CrossRef]
- Tian, Z.H.; Zhao, Y.T.; Jiang, Y.J.; Ren, H.P. Investigation of microstructure and properties of FeCoCrNiAlMox alloy coatings prepared by broadband-beam laser cladding technology. J. Mater. Sci. 2020, 55, 4478–4492. [Google Scholar] [CrossRef]
- Grandal, T.; Zornoza, A.; Fraga, S.; Castro, G.; Sun, T. Laser cladding-based metallic embedding technique for fiber optic sensors. J. Lightwave Technol. 2018, 36, 1018–1025. [Google Scholar] [CrossRef]
- Havermann, D.; Mathew, J.; MacPherson, W.N. Temperature and strain measurements with fiber Bragg gratings embedded in stainless steel 316. J. Light Wave Technol. 2014, 33, 2474–2479. [Google Scholar] [CrossRef]
- Wu, J.Z.; Zhao, P.H.; Wei, H.Y.; Lin, Q.D.; Zhang, Y. Development of powder distribution model of discontinuous coaxial powder stream in laser direct metal deposition. Powder Technol. 2018, 340, 449–458. [Google Scholar] [CrossRef]
- Statsenko, P.A.; Khomyakov, M.N. Numerical simulation in the diffraction approximation of laser radiation interaction with a stream of microparticles. Thermophys. Aeromech. 2020, 27, 417–424. [Google Scholar] [CrossRef]
- Yin, J.; Yang, L.L.; Yang, X.; Zhu, H.; Wang, D.; Zeng, X. A High-power laser-matter interaction during laser powder bed fusion. Addit. Manuf. 2019, 29, 100778. [Google Scholar]
- Huang, Y.L.; Liang, G.Y.; Su, J.Y.; Li, J.G. Interaction between laser beam and powder stream in the process of laser cladding with powder feeding. Model. Simul. Mater. Sci. Eng. 2004, 13, 47–56. [Google Scholar] [CrossRef]
- Shen, W.G.; Cen, H. Study on Laser Transmittance in Coaxial Laser Cladding. J. Mech. Eng. 2014, 50, 59–65. [Google Scholar] [CrossRef]
- Tabernero, I.; Lamikiz, A.; Martínez, S. Modelling of energy attenuation due to powder flow-laser beam interaction during laser cladding process. J. Mater. Processing Technol. 2012, 212, 516–522. [Google Scholar] [CrossRef]
- Wang, J.; Han, F.; Chen, S. A novel model of laser energy attenuation by powder particles for laser solid forming. Int. J. Mach. Tools Manuf. 2019, 145, 103440. [Google Scholar] [CrossRef]
- Wu, J.Z.; Liu, T.W.; Chen, H.Y.; Lia, F.Z.; Wei, H.Y. Simulation of laser attenuation and heat transport during direct metal deposition considering beam profile. J. Mater. Processing Technol. 2019, 270, 92–105. [Google Scholar]
- Loh, L.E.; Chua, C.K.; Yeong, W.Y. Numerical investigation and an effective modelling on the Selective Laser Melting (SLM) process with aluminium alloy 6061. Int. J. Heat Mass Transf. 2015, 80, 288–300. [Google Scholar] [CrossRef]


| Parameter | Unit | Value | Parameter | Unit | Value |
|---|---|---|---|---|---|
| 1~10 | 2, 3, 4, 5 | ||||
| 9, 12, 15, 18 | 3 | ||||
| 2, 4, 6, 8 | η | (%) | 35 | ||
| 61, 75, 96, 150 | / | 30°, 45°, 57.5°, 60° |
| Parameter | η (%) | |||||||
|---|---|---|---|---|---|---|---|---|
| Value | 4 | 15 | 4 | 75 | 3 | 3 | 35 | 57.5° |
| Power | Powder Feeding Speed | Power Loss | The Molten Pool |
|---|---|---|---|
| 12 g/min | 0.01 db | 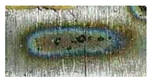 | |
| 500 W | 15 g/min | 1.4 db | 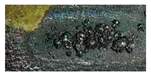 |
| 18 g/min | 5.36 db | 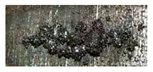 | |
| 12 g/min | 1.2 db | 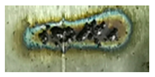 | |
| 600 W | 15 g/min | 9.01 db |  |
| 18 g/min | 24.47 db |  | |
| 12 g/min | 7.77 db | 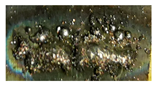 | |
| 700 W | 15 g/min | 2.91 db | 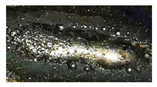 |
| 18 g/min | 34.63 db | 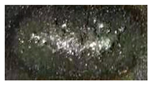 | |
| 800 W | —— | Fracture | 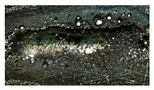 |
Publisher’s Note: MDPI stays neutral with regard to jurisdictional claims in published maps and institutional affiliations. |
© 2022 by the authors. Licensee MDPI, Basel, Switzerland. This article is an open access article distributed under the terms and conditions of the Creative Commons Attribution (CC BY) license (https://creativecommons.org/licenses/by/4.0/).
Share and Cite
Yang, C.; Tan, Y.; Liu, Y.; Xia, P.; Cui, Y.; Zheng, B. Modeling and Optimization of Laser Cladding Fixation Process for Optical Fiber Sensors in Harsh Environments. Sensors 2022, 22, 2569. https://doi.org/10.3390/s22072569
Yang C, Tan Y, Liu Y, Xia P, Cui Y, Zheng B. Modeling and Optimization of Laser Cladding Fixation Process for Optical Fiber Sensors in Harsh Environments. Sensors. 2022; 22(7):2569. https://doi.org/10.3390/s22072569
Chicago/Turabian StyleYang, Caixia, Yuegang Tan, Yi Liu, Ping Xia, Yinghao Cui, and Bo Zheng. 2022. "Modeling and Optimization of Laser Cladding Fixation Process for Optical Fiber Sensors in Harsh Environments" Sensors 22, no. 7: 2569. https://doi.org/10.3390/s22072569
APA StyleYang, C., Tan, Y., Liu, Y., Xia, P., Cui, Y., & Zheng, B. (2022). Modeling and Optimization of Laser Cladding Fixation Process for Optical Fiber Sensors in Harsh Environments. Sensors, 22(7), 2569. https://doi.org/10.3390/s22072569