
Long-Term Polygraphic Monitoring through MEMS and Charge Transfer for Low-Power Wearable Applications

 ,
,  , , ,
, , ,  ,
, 
Abstract
:1. Introduction
2. Materials and Methods
2.1. Hardware Setup
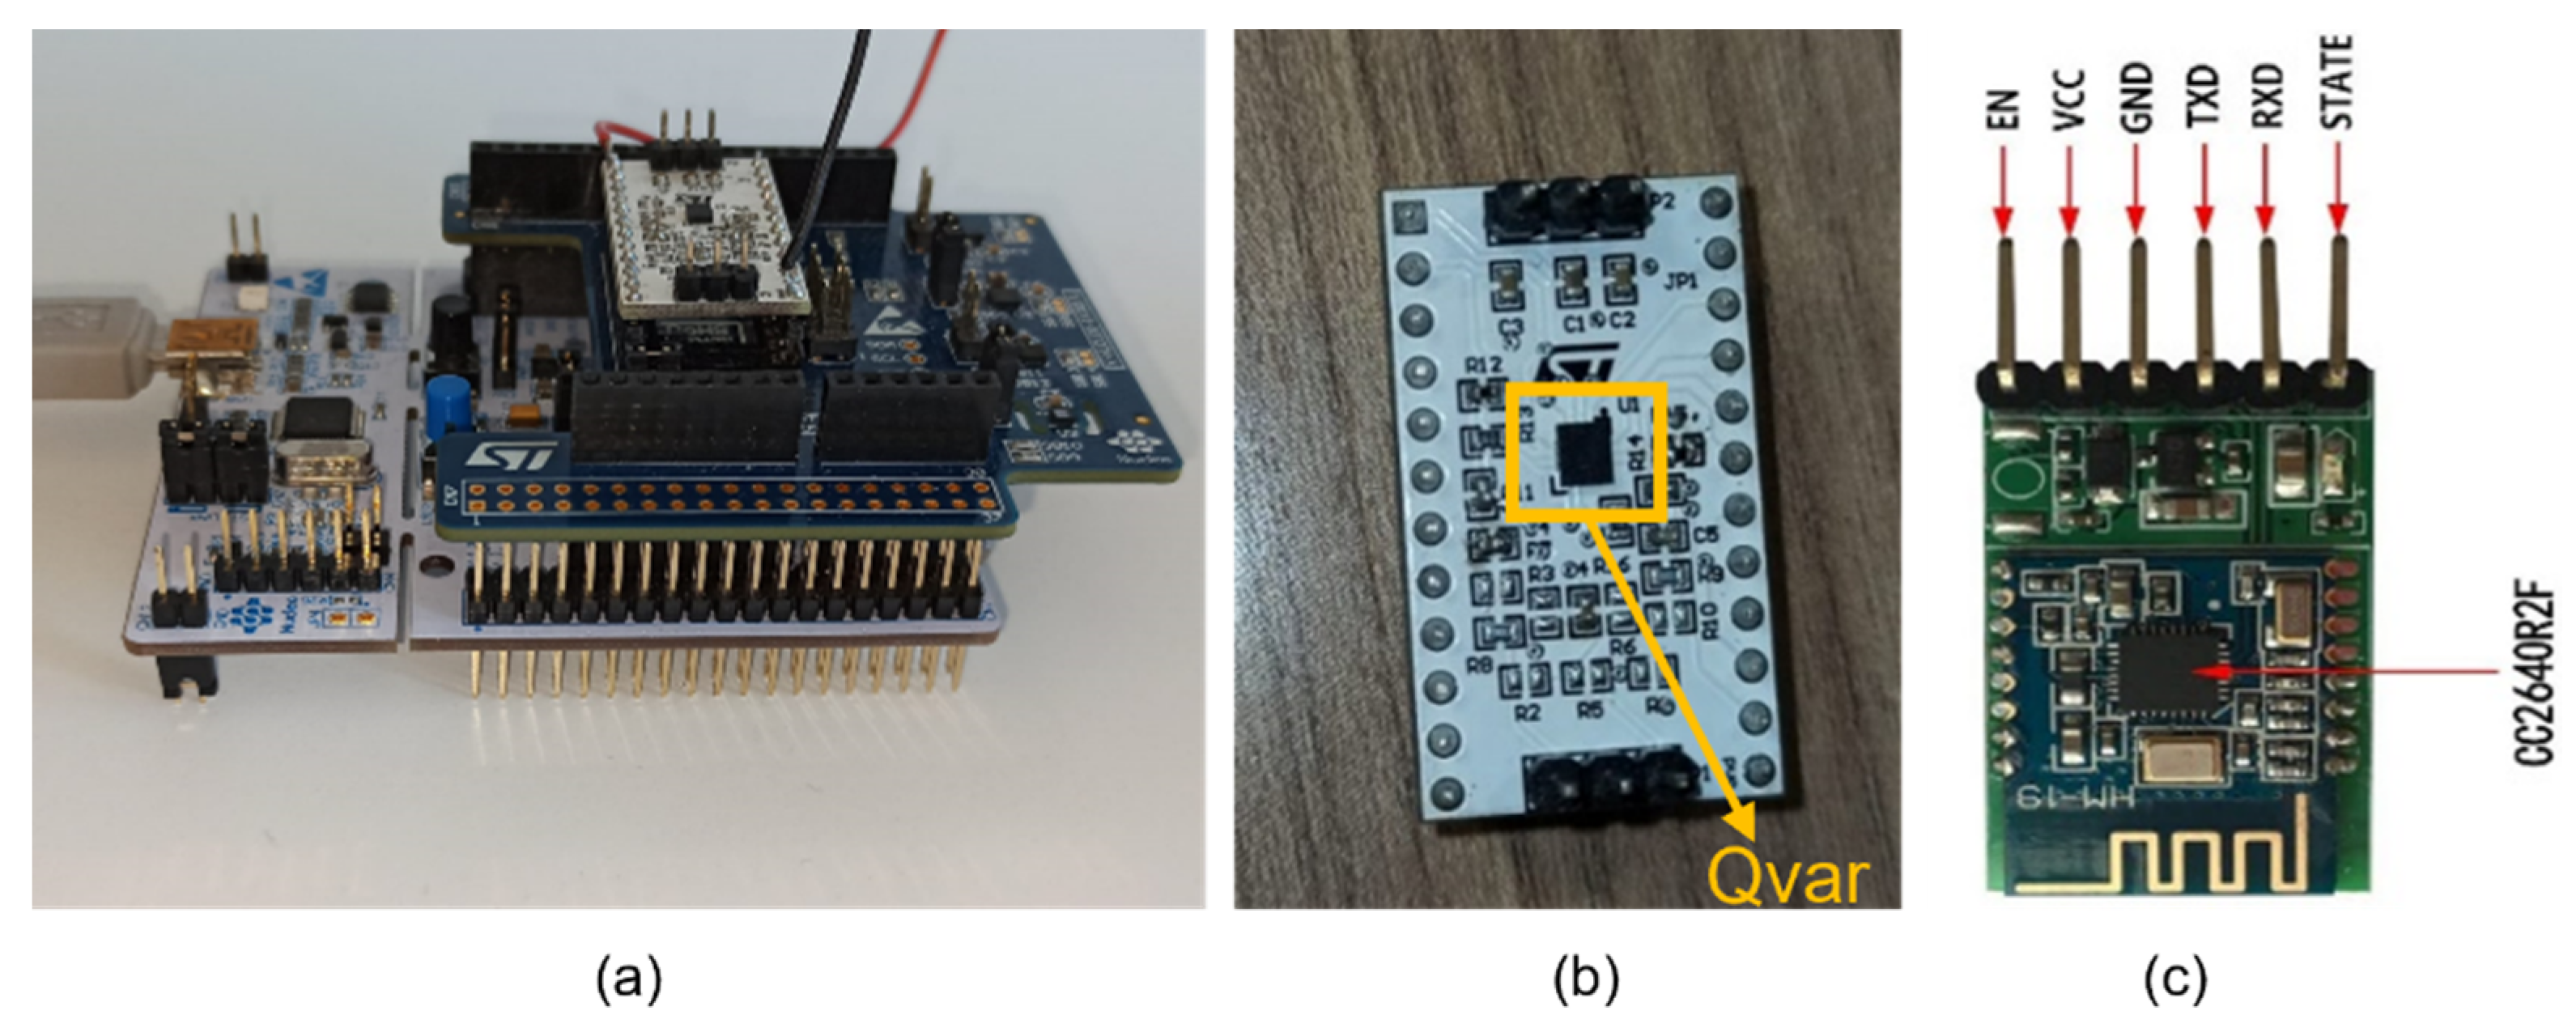
2.1.1. Sensing Unit
2.1.2. ST-Qvar Working Principle
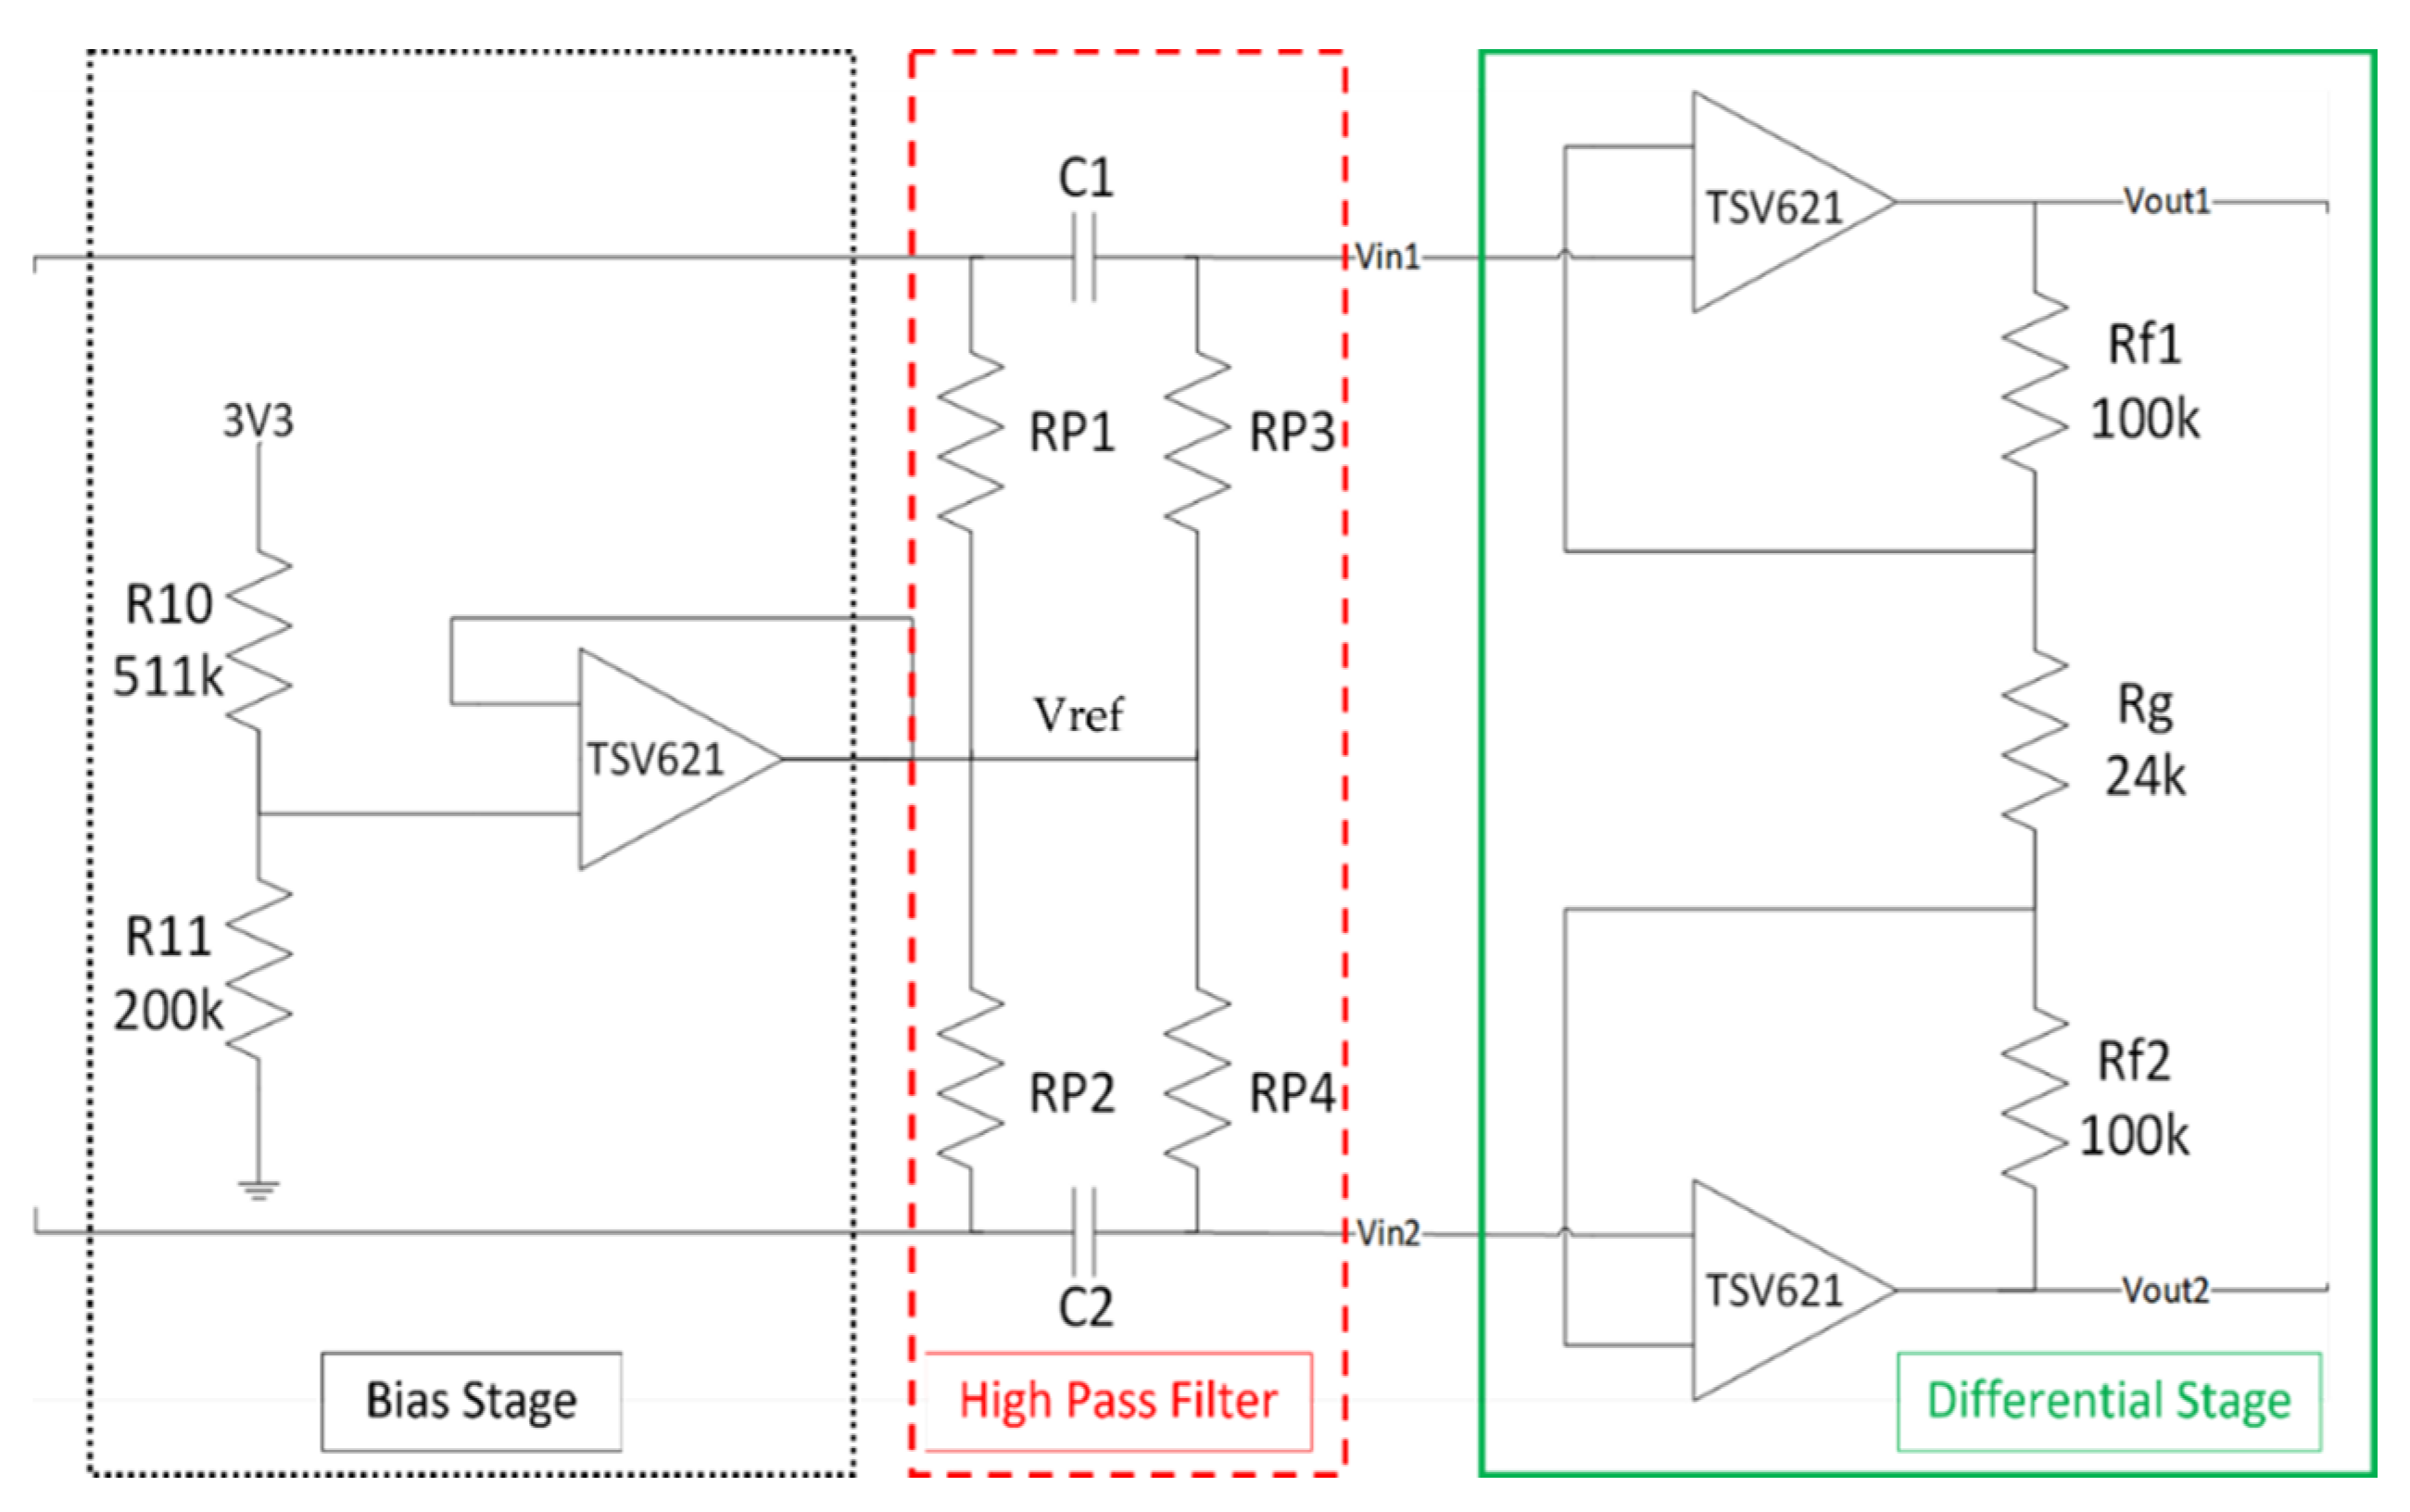
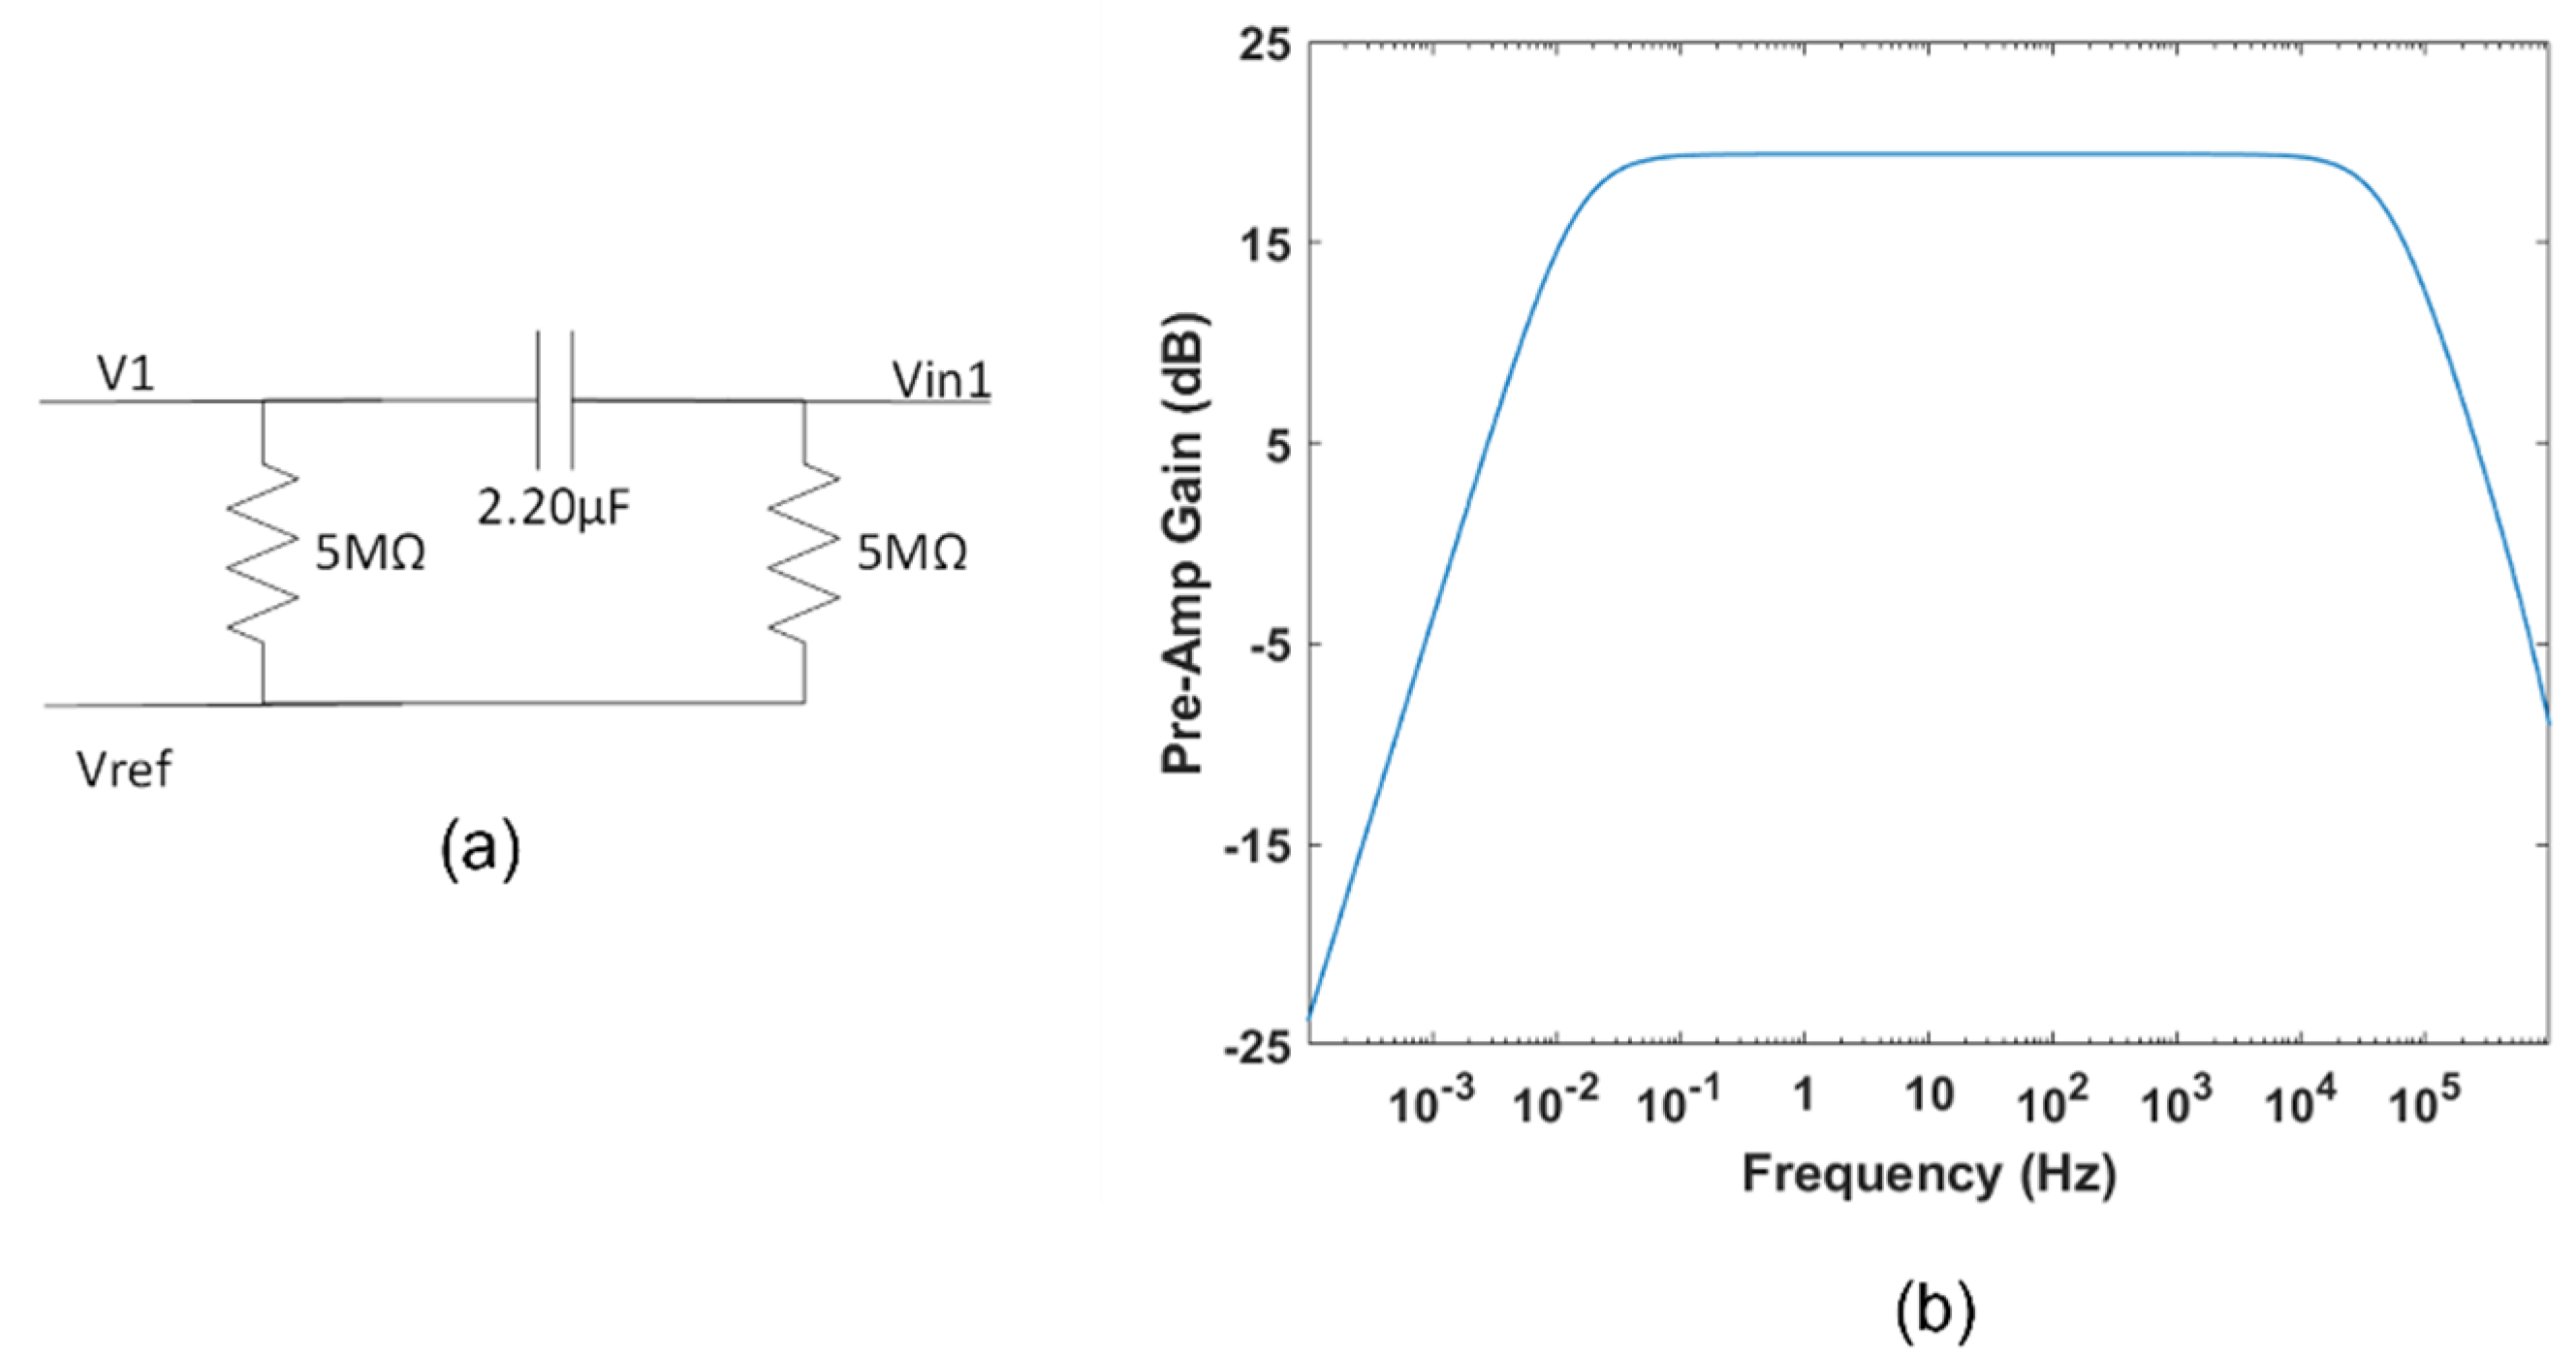
2.1.3. Pre-Amplification Circuit
2.1.4. Bias Stage
2.1.5. High-Pass Filter
2.1.6. Fully Differential Stage
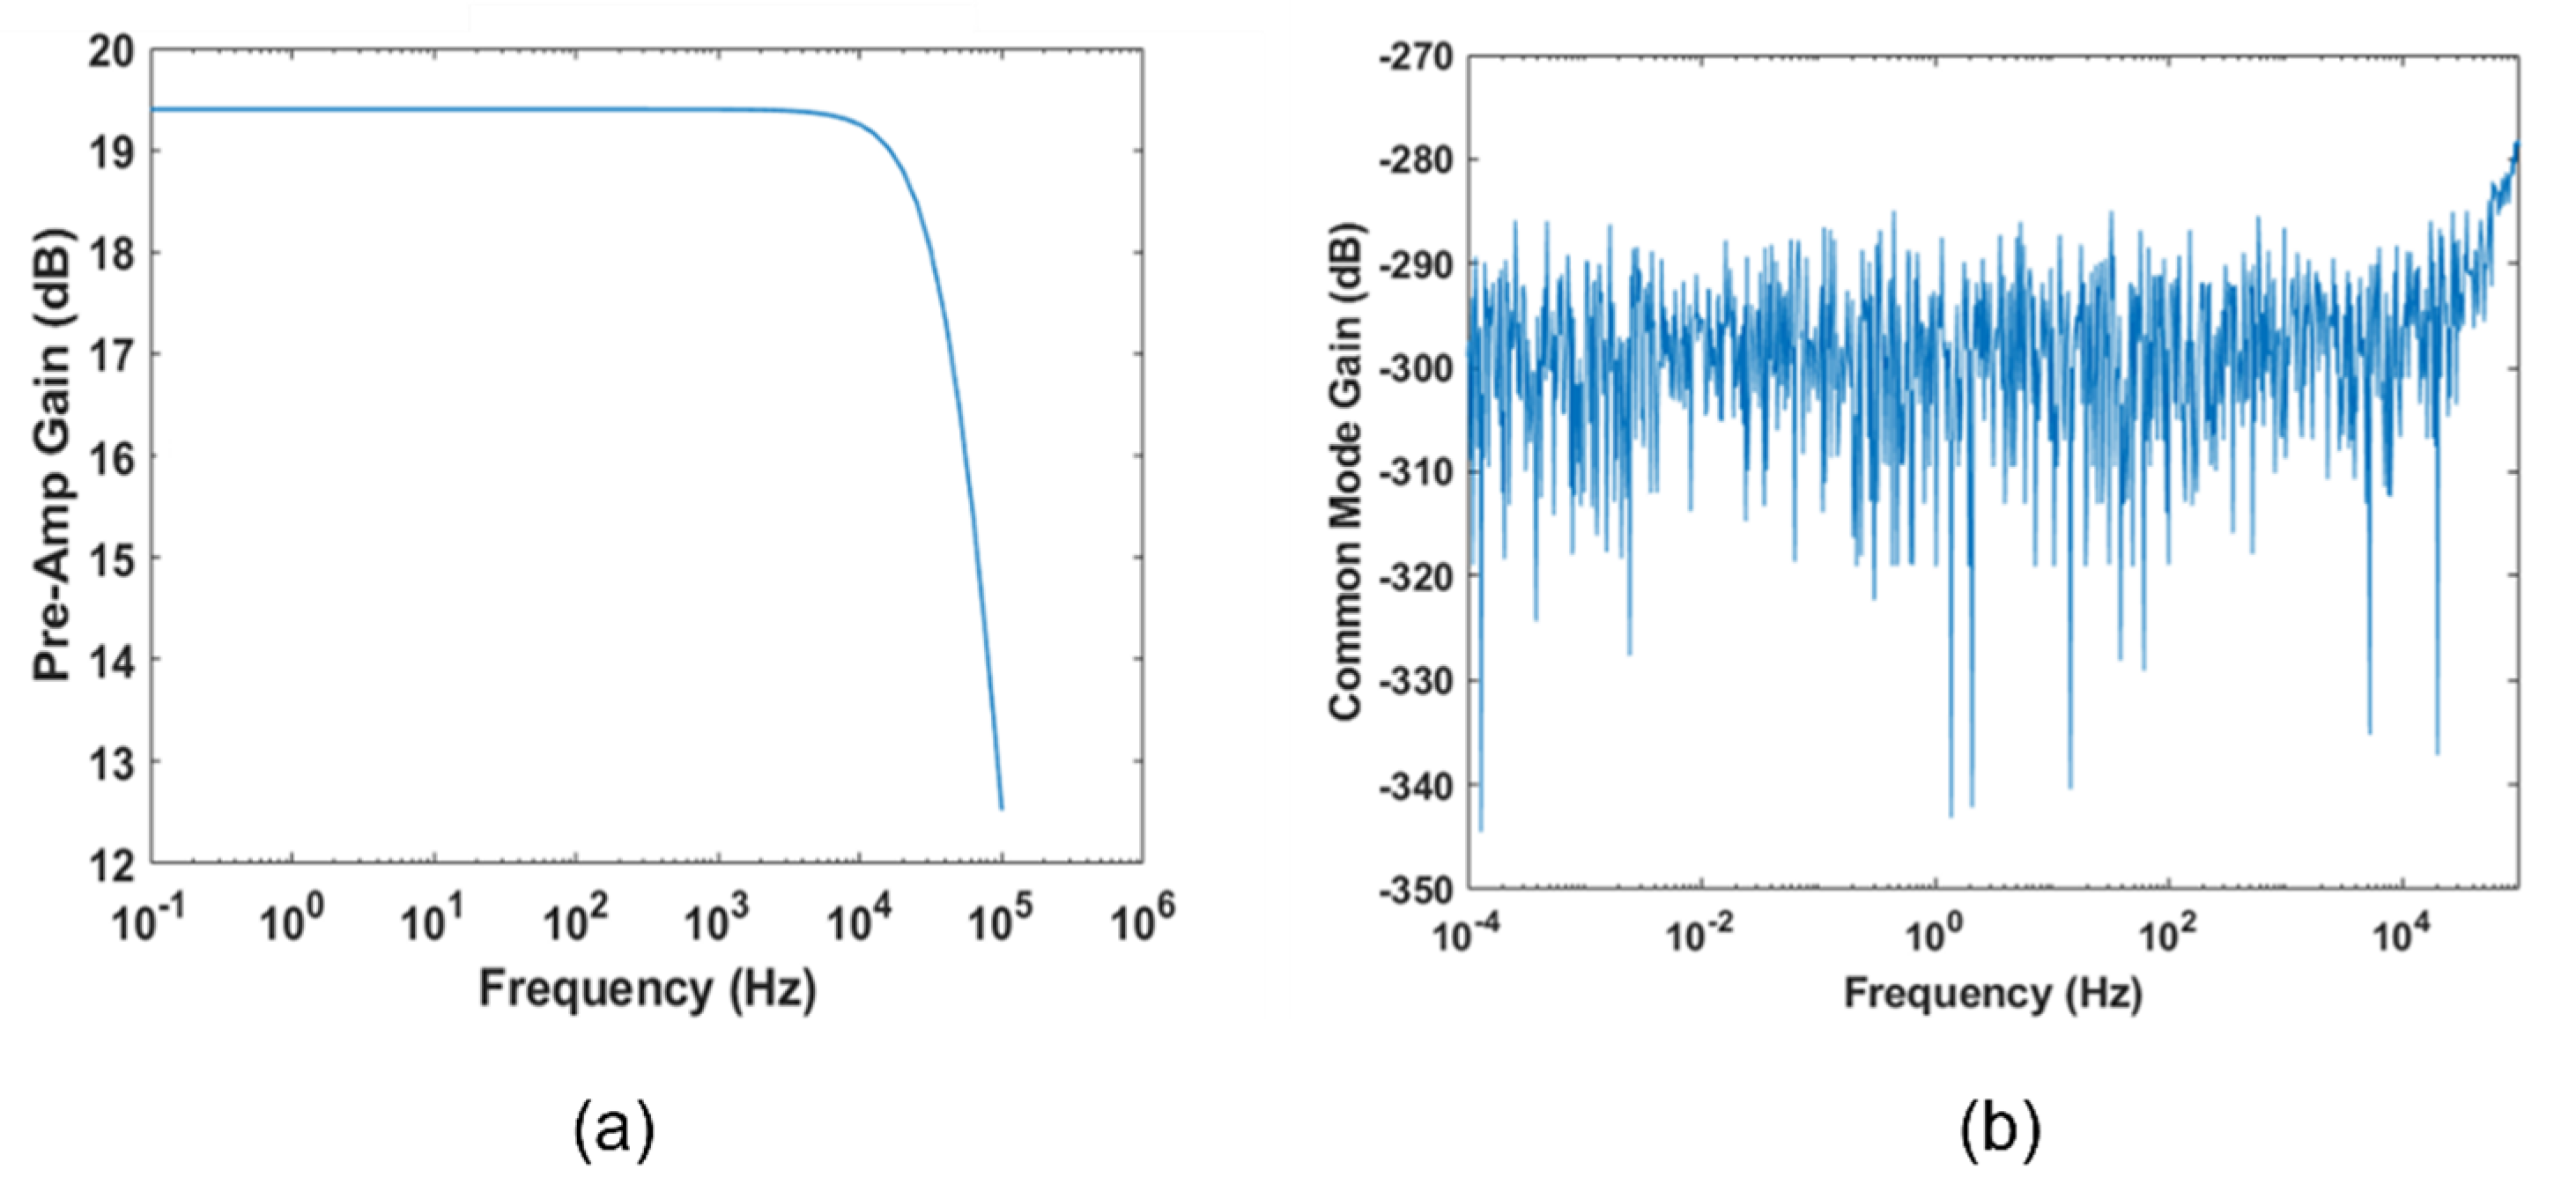
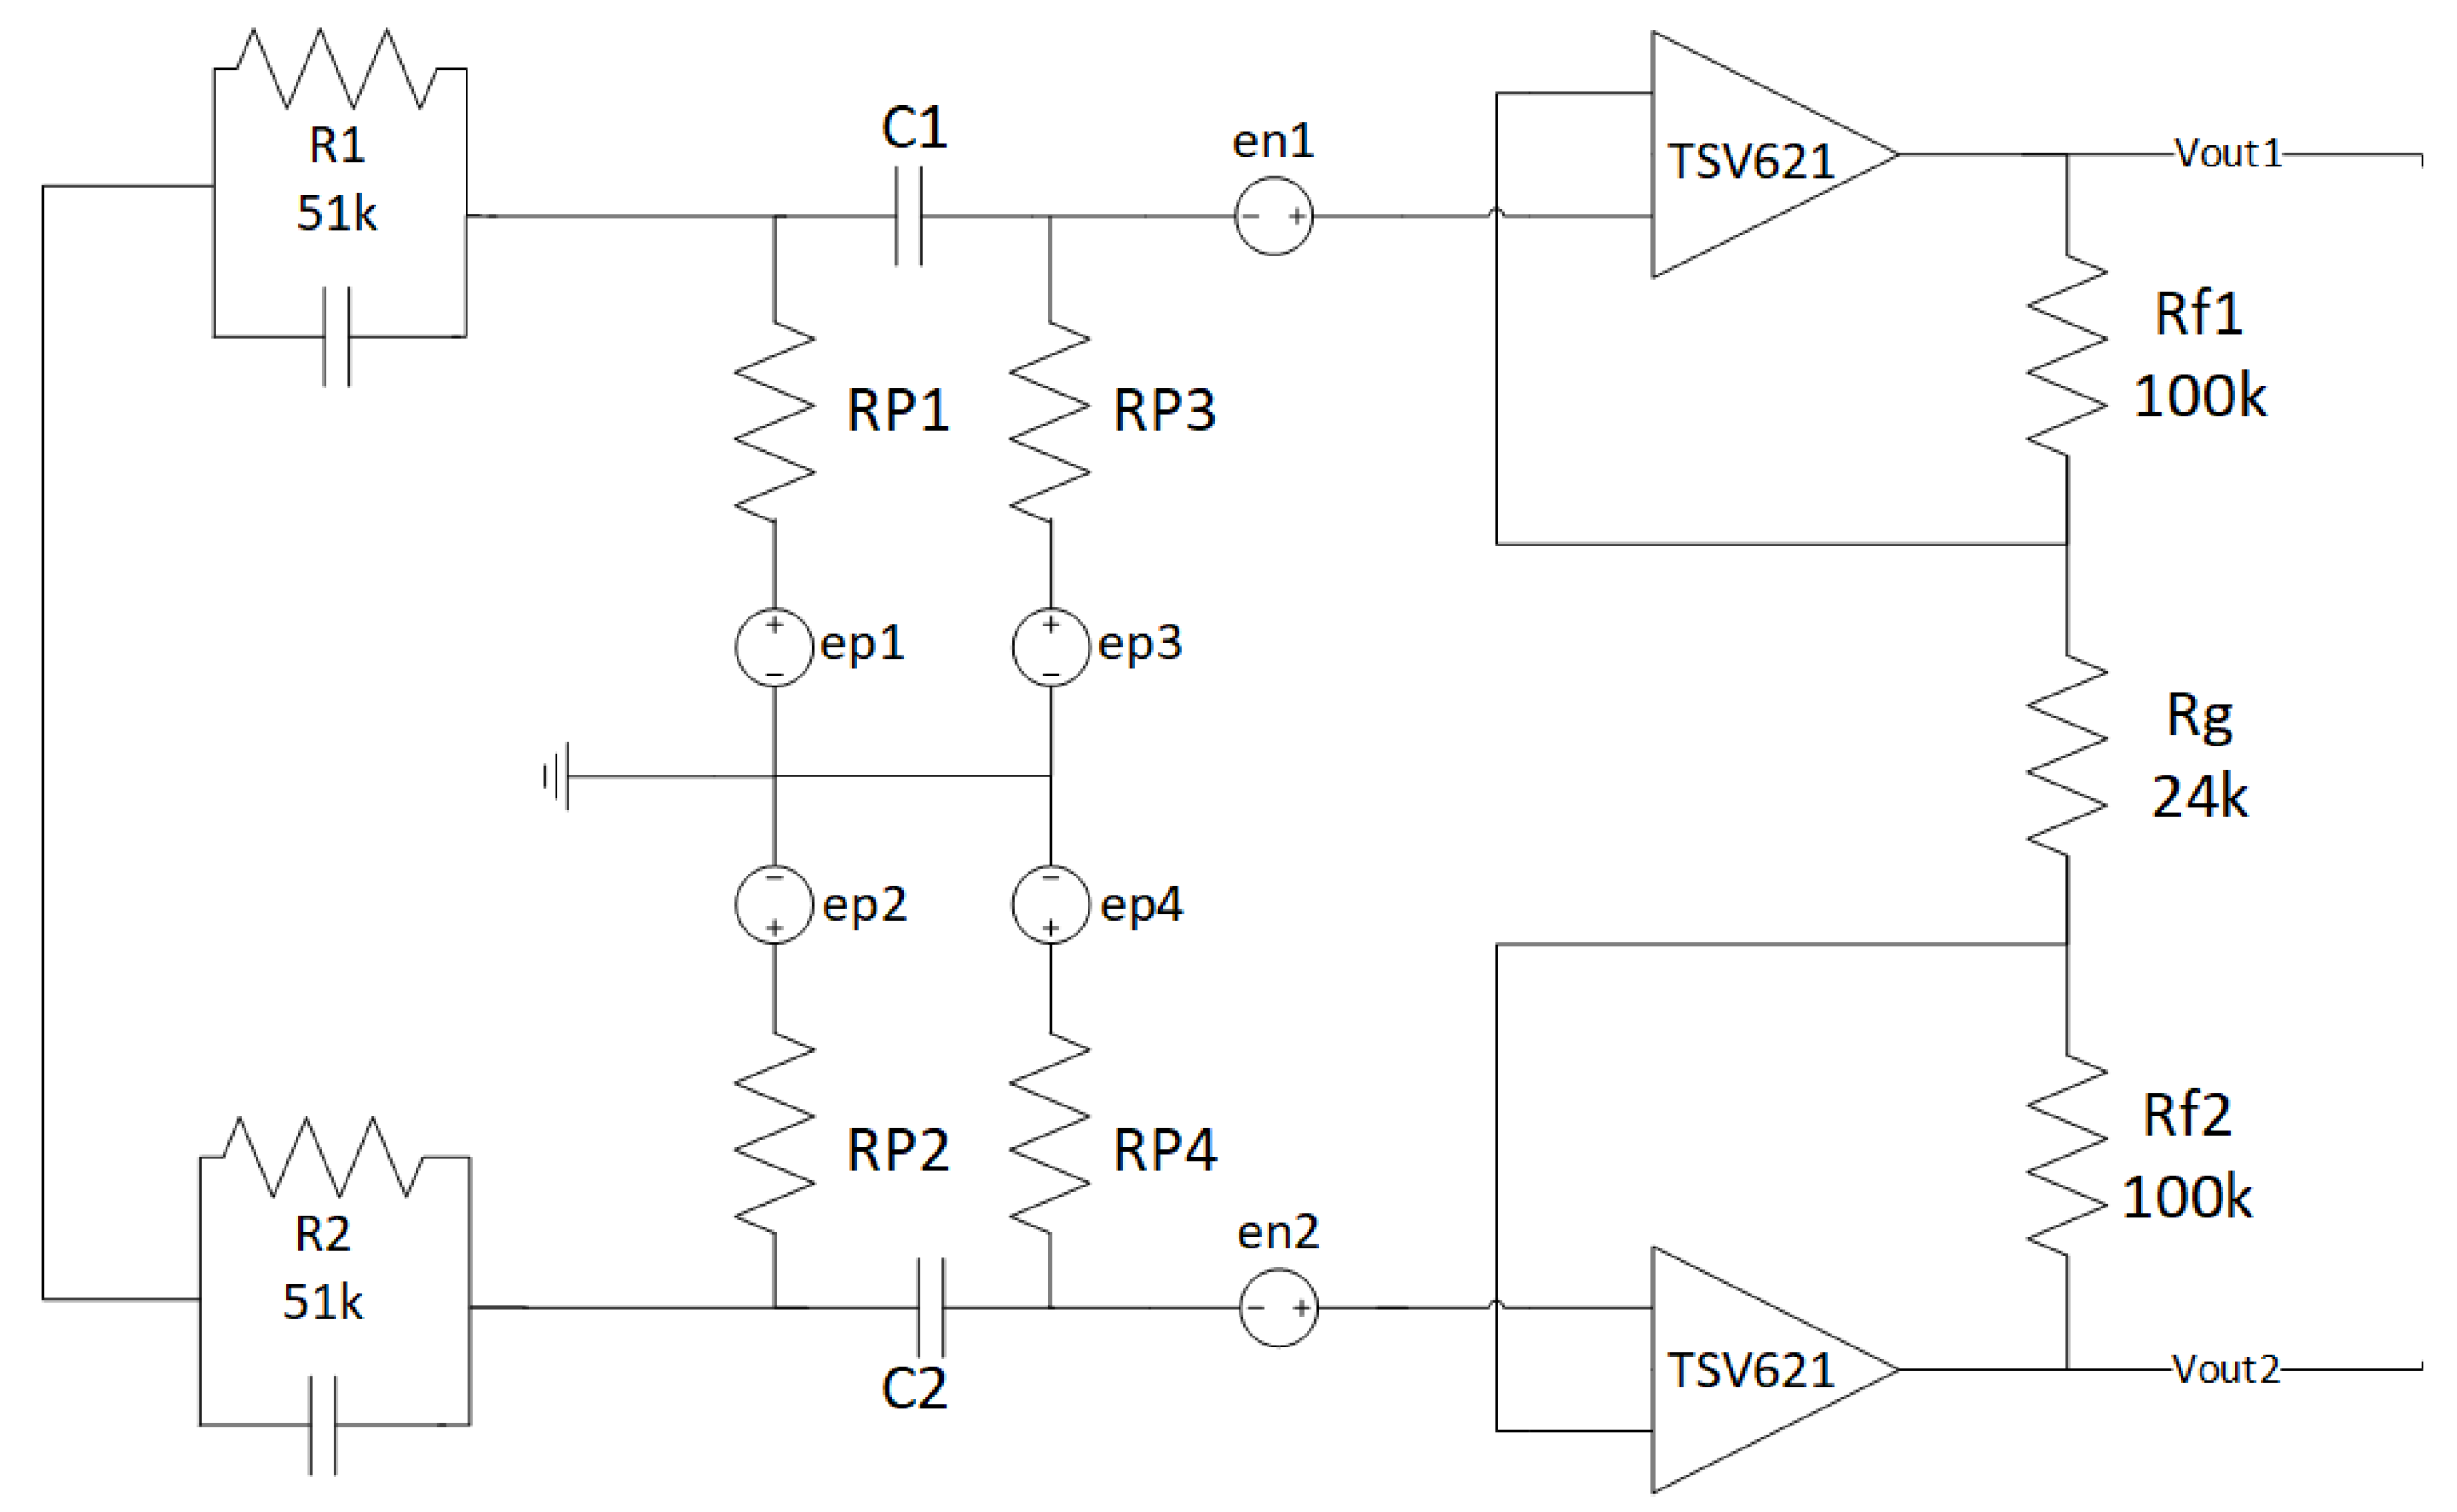
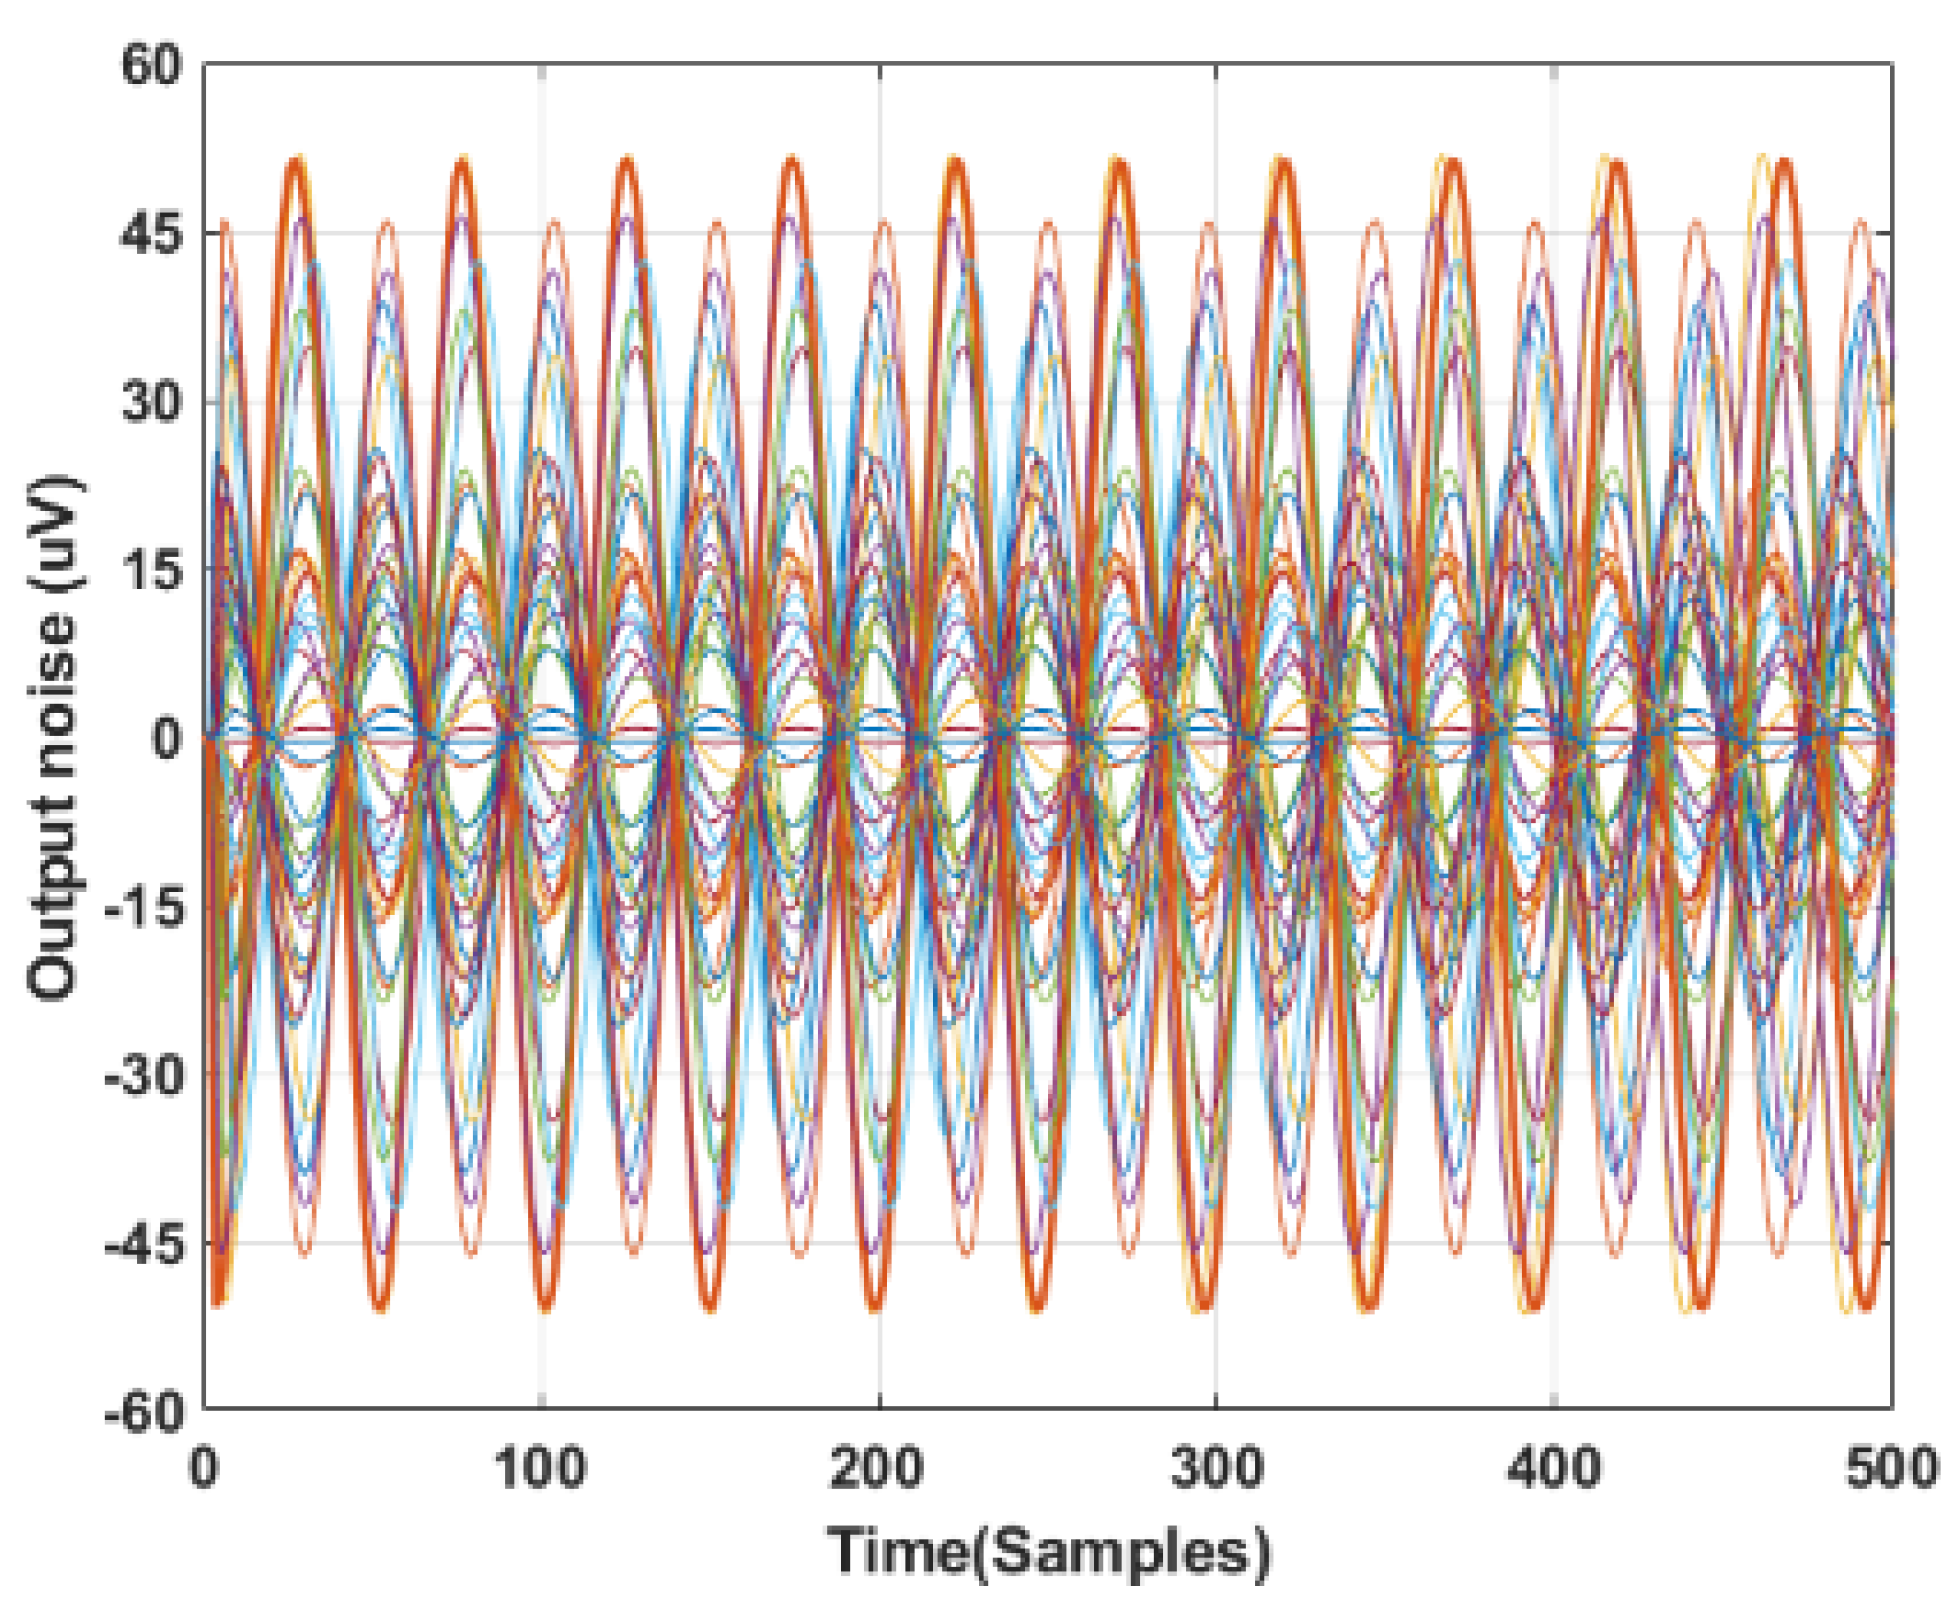
2.1.7. Noise Simulations
- Zep = ∞.
- Zep = 0.
2.1.8. HM-19 Bluetooth Low Energy Module
2.1.9. Receiver Unit
2.2. Firmware Description
3. Tests and Discussion
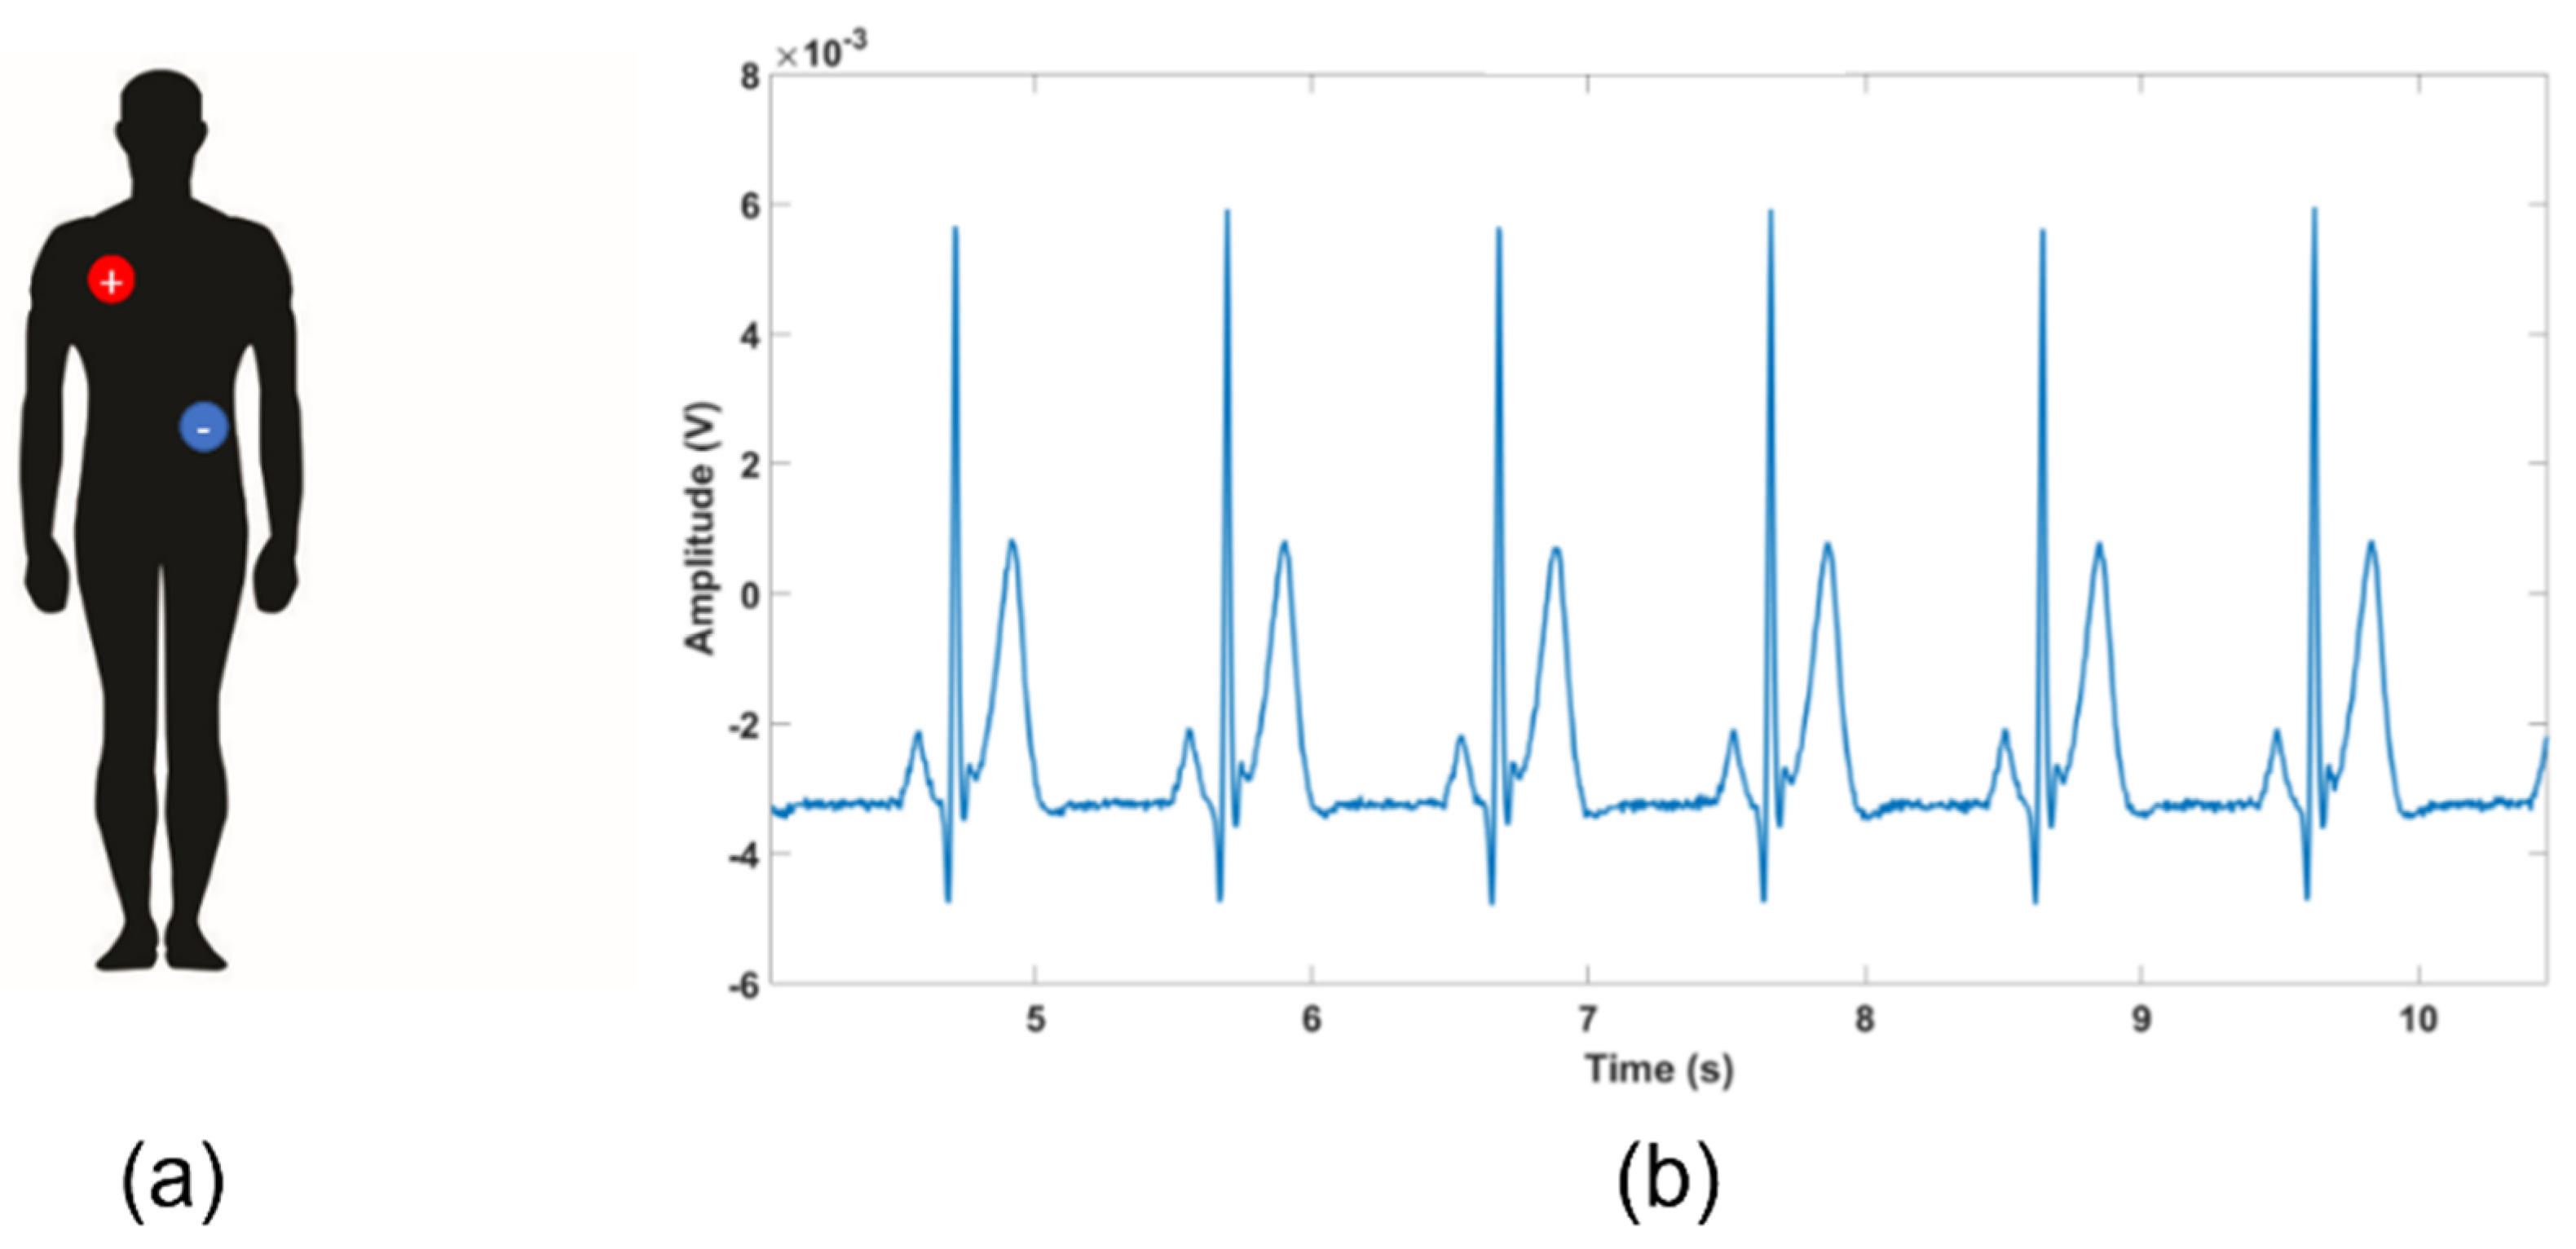
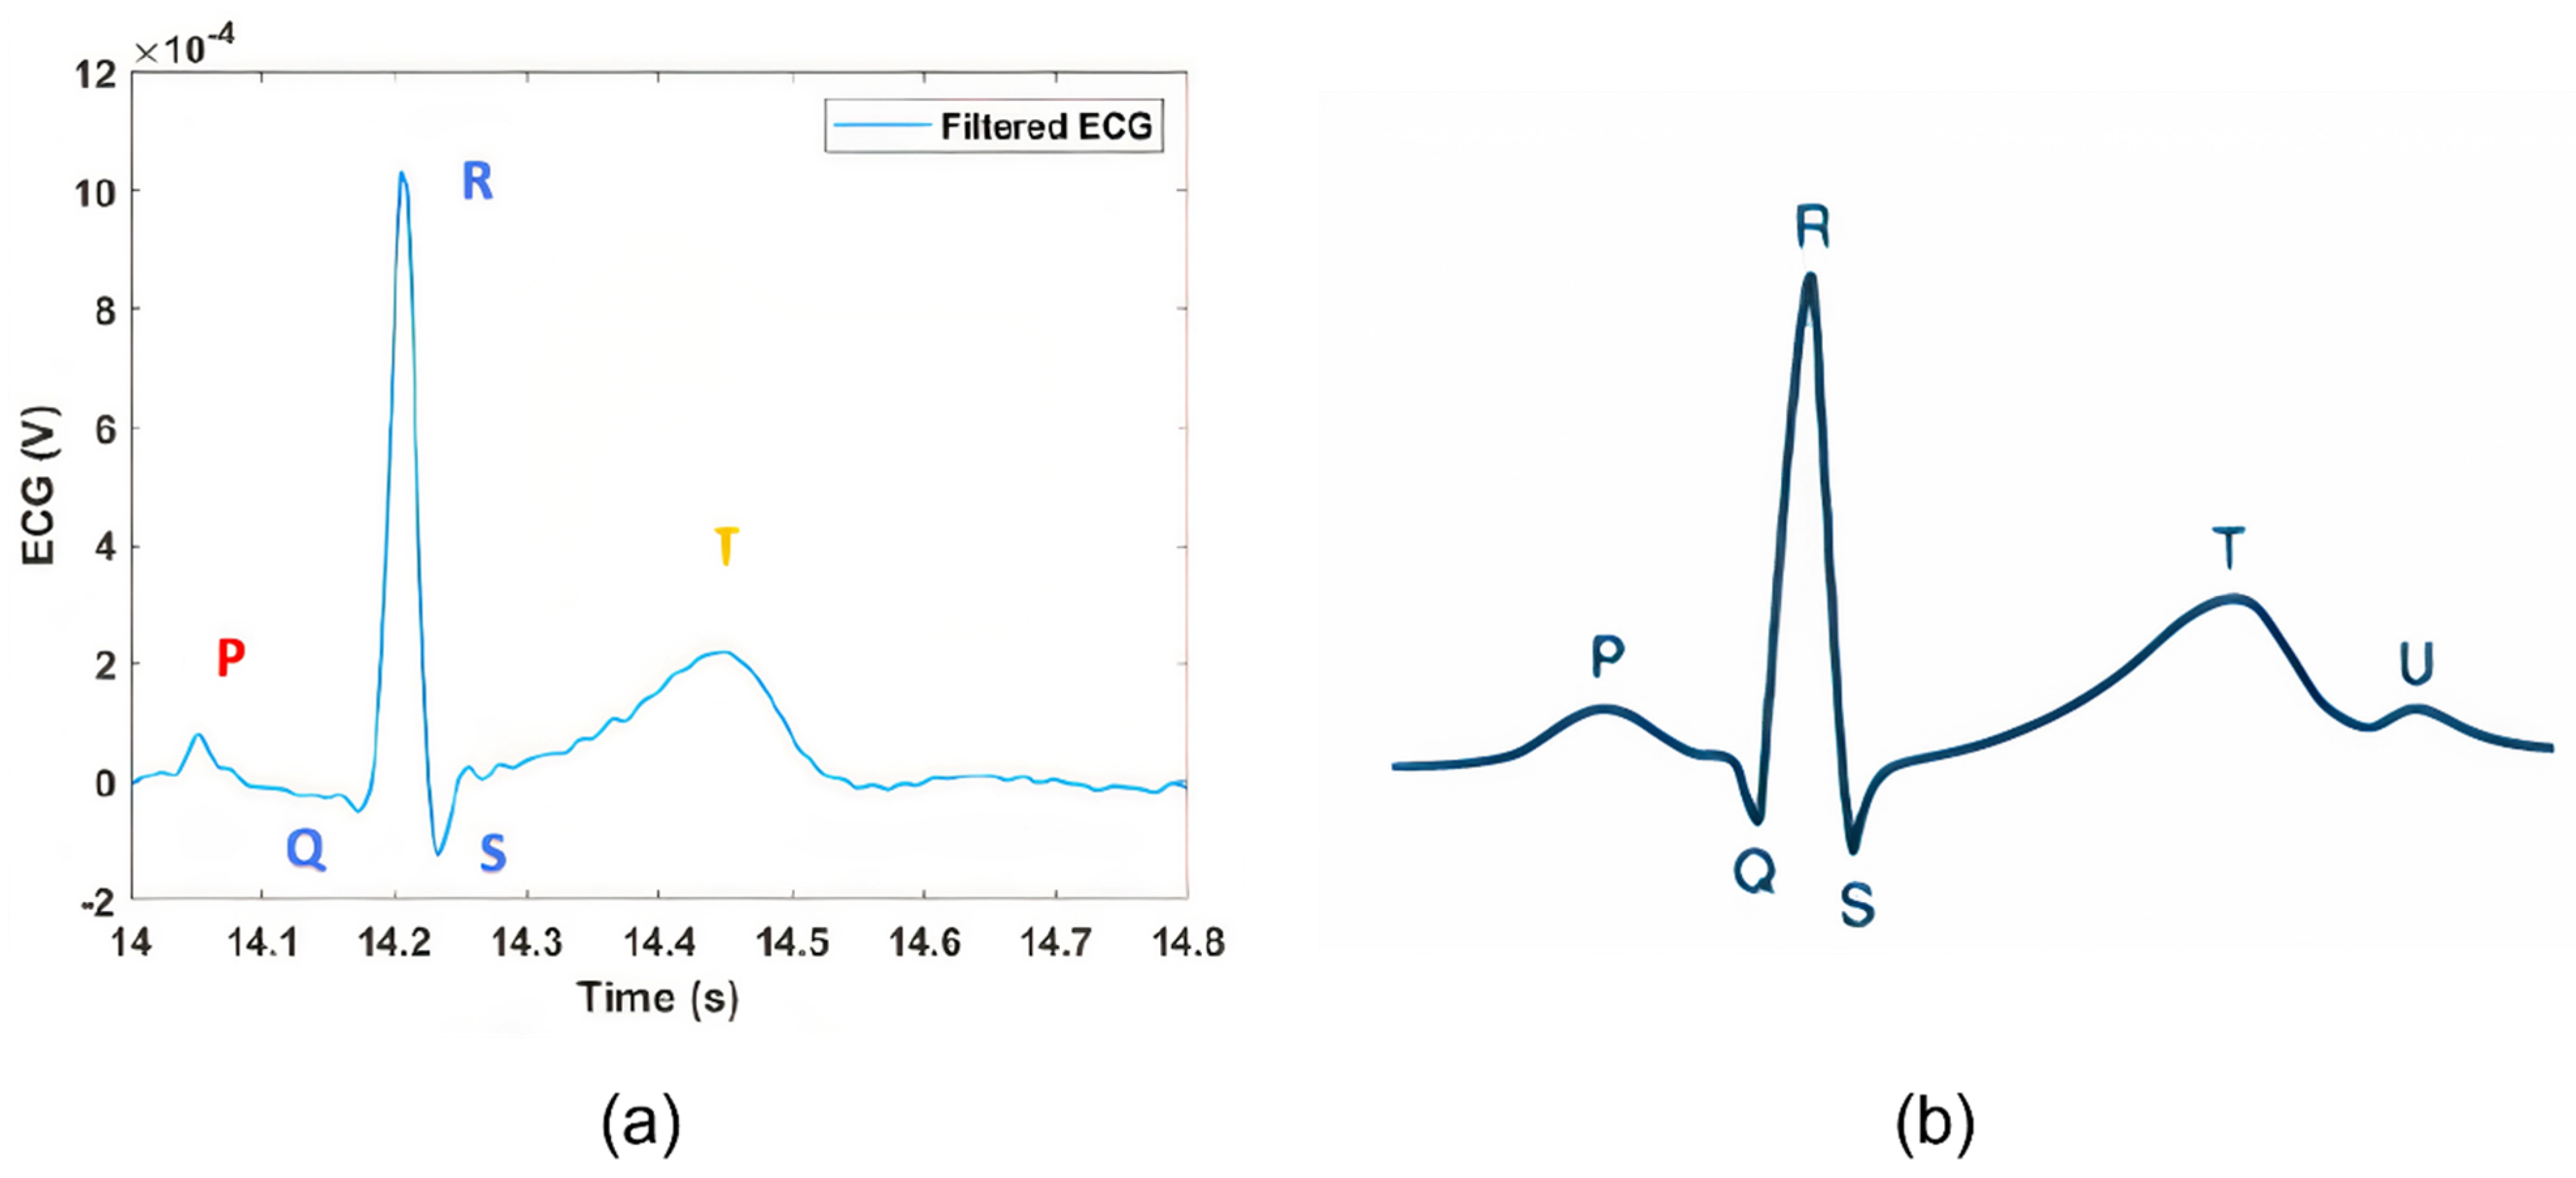
3.1. ECG Test: Qvar vs. Gold Standard
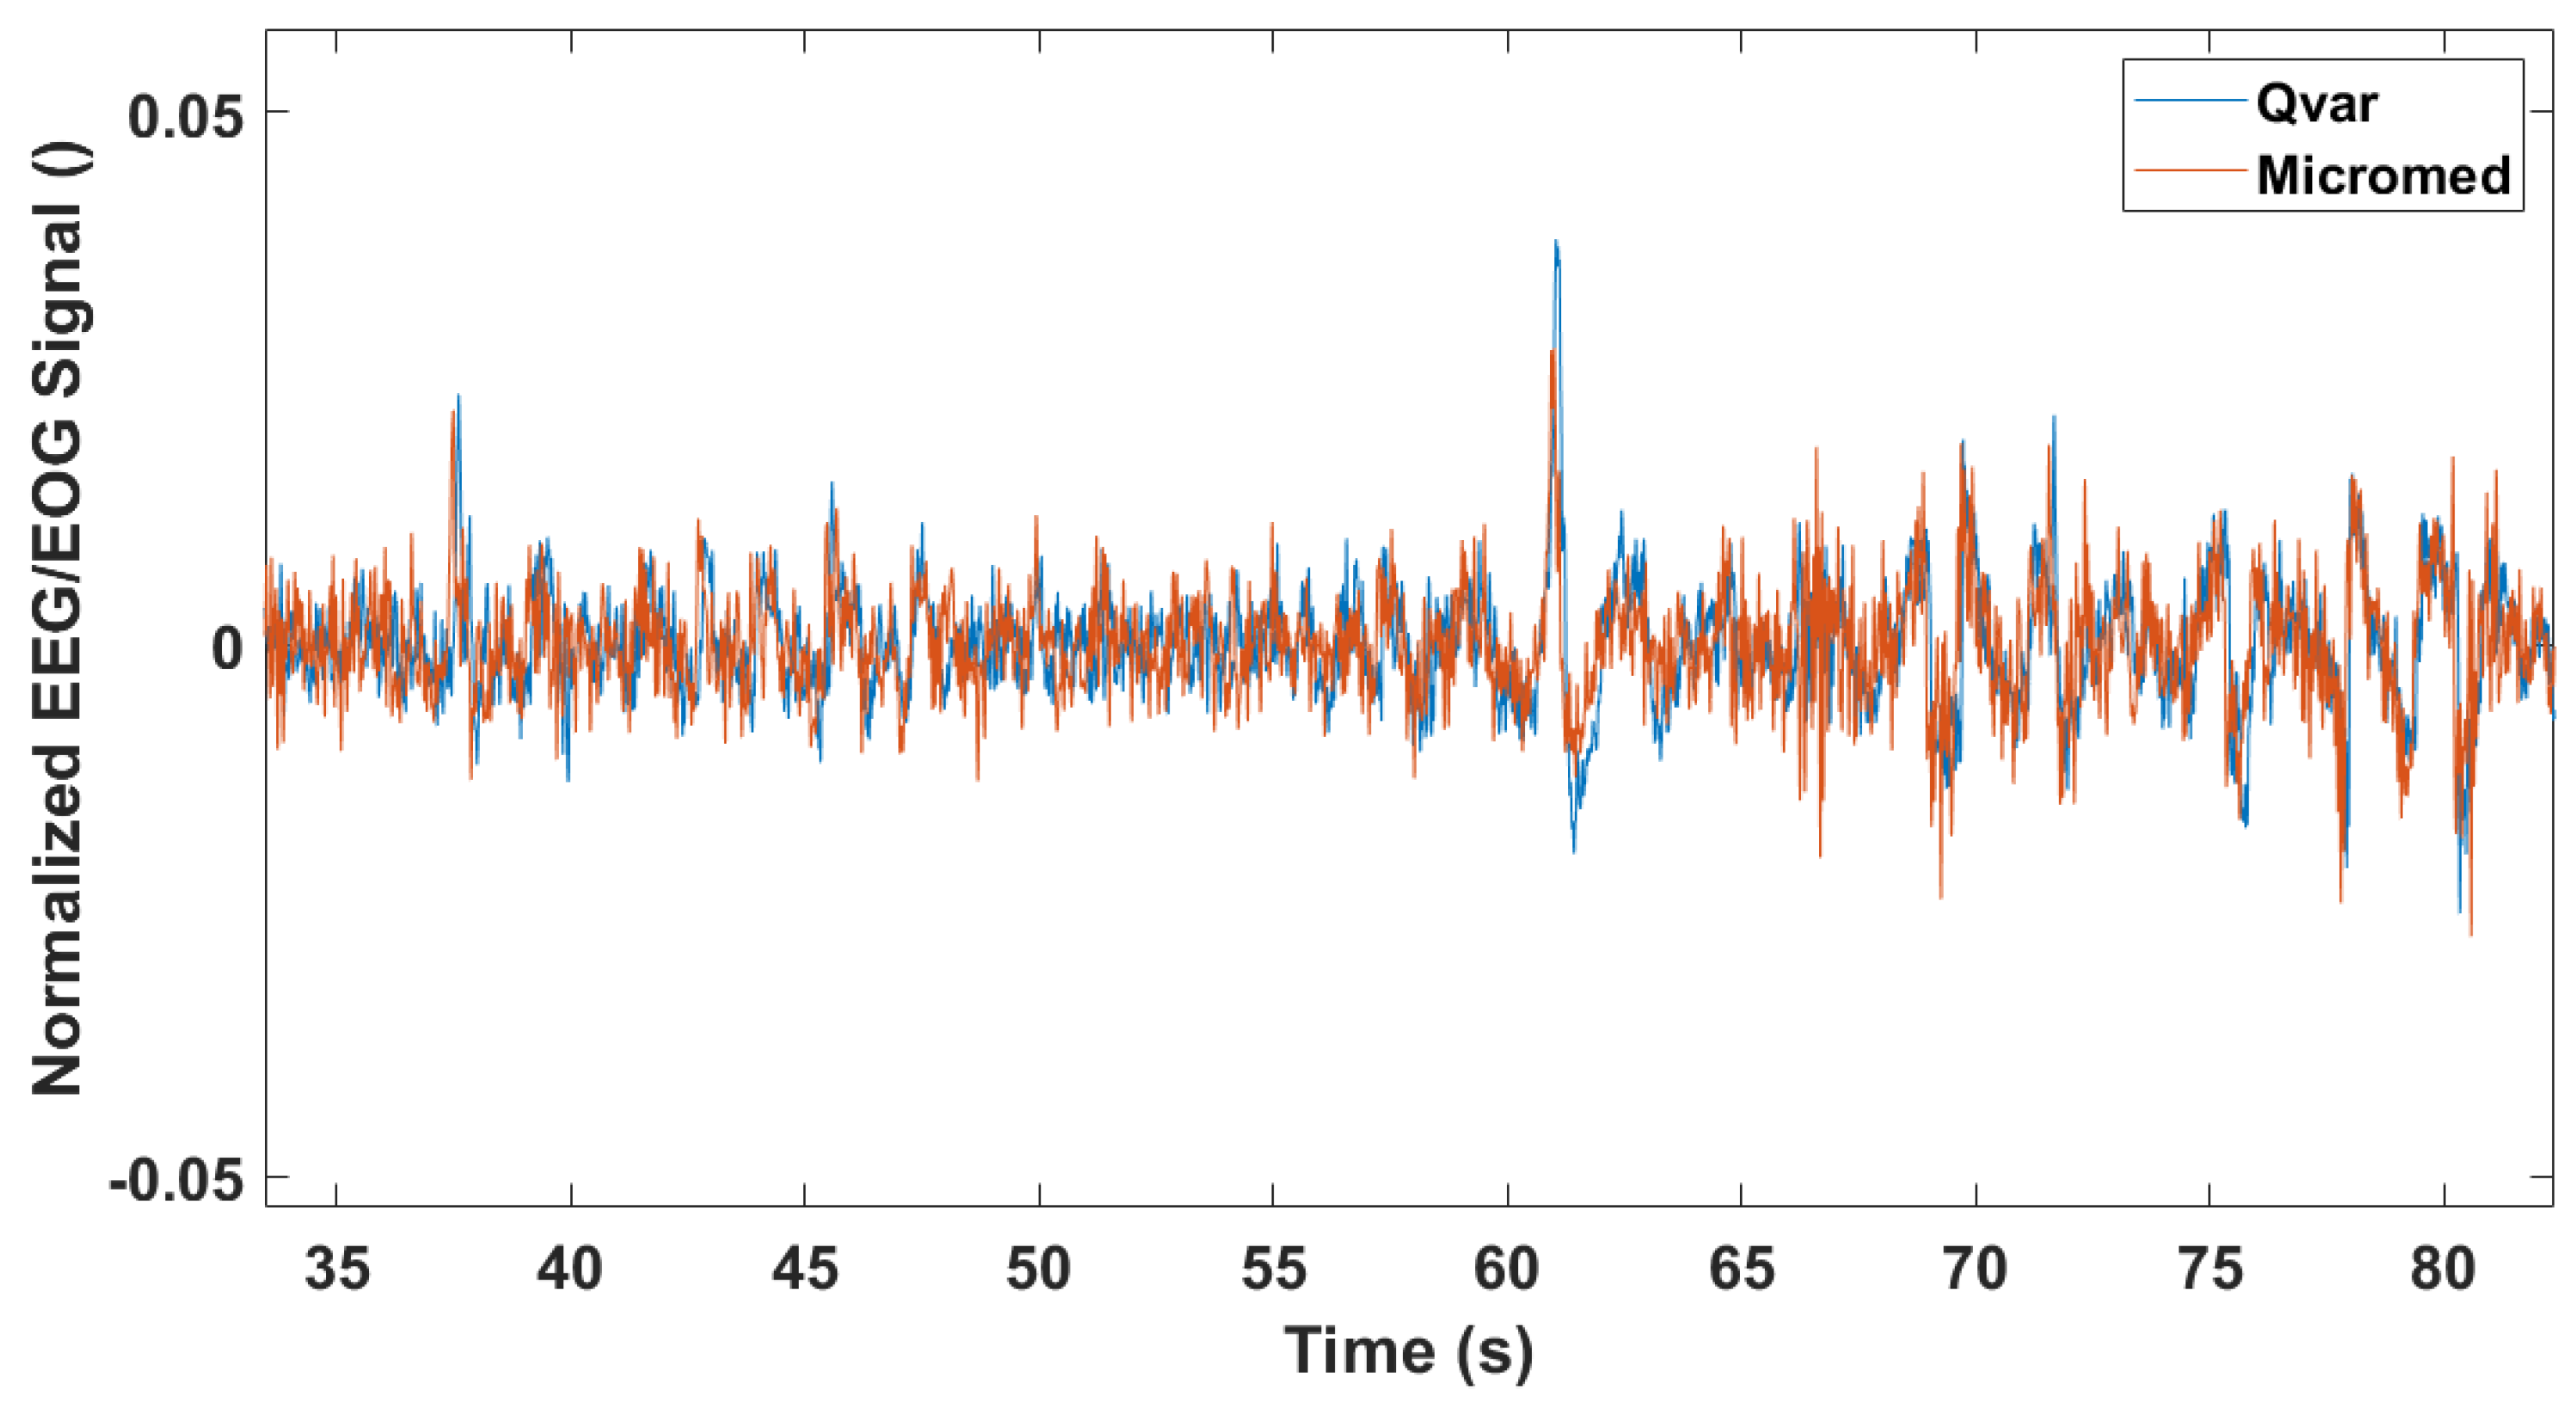
3.2. EEG Test: ST-Qvar vs. Gold Standard
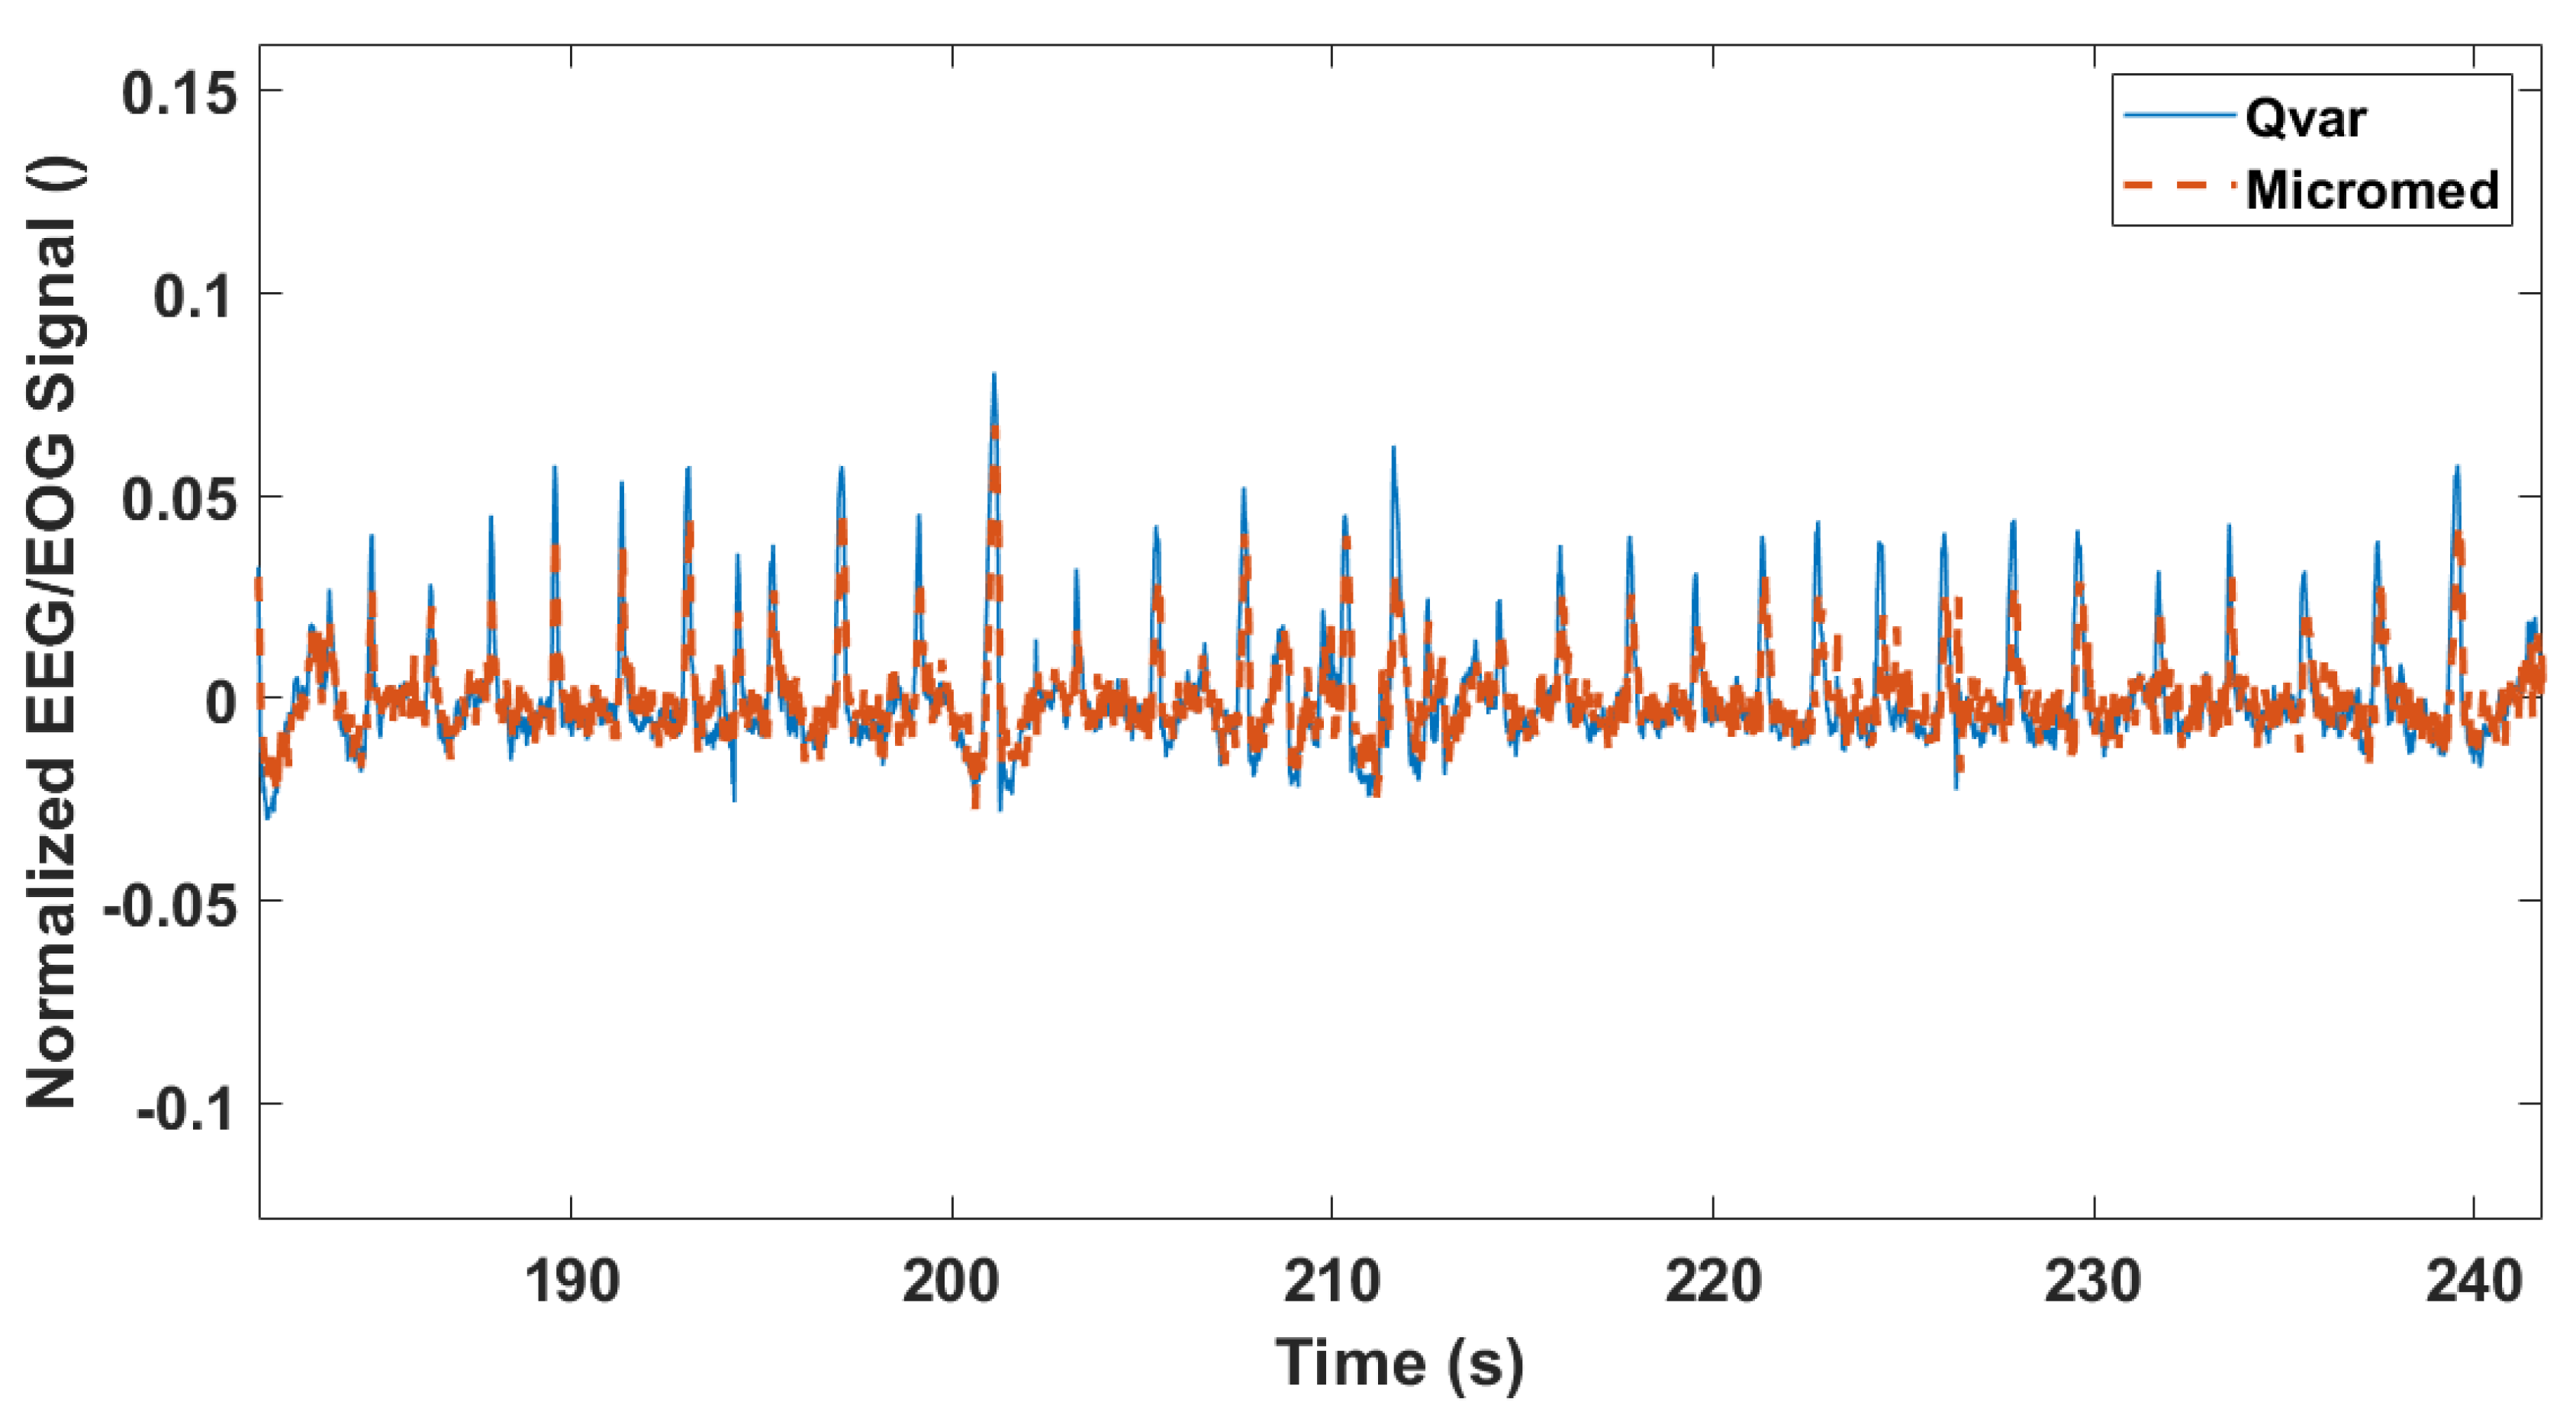
3.3. Rapid Eye Movement Detection Test (EOG): ST-Qvar vs. Gold Standard
3.4. Power Consumption
4. Discussion
5. Conclusions
Author Contributions
Funding
Institutional Review Board Statement
Informed Consent Statement
Data Availability Statement
Conflicts of Interest
References
- Zampogna, A.; Mileti, I.; Palermo, E.; Celletti, C.; Paoloni, M.; Manoni, A.; Mazzetta, I.; Dalla Costa, G.; Pérez-López, C.; Camerota, F.; et al. Fifteen years of wireless sensors for balance assessment in neurological disorders. Sensors 2020, 20, 3247. [Google Scholar] [CrossRef]
- Jani, A.B.; Bagree, R.; Roy, A.K. Design of a low-power, low-cost ECG & EMG sensor for wearable biometric and medical application. In Proceedings of the 2017 IEEE SENSORS, Glasgow, UK, 29 October–1 November 2017; pp. 1–3. [Google Scholar]
- Mazzetta, I.; Zampogna, A.; Suppa, A.; Gumiero, A.; Pessione, M.; Irrera, F. Wearable sensors system for an improved analysis of freezing of gait in parkinson’s disease using electromyography and inertial signals. Sensors 2019, 19, 948. [Google Scholar] [CrossRef] [PubMed] [Green Version]
- Mai, N.-D.; Hoang Long, N.M.; Chung, W.-Y. 1D-CNN-based BCI system for detecting emotional states using a wireless and wearable 8-channel custom-designed eeg headset. In Proceedings of the 2021 IEEE International Conference on Flexible and Printable Sensors and Systems (FLEPS), Manchester, UK, 20–23 June 2021; pp. 1–4. [Google Scholar]
- Ogino, M.; Kanoga, S.; Muto, M.; Mitsukura, Y. Analysis of prefrontal single-channel EEG data for portable auditory ERP-based brain—Computer interfaces. Front. Hum. Neurosci. 2019, 13, 250. [Google Scholar] [CrossRef]
- Hughes, J.R.; Zialcita, M.L. EEG in the elderly: Seizures vs. syncope. Clin. Electroencephalogr. 2000, 31, 131–137. [Google Scholar] [CrossRef] [PubMed]
- Livia Fantini, M.; Gagnon, J.-F.; Petit, D.; Rompré, S.; Décary, A.; Carrier, J.; Montplaisir, J. Slowing of electroencephalogram in rapid eye movement sleep behavior disorder: Electroencephalogram in RBD. Ann. Neurol. 2003, 53, 774–780. [Google Scholar] [CrossRef] [PubMed]
- Kortelainen, J.; Ala-Kokko, T.; Tiainen, M.; Strbian, D.; Rantanen, K.; Laurila, J.; Koskenkari, J.; Kallio, M.; Toppila, J.; Väyrynen, E.; et al. Early recovery of frontal EEG slow wave activity during propofol sedation predicts outcome after cardiac arrest. Resuscitation 2021, 165, 170–176. [Google Scholar] [CrossRef]
- Diadem. Available online: https://www.bitbrain.com/neurotechnology-products/dry-eeg/diadem (accessed on 13 December 2021).
- BrainBit. Available online: http://brainbit.com/ (accessed on 13 December 2021).
- CGX. Dry EEG Headsets—Products. Available online: https://www.cgxsystems.com/products (accessed on 13 December 2021).
- Li, D.; Puglia, M.P.; Lapointe, A.P.; Ip, K.I.; Zierau, M.; McKinney, A.; Vlisides, P.E. Age-related changes in cortical connectivity during surgical anesthesia. Front. Aging Neurosci. 2020, 11, 371. [Google Scholar] [CrossRef] [Green Version]
- Miller, S.; Chelian, S.; Mcburnett, W.; Tsou, W.; Kruse, A. An investigation of computer-based brain training on the cognitive and EEG performance of employees. In Proceedings of the 2019 41st Annual International Conference of the IEEE Engineering in Medicine and Biology Society (EMBC), Berlin, Germany, 23–27 July 2019; Volume 2019. [Google Scholar]
- Kim, H.; Yoshimura, N.; Koike, Y. Classification of movement intention using independent components of premovement EEG. Front. Hum. Neurosci. 2019, 13, 63. [Google Scholar] [CrossRef] [Green Version]
- DSI 7 Flex. Available online: https://wearablesensing.com/products/dsi-7-flex/ (accessed on 13 December 2021).
- Product. Available online: https://mentalab.com/product (accessed on 2 February 2022).
- Apicella, A.; Arpaia, P.; Mastrati, G.; Moccaldi, N. High-Wearable EEG-Based Detection of Emotional Valence for Scientific Measurement of Emotions; Research Square: Durham, NC, USA, 2021. [Google Scholar]
- Nakamura, T.; Goverdovsky, V.; Morrell, M.J.; Mandic, D.P. Automatic sleep monitoring using ear-EEG. IEEE J. Transl. Eng. Health Med. 2017, 5, 2800108. [Google Scholar] [CrossRef] [PubMed]
- Nakamura, T.; Alqurashi, Y.D.; Morrell, M.J.; Mandic, D.P. Hearables: Automatic overnight sleep monitoring with standardized in-ear EEG sensor. IEEE Trans. Biomed. Eng. 2020, 67, 203–212. [Google Scholar] [CrossRef] [PubMed] [Green Version]
- Hölle, D.; Meekes, J.; Bleichner, M.G. Mobile ear-EEG to study auditory attention in everyday life. Behav. Res. 2021, 53, 2025–2036. [Google Scholar] [CrossRef] [PubMed]
- Meiser, A.; Tadel, F.; Debener, S.; Bleichner, M.G. The sensitivity of ear-EEG: Evaluating the source-sensor relationship using forward modeling. Brain Topogr. 2020, 33, 665–676. [Google Scholar] [CrossRef]
- Steinberg, C.; Bennett, M.T.; Krahn, A.D. Extended ECG monitoring. In Cardiac Arrhythmias, Pacing and Sudden Death; Kowey, P., Piccini, J.P., Naccarelli, G., Reiffel, J.A., Eds.; Cardiovascular Medicine; Springer International Publishing: Cham, Switzerland, 2017; pp. 49–60. ISBN 978-3-319-58000-5. [Google Scholar]
- Bulková, V. Long-term ECG monitoring. Vnitr. Lek. 2021, 67, 16–21. [Google Scholar] [CrossRef] [PubMed]
- Bender, E. Prolonged holter-ECG monitoring found to improve detection of atrial fibrillation after acute stroke. Neurol. Today 2017, 17, 8. [Google Scholar] [CrossRef]
- Majumder, S.; Chen, L.; Marinov, O.; Chen, C.-H.; Mondal, T.; Deen, M.J. Noncontact wearable wireless ECG systems for long-term monitoring. IEEE Rev. Biomed. Eng. 2018, 11, 306–321. [Google Scholar] [CrossRef] [PubMed]
- Fourth Frontier. Real-Time ECG and Alerts. Available online: https://fourthfrontier.com/ (accessed on 10 December 2021).
- Bayoumy, K.; Gaber, M.; Elshafeey, A.; Mhaimeed, O.; Dineen, E.H.; Marvel, F.A.; Martin, S.S.; Muse, E.D.; Turakhia, M.P.; Tarakji, K.G.; et al. Smart wearable devices in cardiovascular care: Where we are and how to move forward. Nat. Rev. Cardiol. 2021, 18, 581–599. [Google Scholar] [CrossRef] [PubMed]
- Casson, A.J. Wearable EEG and beyond. Biomed. Eng. Lett. 2019, 9, 53–71. [Google Scholar] [CrossRef] [PubMed]
- DSD TECH HM19—Product Datasheet. DSD TECH HM-19 Bluetooth 5.0 BLE Module with CC2640R2F Chip. Available online: dsdtech-global.com (accessed on 10 February 2021).
- X-NUCLEO-IKS01A1—Motion MEMS and Environmental Sensor Expansion Board for STM32 Nucleo—STMicroelectronics. Available online: https://www.st.com/en/ecosystems/x-nucleo-iks01a1.html (accessed on 2 February 2022).
- Galembeck, F.; Burgo, T.A.L.; Balestrin, L.B.S.; Gouveia, R.F.; Silva, C.A.; Galembeck, A. Friction, tribochemistry and triboelectricity: Recent progress and perspectives. RSC Adv. 2014, 4, 64280–64298. [Google Scholar] [CrossRef]
- LSM6DSV16X—INEMO 3D Accelerometer and 3D Gyroscope: Always-on Inertial Module with Embedded Machine Learning Core and Qvar Electrostatic Sensor—STMicroelectronics. Available online: https://www.st.com/en/mems-and-sensors/lsm6dsv16x.html (accessed on 3 March 2022).
- Vanhatalo, S.; Voipio, J.; Kaila, K. Full-band EEG (FbEEG): A new standard for clinical electroencephalography. Clin. EEG Neurosci. 2005, 36, 311–317. [Google Scholar] [CrossRef]
- IEC 60601-2-47:2012; IEC Webstore. Available online: https://webstore.iec.ch/publication/2666 (accessed on 31 January 2022).
- Roy, S.K.; Shah, S.U.; Villa-Lopez, E.; Murillo, M.; Arenas, N.; Oshima, K.; Chang, R.-K.; Lauzon, M.; Guo, X.; Pillutla, P. Comparison of electrocardiogram quality and clinical interpretations using prepositioned ECG electrodes and conventional individual electrodes. J. Electrocardiol. 2020, 59, 126–133. [Google Scholar] [CrossRef] [PubMed]
- Salsa, T.; Veiga, F.; Pina, M. Oral controlled-release dosage forms. I. Cellulose ether polymers in hydrophilic matrices. Drug Dev. Ind. Pharm. 1997, 23, 929–938. [Google Scholar] [CrossRef]
- Hossain, M.B.; Bashar, S.K.; Walkey, A.J.; McManus, D.D.; Chon, K.H. An accurate QRS complex and P wave detection in ECG signals using complete ensemble empirical mode decomposition with adaptive noise approach. IEEE Access 2019, 7, 128869–128880. [Google Scholar] [CrossRef] [PubMed]
- Zhidong, Z.; Yi, L.; Qing, L. Adaptive Noise Removal of ECG Signal Based on Ensemble Empirical Mode Decomposition; IntechOpen: London, UK, 2011; ISBN 978-953-307-306-4. [Google Scholar]
- Cai, Z.; Li, J.; Zhang, X.; Shen, Q.; Murray, A.; Liu, C. How accurate are ECG parameters from wearable single-lead ECG system for 24-hours monitoring. In Proceedings of the 2019 Computing in Cardiology (CinC), Singapore, 8–11 September 2019; pp. 1–4. [Google Scholar]
- Witvliet, M.P.; Karregat, E.P.M.; Himmelreich, J.C.L.; de Jong, J.S.S.G.; Lucassen, W.A.M.; Harskamp, R.E. Usefulness, pitfalls and interpretation of handheld single-lead electrocardiograms. J. Electrocardiol. 2021, 66, 33–37. [Google Scholar] [CrossRef] [PubMed]
- Zeng, H.; Song, A.; Yan, R.; Qin, H. EOG artifact correction from EEG recording using stationary subspace analysis and empirical mode decomposition. Sensors 2013, 13, 14839–14859. [Google Scholar] [CrossRef] [PubMed]
- Bell, A.J.; Sejnowski, T.J. An information-maximization approach to blind separation and blind deconvolution. Neural Comput. 1995, 7, 1129–1159. [Google Scholar] [CrossRef]
- Belkhiria, C.; Peysakhovich, V. Electro-encephalography and electro-oculography in aeronautics: A review over the last decade (2010–2020). Front. Neuroergon. 2020, 1, 606719. [Google Scholar] [CrossRef]
- Creel, D.J. The electrooculogram. In Handbook of Clinical Neurology; Elsevier: Amsterdam, The Netherlands, 2019; Volume 160, pp. 495–499. [Google Scholar] [CrossRef]
- Peever, J.; Fuller, P.M. The biology of REM sleep. Curr. Biol. 2017, 27, R1237–R1248. [Google Scholar] [CrossRef]
- Jurcak, V.; Tsuzuki, D.; Dan, I. 10/20, 10/10, and 10/5 systems revisited: Their validity as relative head-surface-based positioning systems. Neuroimage 2007, 34, 1600–1611. [Google Scholar] [CrossRef]


| ECG Feature | Nominal | ST-Qvar (Mean Value) |
|---|---|---|
| PR Interval | 0.12 ÷ 0.2 s | 0.16 s |
| QRS Interval | 0.06 ÷ 0.1 s | 0.06 s |
| QT Interval | 0.42 s | 0.38 s |
| QRS Amplitude | >0.5 mV | 1 mV |
| Component | Current Absorption (mA) | 500 mAh Battery Life (h) | 2 AA 1000 mAh Battery Life (h) |
|---|---|---|---|
| Cortex M0 | 2 | ||
| ST-Qvar Sensor | 0.02 | ||
| Pre-amplifier Stage | 0.18 | ||
| BLE module (optional) | (2.6) | ||
| Total system (1 channel) | 2.2 (4.8 with BLE) | 227 (104.2 with BLE) | 908 (416 with BLE) |
| Hypothetical 30-channels | 8.2 (10.8 with BLE) | 61 (46 with BLE) | 243 (185 with BLE) |
Publisher’s Note: MDPI stays neutral with regard to jurisdictional claims in published maps and institutional affiliations. |
© 2022 by the authors. Licensee MDPI, Basel, Switzerland. This article is an open access article distributed under the terms and conditions of the Creative Commons Attribution (CC BY) license (https://creativecommons.org/licenses/by/4.0/).
Share and Cite
Manoni, A.; Gumiero, A.; Zampogna, A.; Ciarlo, C.; Panetta, L.; Suppa, A.; Della Torre, L.; Irrera, F. Long-Term Polygraphic Monitoring through MEMS and Charge Transfer for Low-Power Wearable Applications. Sensors 2022, 22, 2566. https://doi.org/10.3390/s22072566
Manoni A, Gumiero A, Zampogna A, Ciarlo C, Panetta L, Suppa A, Della Torre L, Irrera F. Long-Term Polygraphic Monitoring through MEMS and Charge Transfer for Low-Power Wearable Applications. Sensors. 2022; 22(7):2566. https://doi.org/10.3390/s22072566
Chicago/Turabian StyleManoni, Alessandro, Alessandro Gumiero, Alessandro Zampogna, Chiara Ciarlo, Lorenzo Panetta, Antonio Suppa, Luigi Della Torre, and Fernanda Irrera. 2022. "Long-Term Polygraphic Monitoring through MEMS and Charge Transfer for Low-Power Wearable Applications" Sensors 22, no. 7: 2566. https://doi.org/10.3390/s22072566
APA StyleManoni, A., Gumiero, A., Zampogna, A., Ciarlo, C., Panetta, L., Suppa, A., Della Torre, L., & Irrera, F. (2022). Long-Term Polygraphic Monitoring through MEMS and Charge Transfer for Low-Power Wearable Applications. Sensors, 22(7), 2566. https://doi.org/10.3390/s22072566