1. Introduction
Ample hydration is a key to healthy living for people of all age groups. Inadequate water consumption can lead to a variety of health issues that include urinary tract infection, kidney failure, sticky mouth, headache, dizziness, electrolyte imbalance, tissue shrinkage, sunken eyes, and many more [
1]. Severe lack of water intake can also affect the heat dissipation of the human body, resulting in feverish conditions. The effects of dehydration can be particularly adverse for the elderly population. These underscore the importance of appropriate hydration for a healthy lifestyle.
Many automated hydration-tracking and reminding technologies have emerged to improve individuals’ fluid consumption habits. These hydration-tracking systems can be categorized into wearable and non-wearable devices. The wearable devices mainly include wrist band-based systems [
2] that monitor the fluid intake based on the wrist motion. The wrist band-based devices require an individual to always wear such a device and restricting the person to hold the water bottle/cup with the hand on which the device is worn. There are several fabric-based wearable devices to track different drinking and eating activities of a person [
3]. Some prominent non-wearable approaches include the use of smart bottles [
4]. These smart bottles can sense liquid level, bottle weight, and other parameters for estimating liquid consumption. However, there are reliability and durability issues since the level sensors require exposure in liquid for an extended period. There is also involvement of image-based approaches that measures liquid intake by analyzing bottle-tilt from phone-captured video, which is not user-friendly, as it also brings a threat to the user’s privacy by accessing a camera [
5].
A common component across all these approaches is that on-bottle or on-cup (i.e., on-device) sensors are used for data collection during the drinking process. These data are then transferred through a wireless link to a connected phone or cloud-based entity for liquid consumption estimation. This approach enjoys the availability of ample off-device computing and memory resources, which are beneficial for complex detection and estimation tasks having a true positive rate for detecting a sip of around 98% [
6]. However, it suffers from shortcomings such as heavy communication energy overhead and privacy concerns.
In this paper, we propose an on-device liquid consumption estimation framework. Two separate neural network models decide whether the data collected from an accelerometer are sips or not, and whether a sip in question is a first sip after a bottle is refilled, thus estimating the volume of fluid intake. The involvement of pre-trained and person non-specific neural networks ensures better data privacy since the no runtime user data are transferred to and from the device.
Based on this information, the consumed volume of liquid intake is estimated. An overarching goal in this approach is to avoid any raw data upload from a smart bottle to a phone or any other device. The final consumption estimation can be displayed on an on-bottle display. By doing away with any wireless link, the convenience and privacy of smart bottle users is improved.
The real-time estimation of the volume of consumed fluid is performed using a post-sip-detection unit. The volume estimation module detects the first sip intake after each bottle refill using a pre-trained neural network. The network uses information on maximum bottle inclination during a sip. From the detected first-sips and the known bottle volume, the system estimates cumulative volume of drink consumption using a self-correcting algorithm.
This work has the following scope and contributions. First, it develops low-complexity ML models for both sip detection and volume estimation tasks that are specifically optimized for embedded on-device implementations. This embedded setup overcomes the limited processing and memory resources together with energy constraints. Second, a detailed characterization of sip detection is performed to understand the accuracy–complexity tradeoffs by developing and implementing a variety of different ML models with varying complexities. Third, a predictive algorithm for consumed volume estimation is developed and implemented for its accuracy characterization. All these experiments are performed on a smart bottle created by integrating an embedded processor system on a regular grade water bottle.
2. Related Work
Embedded machine learning (ML) has been explored in many real-world applications, such as smart watches, sensors, hearing aids, etc. Most of the generic ML algorithms are computationally complex, thus leading to high power consumption and making them inapplicable for embedded applications with limited energy and memory budgets.
There are several papers such as [
7] that aim at increasing embedded ML algorithm efficiency in terms of computational time and energy consumption by the means of an ML accelerator via decomposition of the most dominant high-dimensional operations, such as convolutions, matrix multiplications, and other methods of calculating the weights, into a series of vector reductions. A key challenge in the design of accelerators is to balance the tradeoff between efficiency and storage scalability, which by itself can be a challenge for implementation in embedded devices.
The work reported in [
7,
8] propose to increase computational efficiency of embedded ML algorithms by adopting various types of approximations at different levels including circuit, architecture, and algorithms. It has been observed that in most cases, the accuracy of the algorithms is heavily sacrificed to make it more efficient in terms of memory footprint and latency when these approximation methods are implemented.
The work described in [
9] demonstrates on-hardware training of ML algorithm using customized data structure and computation sequence which relies on a Gaussian mixture model (GMM) that uses an expectation maximization (EM) algorithm with the minimum description length (MDL) criterion. This method of onboard training involves storage of large volumes of data, thus needing high memory usage. Moreover, onboard training and using the additional feature of the analytics services in [
10] result in high power consumption. In this work, a low complexity machine learning framework suitable for low-power embedded hardware is utilized.
Fluid intake monitoring has primarily been done as questionnaire-based self-reporting with indirect estimation [
10], which is usually not very accurate since it relies on manual and subjective inputs from the users. A few automated hydration tracking, and fluid-intake monitoring systems have recently been developed, which can be broadly classified into wearables and non-wearables.
Conventionally used wearable devices generally rely on a motion sensor fitted to the wrist of the subject with a help of a wrist band [
2] that detects the motion of the bottle from the gestures of the wrist and can classify whether the bottle’s movement was that of a “fetch” or “sip”. The device has an inherent drawback that the person must always wear the band on the hand by which he/she holds the bottle; the sensor can also record gestures very similar to that of the sip movements, thus leading to loss of classification accuracy.
Among the non-wearable alternatives, there are systems that use vision-based approaches involving cameras and computer vision techniques coupled with deep-learning algorithms to track drinking activities [
10] that can result in higher power consumption and a privacy threat.
There are a few commercial products available including the “Hidrate Spark” bottle by Apple Inc. [
9] that uses a few on-bottle level sensors to monitor fluid intake subject, which are usually expensive and not long-lasting due to their constant exposure to liquid.
In [
11], data are collected by a set of on-device accelerometers, and subsequently sent to an Android device using a Bluetooth link. Algorithms on the Android device classify the sips, and finally the consumption volume is estimated from the data collected. In [
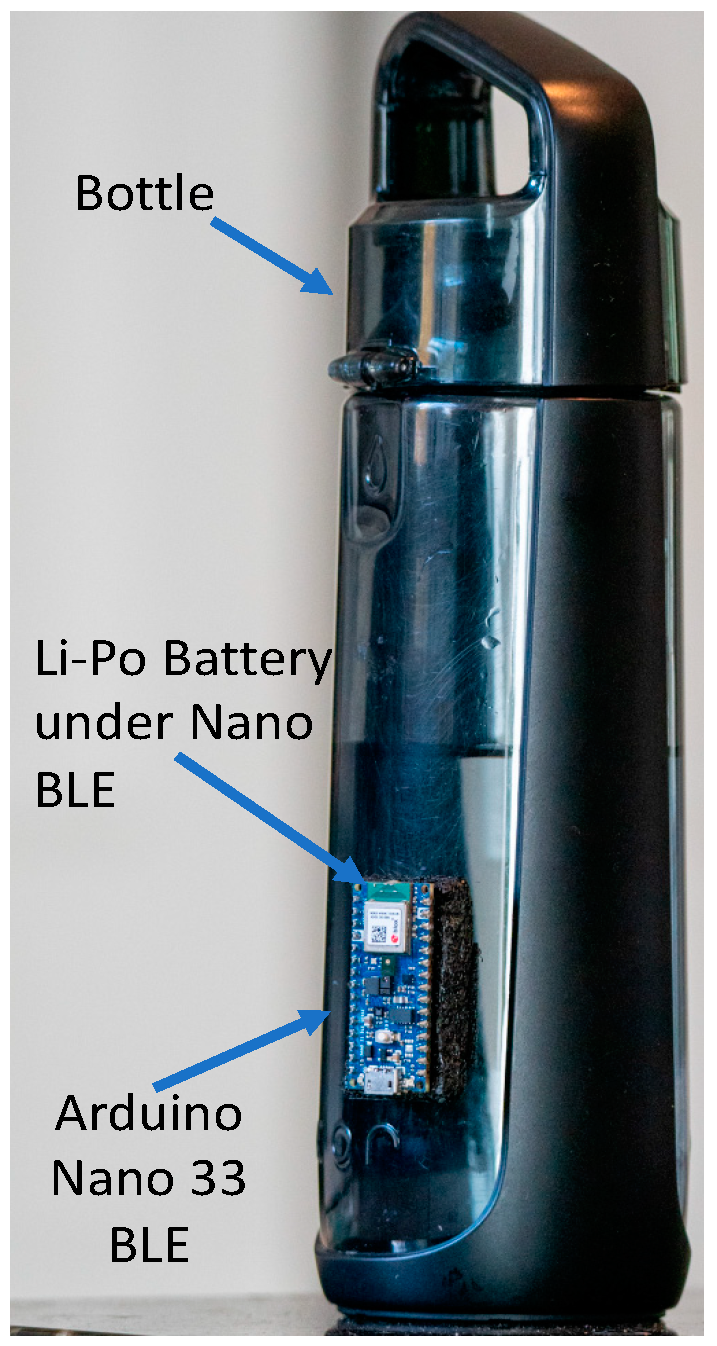
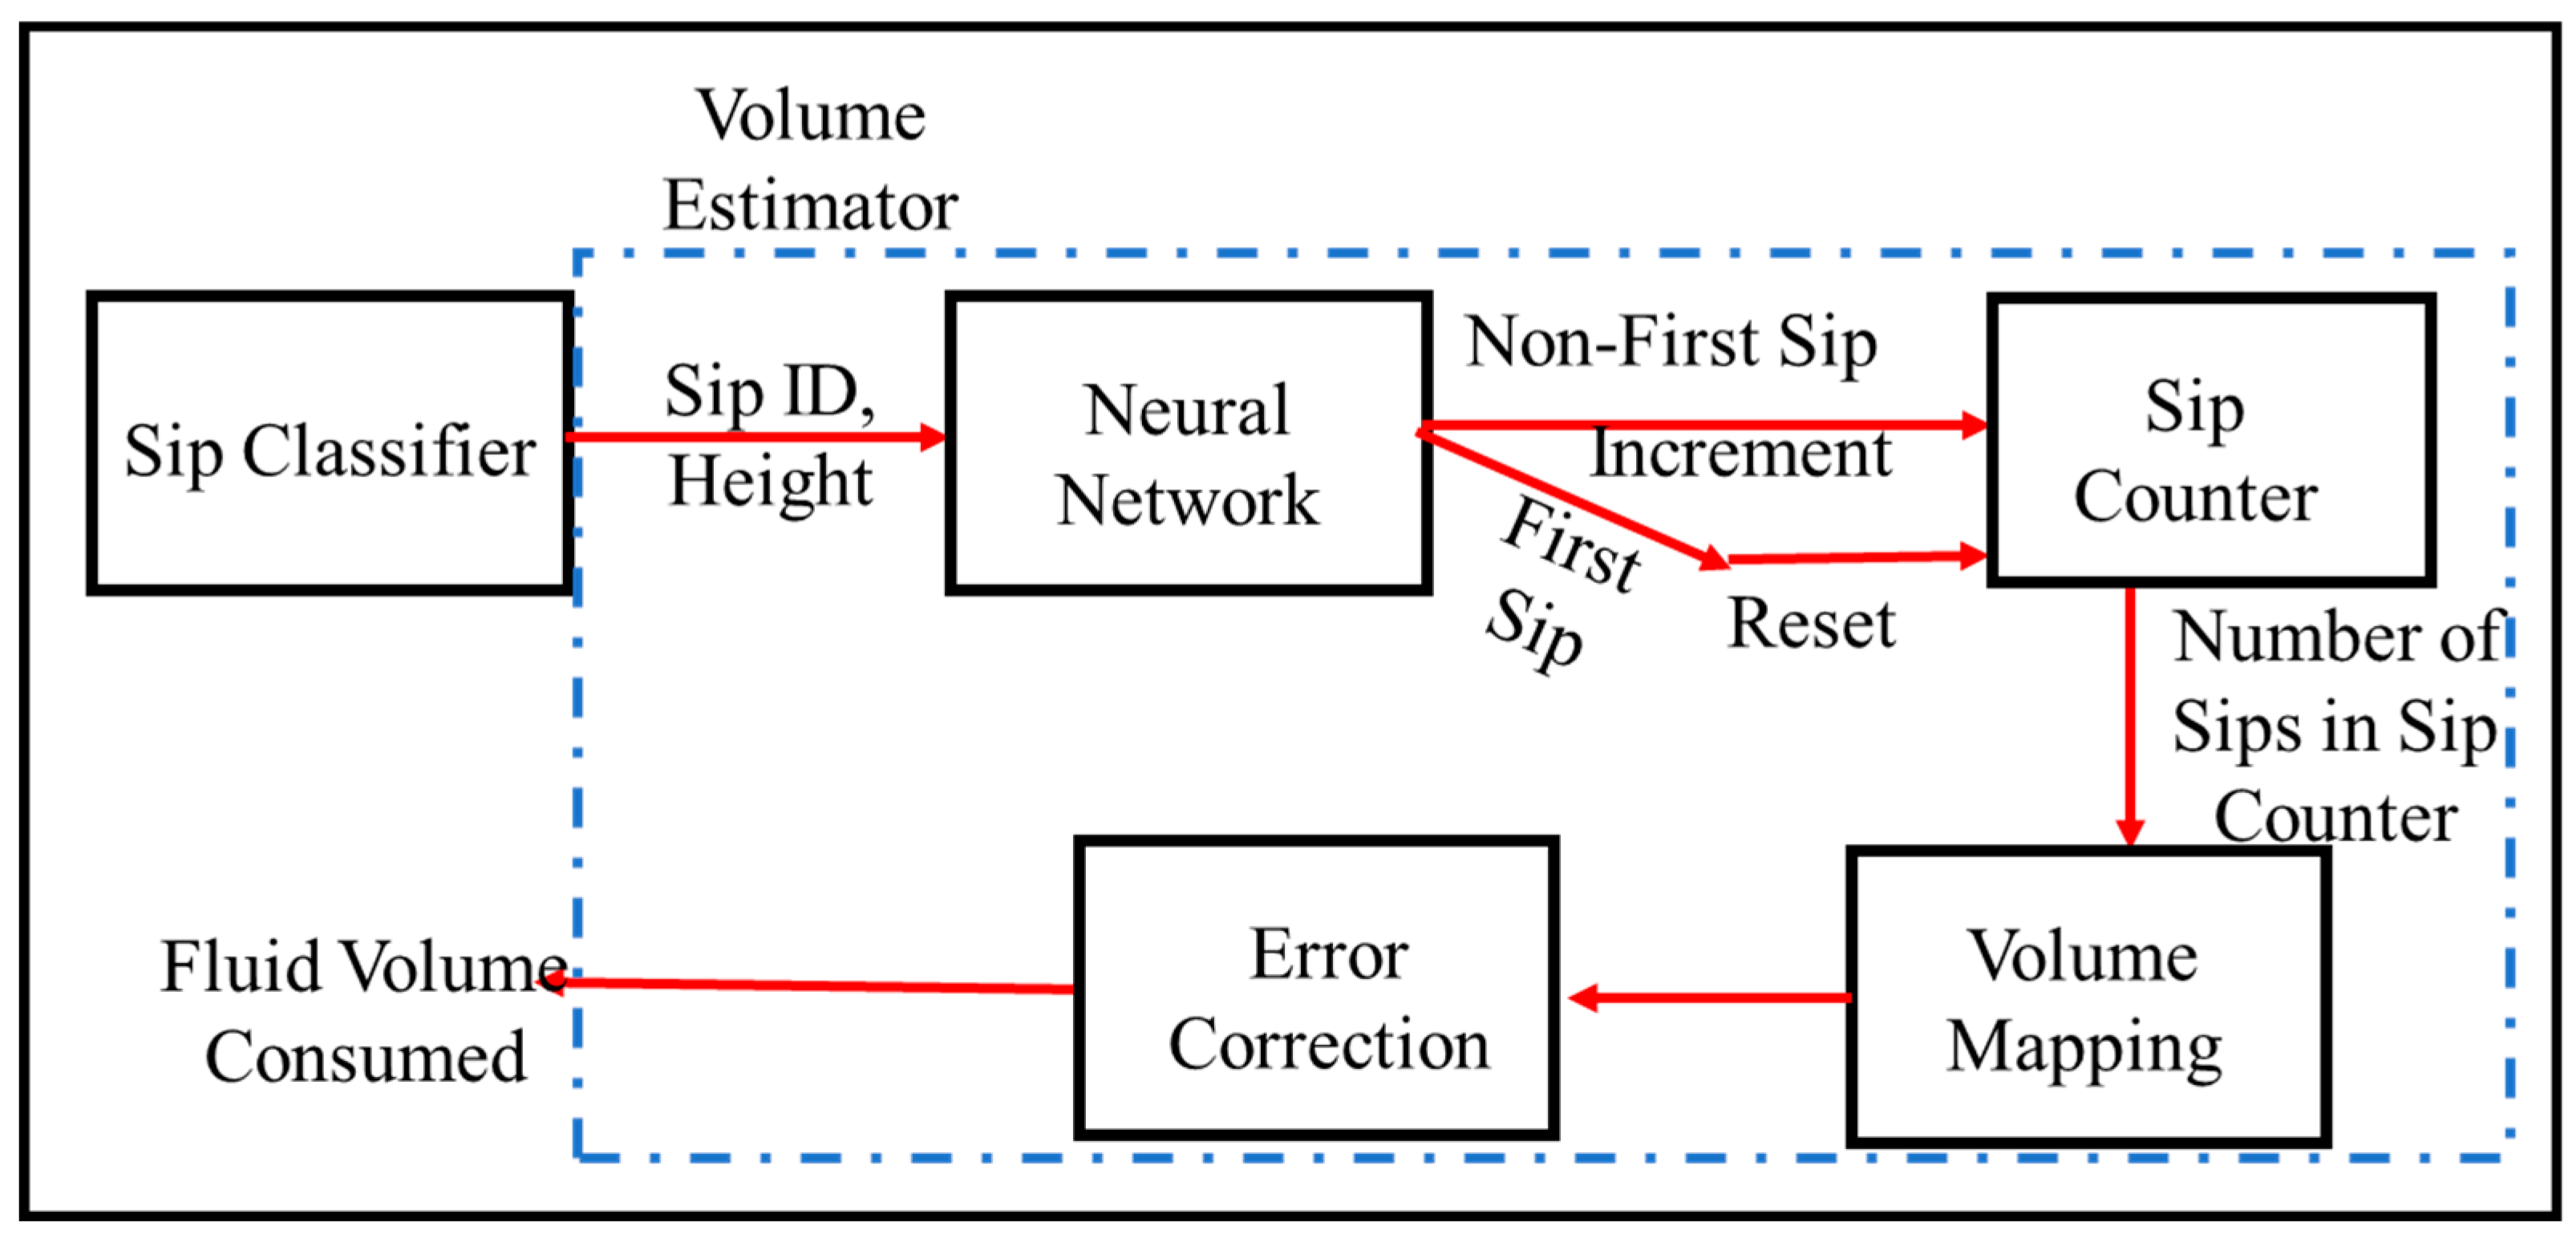
12], three IMU sensors were used to collect user gesture data from bottle movements, and a “temporal partitioning technique” was used to detect drinking windows from the time-series accelerometer data. Bluetooth-based data uploads in both the approaches are expensive, which is avoided in the system presented in this paper by running embedded ML algorithms on a bottle-attached microcontroller, as shown in
Figure 1, thus making the overall system more energy efficient.
4. On-Device Experimental Data Collection, Pre-Processing, and Classification
4.1. Data Collection
To assure that the NN model loaded on the hardware makes accurate predictions, the data used for training the model incorporate different types of scenarios and activities. Instances of sip data are shown in
Figure 4. Unlike for the sips, non-sip data can belong to many different subclasses resulting from different gesture scenarios performed on the bottle. Data were collected for non-sip scenarios including walking on flat ground with the bottle in hand, walking on stairs with the bottle held in hand, walking on flat ground with the bottle in a bag, walking on stairs with the bottle in a bag, keeping the bottle stationary in a constant position, and keeping the bottle in a constant position in a moving car and some in-hand fidgeting movements.
The objective here is to collect data from enough representative scenarios so that the NN training can be sufficiently general while classifying the non-sips.
For real-time testing, a combination of different activities, both sips and non-sips, was performed with the instrumented bottle, as shown in
Figure 2. All experiments were performed by different subjects, each having specific signature drinking gestures. The number of different subjects used for data collection and the size of training and testing dataset are summarized in
Table 1.
4.2. Real-Time Data Pre-Processing
Filtering, Peak Detection, and Extraction: The data pre-processing step begins with filtering the raw IMU sensor data using the moving average method [
20]. For moving average, a consecutive window of 5 samples is used whose mean is calculated and used as the new sample. In this way, noise in the raw data is filtered out, which is useful in the subsequent stages of detecting peaks.
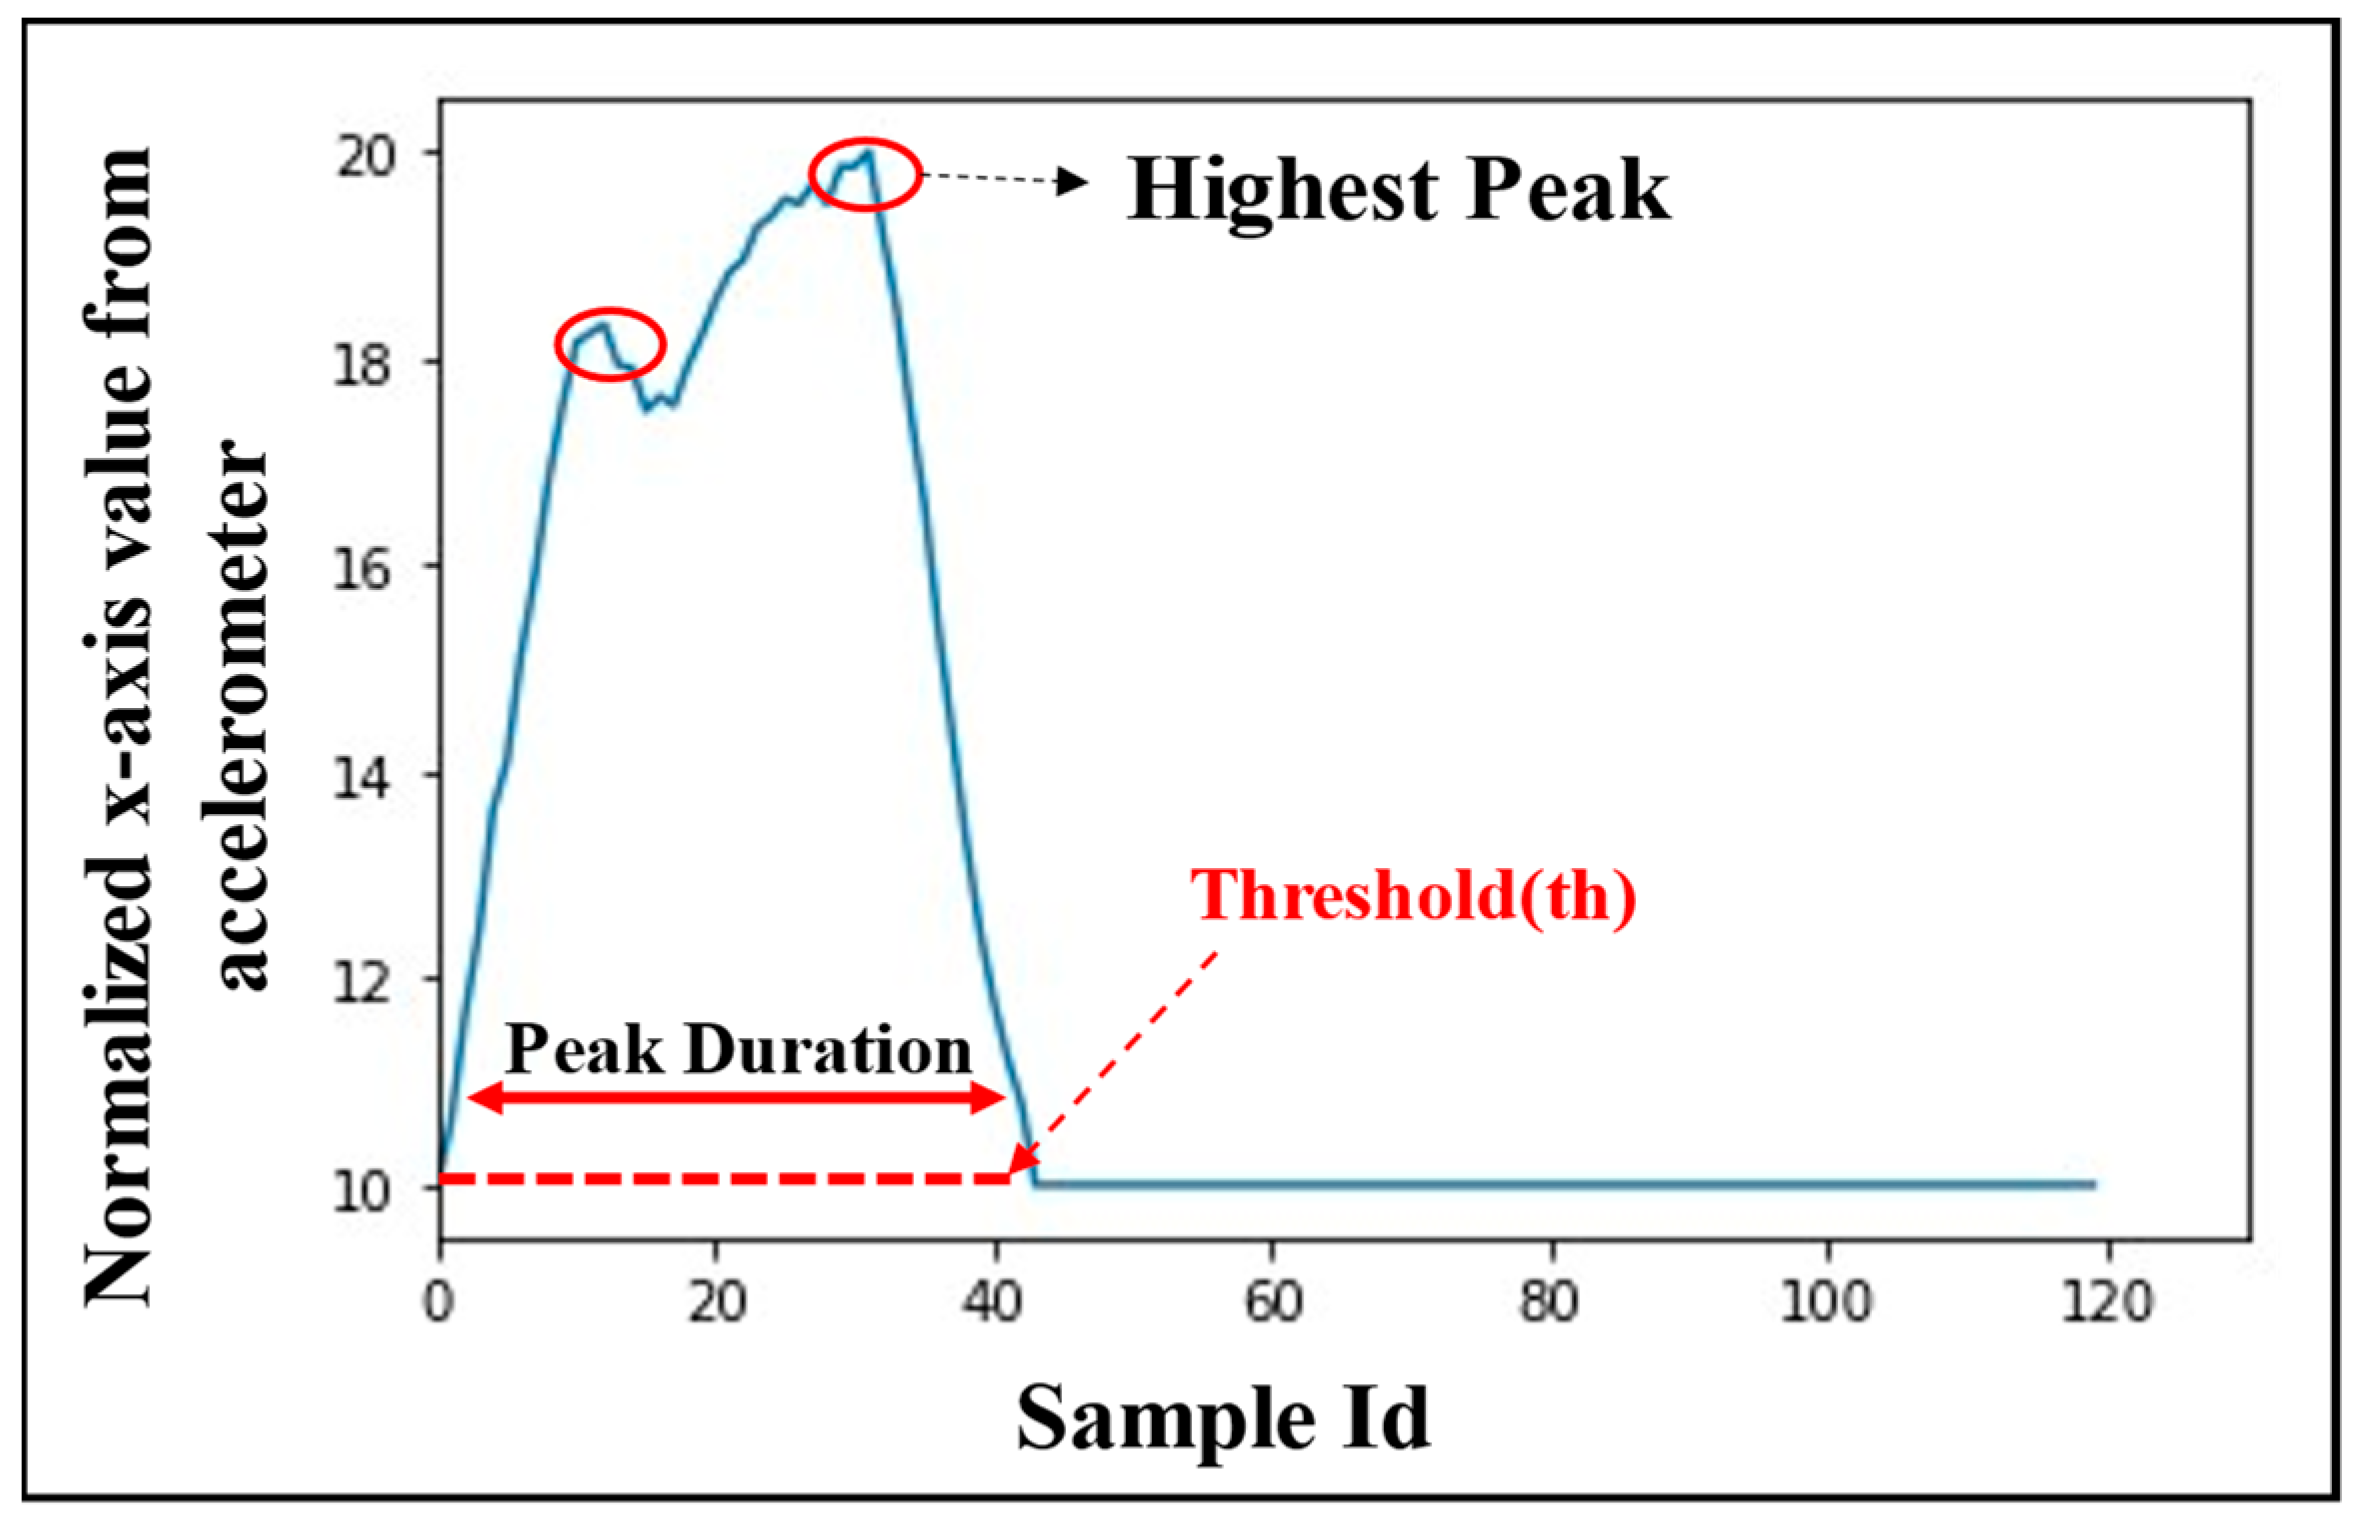
Peak Detection and Extraction: To detect a peak from the filtered data, two consecutive local minima points less than a threshold height are identified. Between those two local minima, if there exists one or more local maxima, then it is assumed that there exists at least one peak between those two local minima points. In that case, all the points between the local minima are extracted.
Peak Normalization and Window Fitting: All the points in the extracted peaks are normalized in the range 10 to 20 by using the equation below:
where
= normalized values of the sample x, and min(x) and max(x) are the minimum and maximum values in the extracted peak episode, respectively.
The normalized samples of the extracted peaks are fitted in a window of a fixed size to have a constant length of episodes to be considered for classification of the sips and non-sips. Thus, each second of a gesture consists of 20 samples (accelerometer frequency is 20 Hz). A window of 120 samples is considered as an episode (maximum duration of a normalized sip: 6 s). Any episode with less than or more than 120 samples is padded with the value ”10” (minimum normalized value) at the end until the window length of episode becomes 120 samples or is pruned off, respectively. All classification operations are performed on such 120-sample data windows, which are referred to as the episodes for the rest of the text.
4.3. On-Device Sip Classification
To estimate the volume of fluid intake by a subject, the number of sips taken by the subject between two consecutive bottle refills needs to be detected with high accuracy. Thus, from the gesture data recorded by the embedded device fitted to the bottle, the gestures must be properly classified into the sips and non-sips classes. This classification is done by a trained neural network model for sip/non-sip classification. The NN model requires features extracted from the gesture signatures in order to classify the sip and non-sip classes accurately. Additionally, the neural network model needs to be lightweight in order to cater to the memory and energy limitations of the embedded device. Thus, an efficient feature engineering and selection of a lightweight NN model is highly required for the bottle-fitted embedded device.
4.3.1. Feature Engineering
Five features representing each episode are extracted from the pre-processed data and are fed as inputs to an on-device neural network classifier. The features used for classification follow.
Number of peaks in an episode: It is calculated from the number of local maxima above a threshold value
x-axis value from accelerometer as 10), which indicates the number of times a bottle is tilted during an episode. As an example, the number of peaks in the episode shown in
Figure 5 is two (marked with red circles). The rationale behind using this feature is that the number of peaks in sip episodes are generally found to be less than those in non-sip episodes, although not always.
Maximum peak height: It is the height of the highest peak in a normalized episode, as shown in
Figure 5. This feature represents the maximum tilt that the bottle experiences during an episode.
Peak duration: Peak duration represents the time in an episode for which the sample value remains above the threshold . This duration is generally found to be larger for sips as compared to non-sips.
Number of samples within the stable portion of a peak: Samples that are within 20% from the highest peak are counted and termed as the number of samples at the highest point in an episode. The higher this value, the larger is the probability of an episode being a sip.
Height of the last point in an episode: There exist some drinking episodes that are not completed within an episode of consideration. In such cases, the value of the last sample of the episode does not fall to the minimum normalized value in the episode. Usually for the non-sips, the value of this feature is the minimum normalized value in a gesture episode.
4.3.2. Neural Network Architecture
In this proposed system, artificial neural networks (NN) [
21,
22] are used both to classify between sips and non-sips gestures, and to detect a first-sip after a bottle refill (
Section 6.2). In order to cater to the limitations in memory and computational overheads of the bottle-fitted embedded device, selection of a proper NN architecture is very important. The NN selected must be such that the classification accuracy is high without having much complexity in compuatation and should not occupy much memory space on the device.
We experimented with a wide range of on-device NN architectures that were implemented within the on-bottle embedded device. Details of the architectures used for sip/non-sip classification are tabulated in
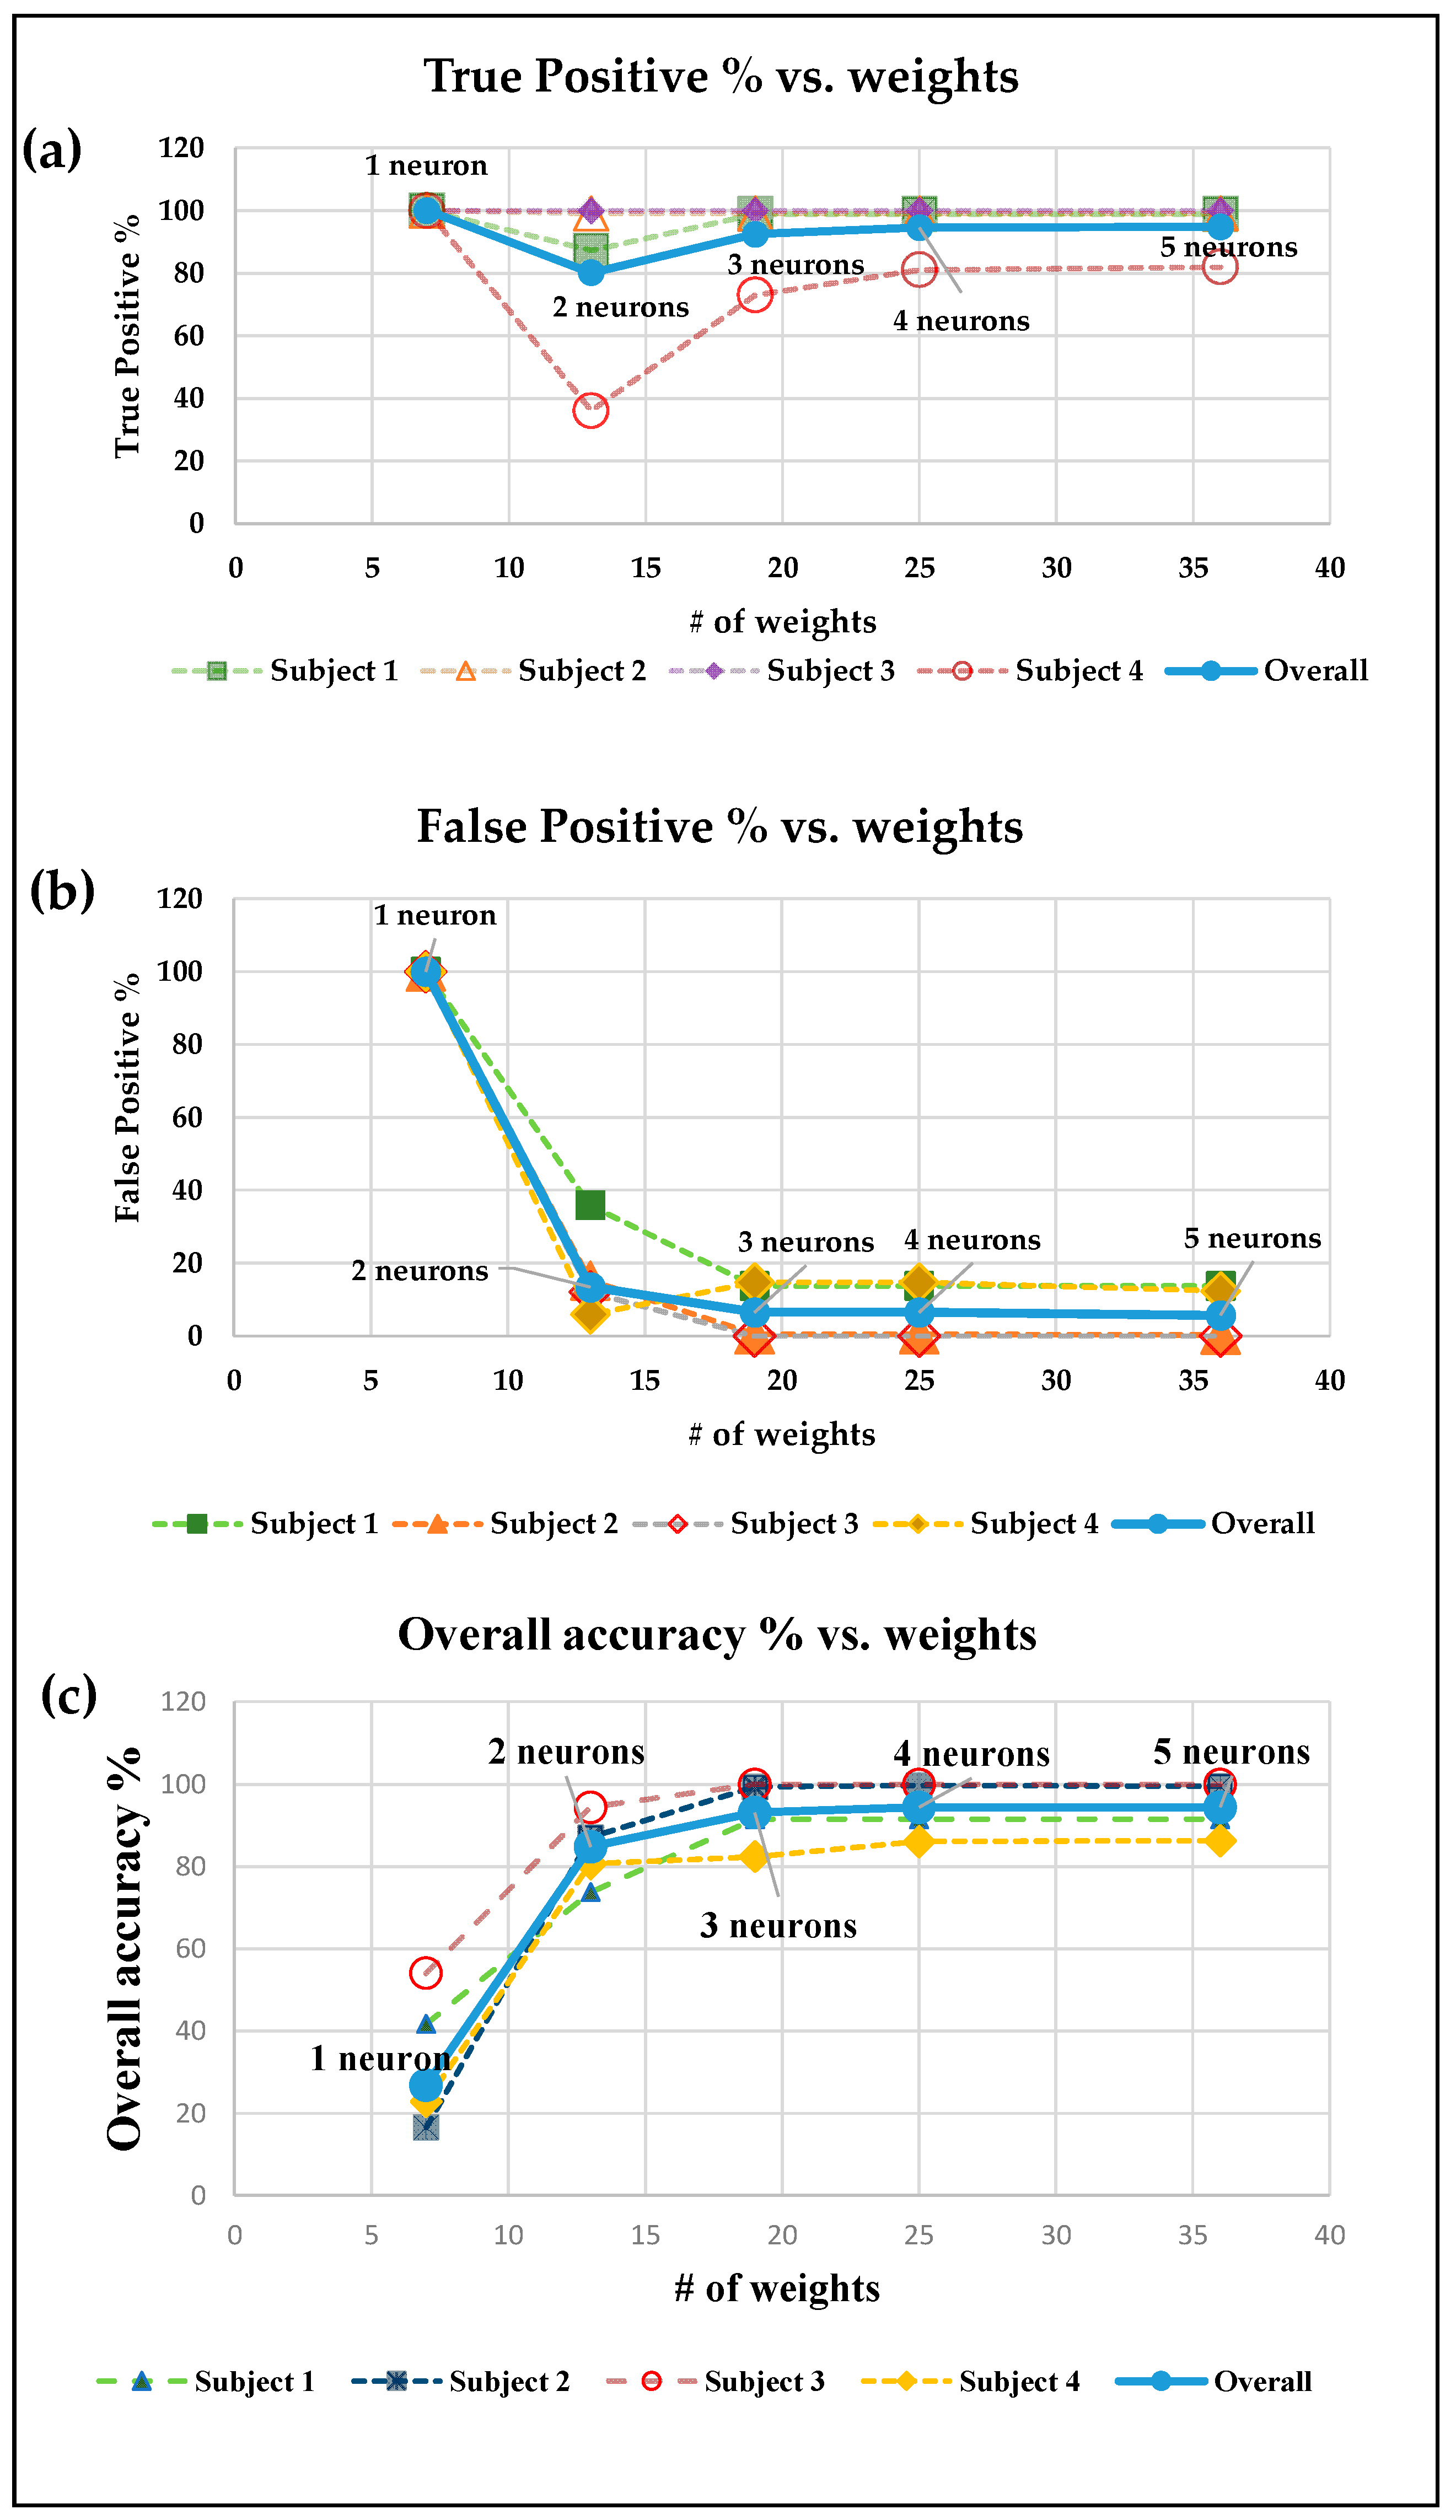
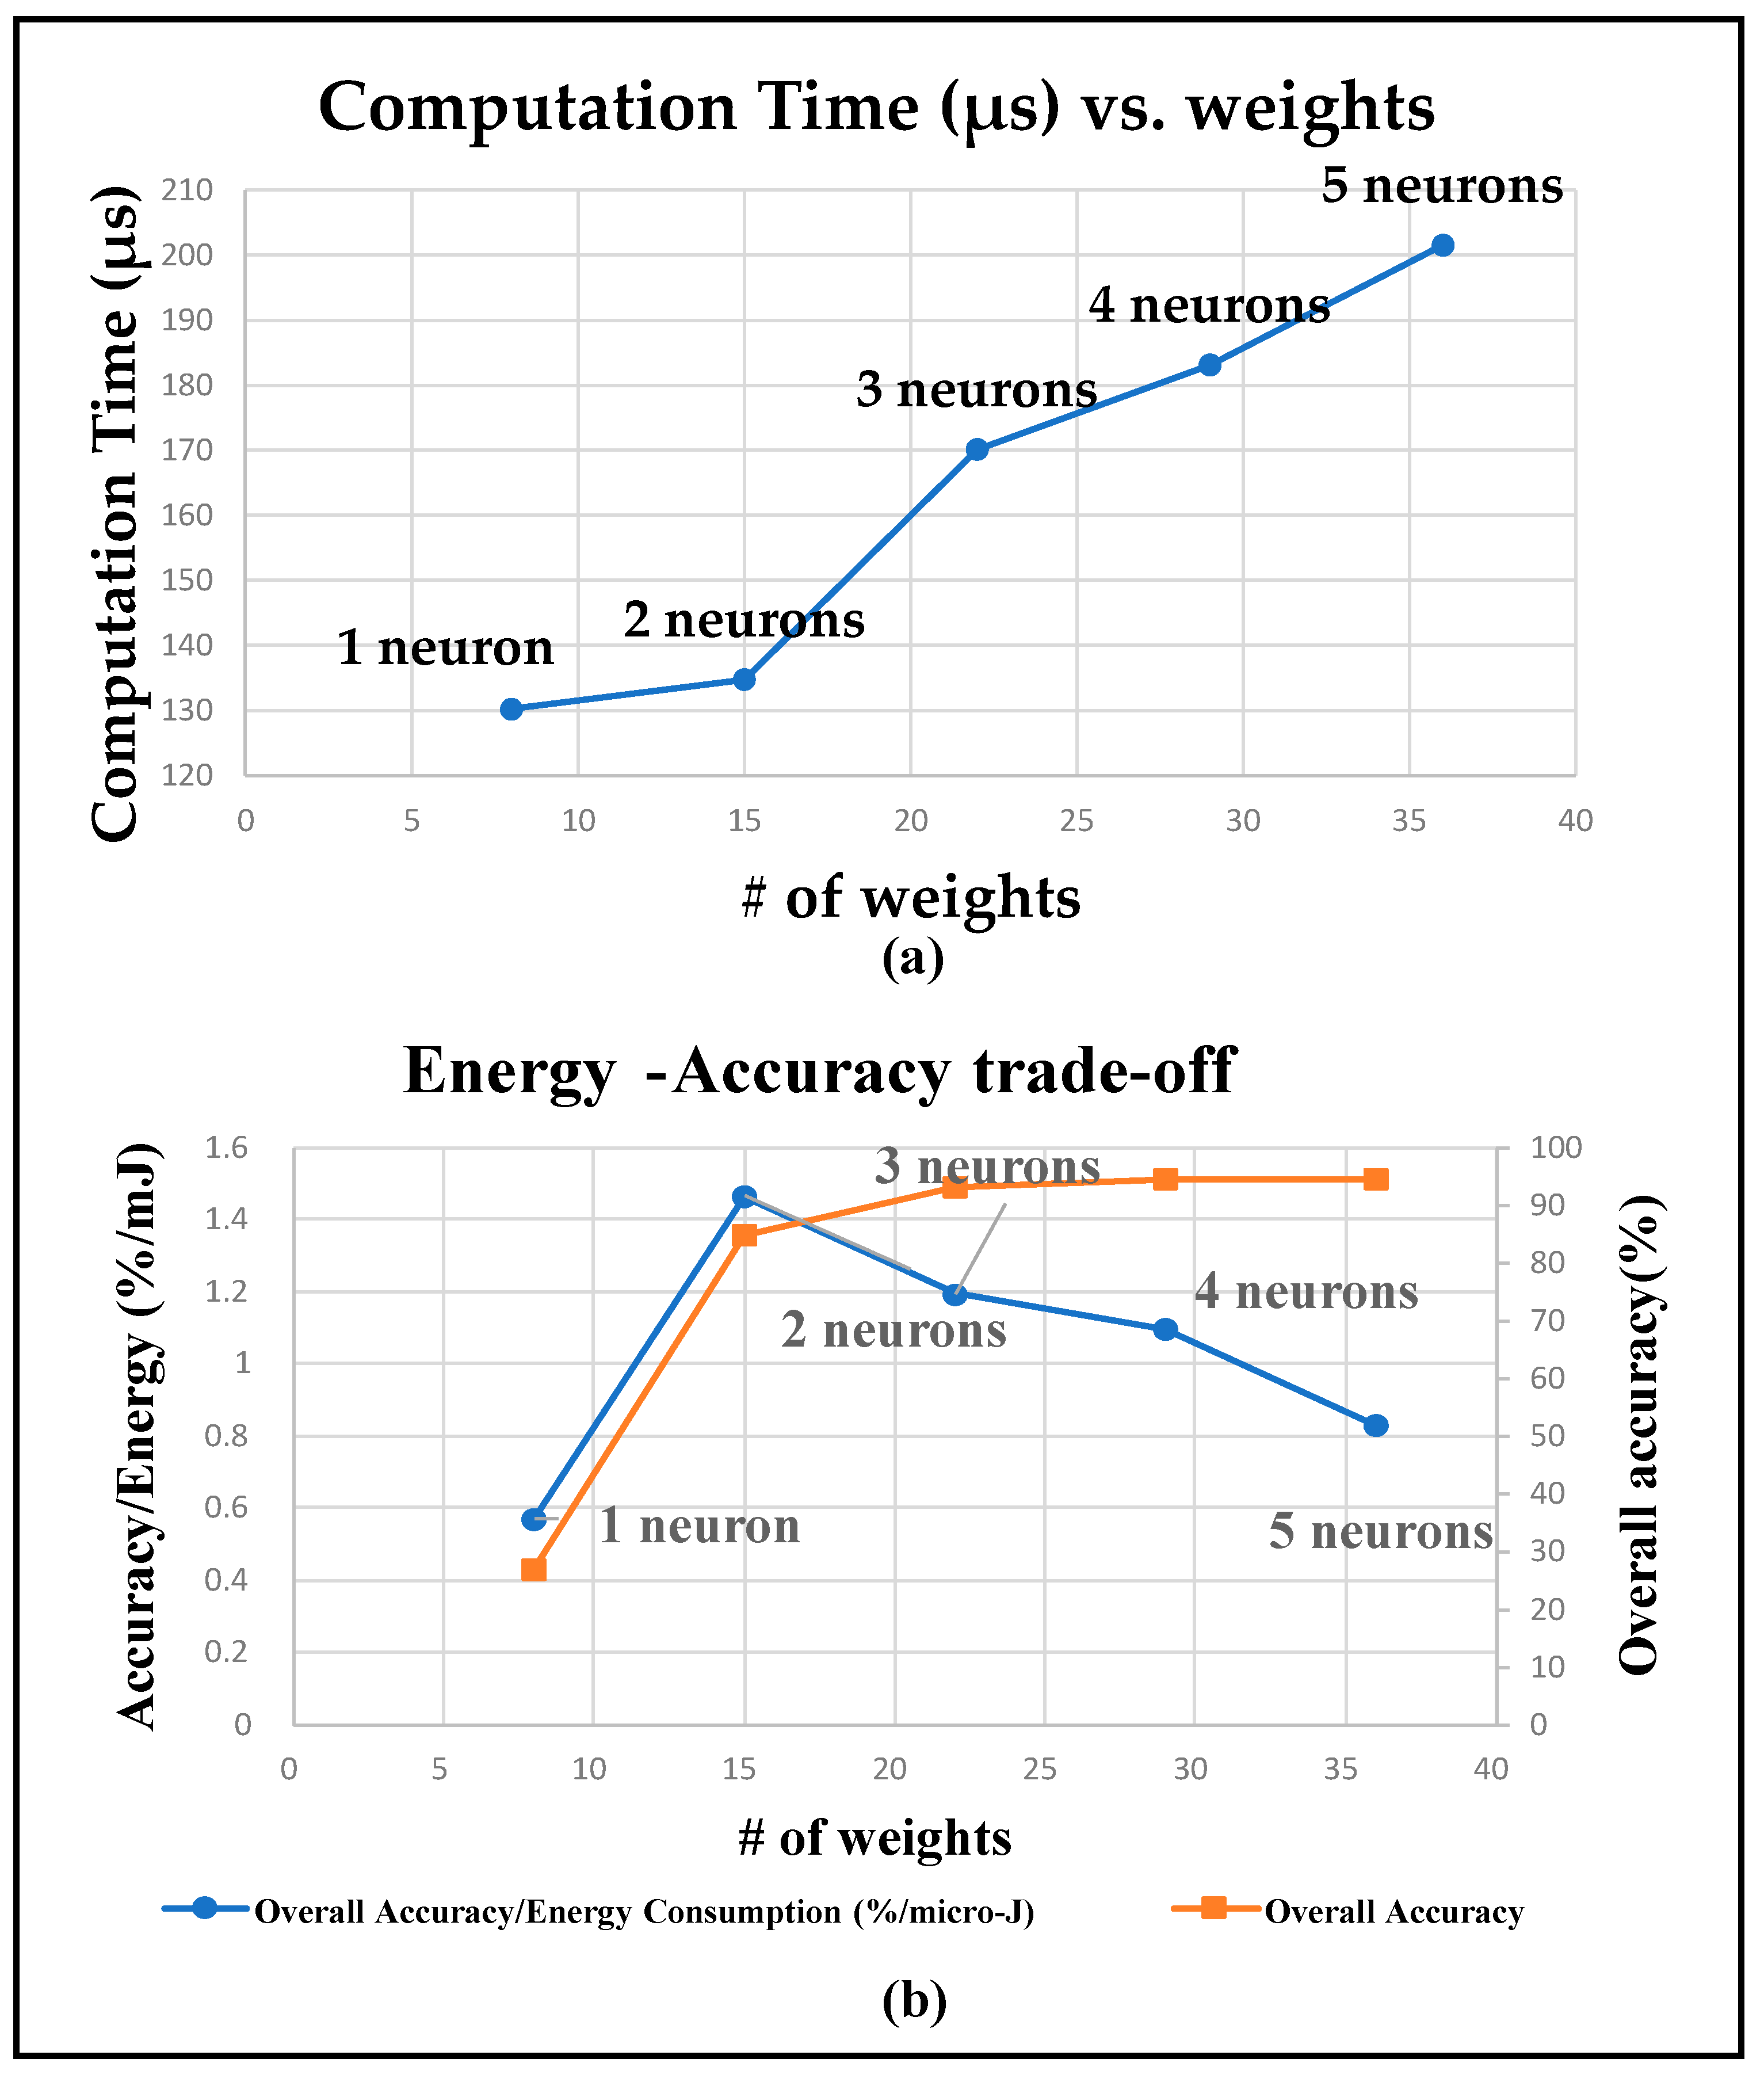
Table 2. To keep the system computationally lightweight for the on-bottle embedded platform, the number of weights in the NN is attempted to be kept as low as possible. To accomplish this, performance is tested mostly for models with a single hidden layer, while changing the number of neurons in that layer. It is shown in
Section 5 that a sip detection accuracy as high as 94% can be achieved with just one hidden layer. Experiments with a wider and deeper NN revealed that the performance of the NN does not improve by adding more neurons or hidden layers.
6. Predictive Drink Volume Estimation
Runtime drink volume estimation is performed using sip detections as described in
Section 2,
Section 3,
Section 4 and
Section 5. The algorithmic framework of the system is shown in
Figure 9. The input to the volume estimator is a time series of the sip events along with the heights of the specific sip events. The height represents the maximum inclination of the bottle during a sip event. The first sip after a bottle refill requires the minimum amount of maximum inclination of the bottle during a sip. Leveraging this property, the system detects the first-sips since bottle refill. From the detected first-sips and the known bottle volume, the system estimates the cumulative drink volume, as shown in
Figure 9. All the algorithmic details executed by each component of the schematic are given in
Section 6.3.
This framework solves the problem of volume estimation directly using only bottle inclination information reported in [
8,
9]. The amount of bottle tilt cannot provide accurate volume intake estimation measure because the drinking pattern and the volume of fluid intake per sip vary from person-to-person. Here, the neural network models detect the sips and first-sips (i.e., after a bottle refill instance) using the extracted features from the accelerometer readings and the fluid intake volume is computed using that information. Additionally, the self-error correction mechanism after every first sip detected avoids the estimation error being accumulated. Thus, this framework provides a generalized and robust way of estimating fluid intake volume which is person non-specific.
6.1. Data Collection and Feature Extraction
For training, sip data were collected using the bottle mounted IMU sensor shown in
Figure 1. In total, 300 sip events (12 per participant), labeled as a “first-sip” or “non-first-sip” after bottle refill, were recorded for five participants. For real time testing, experiments involving drinking events were conducted for the same five participants to determine accuracy–complexity tradeoffs.
Here represent three features as inputs to the neural network and is the sip height of the sip from the sip classifier module.
All three features capture the temporal gradient of the sip heights (i.e., bottle inclination) in discrete time. The rationale behind using these features is that while drinking, the inclination of the bottle increases with decrease in fluid level. As a result, the sip height values increase with the increase in sip counts until the bottle is refilled.
These three features are computed each time a sip is detected, and the features are then used by the pre-trained neural network model stored in the device for detecting a first sip since bottle refill. The neural network gives decision on whether a sip from the previous module a first sip is or not. Based on this decision, the volume of fluid intake by the user can be estimated using the algorithm discussed in
Section 6.3.
6.2. First-Sip Detection Using Neural Network
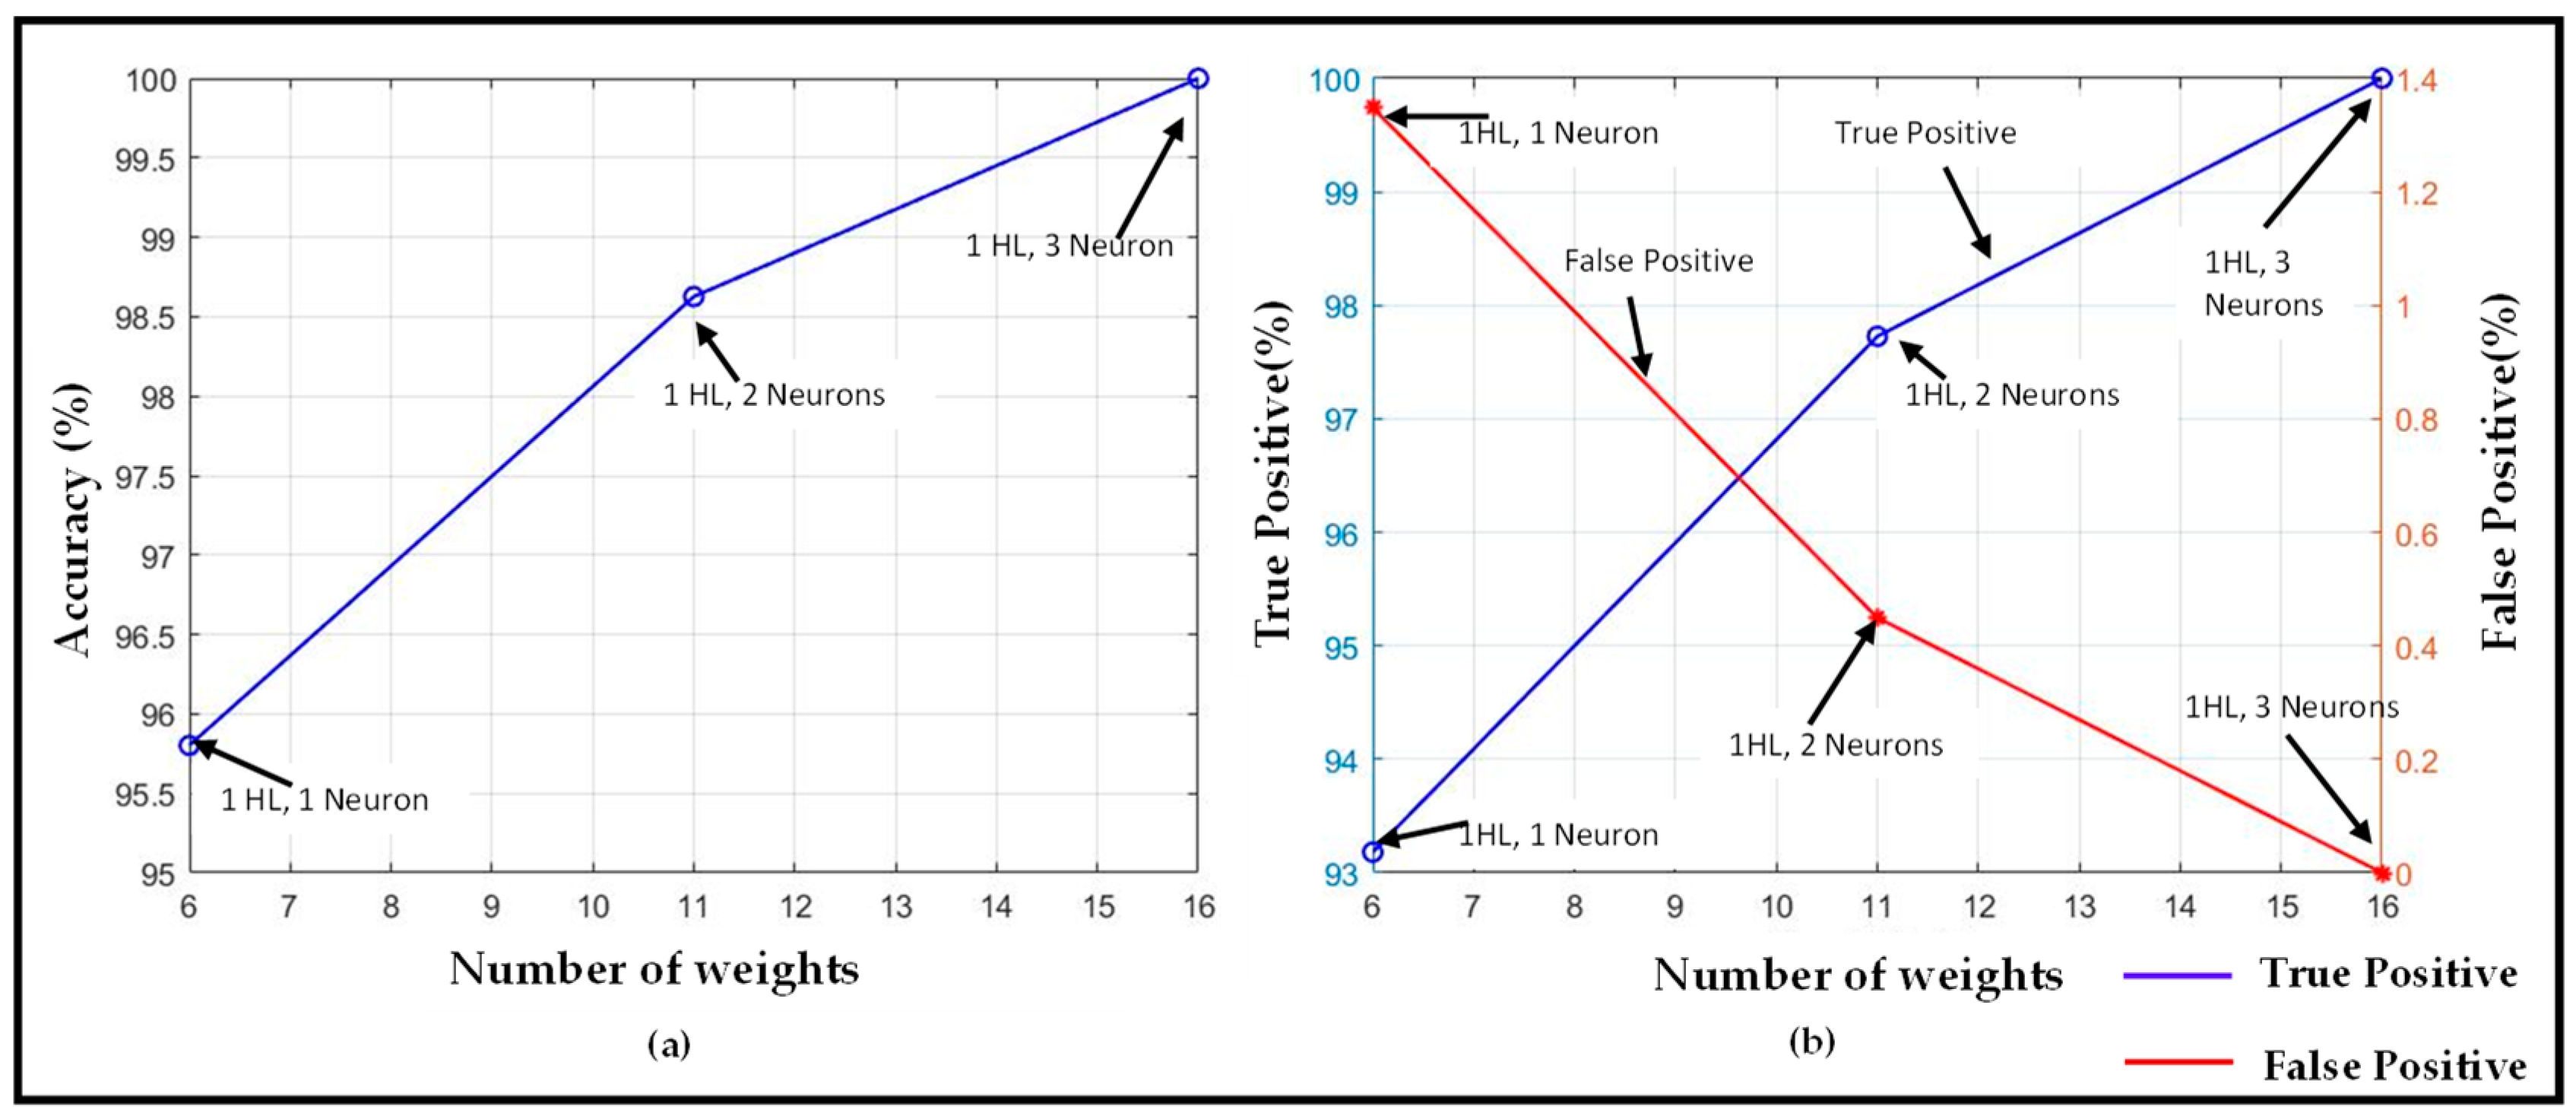
Similar to the sip detection part of the system, we retain the design goal of low classification–computational complexity, which is suitable for embedded on-device hardware. Experiments are performed with a one-hidden-layer model for varying number of neurons, and with general NN features summarized in
Table 4. The first-sip detection results using that NN are presented in
Figure 10. As expected, with an increase in the number of neurons (i.e., corresponding number of weights in the network), the overall accuracy and true positive rate increases. They eventually reach
for three neurons in the hidden layer. At the same time, the false positive rate decreases to zero. These results are noteworthy given the fact that such a high accuracy is achievable with an NN with a single hidden layer. The fact that such a high accuracy is achieved using only one hidden layer can be justified by the observation that the neural network for first-sip detection takes the input of time-series data of sip heights from the sip classification module. As explained in the prior sections, the sip detection accuracy of the sip classifier module is high (
). As the accuracy of the first-sip detection module depends on the sip classifying module, it is possible to achieve such high accuracy with only one hidden layer.
6.3. Volume Estimation
Algorithm 1 describes the logic of cumulative volume estimation based on sip detection and the other conditions described above. The algorithm is executed upon each instance of a new sip detection, after which the current cumulative consumed volume is reported. These estimation results and their accuracies are reported in
Figure 11.
As explained in
Section 6.1, the volume estimation module takes time-series data of sip heights as inputs from the sip classifier module. The neural network takes the features computed using Equations (10)–(12) as inputs for detecting a first sip since bottle refill. For each sip detected as first-sip, all the sips prior to that are considered as the sips required to make the bottle empty. The number of such” non-first sips” is then mapped to the bottle volume
. The running estimation of volume per sip can be computed as
, where
is the number of sips prior to a first sip. This quantity is continuously updated as new sip events arrive from the sip detection module. For each incoming
sip from the sip classifier, the intake volume is updated as
.
There can be certain scenarios when some sips are not detected by the sip classifier module, but to reduce the effect of these misclassifications, the algorithm uses a self-correction mechanism for every first sip detected by resetting the estimated volume for that drinking cycle equal to the known bottle volume.
This is done by computing the intake volume estimation error after each first-sip detected:
| Algorithm 1 Predictive Volume Estimation |
1: Input: Time-series data of Sip heights from Sip Classifier module // is the peak height of sip
2: Output: Estimated Volume of intake fluid
3: Initialize Sip Counter
4. for with peak
5: Compute features of
6: Predict if is a first sip using Neural Network
7: if then:
8: Increment
9: //Estimate volume intake
10: end if
11: if then
12: //Estimate volume intake
13: //Estimate error
14: Update
15: Update
16: Reset
17: end if
18: end for |
Here, is the known measured volume of the bottle and is the number of sips prior to a first sip.
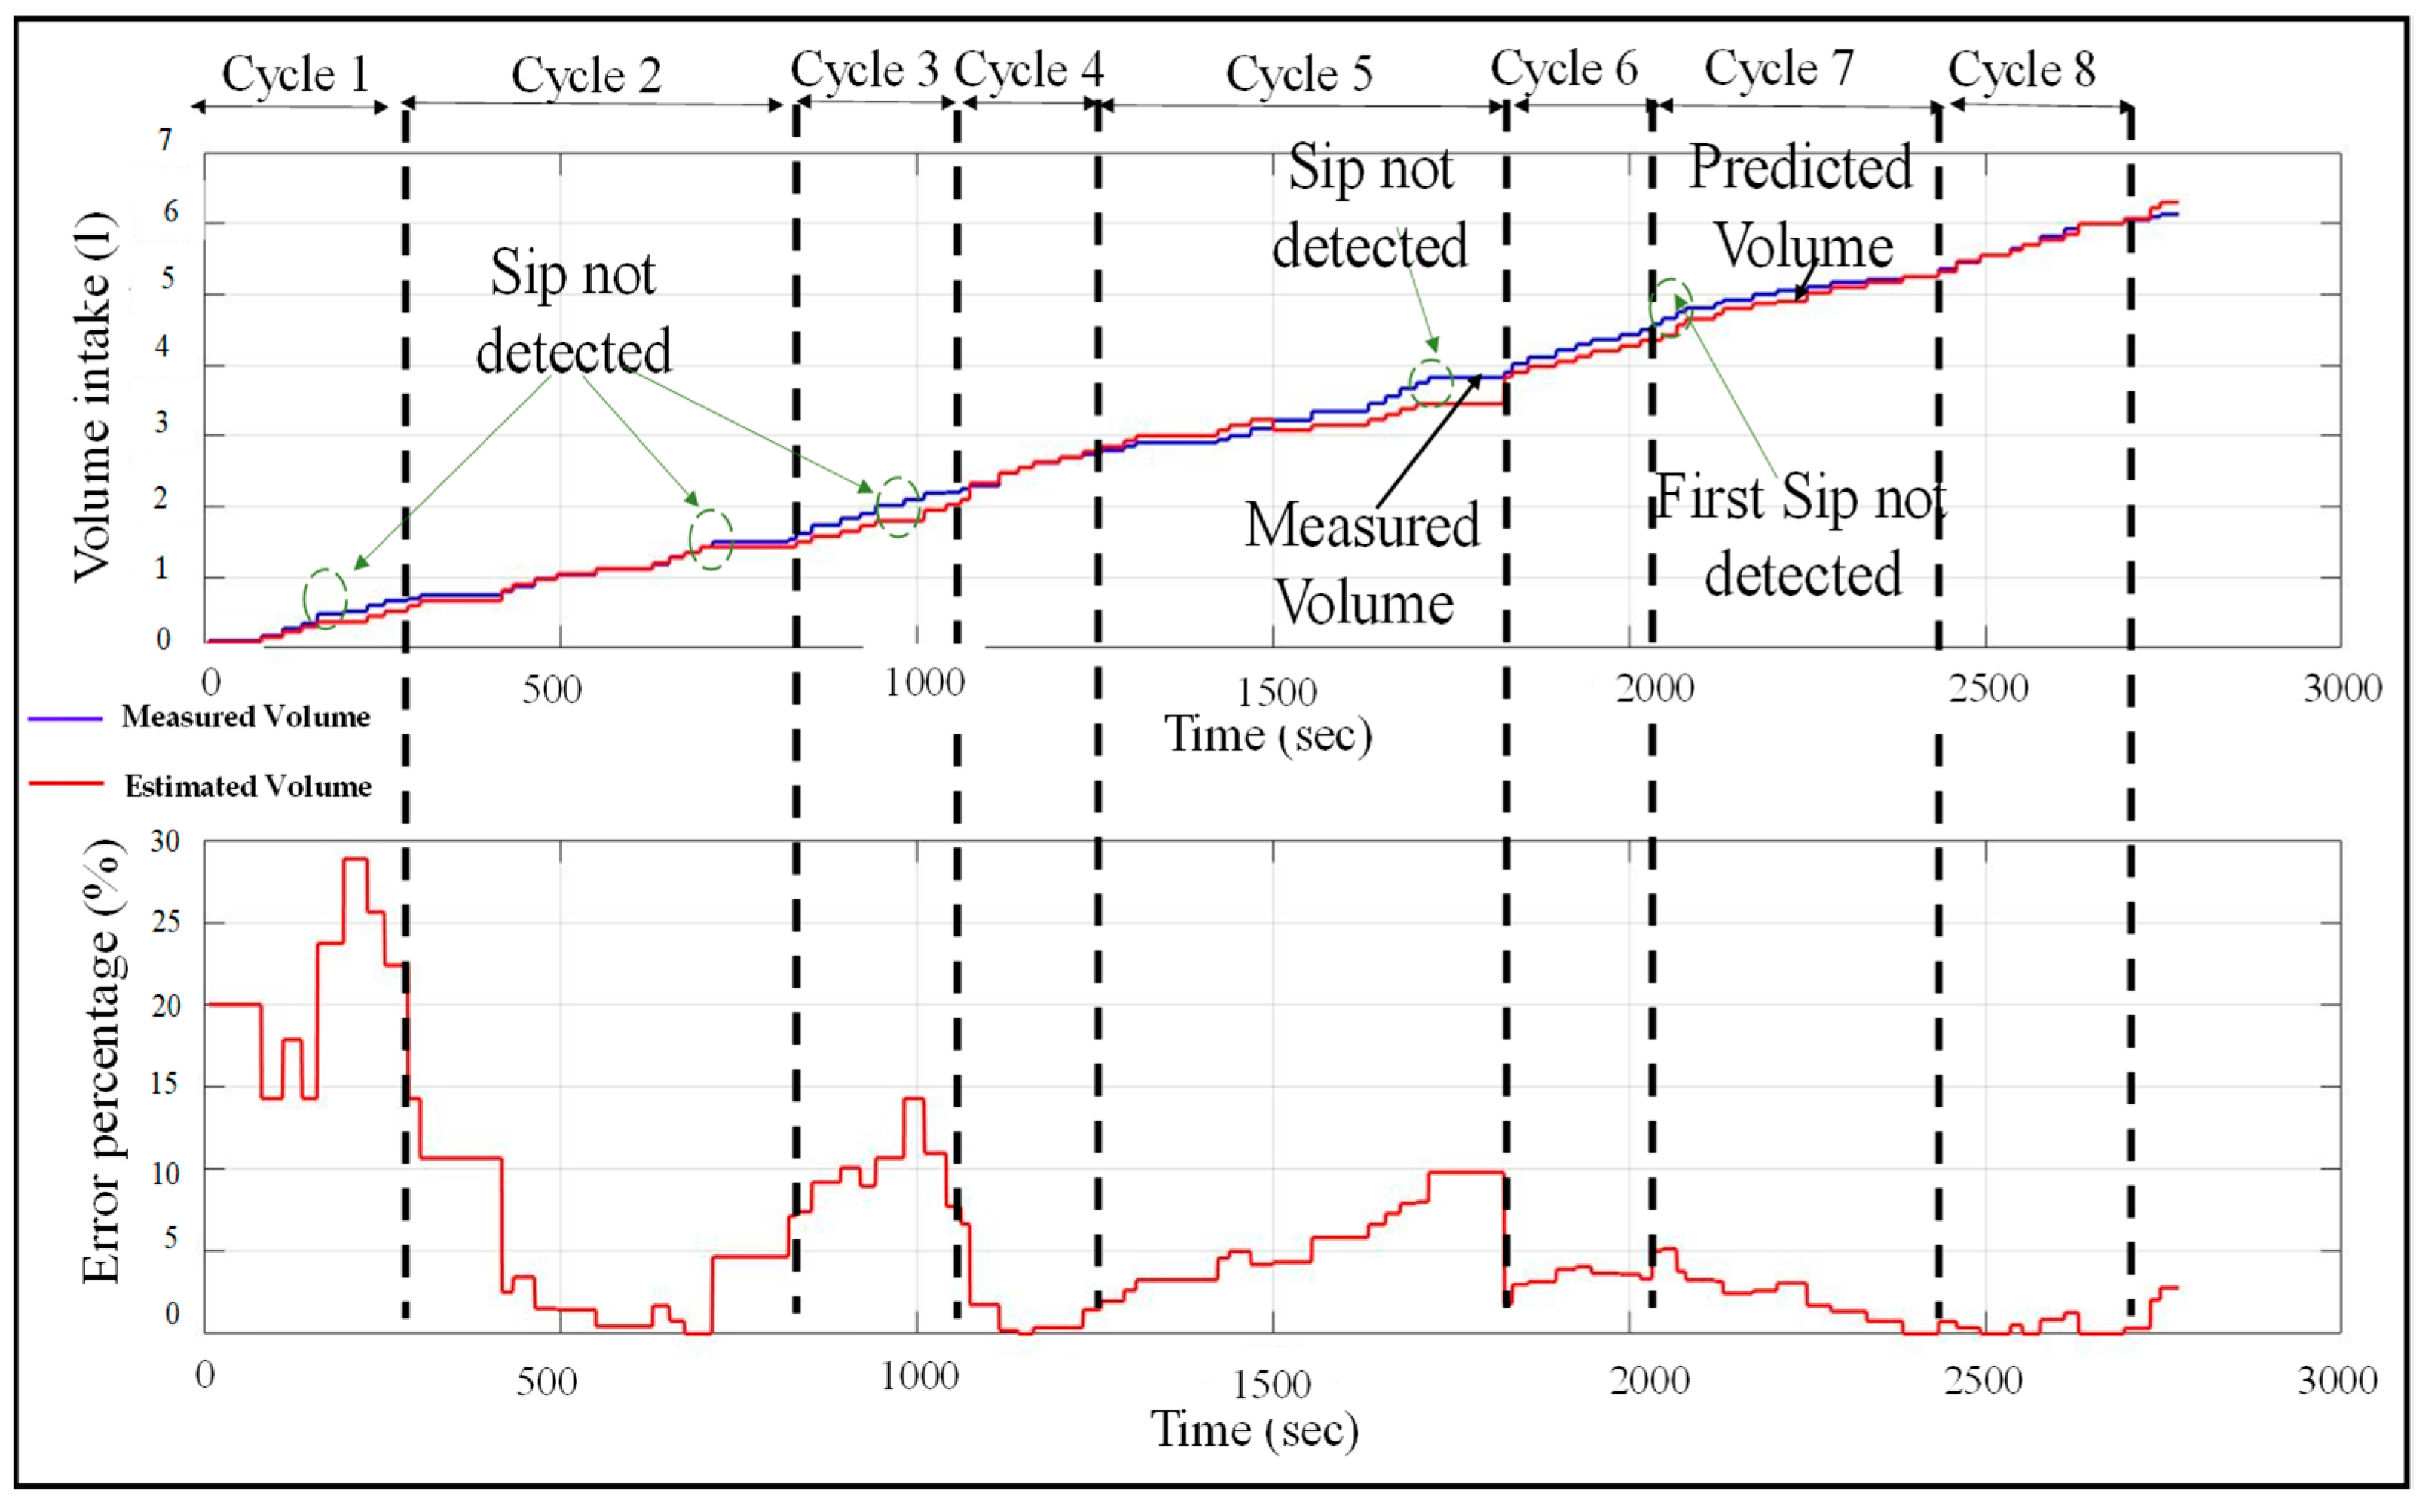
The performance of the volume estimation module using Algorithm 1 is presented in
Figure 11. The neural network for the sip classifier module used here has two neurons in its only hidden layer. The figure plots the estimated and true volume intake over a span of eight drinking cycles. The true volume indicates the volume intake calculated from the fill height of the bottle recorded after each drink. Here, each drinking cycle represents a period between two bottle refills. In the figure, the dotted lines separate two drinking cycles. The plot is updated with an increase in volume intake value each time a sip is taken by the user and/or a sip is detected by the sip classifier module. This indicates that the plot is updated only at certain time instances, which describe its stepped behavior. It can be observed that there are some sips that are not detected by the sip classifier module.
The sips not detected by the classifier are shown by the green circles in the figure. In those instances, where the sips are not detected, the estimated volume does not increase. This leads to an increase in the error percentage in volume estimation. However, because of the self-correction mechanism used by the volume estimator as described above, the error does not accumulate and reduces each time when a first sip is detected. Although the estimation error lies in the range , the error reduces whenever a first sip is detected. This makes the system robust to the sip classification errors from the sip classifier. Note that for each first-sip detected, the estimation error does not always decrease to zero. This is because of the estimation error associated with the first-sip intake, that is, the difference between the estimated and true first-sip volume.
Note that the self-error correction mechanism of this framework of volume estimation works even in scenarios of missed first-sip detection or if the bottle is not fully refilled. This can be observed from
Figure 11, where there is an instance of missed first-sip detection. In this case, the error accumulates until the estimated volume equals full bottle volume. After that, the estimated volume intake remains constant at the known bottle volume (
) and the volume estimation error also stops accumulating until the next first-sip detection. Thus, this mechanism is robust to the scenarios where the bottle is partially filled, or the neural network model misses a first sip.


