
Field Evaluation and Calibration of Low-Cost Air Pollution Sensors for Environmental Exposure Research

 ,
,  ,
,  ,
, 

Abstract
:1. Introduction
2. Materials and Methods
2.1. Sensors and Study Sites
2.2. Evaluation of Correlation, Accuracy, and Bias of Data Collected with Low-Cost PM Sensors
2.3. Machine Learning-Based Calibration Model Development and Validation
3. Results
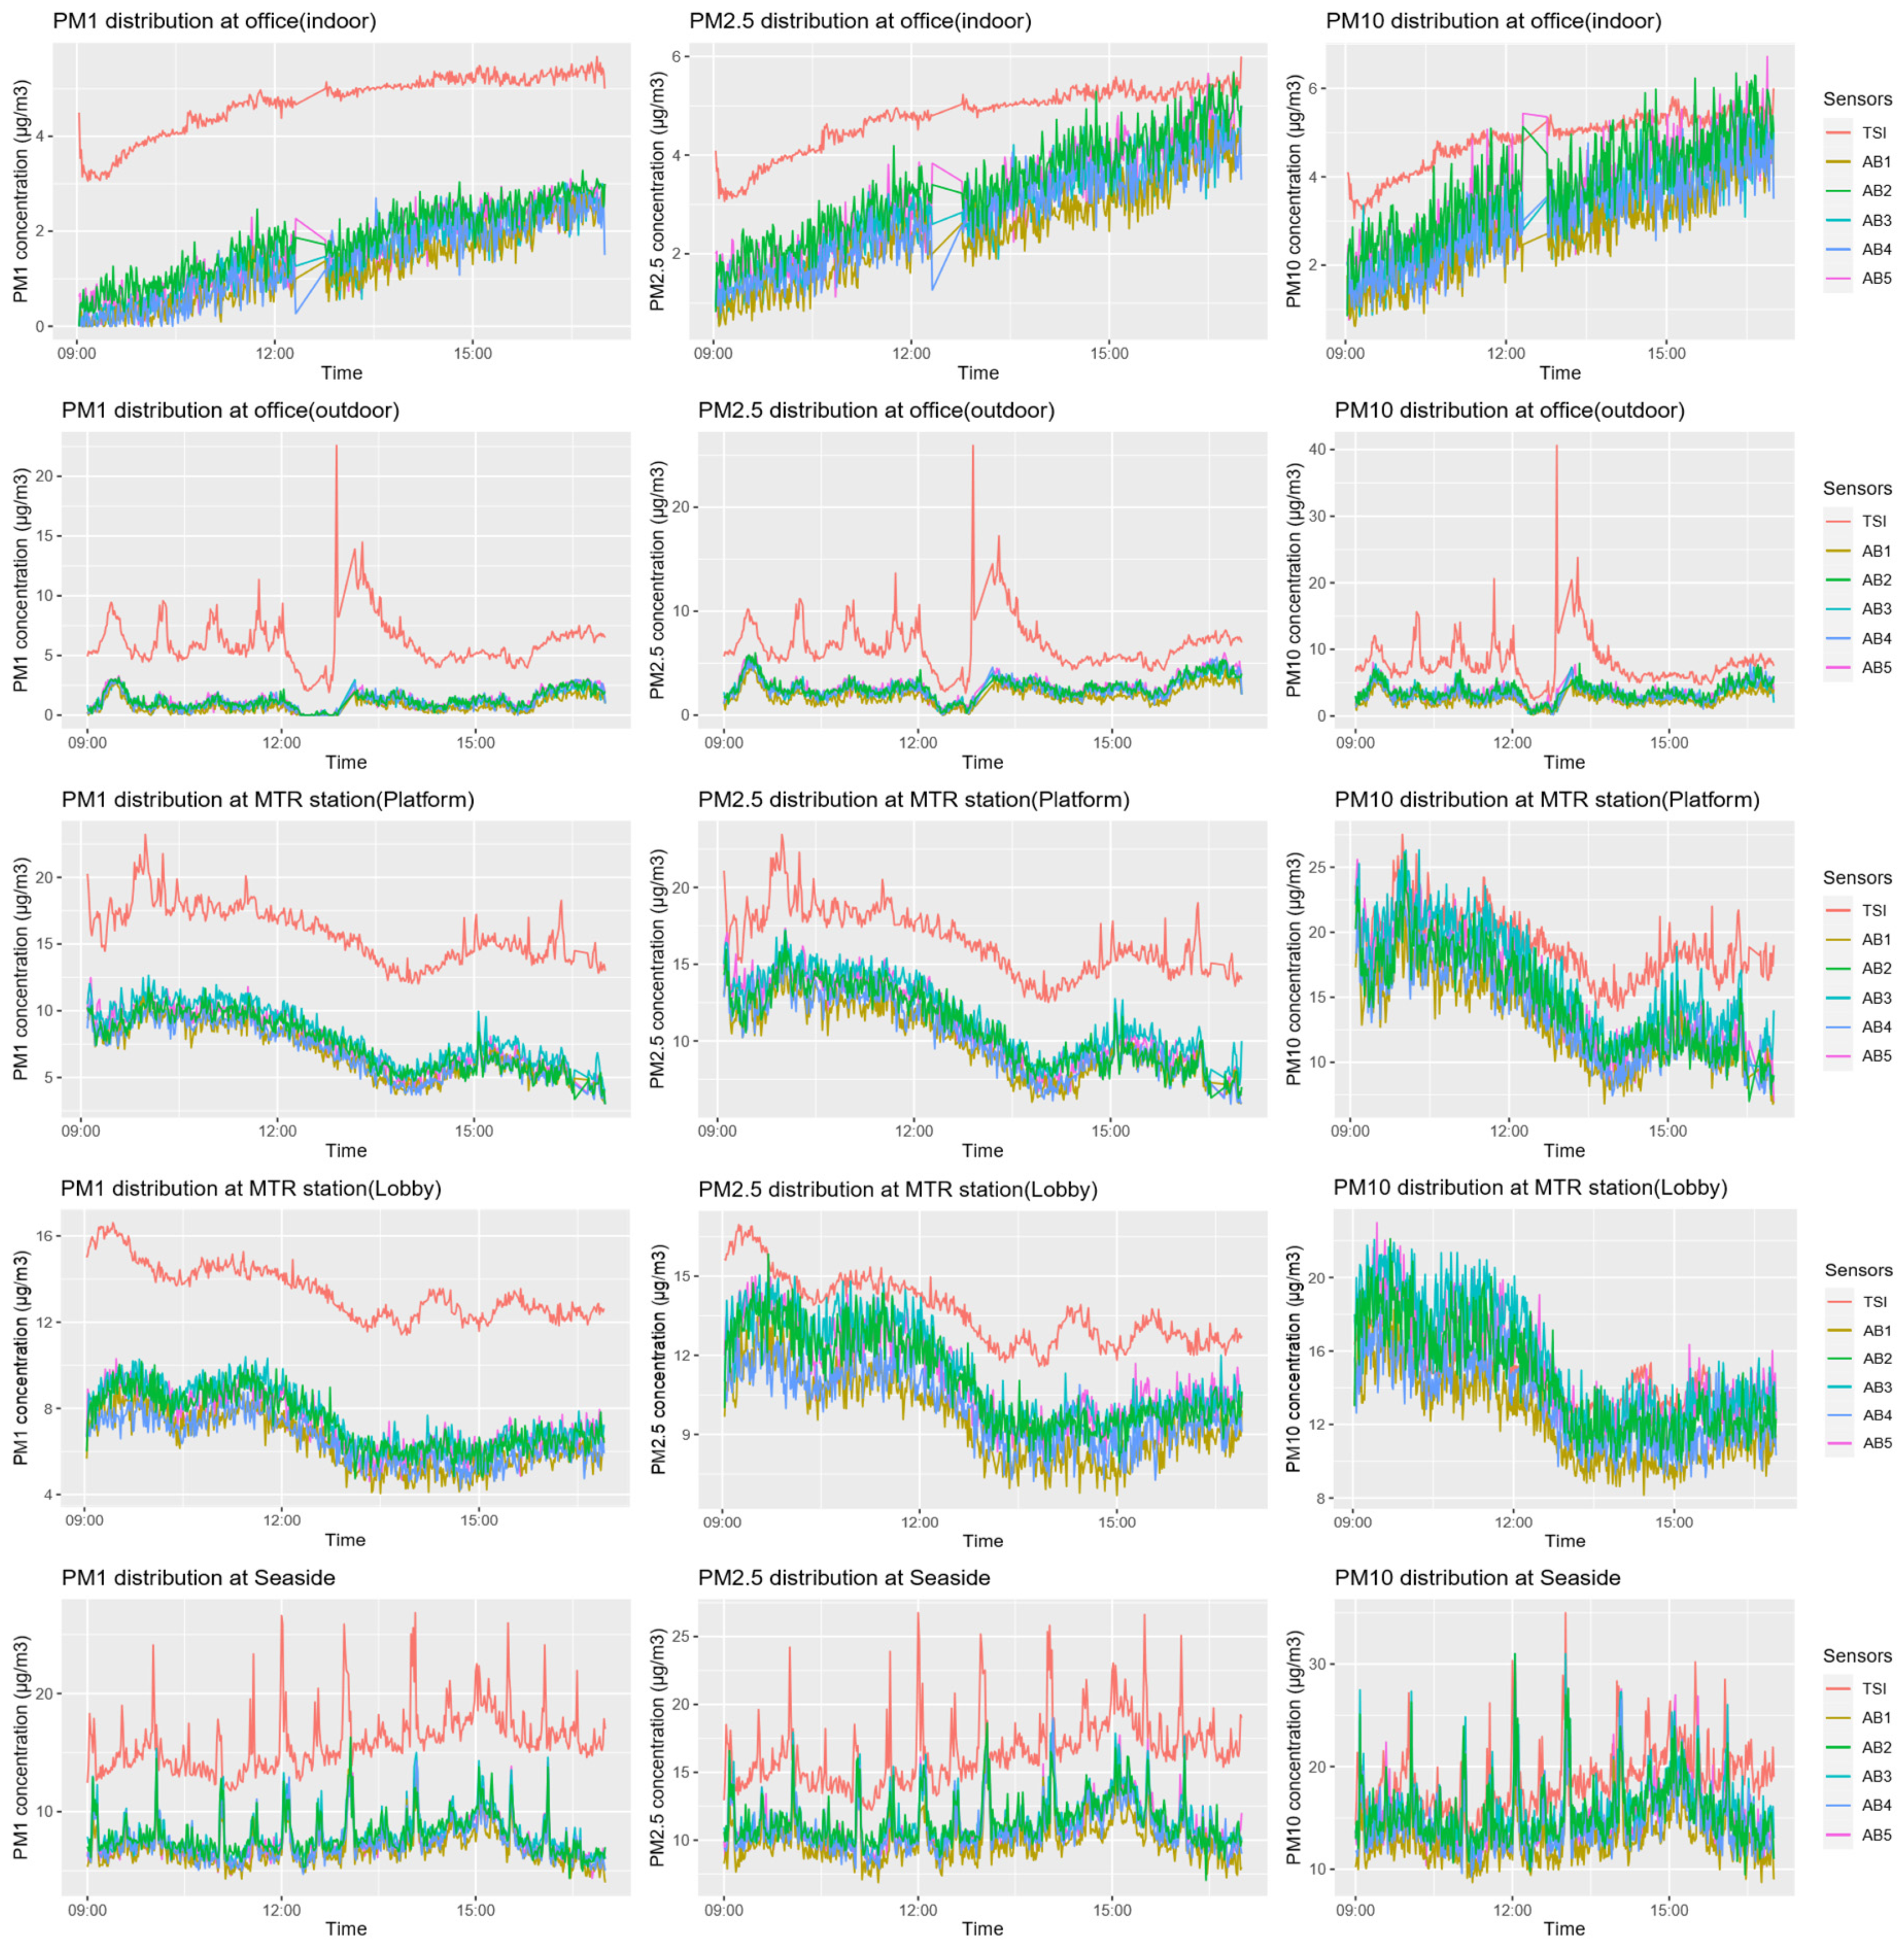
3.1. PM1, PM2.5, and PM10 Concentrations Collected by Sensors in Different Environments
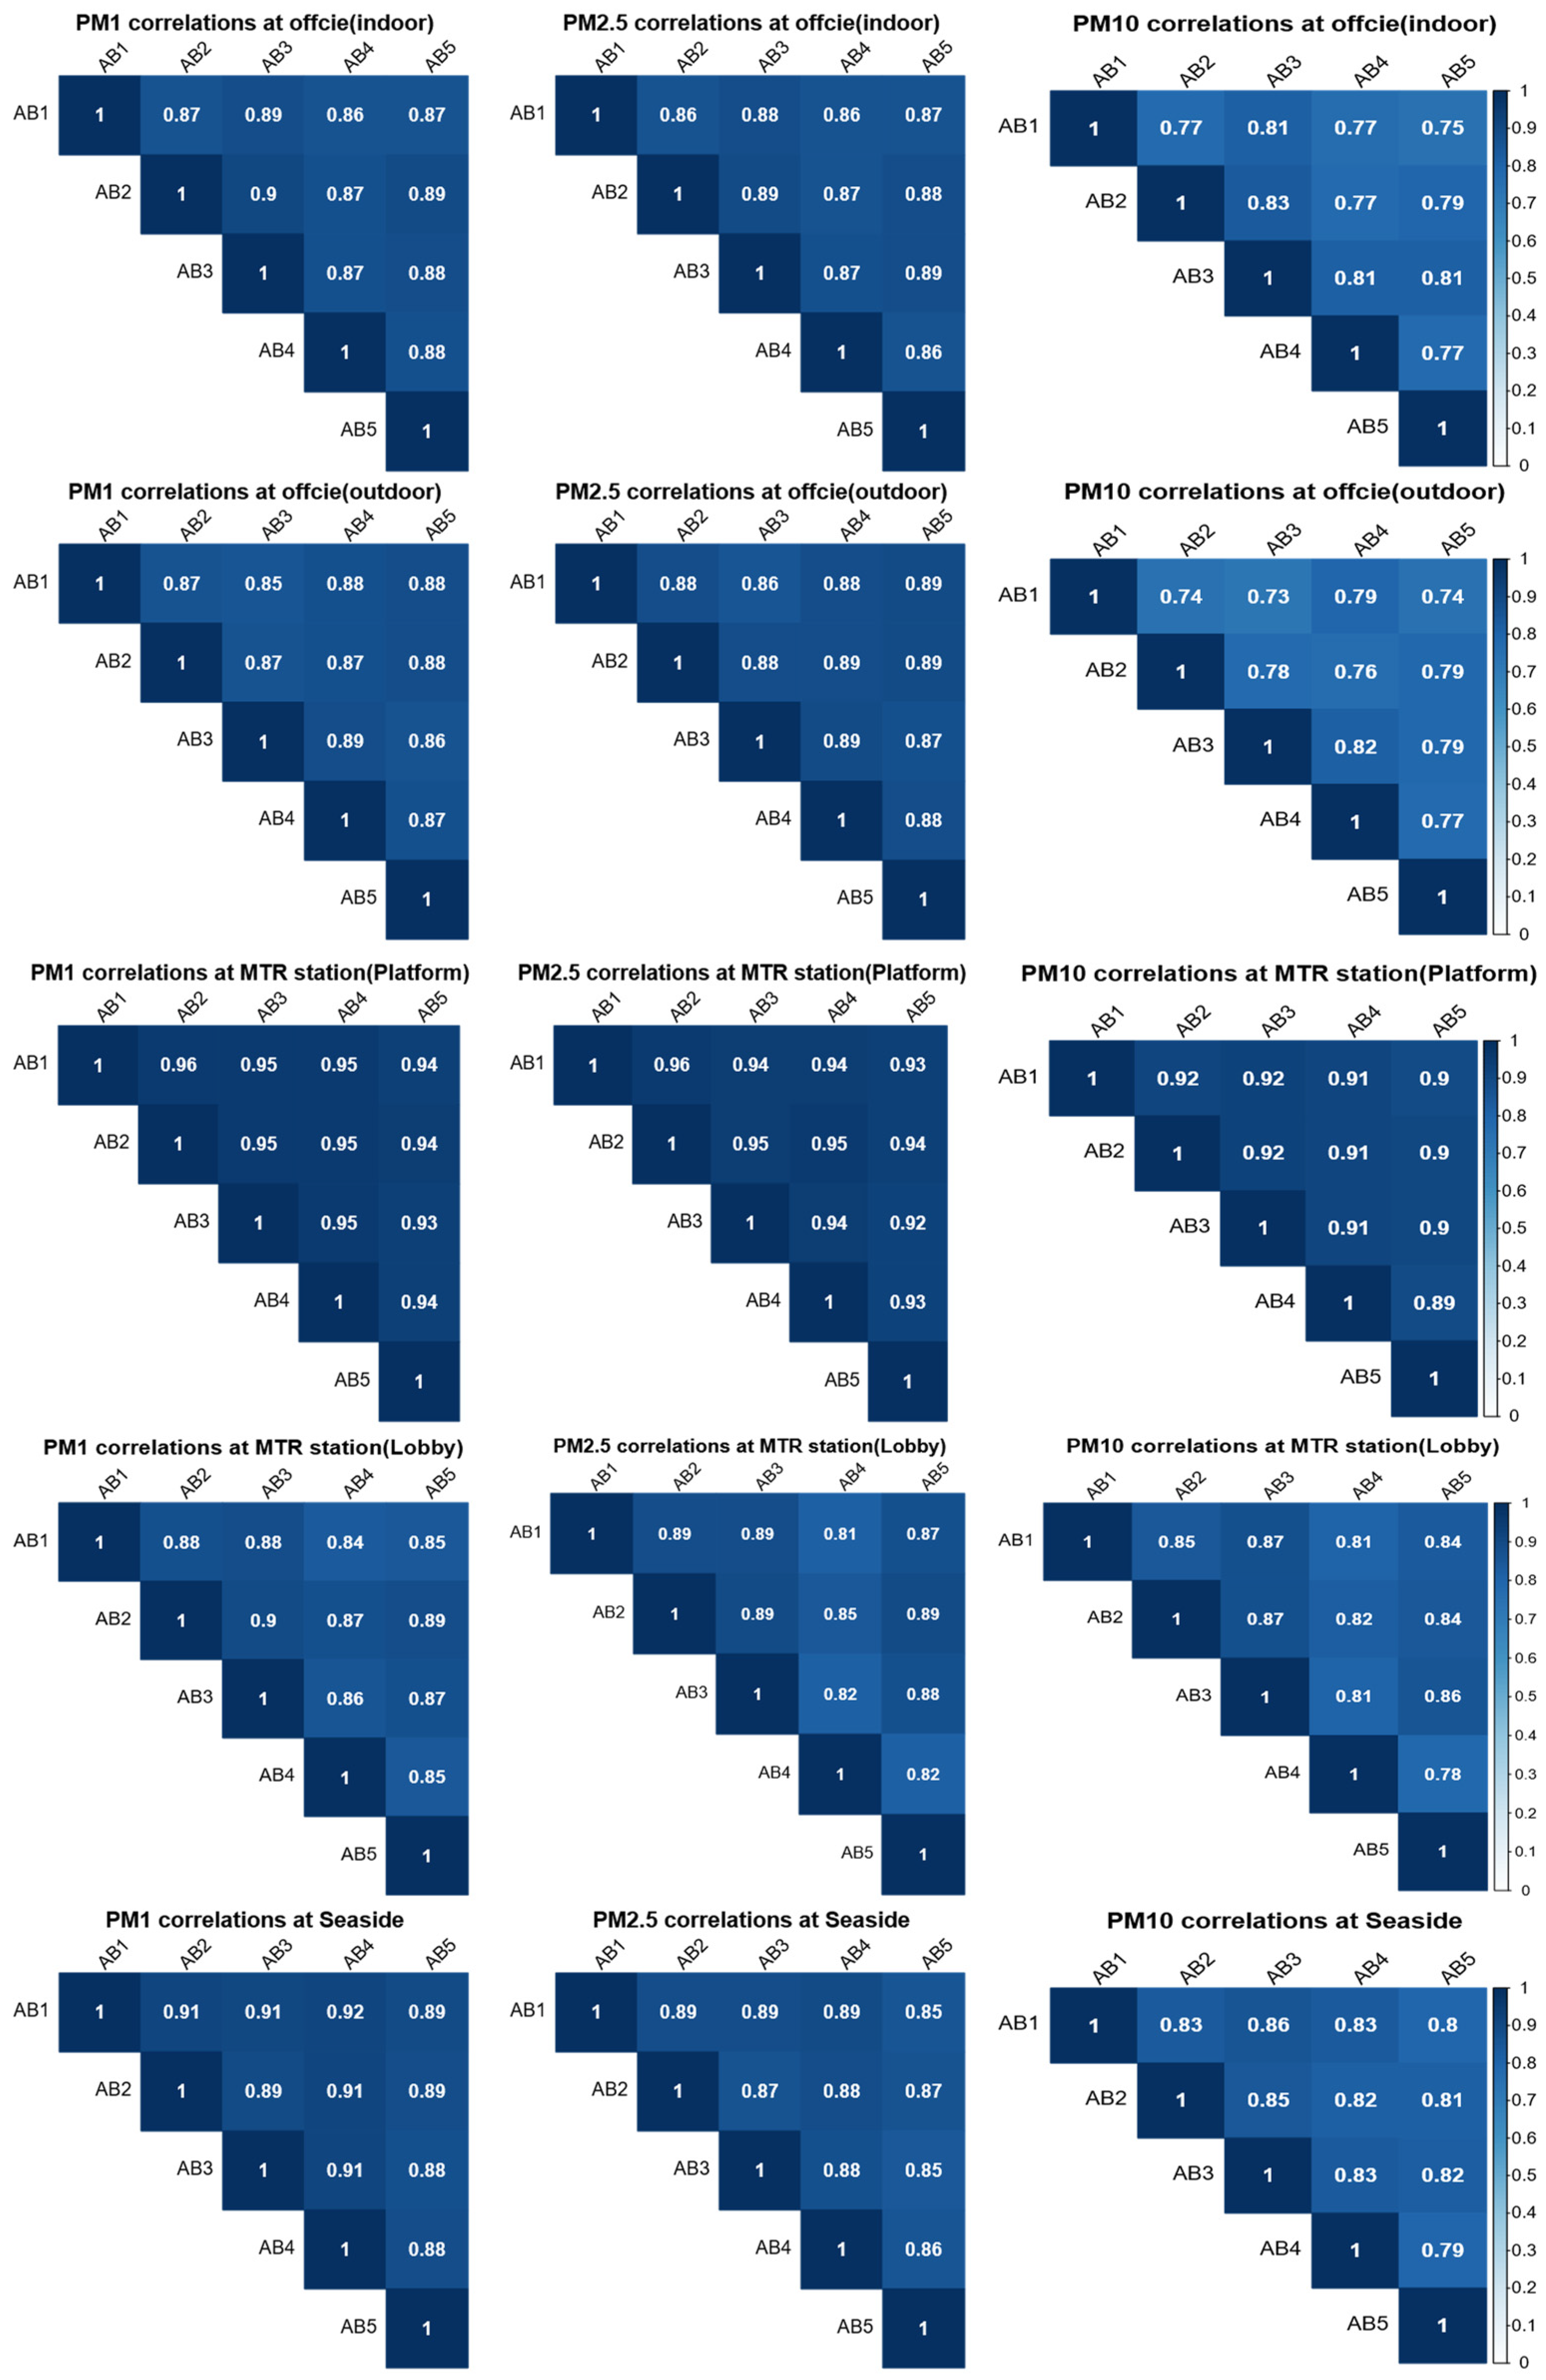
3.2. Sensor Performance in Different Environments
3.3. Sensor Performance in Different Temporal Units
3.4. Machine Learning-Based Calibration and Validation
4. Discussion
5. Conclusions
Supplementary Materials
Author Contributions
Funding
Data Availability Statement
Conflicts of Interest
References
- Ghazi, L.; Drawz, P.E.; Berman, J.D. The association between fine particulate matter (PM2.5) and chronic kidney disease using electronic health record data in urban Minnesota. J. Expo. Sci. Environ. 2021, 1–7. [Google Scholar] [CrossRef] [PubMed]
- Arcaya, M.C.; Tucker-Seeley, R.D.; Kim, R.; Schnake-Mahl, A.; So, M.; Subramanian, S.V. Research on neighborhood effects on health in the United States: A systematic review of study characteristics. Soc. Sci. Med. 2016, 168, 16–29. [Google Scholar] [CrossRef] [PubMed] [Green Version]
- Kwan, M.P.; Wang, J.; Tyburski, M.; Epstein, D.H.; Kowalczyk, W.J.; Preston, K.L. Uncertainties in the geographic context of health behaviors: A study of substance users’ exposure to psychosocial stress using GPS data. Int. J. Geogr. Inf. Sci. 2019, 33, 1176–1195. [Google Scholar] [CrossRef]
- Ma, J.; Tao, Y.; Kwan, M.P.; Chai, Y. Assessing mobility-based real-time air pollution exposure in space and time using smart sensors and GPS trajectories in Beijing. Ann. Am. Assoc. Geogr. 2020, 110, 434–448. [Google Scholar] [CrossRef]
- Ma, X.; Li, X.; Kwan, M.P.; Chai, Y. Who Could Not Avoid Exposure to High Levels of Residence-Based Pollution by Daily Mobility? Evidence of Air Pollution Exposure from the Perspective of the Neighborhood Effect Averaging Problem (NEAP). Int. J. Environ. Res. Public Health 2020, 17, 1223. [Google Scholar] [CrossRef] [Green Version]
- Huang, J.; Kwan, M.P. Uncertainties in the assessment of COVID-19 risk: A Study of people’s exposure to high-risk environments using individual-level activity data. Ann. Am. Assoc. Geogr. 2021, 1–20. [Google Scholar] [CrossRef]
- Kim, J.; Kwan, M.P. How Neighborhood Effect Averaging Might Affect Assessment of Individual Exposures to Air Pollution: A Study of Ozone Exposures in Los Angeles. Ann. Am. Assoc. Geogr. 2021, 111, 121–140. [Google Scholar] [CrossRef]
- Lu, Y. Beyond air pollution at home: Assessment of personal exposure to PM2.5 using activity-based travel demand model and low-cost air sensor network data. Environ. Res. 2021, 201, 111549. [Google Scholar] [CrossRef]
- Poom, A.; Willberg, E.; Toivonen, T. Environmental exposure during travel: A research review and suggestions forward. Health Place 2021, 70, 102584. [Google Scholar] [CrossRef]
- Kwan, M.P. The uncertain geographic context problem. Ann. Am. Assoc. Geogr. 2012, 102, 958–968. [Google Scholar] [CrossRef]
- Kwan, M.P. The neighborhood effect averaging problem (NEAP): An elusive confounder of the neighborhood effect. Int. J. Environ. Res. Public Health 2018, 15, 1841. [Google Scholar] [CrossRef] [PubMed] [Green Version]
- Kim, J.; Kwan, M.P. Assessment of sociodemographic disparities in environmental exposure might be erroneous due to neighborhood effect averaging: Implications for environmental inequality research. Environ. Res. 2021, 195, 110519. [Google Scholar] [CrossRef] [PubMed]
- Yoo, E.; Rudra, C.; Glasgow, M.; Mu, L. Geospatial estimation of individual exposure to air pollutants: Moving from static monitoring to activity-based dynamic exposure assessment. Ann. Am. Assoc. Geogr. 2015, 105, 915–926. [Google Scholar] [CrossRef]
- Park, Y.M.; Kwan, M.P. Individual exposure estimates may be erroneous when spatiotemporal variability of air pollution and human mobility are ignored. Health Place 2017, 43, 85–94. [Google Scholar] [CrossRef] [PubMed]
- Roberts, H.; Helbich, M. Multiple environmental exposures along daily mobility paths and depressive symptoms: A smartphone-based tracking study. Environ. Int. 2021, 156, 106635. [Google Scholar] [CrossRef] [PubMed]
- Jerrett, M.; Donaire-Gonzalez, D.; Popoola, O.; Jones, R.; Cohen, R.C.; Almanza, E.; De Nazelle, A.; Mead, I.; Carrasco-Turigas, G.; Cole-Hunter, T.; et al. Validating novel air pollution sensors to improve exposure estimates for epidemiological analyses and citizen science. Environ. Res. 2017, 158, 286–294. [Google Scholar] [CrossRef] [PubMed]
- Rai, A.C.; Kumar, P.; Pilla, F.; Skouloudis, A.N.; Di Sabatino, S.; Ratti, C.; Yasar, A.; Rickerby, D. End-user perspective of low-cost sensors for outdoor air pollution monitoring. Sci. Total Environ. 2017, 607, 691–705. [Google Scholar] [CrossRef] [PubMed] [Green Version]
- Wang, J.; Kwan, M.P.; Chai, Y. An innovative context-based crystal-growth activity space method for environmental exposure assessment: A study using GIS and GPS trajectory data collected in Chicago. Int. J. Environ. Res. Public Health 2018, 15, 703. [Google Scholar] [CrossRef] [PubMed] [Green Version]
- Wang, J.; Kou, L.; Kwan, M.P.; Shakespeare, R.M.; Lee, K.; Park, Y.M. An Integrated Individual Environmental Exposure Assessment System for Real-Time Mobile Sensing in Environmental Health Studies. Sensors 2021, 21, 4039. [Google Scholar] [CrossRef] [PubMed]
- Mukherjee, A.; Stanton, L.G.; Graham, A.R.; Roberts, P.T. Assessing the utility of low-cost particulate matter sensors over a 12-week period in the Cuyama valley of California. Sensors 2017, 17, 1805. [Google Scholar] [CrossRef] [PubMed] [Green Version]
- Maag, B.; Zhou, Z.; Thiele, L. A survey on sensor calibration in air pollution monitoring deployments. IEEE Internet Things J. 2018, 5, 4857–4870. [Google Scholar] [CrossRef] [Green Version]
- Feenstra, B.; Papapostolou, V.; Hasheminassab, S.; Zhang, H.; Der Boghossian, B.; Cocker, D.; Polidori, A. Performance evaluation of twelve low-cost PM2.5 sensors at an ambient air monitoring site. Atmos. Environ. 2019, 216, 116946. [Google Scholar] [CrossRef]
- Wang, Y.; Li, J.; Jing, H.; Zhang, Q.; Jiang, J.; Biswas, P. Laboratory evaluation and calibration of three low-cost particle sensors for particulate matter measurement. Aerosol Sci. Technol. 2015, 49, 1063–1077. [Google Scholar] [CrossRef]
- Jayaratne, R.; Liu, X.; Thai, P.; Dunbabin, M.; Morawska, L. The influence of humidity on the performance of a low-cost air particle mass sensor and the effect of atmospheric fog. Atmos. Meas. Tech. 2018, 11, 4883–4890. [Google Scholar] [CrossRef] [Green Version]
- Sousan, S.; Regmi, S.; Park, Y.M. Laboratory evaluation of low-cost optical particle counters for environmental and occupational exposures. Sensors 2021, 21, 4146. [Google Scholar] [CrossRef] [PubMed]
- Ma, J.; Rao, J.; Kwan, M.P.; Chai, Y. Examining the effects of mobility-based air and noise pollution on activity satisfaction. Transp. Res. D Transp. Environ. 2020, 89, 102633. [Google Scholar] [CrossRef]
- Michael, H.; Lim, C.C. AirBeam2 Technical Specifications, Operation & Performance. 2018. Available online: https://www.habitatmap.org/blog/airbeam2-technical-specifications-operation-performance (accessed on 12 January 2022).
- Rivas, I.; Mazaheri, M.; Viana, M.; Moreno, T.; Clifford, S.; He, C.; Bischof, O.F.; Martins, V.; Reche, C.; Alastuey, A.; et al. Identification of technical problems affecting performance of DustTrak DRX aerosol monitors. Sci. Total Environ. 2017, 584, 849–855. [Google Scholar] [CrossRef] [PubMed] [Green Version]
- Wang, L.; Morawska, L.; Jayaratne, E.R.; Mengersen, K.; Heuff, D. Characteristics of airborne particles and the factors affecting them at bus stations. Atmos. Environ. 2011, 45, 611–620. [Google Scholar] [CrossRef]
- MacNeill, M.; Wallace, L.; Kearney, J.; Allen, R.W.; Van Ryswyk, K.; Judek, S.; Xu, X.; Wheeler, A. Factors influencing variability in the infiltration of PM2.5 mass and its components. Atmos. Environ. 2012, 61, 518–532. [Google Scholar] [CrossRef]
- Sayahi, T.; Kaufman, D.; Becnel, T.; Kaur, K.; Butterfield, A.E.; Collingwood, S.; Zhang, Y.; Gaillardon, P.E.; Kelly, K.E. Development of a calibration chamber to evaluate the performance of low-cost particulate matter sensors. Environ. Pollut. 2019, 255, 113131. [Google Scholar] [CrossRef] [PubMed]
- He, R.; Han, T.; Bachman, D.; Carluccio, D.J.; Jaeger, R.; Zhang, J.; Thirumurugesan, S.; Andrews, C.; Mainelis, G. Evaluation of two low-cost PM monitors under different laboratory and indoor conditions. Aerosol Sci. Technol. 2020, 55, 316–331. [Google Scholar] [CrossRef]
- Manibusan, S.; Mainelis, G. Performance of four consumer-grade air pollution measurement devices in different residences. Aerosol Air Qual. Res. 2020, 20, 217. [Google Scholar] [CrossRef] [PubMed] [Green Version]
- Li, Z.; Tong, X.; Ho, J.M.W.; Kwok, T.C.; Dong, G.; Ho, K.F.; Yim, S.H.L. A practical framework for predicting residential indoor PM2.5 concentration using land-use regression and machine learning methods. Chemosphere 2021, 265, 129140. [Google Scholar] [CrossRef] [PubMed]
- Huang, J.; Kwan, M.P.; Kan, Z.; Wong, M.S.; Kwok, C.Y.T.; Yu, X. Investigating the relationship between the built environment and relative risk of COVID-19 in Hong Kong. ISPRS Int. J. Geo-Inf. 2020, 9, 624. [Google Scholar] [CrossRef]
- Huang, J.; Kwan, M.P.; Kan, Z. The superspreading places of COVID-19 and the associated built-environment and socio-demographic features: A study using a spatial network framework and individual-level activity data. Health Place 2021, 72, 102694. [Google Scholar] [CrossRef] [PubMed]
- Environment Protection Department. Data and Statistics. The Hong Kong Government. 2021. Available online: https://www.epd.gov.hk/epd/english/environmentinhk/air/data/air_data.html (accessed on 12 January 2022).
- Hong Kong Observatory. Monthly Weather Summary. The Hong Kong Government. 2021. Available online: https://www.hko.gov.hk/en/wxinfo/pastwx/mws/mws.htm (accessed on 12 January 2022).
- Huang, J.; Liu, X.; Zhao, P.; Zhang, J.; Kwan, M.P. Interactions between bus, metro, and taxi use before and after the Chinese Spring Festival. ISPRS Int. J. Geo-Inf. 2019, 8, 445. [Google Scholar] [CrossRef] [Green Version]
- Sevtsuk, A.; Ratti, C. Does urban mobility have a daily routine? Learning from the aggregate data of mobile networks. J. Urban Technol. 2010, 17, 41–60. [Google Scholar] [CrossRef]
- Ma, J.; Liu, G.; Kwan, M.P.; Chai, Y. Does real-time and perceived environmental exposure to air pollution and noise affect travel satisfaction? Evidence from Beijing, China. Travel Behav. Soc. 2021, 24, 313–324. [Google Scholar] [CrossRef]
- Wang, Y.; Du, Y.; Wang, J.; Li, T. Calibration of a low-cost PM2.5 monitor using a random forest model. Environ. Int. 2019, 133, 105161. [Google Scholar] [CrossRef] [PubMed]
- Bozdağ, A.; Dokuz, Y.; Gökçek, Ö.B. Spatial prediction of PM10 concentration using machine learning algorithms in Ankara, Turkey. Environ. Pollut. 2020, 263, 114635. [Google Scholar] [CrossRef] [PubMed]
- Li, Z.; Yim, S.H.L.; Ho, K.F. High temporal resolution prediction of street-level PM2.5 and NOx concentrations using machine learning approach. J. Clean. Prod. 2020, 268, 121975. [Google Scholar] [CrossRef]
- Paper, D. Scikit-Learn Classifier Tuning from Simple Training Sets. In Hands-On Scikit-Learn for Machine Learning Applications; Apress: Berkeley, CA, USA, 2020; pp. 137–163. [Google Scholar] [CrossRef]
- Javed, W.; Guo, B. Performance Evaluation of Real-time DustTrak Monitors for Outdoor Particulate Mass Measurements in a Desert Environment. Aerosol Air Qual. Res. 2021, 21, 200631. [Google Scholar] [CrossRef]
- Holstius, D.M.; Pillarisetti, A.; Smith, K.R.; Seto, E.J.A.M.T. Field calibrations of a low-cost aerosol sensor at a regulatory monitoring site in California. Atmos. Meas. Tech. 2014, 7, 1121–1131. [Google Scholar] [CrossRef] [Green Version]
- Crilley, L.R.; Shaw, M.; Pound, R.; Kramer, L.J.; Price, R.; Young, S.; Lewis, A.C.; Pope, F.D. Evaluation of a low-cost optical particle counter (Alphasense OPC-N2) for ambient air monitoring. Atmos. Meas. Tech. 2018, 11, 709–720. [Google Scholar] [CrossRef] [Green Version]
- Manikonda, A.; Zíková, N.; Hopke, P.K.; Ferro, A.R. Laboratory assessment of low-cost PM monitors. J. Aerosol Sci. 2016, 102, 29–40. [Google Scholar] [CrossRef]
- Chu, H.J.; Ali, M.Z.; He, Y.C. Spatial calibration and PM 2.5 mapping of low-cost air quality sensors. Sci. Rep. 2020, 10, 22079. [Google Scholar] [CrossRef] [PubMed]
- Zusman, M.; Schumacher, C.S.; Gassett, A.J.; Spalt, E.W.; Austin, E.; Larson, T.V.; Carvlin, G.; Seto, E.; Kaufman, J.D.; Sheppard, L. Calibration of low-cost particulate matter sensors: Model development for a multi-city epidemiological study. Environ. Int. 2020, 134, 105329. [Google Scholar] [CrossRef] [PubMed]
- Csavina, J.; Field, J.; Félix, O.; Corral-Avitia, A.Y.; Sáez, A.E.; Betterton, E.A. Effect of wind speed and relative humidity on atmospheric dust concentrations in semi-arid climates. Sci. Total Environ. 2014, 487, 82–90. [Google Scholar] [CrossRef] [Green Version]


| Urban Environments | Location with Latitude and Longitude | Data Collection Date | PM2.5 (μg/m3) | PM10 (μg/m3) |
|---|---|---|---|---|
| Office (Indoor) | Institute of Space and Earth Information Science, The Chinese University of Hong Kong (22.4213° N, 114.2068° E) | 31 July 2021 | 9.8 | 16.7 |
| Office (Outdoor) * | 3 August 2021 | 4.6 | 7.8 | |
| MTR station (Platform) | Hung Hom Station (22.3034° N, 114.1814° E) | 5 October 2021 | 13.5 | 34.3 |
| MTR station (Lobby) | 18 October 2021 | 14.5 | 23.2 | |
| Seaside | Hung Hom Ferry Pier (22.3011° N, 114.1902° E) | 6 October 2021 | 14.7 | 36.5 |
| PM1 Concentration (µg/m3) | ||||||||||
|---|---|---|---|---|---|---|---|---|---|---|
| Office (Indoor) | Office (Outdoor) | MTR Station (Platform) | MTR Station (Lobby) | Seaside | ||||||
| Sensors | Mean | S.D. | Mean | S.D. | Mean | S.D. | Mean | S.D. | Mean | S.D. |
| DustTrak | 4.71 | 0.65 | 6.02 | 2.02 | 15.88 | 2.09 | 13.46 | 1.23 | 15.89 | 2.51 |
| AB1 | 1.56 | 0.81 | 1.25 | 0.78 | 7.71 | 2.17 | 7.29 | 1.32 | 7.52 | 1.68 |
| AB2 | 1.45 | 0.79 | 1.09 | 0.69 | 8.33 | 2.11 | 7.59 | 1.38 | 8.01 | 1.78 |
| AB3 | 1.21 | 0.78 | 0.75 | 0.62 | 6.98 | 1.94 | 6.39 | 1.27 | 6.88 | 1.53 |
| AB4 | 1.41 | 0.84 | 1.23 | 0.76 | 7.04 | 1.96 | 6.49 | 1.09 | 7.36 | 1.62 |
| AB5 | 1.81 | 0.76 | 1.22 | 0.72 | 7.54 | 2.03 | 7.34 | 1.31 | 7.92 | 1.62 |
| PM2.5 concentration (µg/m3) | ||||||||||
| DustTrak | 4.78 | 0.63 | 6.72 | 2.34 | 16.52 | 2.12 | 13.67 | 1.27 | 16.51 | 2.47 |
| AB1 | 3.06 | 1.04 | 2.82 | 1.11 | 11.21 | 2.63 | 11.16 | 1.71 | 11.04 | 1.85 |
| AB2 | 2.85 | 0.99 | 2.57 | 0.98 | 11.74 | 2.51 | 11.39 | 1.82 | 11.39 | 1.82 |
| AB3 | 2.47 | 0.98 | 1.97 | 0.91 | 10.01 | 2.28 | 9.63 | 1.56 | 9.94 | 1.58 |
| AB4 | 2.81 | 0.99 | 2.61 | 1.05 | 10.36 | 2.44 | 10.04 | 1.38 | 10.81 | 1.69 |
| AB5 | 3.36 | 1.01 | 2.75 | 1.03 | 10.93 | 2.46 | 11.04 | 1.72 | 11.38 | 1.67 |
| PM10 concentration (µg/m3) | ||||||||||
| DustTrak | 4.89 | 0.64 | 7.91 | 3.35 | 19.01 | 2.43 | 14.48 | 1.41 | 18.76 | 3.05 |
| AB1 | 3.51 | 1.13 | 3.55 | 1.38 | 15.31 | 4.21 | 14.89 | 2.91 | 15.17 | 3.15 |
| AB2 | 3.18 | 1.01 | 3.26 | 1.28 | 16.42 | 4.13 | 15.45 | 3.22 | 15.91 | 3.13 |
| AB3 | 2.74 | 1.01 | 2.45 | 1.01 | 12.98 | 3.33 | 12.18 | 2.32 | 12.91 | 2.57 |
| AB4 | 3.17 | 1.07 | 3.26 | 1.26 | 13.76 | 3.67 | 13.16 | 2.39 | 14.42 | 2.86 |
| AB5 | 3.84 | 1.09 | 3.57 | 1.33 | 14.67 | 3.81 | 14.32 | 2.79 | 15.42 | 2.87 |
| Sensors | Linear Regression | R2 | %Bias | Linear Regression | R2 | %Bias | Linear Regression | R2 | %Bias |
|---|---|---|---|---|---|---|---|---|---|
| Office (Indoor) | PM1 | PM2.5 | PM10 | ||||||
| AB1 | y = 0.67x + 3.66 | 0.72 | 397 | y = 0.52x + 3.16 | 0.72 | 71 | y = 0.45x + 3.27 | 0.65 | 51 |
| AB2 | y = 0.69x + 3.71 | 0.76 | 469 | y = 0.57x + 3.13 | 0.78 | 85 | y = 0.52x + 3.21 | 0.69 | 66 |
| AB3 | y = 0.69x + 3.88 | 0.71 | 661 | y = 0.57x + 3.36 | 0.76 | 122 | y = 0.53x + 3.39 | 0.73 | 101 |
| AB4 | y = 0.66x + 3.79 | 0.76 | 567 | y = 0.56x = 3.19 | 0.76 | 88 | y = 0.48x + 3.33 | 0.68 | 69 |
| AB5 | y = 0.73x + 3.39 | 0.77 | 222 | y = 0.54x + 2.92 | 0.76 | 51 | y = 0.48x + 3.03 | 0.64 | 34 |
| Office (Outdoor) | PM1 | PM2.5 | PM10 | ||||||
| AB1 | y = 5.53x − 0.73 | 0.11 | 682 | y = 3.42x − 1.84 | 0.17 | 184 | y = 7.84x − 17.44 | 0.24 | 182 |
| AB2 | y = 6.36x − 0.67 | 0.12 | 776 | y = 3.82x − 2.03 | 0.17 | 222 | y = 7.01x − 12.29 | 0.16 | 227 |
| AB3 | y = 8.07x − 1.47 | 0.16 | 1387 | y = 4.64x − 1.44 | 0.23 | 363 | y = 10.70x − 16.34 | 0.32 | 327 |
| AB4 | y = 5.64x − 1.28 | 0.11 | 741 | y = 3.72x − 1.94 | 0.19 | 235 | y = 8.01x − 15.64 | 0.21 | 218 |
| AB5 | y = 6.51x − 0.31 | 0.13 | 651 | y = 3.51x − 1.83 | 0.16 | 197 | y = 7.05x − 14.69 | 0.18 | 189 |
| MTR station(Platform) | PM1 | PM2.5 | PM10 | ||||||
| AB1 | y = 0.84x + 9.41 | 0.76 | 173 | y = 0.69x + 8.72 | 0.75 | 52 | y = 0.47x + 11.87 | 0.65 | 31 |
| AB2 | y = 0.87x + 8.63 | 0.76 | 98 | y = 0.74x + 7.81 | 0.77 | 43 | y = 0.47x + 11.21 | 0.65 | 21 |
| AB3 | y = 0.95x + 9.21 | 0.78 | 139 | y = 0.82x + 8.29 | 0.78 | 69 | y = 0.59x + 11.25 | 0.67 | 53 |
| AB4 | y = 0.94x + 9.25 | 0.77 | 137 | y = 0.76x + 8.65 | 0.76 | 64 | y = 0.53x + 11.71 | 0.64 | 45 |
| AB5 | y = 0.87x + 9.31 | 0.72 | 121 | y = 0.73x + 8.57 | 0.71 | 55 | y = 0.48x + 11.94 | 0.57 | 35 |
| MTR station(Lobby) | PM1 | PM2.5 | PM10 | ||||||
| AB1 | y = 0.78x + 7.76 | 0.71 | 88 | y = 0.65x + 6.42 | 0.76 | 23 | y = 0.41x + 8.45 | 0.69 | −1 |
| AB2 | y = 0.73x + 7.86 | 0.68 | 81 | y = 0.59x + 6.89 | 0.72 | 21 | y = 0.35x + 9.01 | 0.65 | −3 |
| AB3 | y = 0.81x + 8.31 | 0.69 | 115 | y = 0.69x + 7.03 | 0.72 | 43 | y = 0.51x + 8.37 | 0.68 | 21 |
| AB4 | y = 0.89x + 7.64 | 0.64 | 110 | y = 0.74x + 6.23 | 0.65 | 37 | y = 0.46x + 8.42 | 0.61 | 12 |
| AB5 | y = 0.77x + 7.78 | 0.67 | 86 | y = 0.63x + 6.74 | 0.72 | 25 | y = 0.41x + 8.69 | 0.64 | 3 |
| Seaside | PM1 | PM2.5 | PM10 | ||||||
| AB1 | y = 0.66x + 10.93 | 0.19 | 117 | y = 0.61x + 9.79 | 0.21 | 51 | y = 0.44x + 11.95 | 0.22 | 27 |
| AB2 | y = 0.65x + 10.71 | 0.21 | 103 | y = 0.66x + 8.94 | 0.24 | 46 | y = 0.47x + 11.27 | 0.23 | 20 |
| AB3 | y = 0.66x + 11.37 | 0.16 | 137 | y = 0.67x + 9.79 | 0.19 | 68 | y = 0.53x + 11.86 | 0.21 | 48 |
| AB4 | y = 0.64x + 11.17 | 0.17 | 121 | y = 0.64x + 9.61 | 0.19 | 54 | y = 0.46x + 12.14 | 0.18 | 33 |
| AB5 | y = 0.63x + 10.92 | 0.17 | 105 | y = 0.64x + 9.21 | 0.19 | 47 | y = 0.46x + 11.74 | 0.18 | 24 |
| Include Data Collected in the Office (Outdoor) | ||||||||
|---|---|---|---|---|---|---|---|---|
| Sensors | R2 | ME (µg/m3) | RMSE (µg/m3) | % Bias | R2 | ME (µg/m3) | RMSE (µg/m3) | % Bias |
| MLR Models | RF Models | |||||||
| PM1 | ||||||||
| AB1 | 0.51 | 1.45 | 4.64 | −0.57 | 0.59 | 1.19 | 4.26 | −2.54 |
| AB2 | 0.52 | 1.34 | 4.58 | −0.42 | 0.47 | 1.79 | 4.81 | −0.33 |
| AB3 | 0.63 | 1.32 | 3.67 | −0.68 | 0.59 | 1.65 | 3.85 | −0.04 |
| AB4 | 0.51 | 1.51 | 4.66 | −0.46 | 0.47 | 1.78 | 4.63 | −0.12 |
| AB5 | 0.50 | 1.53 | 4.67 | −0.91 | 0.46 | 1.79 | 4.87 | −0.21 |
| PM2.5 | ||||||||
| AB1 | 0.44 | 1.53 | 5.61 | 0.22 | 0.41 | 1.99 | 5.76 | −0.13 |
| AB2 | 0.44 | 1.42 | 5.61 | 0.32 | 0.40 | 2.02 | 5.82 | −0.32 |
| AB3 | 0.55 | 1.33 | 4.47 | 0.15 | 0.51 | 1.87 | 4.70 | −0.02 |
| AB4 | 0.54 | 1.43 | 4.54 | 0.33 | 0.52 | 1.83 | 4.69 | −0.09 |
| AB5 | 0.43 | 1.59 | 5.65 | −0.03 | 0.38 | 2.06 | 5.87 | −0.38 |
| PM10 | ||||||||
| AB1 | 0.18 | 2.68 | 12.88 | 1.12 | 0.22 | 3.01 | 12.50 | −0.94 |
| AB2 | 0.17 | 2.50 | 12.92 | 0.90 | 0.16 | 3.00 | 13.02 | −0.15 |
| AB3 | 0.27 | 2.18 | 9.82 | 1.23 | 0.41 | 2.67 | 8.84 | −0.13 |
| AB4 | 0.25 | 2.26 | 9.98 | 1.11 | 0.26 | 2.73 | 11.49 | −0.22 |
| AB5 | 0.21 | 2.46 | 11.11 | 0.10 | 0.21 | 2.84 | 11.11 | −0.29 |
| Exclude Data Collected in the Office (Outdoor) | ||||||||
|---|---|---|---|---|---|---|---|---|
| Sensors | R2 | ME (µg/m3) | RMSE (µg/m3) | % Bias | R2 | ME (µg/m3) | RMSE (µg/m3) | % Bias |
| MLR Models | RF Models | |||||||
| PM1 | ||||||||
| AB1 | 0.91 | 1.02 | 1.49 | −1.00 | 0.94 | 0.72 | 1.15 | −0.08 |
| AB2 | 0.92 | 0.90 | 1.36 | −0.73 | 0.92 | 1.02 | 1.42 | −0.16 |
| AB3 | 0.90 | 1.03 | 1.52 | −1.07 | 0.94 | 0.70 | 1.17 | −0.04 |
| AB4 | 0.89 | 1.10 | 1.59 | −0.85 | 0.95 | 0.69 | 1.13 | −0.05 |
| AB5 | 0.89 | 1.16 | 1.66 | −1.21 | 0.90 | 1.15 | 1.56 | −0.05 |
| PM2.5 | ||||||||
| AB1 | 0.93 | 0.93 | 1.39 | −0.64 | 0.95 | 0.74 | 1.18 | −0.08 |
| AB2 | 0.94 | 0.81 | 1.26 | −0.30 | 0.94 | 0.76 | 1.23 | −0.05 |
| AB3 | 0.93 | 0.90 | 1.36 | −0.57 | 0.94 | 0.74 | 1.20 | −0.09 |
| AB4 | 0.92 | 1.01 | 1.46 | −0.43 | 0.93 | 0.93 | 1.34 | −0.09 |
| AB5 | 0.91 | 1.04 | 1.50 | −0.73 | 0.95 | 0.74 | 1.18 | −0.07 |
| PM10 | ||||||||
| AB1 | 0.92 | 1.24 | 1.75 | −0.98 | 0.94 | 0.96 | 1.47 | −0.10 |
| AB2 | 0.93 | 1.09 | 1.59 | −0.51 | 0.94 | 1.01 | 1.53 | −1.13 |
| AB3 | 0.92 | 1.16 | 1.69 | −0.91 | 0.94 | 0.94 | 1.46 | −0.10 |
| AB4 | 0.91 | 1.30 | 1.80 | −0.66 | 0.93 | 1.06 | 1.58 | −0.66 |
| AB5 | 0.90 | 1.43 | 1.95 | −1.29 | 0.94 | 0.97 | 1.49 | −0.03 |
Publisher’s Note: MDPI stays neutral with regard to jurisdictional claims in published maps and institutional affiliations. |
© 2022 by the authors. Licensee MDPI, Basel, Switzerland. This article is an open access article distributed under the terms and conditions of the Creative Commons Attribution (CC BY) license (https://creativecommons.org/licenses/by/4.0/).
Share and Cite
Huang, J.; Kwan, M.-P.; Cai, J.; Song, W.; Yu, C.; Kan, Z.; Yim, S.H.-L. Field Evaluation and Calibration of Low-Cost Air Pollution Sensors for Environmental Exposure Research. Sensors 2022, 22, 2381. https://doi.org/10.3390/s22062381
Huang J, Kwan M-P, Cai J, Song W, Yu C, Kan Z, Yim SH-L. Field Evaluation and Calibration of Low-Cost Air Pollution Sensors for Environmental Exposure Research. Sensors. 2022; 22(6):2381. https://doi.org/10.3390/s22062381
Chicago/Turabian StyleHuang, Jianwei, Mei-Po Kwan, Jiannan Cai, Wanying Song, Changda Yu, Zihan Kan, and Steve Hung-Lam Yim. 2022. "Field Evaluation and Calibration of Low-Cost Air Pollution Sensors for Environmental Exposure Research" Sensors 22, no. 6: 2381. https://doi.org/10.3390/s22062381
APA StyleHuang, J., Kwan, M.-P., Cai, J., Song, W., Yu, C., Kan, Z., & Yim, S. H.-L. (2022). Field Evaluation and Calibration of Low-Cost Air Pollution Sensors for Environmental Exposure Research. Sensors, 22(6), 2381. https://doi.org/10.3390/s22062381