
A Novel Model for Vulnerability Analysis through Enhanced Directed Graphs and Quantitative Metrics


Abstract
:1. Introduction
2. Related Work
2.1. Vulnerability Analysis in Security Standards
2.1.1. ISA/IEC 62443
- 1.
- Part 1—General: Provides background information such as security concepts, terminology, and metrics;
- 2.
- Part 2—Policies and procedures: Addresses the security and patch management policies and procedures;
- 3.
- Part 3—System: Provides system development requirements and guidance;
- 4.
- Part 4—Component: Provides product development and technical requirements, which are intended for product vendors.
- Requirement SVV-3. Vulnerability Testing [49]. This requirement states that a process shall be employed to perform tests that focus on identifying and characterizing potential and known security vulnerabilities in the product (i.e., fuzz testing, attack surface analysis, black box known vulnerability scanning, software composition analysis, and dynamic runtime resource management testing).
- Requirement SVV-4. Penetration Testing [49]. This requirement states that a process shall be employed to identify and characterize security-related issues via tests that focus on discovering and exploiting security vulnerabilities in the product (i.e., penetration testing).
2.1.2. Common Criteria
- 1.
- Vulnerability survey,
- 2.
- Vulnerability analysis,
- 3.
- Focused vulnerability analysis,
- 4.
- Methodical vulnerability analysis, and
- 5.
- Advanced methodical vulnerability analysis.
2.2. Vulnerability Analysis Methodologies
2.3. Security Metrics
- Hardly any security metric has a solid theoretical foundation or empirical evidence in support of the claimed correlation.
- Many security metrics lack an adequate description of the scale, unit, and reference values to compare and interpret the results.
- Only a few implementations or programs were available to test these security metrics and only one of the analyzed papers performed some kind of benchmarking or comparison with similar metrics.
- The information provided in the analyzed papers is insufficient to understand whether the proposed metrics are applicable in a given context, or how to use them.
3. Proposed Approach
- Identify the root causes and nature of vulnerabilities, which will enable the extraction of new requirements and test cases.
- Support the prioritization of patching.
- Track vulnerabilities during the whole lifespan of industrial components.
- Support the development and maintenance of industrial components.
- 1.
- Model: The proposed model is explained, together with the systems in which it can be applied and the algorithms that are used to build it.
- 2.
- Metrics: Metrics are a great tool to measure the state of the system and to track its evolution. The proposed metrics and their usage are described in this section.
- 3.
- Properties: The main features of the proposed model and metrics (e.g., granularity of the analysis, analysis over time, and patching policy prioritization support) are described in detail.
- 4.
- Applicability: Even though the reviewed standards exhibit some gaps, the proposed model aims to serve as the first step towards generating a set of tools to perform a vulnerability analysis in a reliable and continuous way. This last section will discuss the requirements of the ISA/IEC 62443-4-1 that can be enhanced using our model.
3.1. Description of the Model
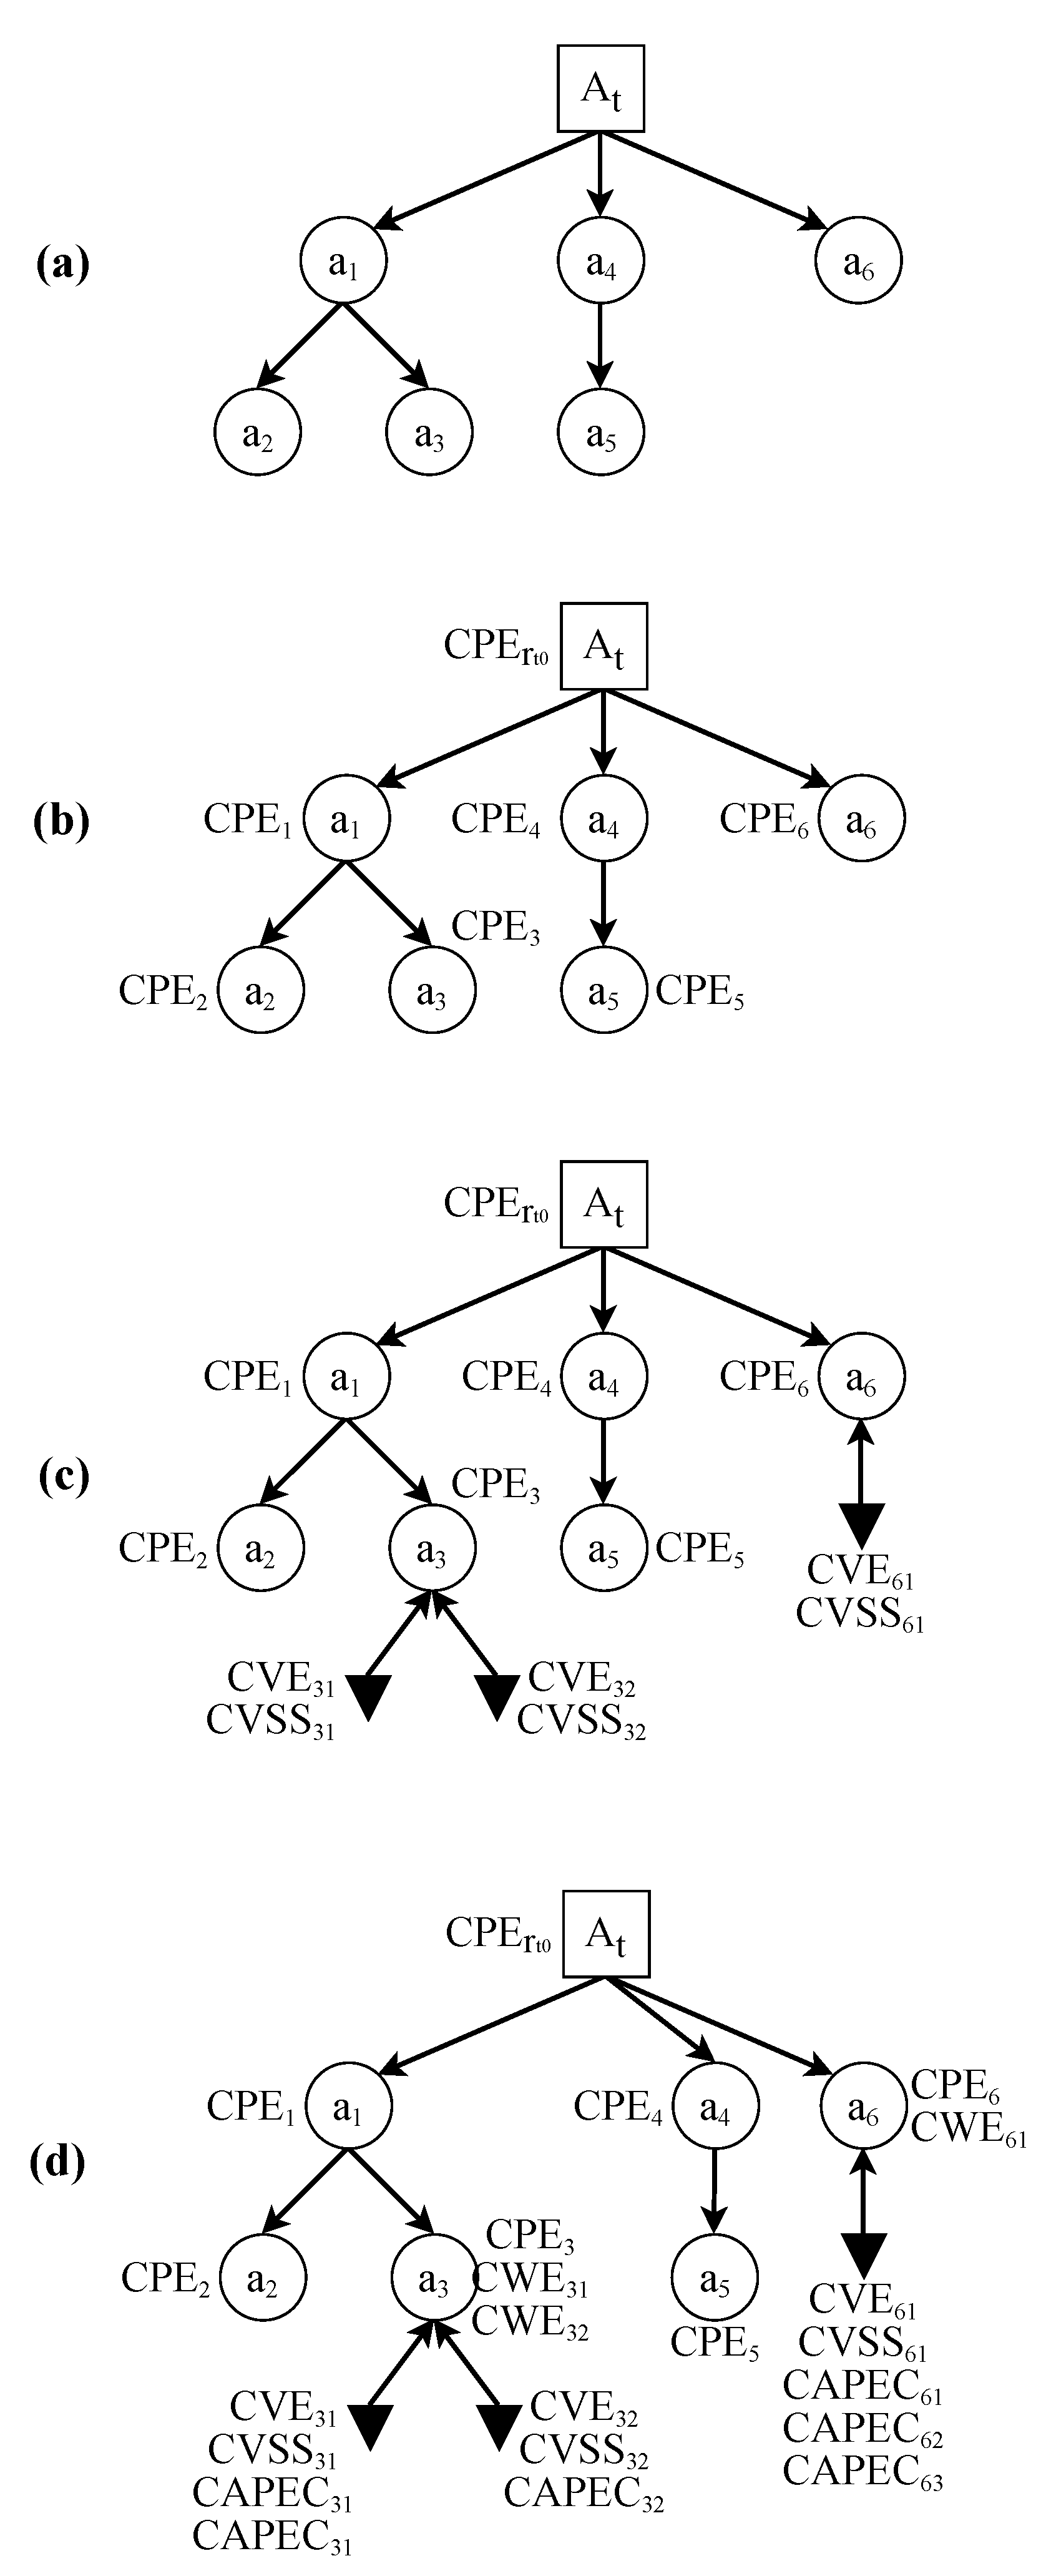
- represents the set of assets in which the SUT can be decomposed, where n is the total number of obtained assets. An asset a is any component of the SUT that supports information-related activities and includes both hardware and software [75,76,77]. Each asset is characterized by its corresponding Common Platform Enumeration (CPE) [78,79,80] identifier, while its weaknesses are characterized by the corresponding CWE identifier. In the EDG model, the assets are represented by three types of nodes in the directed graphs (i.e., root nodes, asset nodes, and cluster).
- represents the set of known vulnerabilities that are present in each asset of A, where q is the total number of vulnerabilities. They are characterized by the corresponding CVE and CVSS values. In the EDG model, vulnerabilities are represented using two types of nodes in the directed graphs (i.e., known vulnerability nodes and clusters).
- represents the set of edges or dependencies among the assets, and between assets and vulnerabilities. indicates that a dependency relation is established from asset to asset . Dependencies are represented using two different types of edges in the EDG (i.e., normal dependency and deprecated asset/updated vulnerability edges).
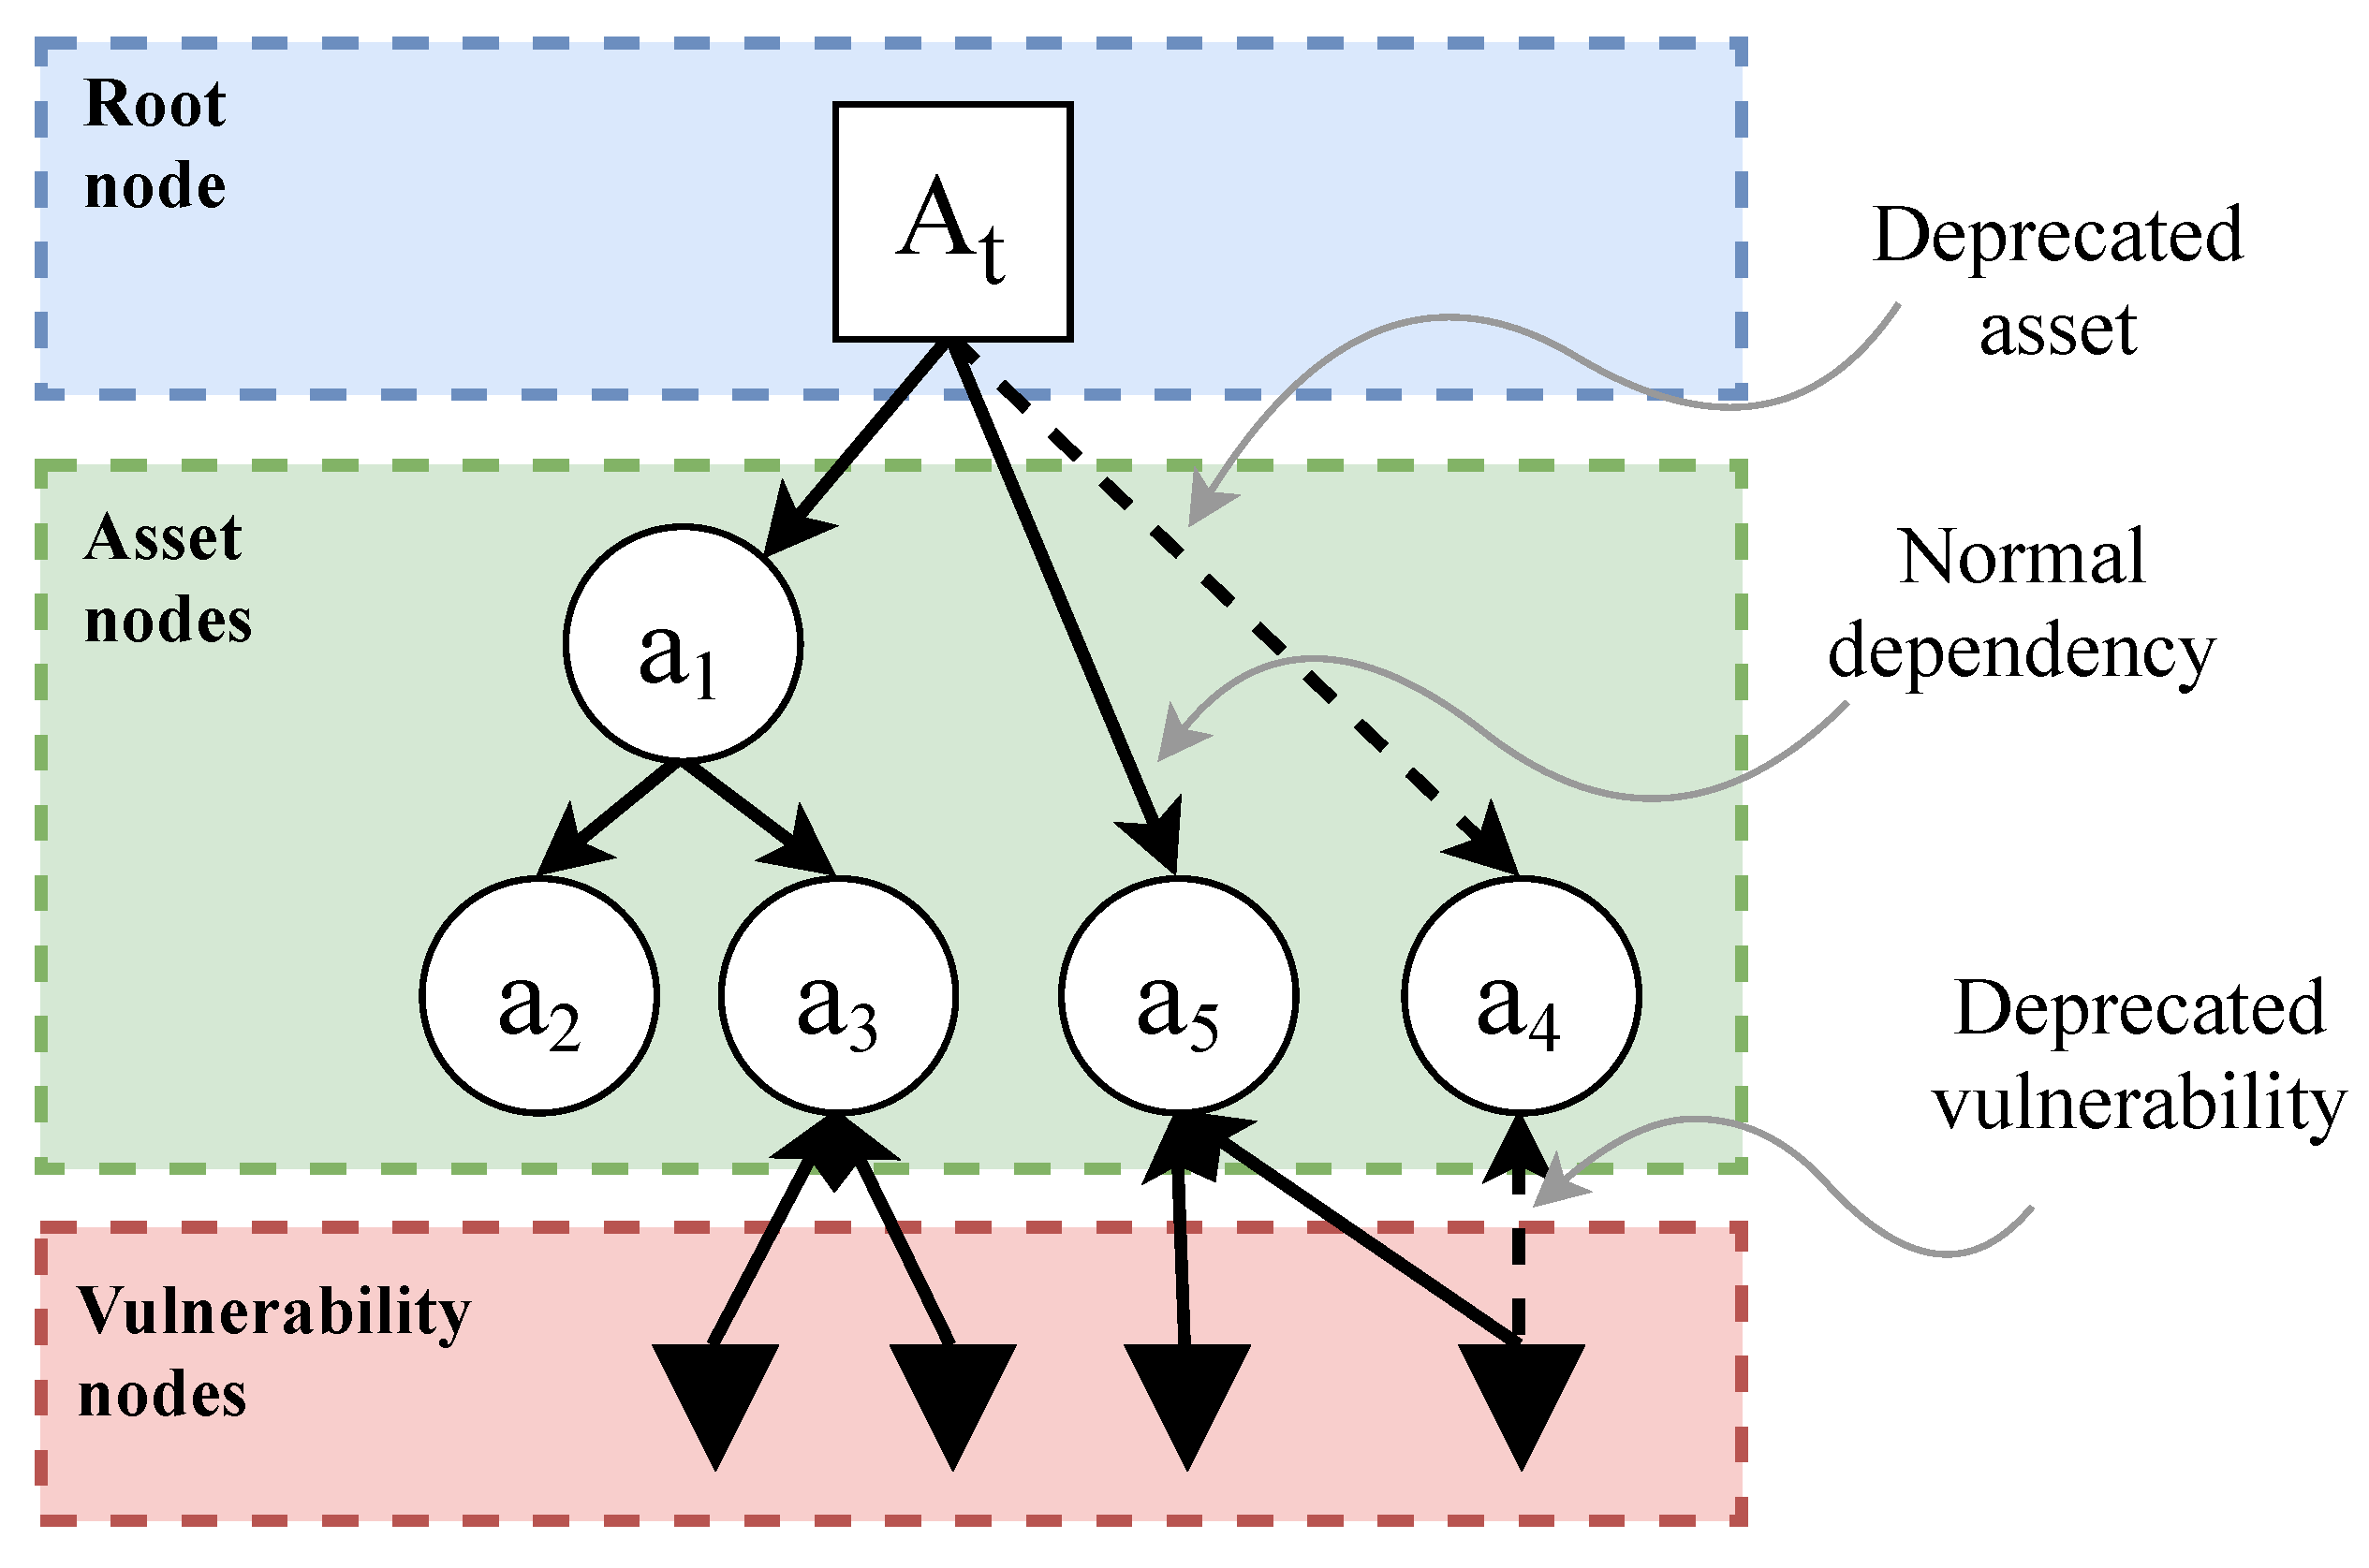
3.1.1. Types of Node
- Root nodes represent the SUT,
- Asset nodes represent each one of the assets of the SUT,
- Known vulnerability nodes represent the vulnerabilities in the SUT, and
- Clusters summarize the information in a subgraph.
- : Current value for the CPE. This points to the current version of the asset it refers to.
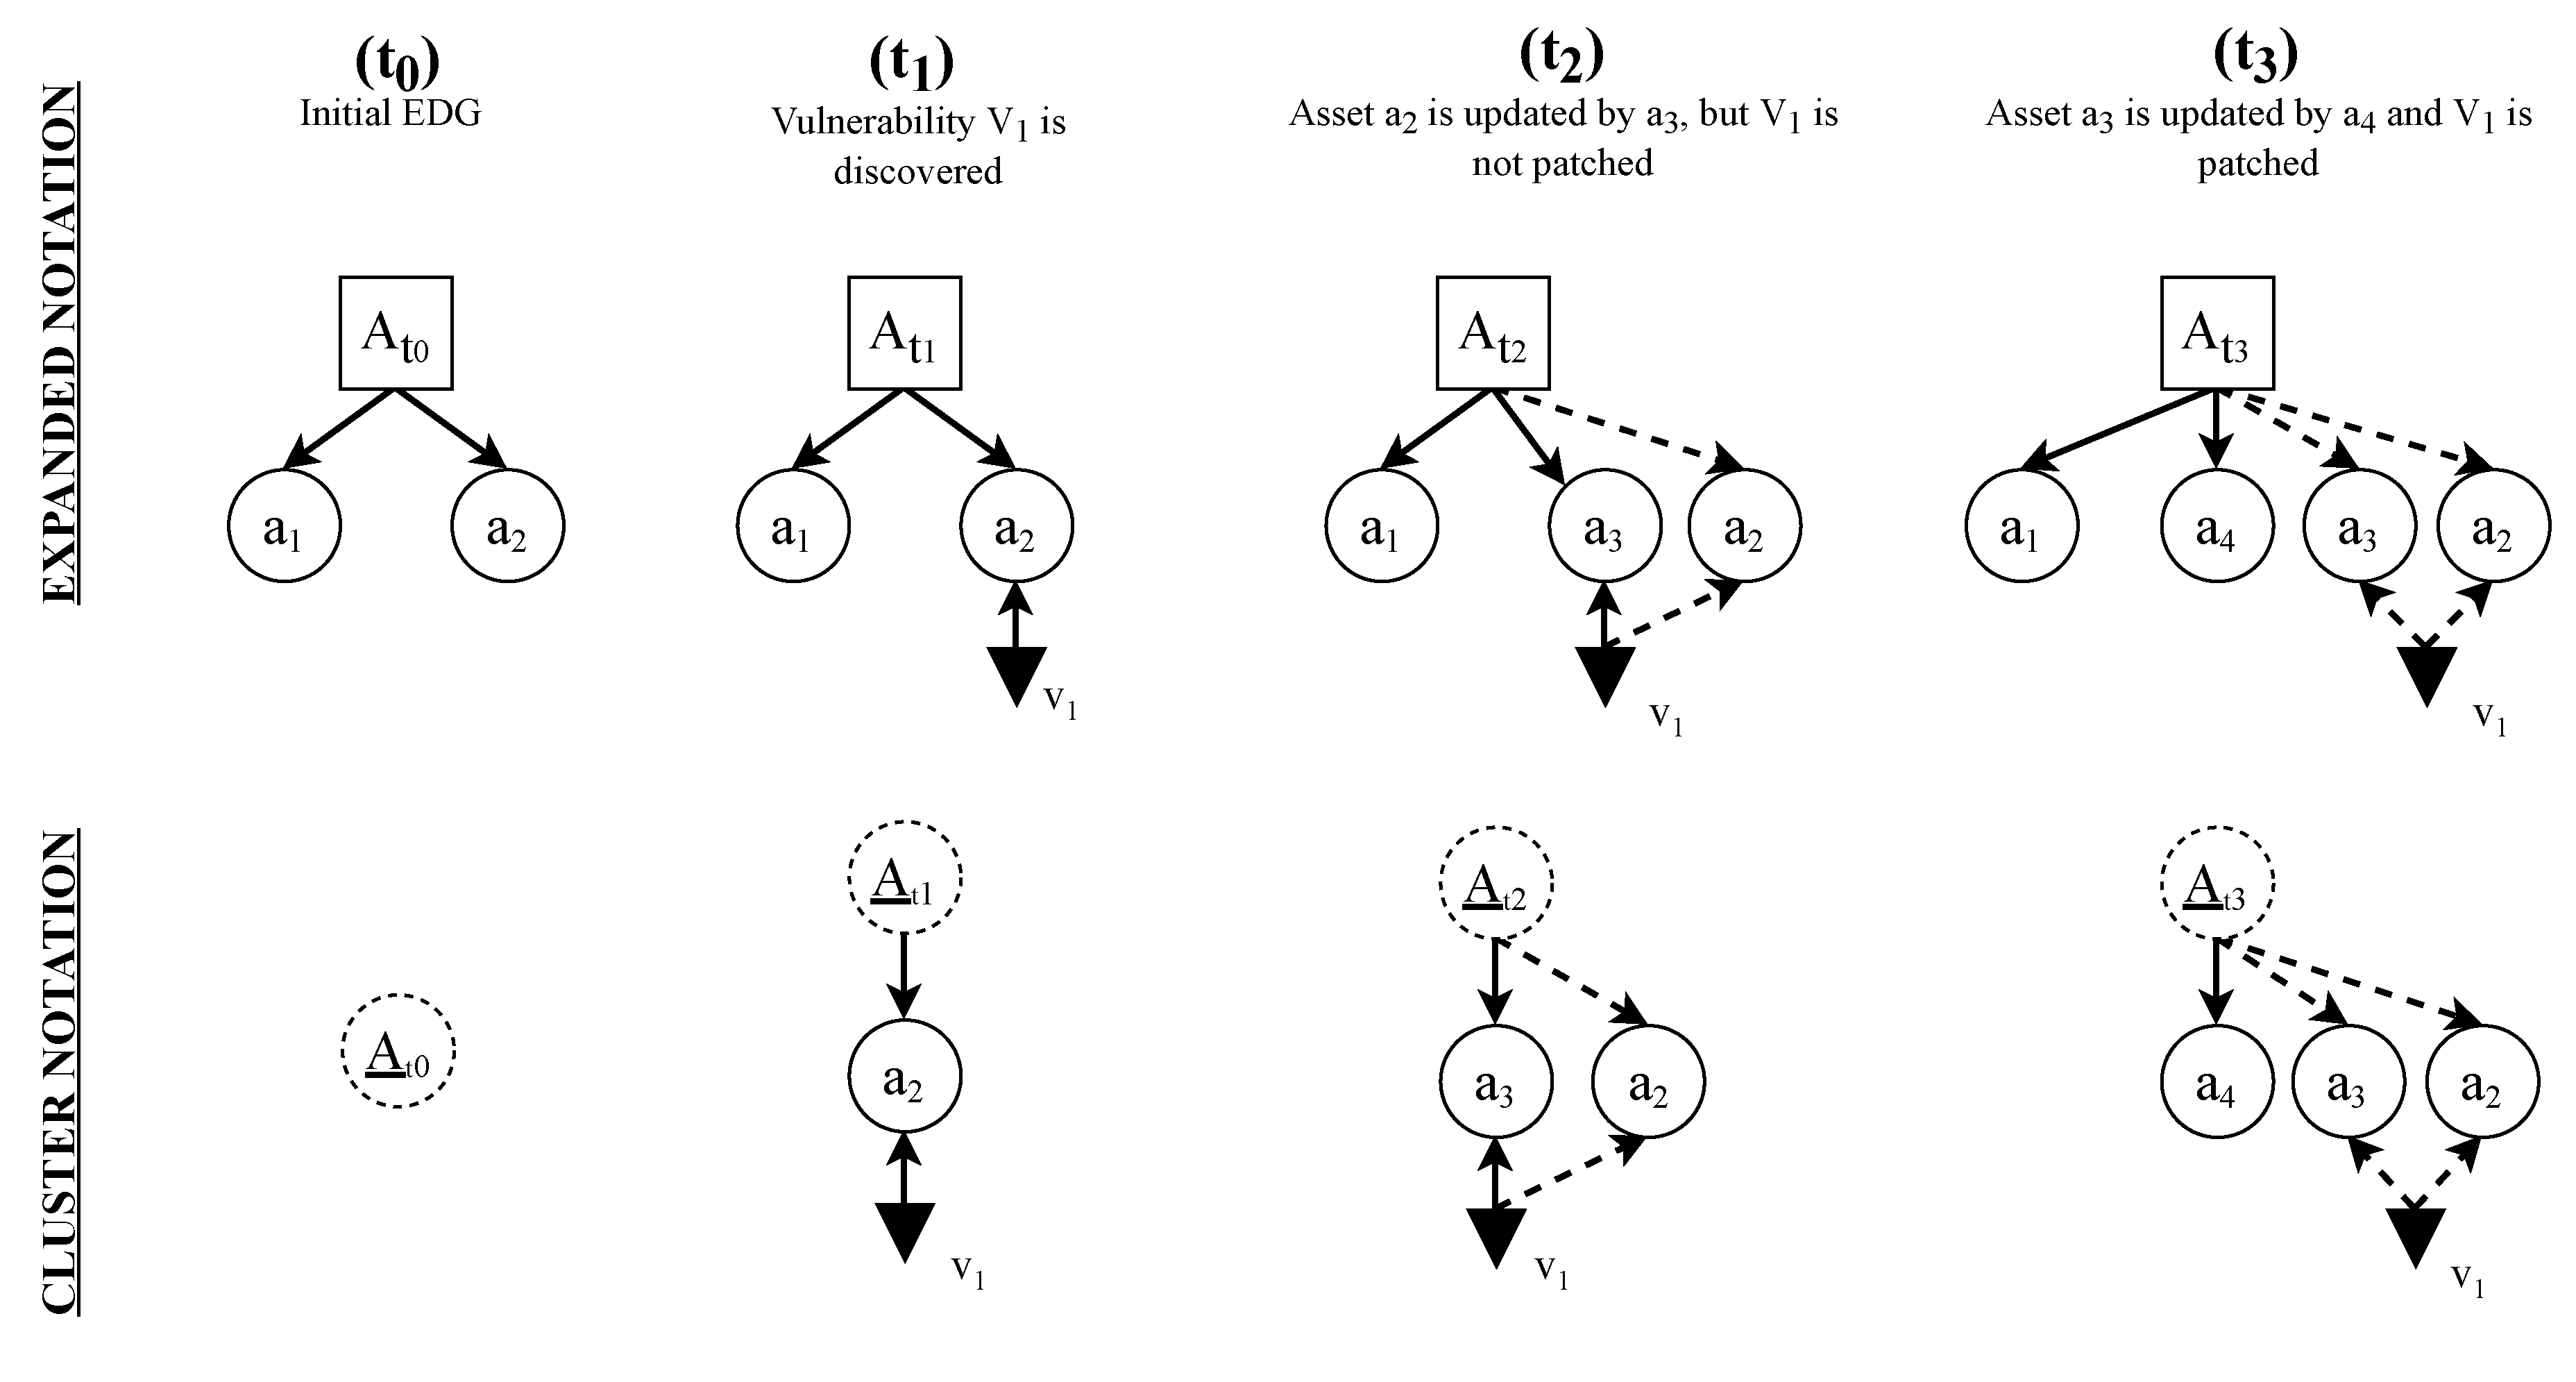
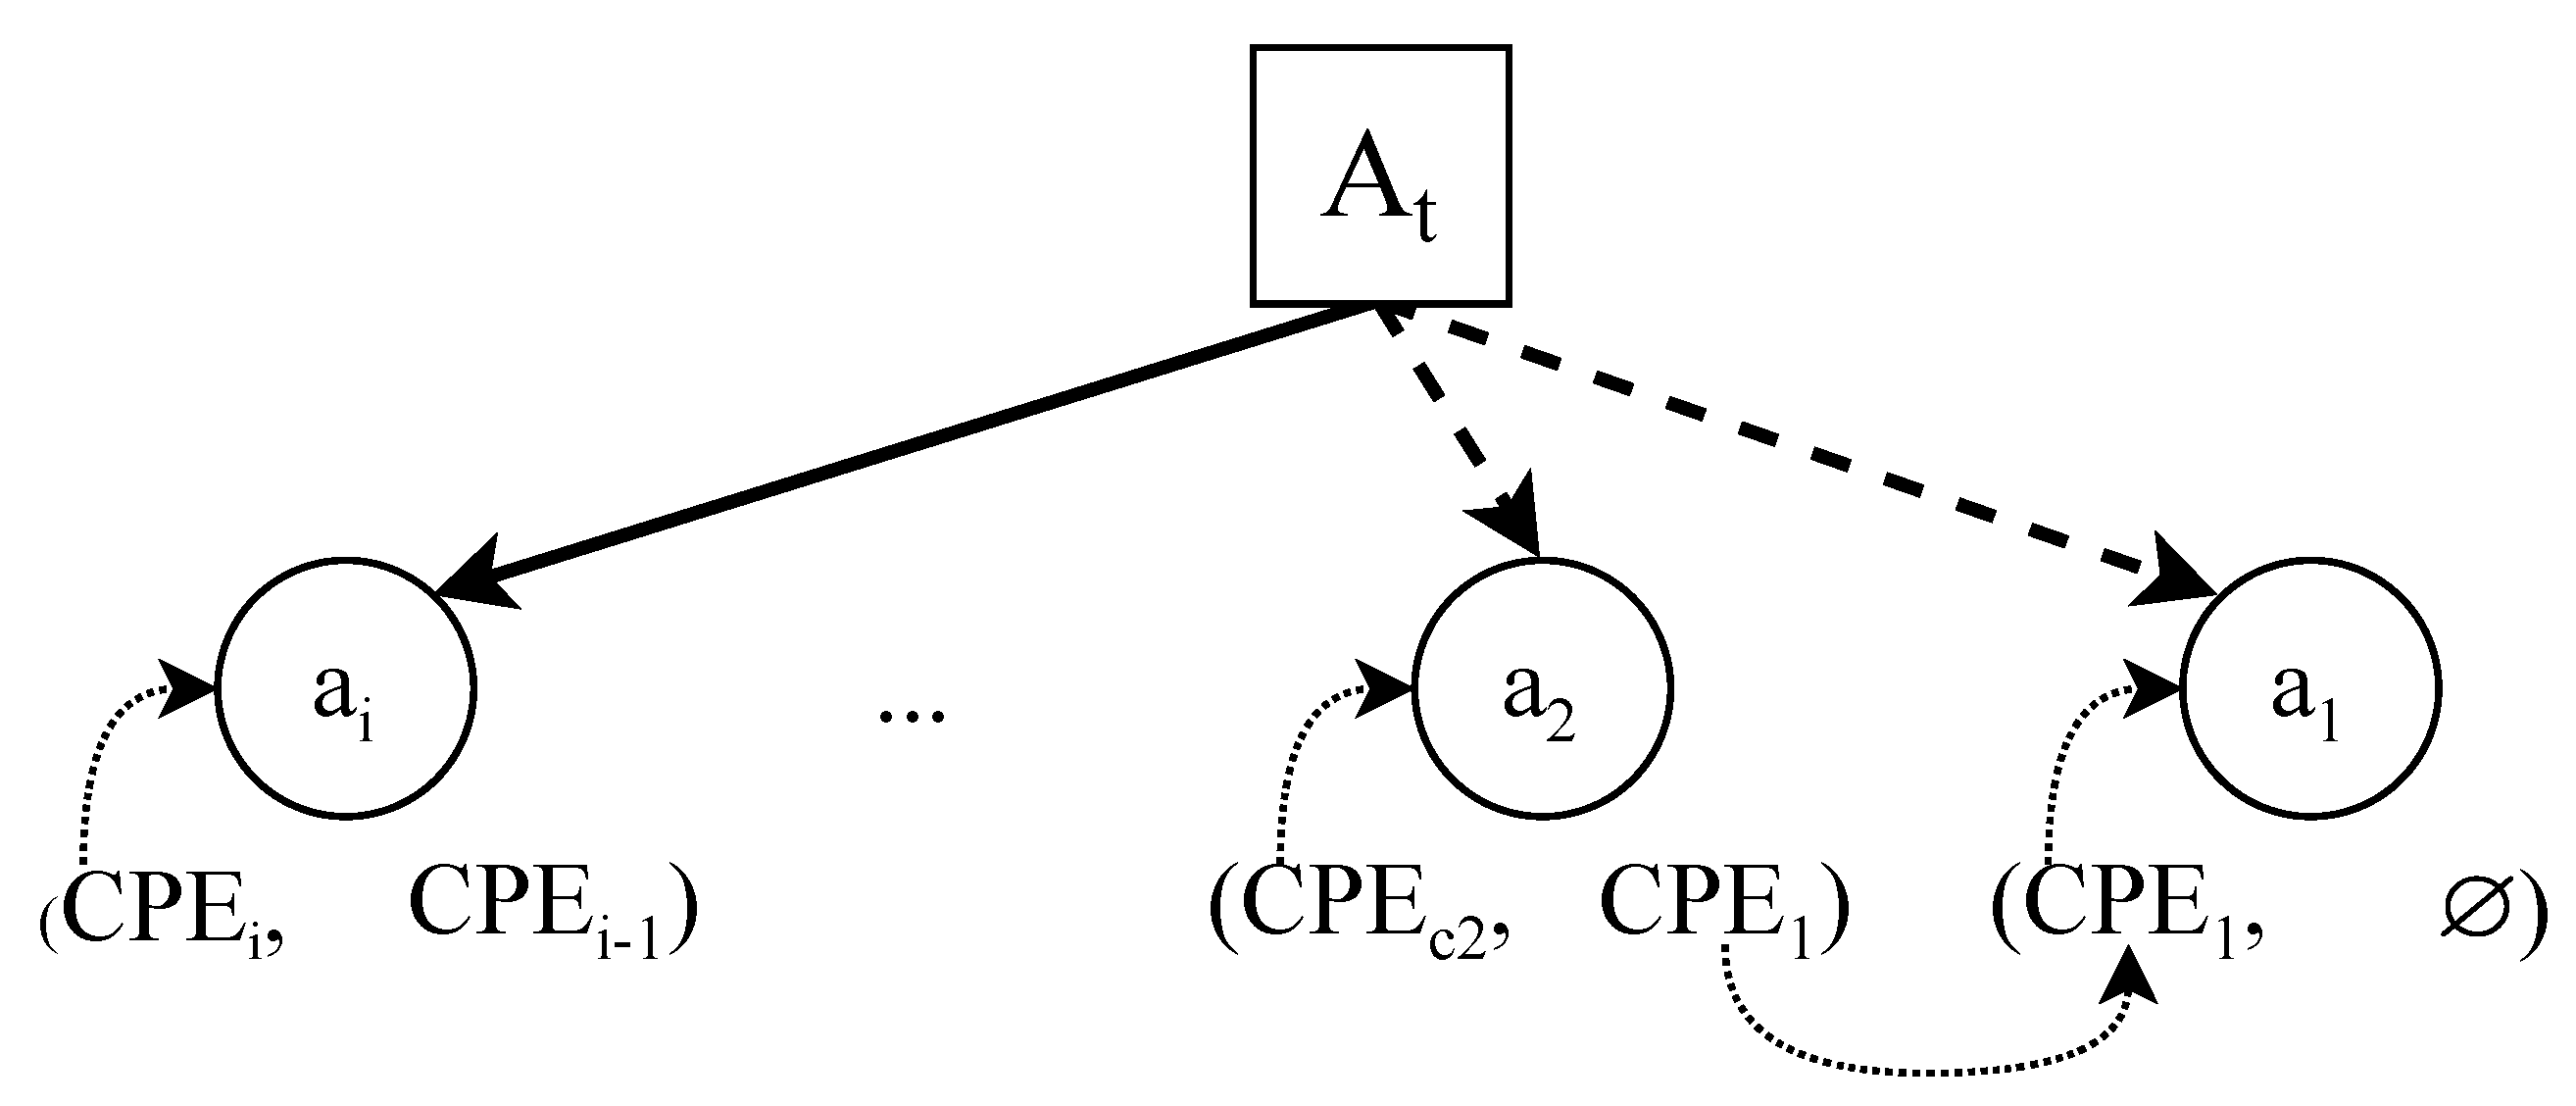
- : Value of the CPE that identifies the previous version of this asset. This will be used by the model to trace back all the versions of the same asset over time, from the current version to the very first version.
- : Set of all the weaknesses that are related to the vulnerabilities present in the asset. The content of this list can vary depending on the version of the asset.
- : This serves as the identifier of a vulnerability of asset .
- : This metric assigns a numeric value to the severity of vulnerability . Each CVE has a corresponding CVSS value.
- : Each vulnerability (CVE) is a materialization of a weakness (CWE) that can be exploited using a concrete attack pattern. In many cases, each CWE has more than one Common Attack Pattern Enumeration and Classification (CAPEC) [82,83] associated. Consequently, this field is a set that contains all the possible attack patterns that can exploit the vulnerability that is being analyzed.
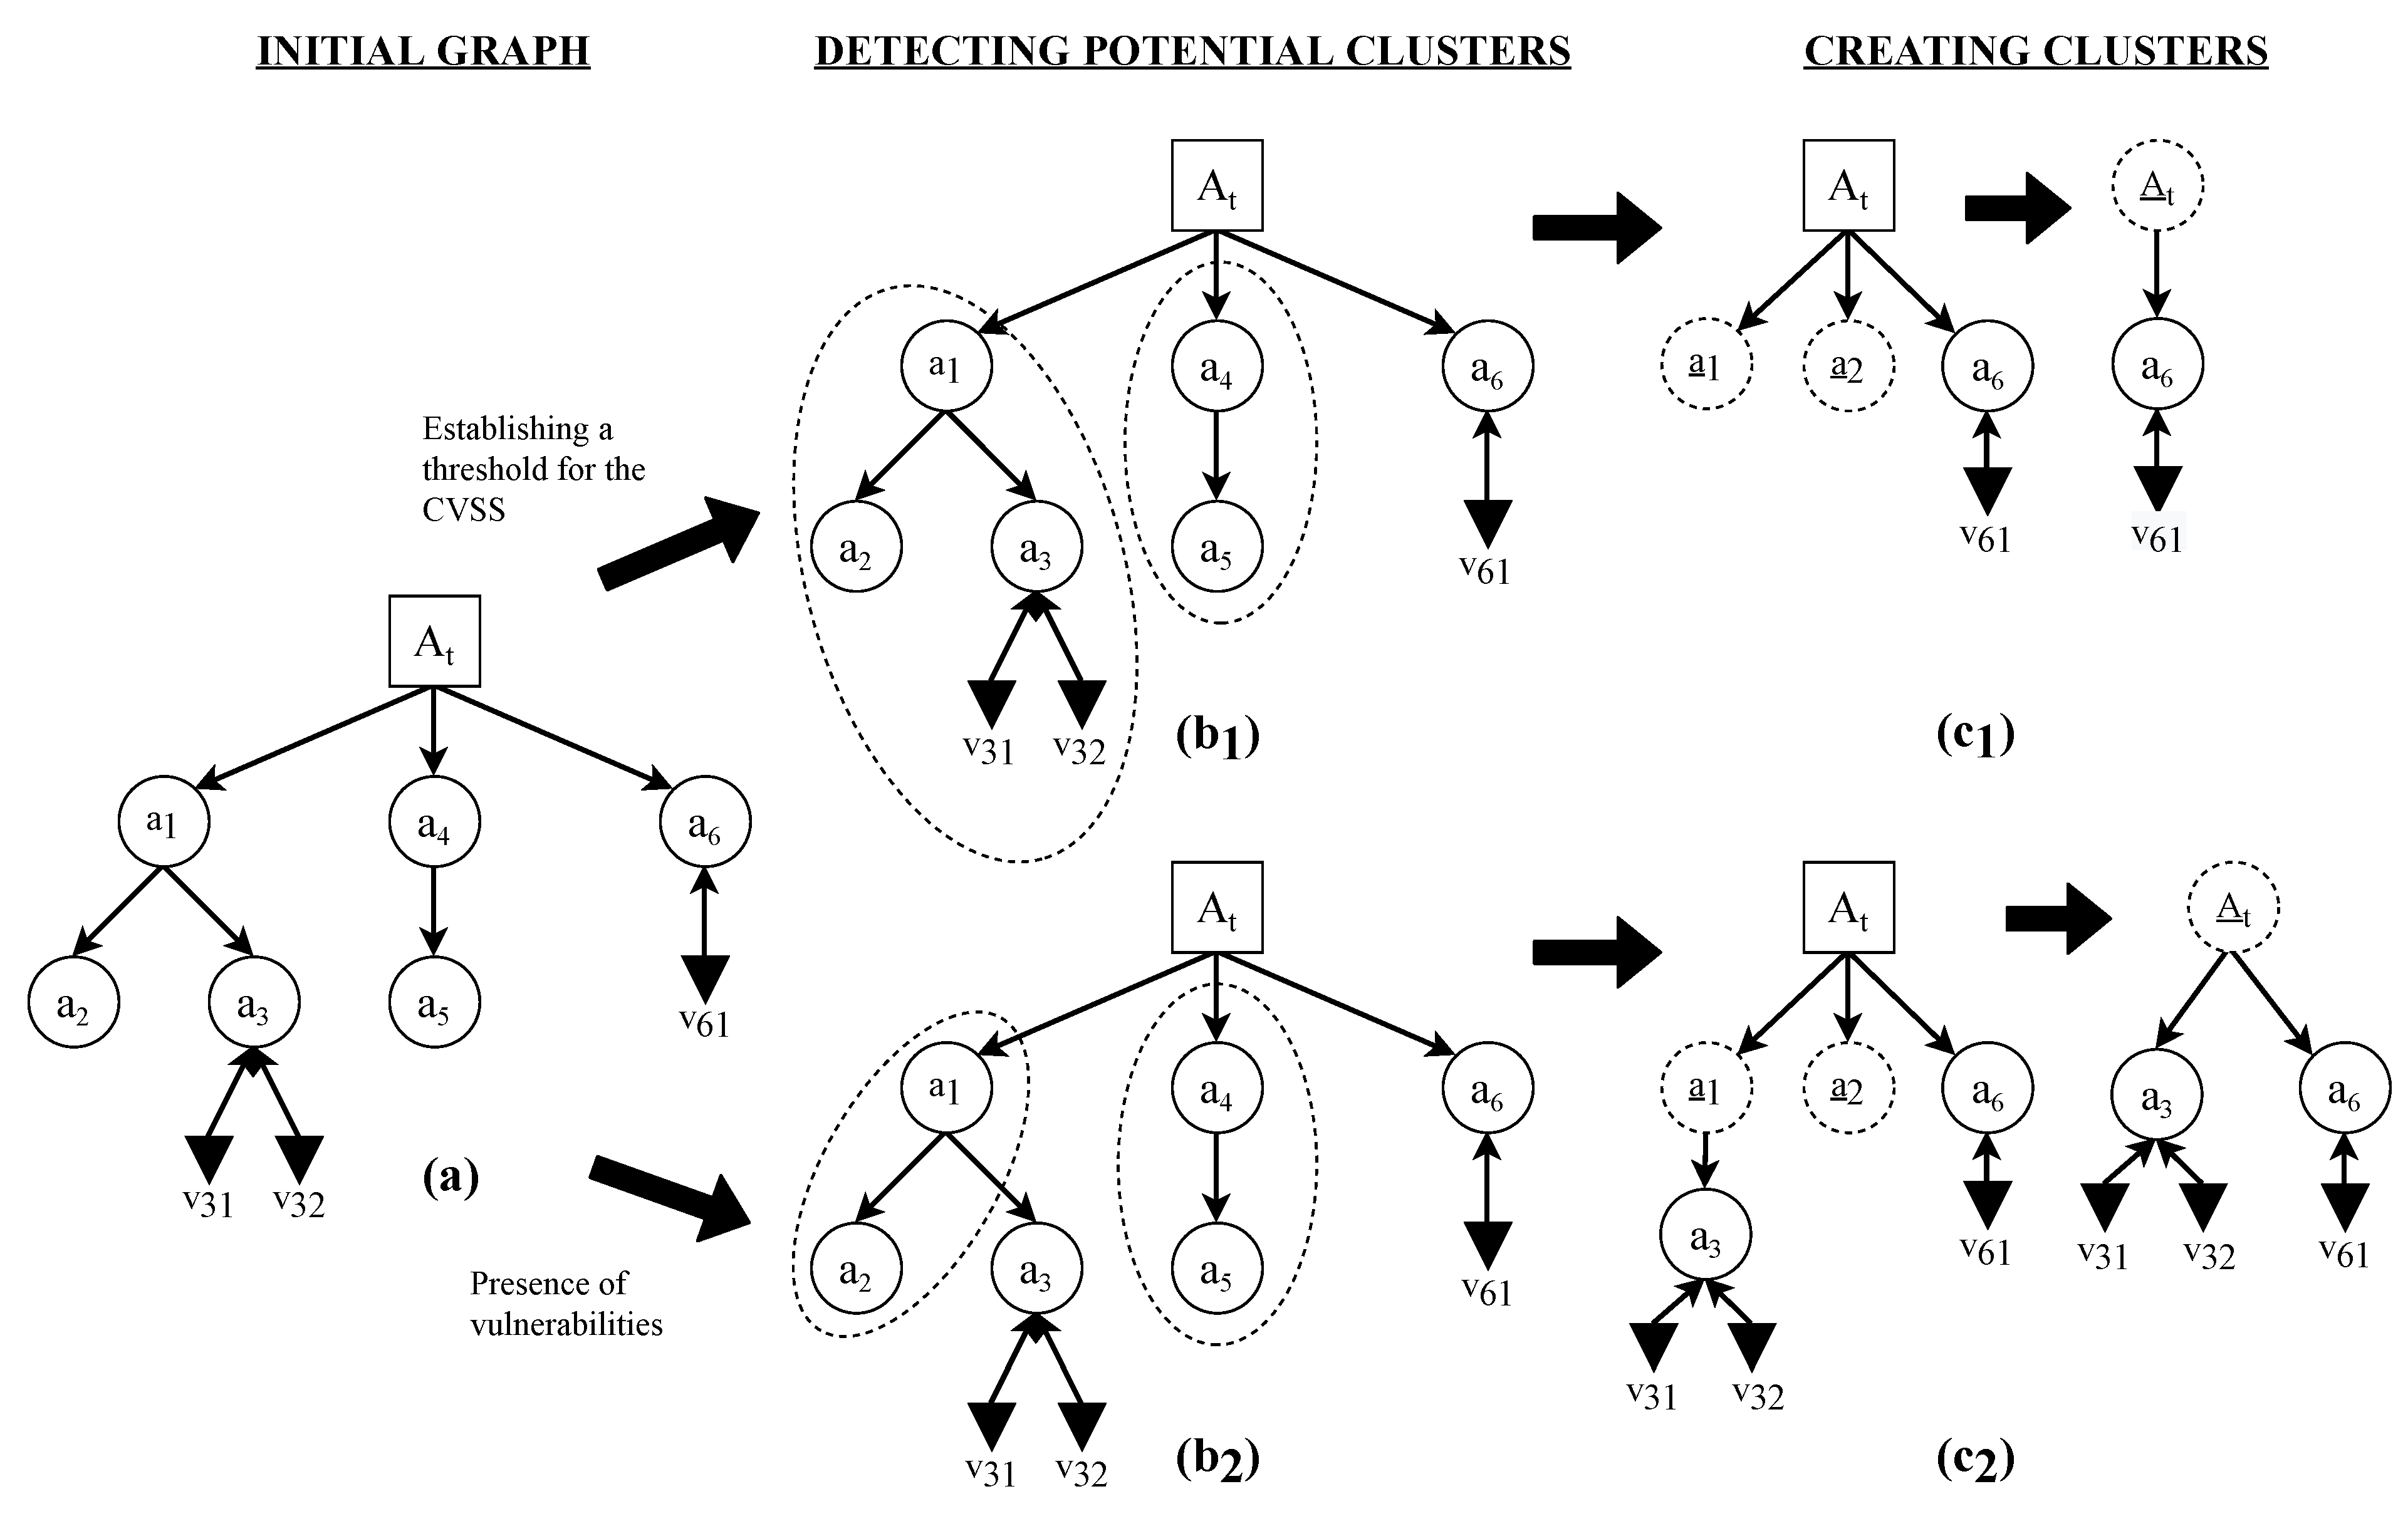
- 1.
- Absence of vulnerabilities: Using this criterion, clusters will group all nodes that contain no associated vulnerabilities.
- 2.
- CVSS score below a certain threshold: With this criterion, a threshold for the CVSS scores will be chosen. Nodes whose CVSS score is less than the defined threshold will be grouped into a cluster.
3.1.2. Types of Edge
- Normal dependencies relate two assets, or an asset and a vulnerability. They represent that the destination element depends on the source element. Collectively, they are known as set .
- Deprecated asset or patched vulnerability dependencies indicate when an asset or a vulnerability is updated or patched. They represent that the destination element used to depend on the source element. Collectively, they are known as set .
3.1.3. Conditions of Application of EDGs
- Software and hardware composition: In our approach, the model is created by means of a white-box analysis. The absence of or impossibility to perform a white-box analysis limits the ability to create an accurate model. Some knowledge about the internal structure and code is expected. This information is usually only known by the manufacturer of the component unless the component is publicly available or open-source. It should be also possible to decompose the SUT into simpler assets to generate a relevant EDG.
- Existence of publicly known vulnerabilities: The EDG model focuses on known vulnerabilities. This is not critical because many industrial components use commercial or open-source elements. The SUT must be composed of assets for which public information is available. If the majority of SUT assets are proprietary, or the SUT is an ad hoc development that is never exposed, then the generated EDG will not evolve. Therefore, the analysis will not be relevant.
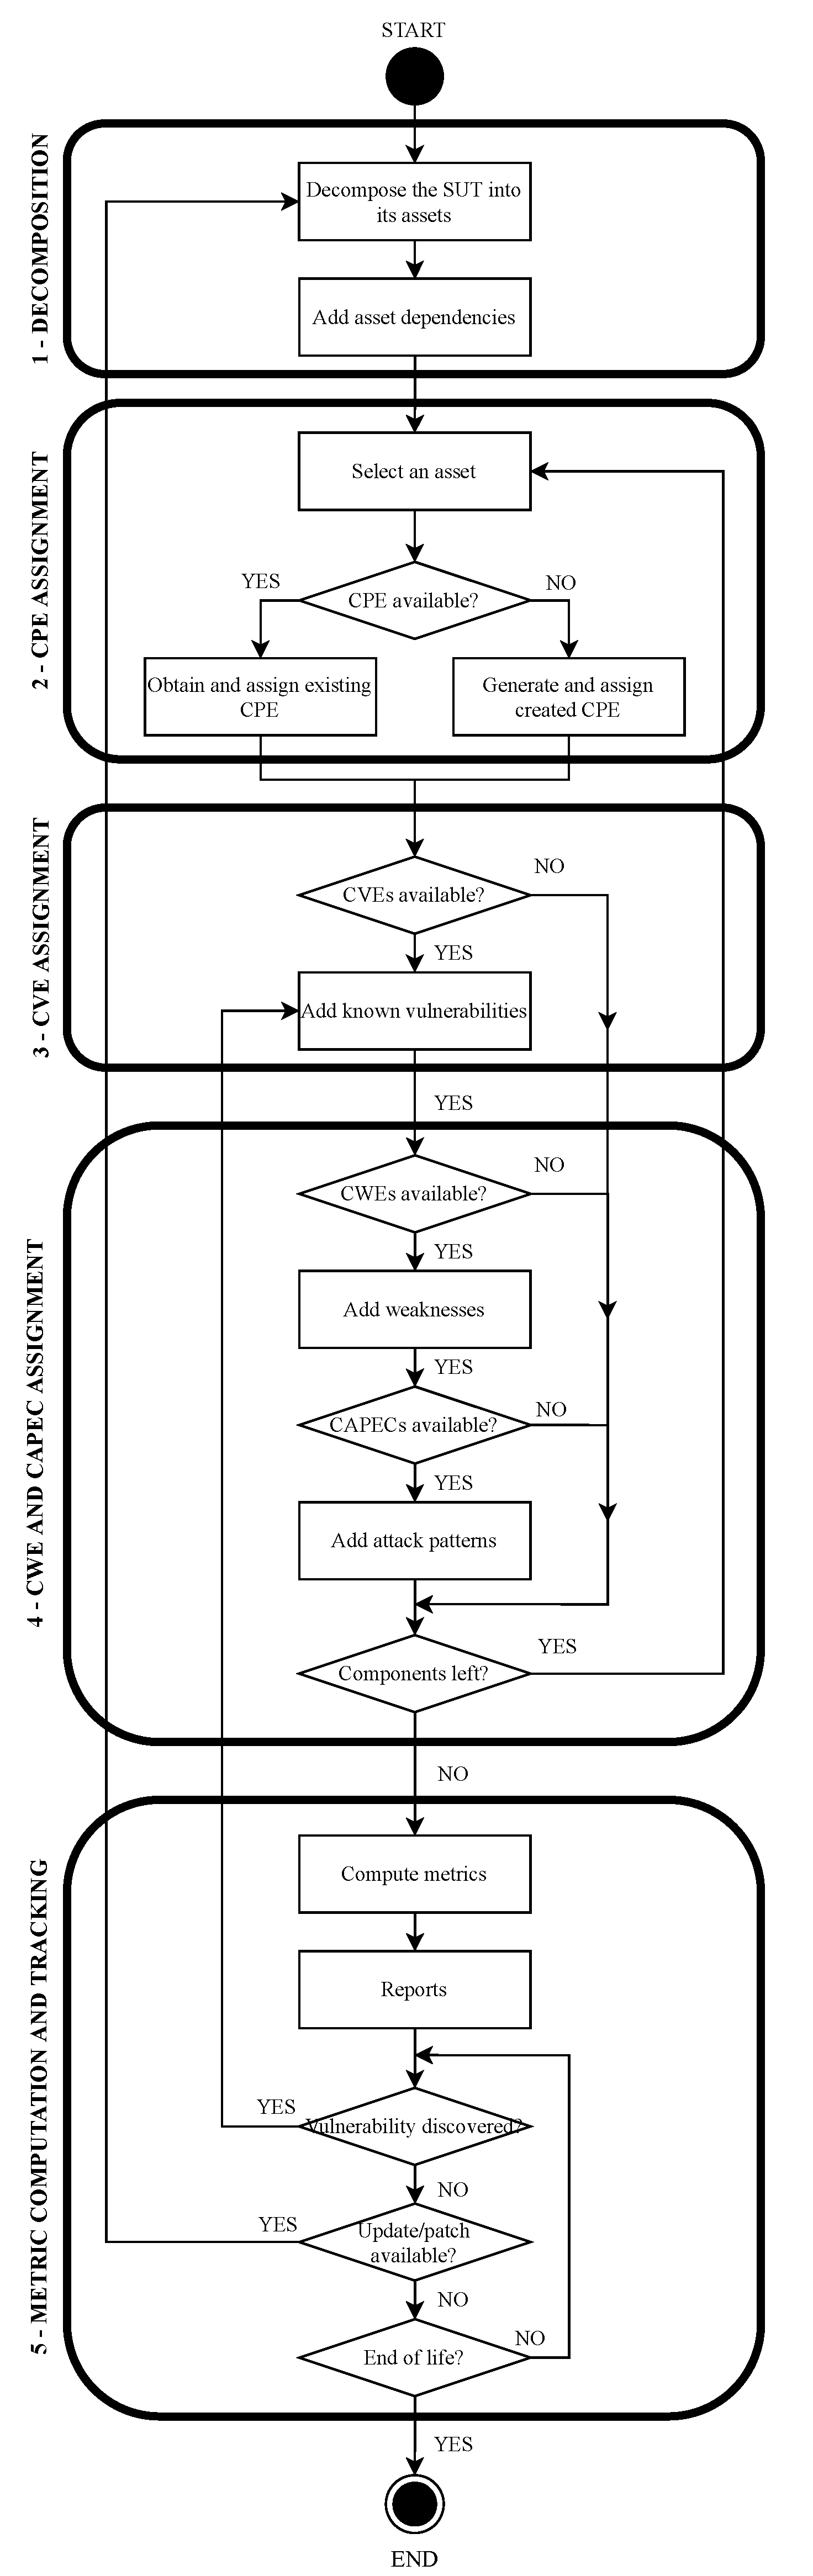
3.1.4. Steps to Build the Model
3.2. Security Metrics
3.2.1. Basic Definitions
3.2.2. Metrics
3.3. Properties
3.3.1. Automatic Inference of Root Causes
3.3.2. Spatial and Temporal Distribution of Vulnerabilities
3.3.3. Patching Policies Prioritization Support
4. Real Use Case
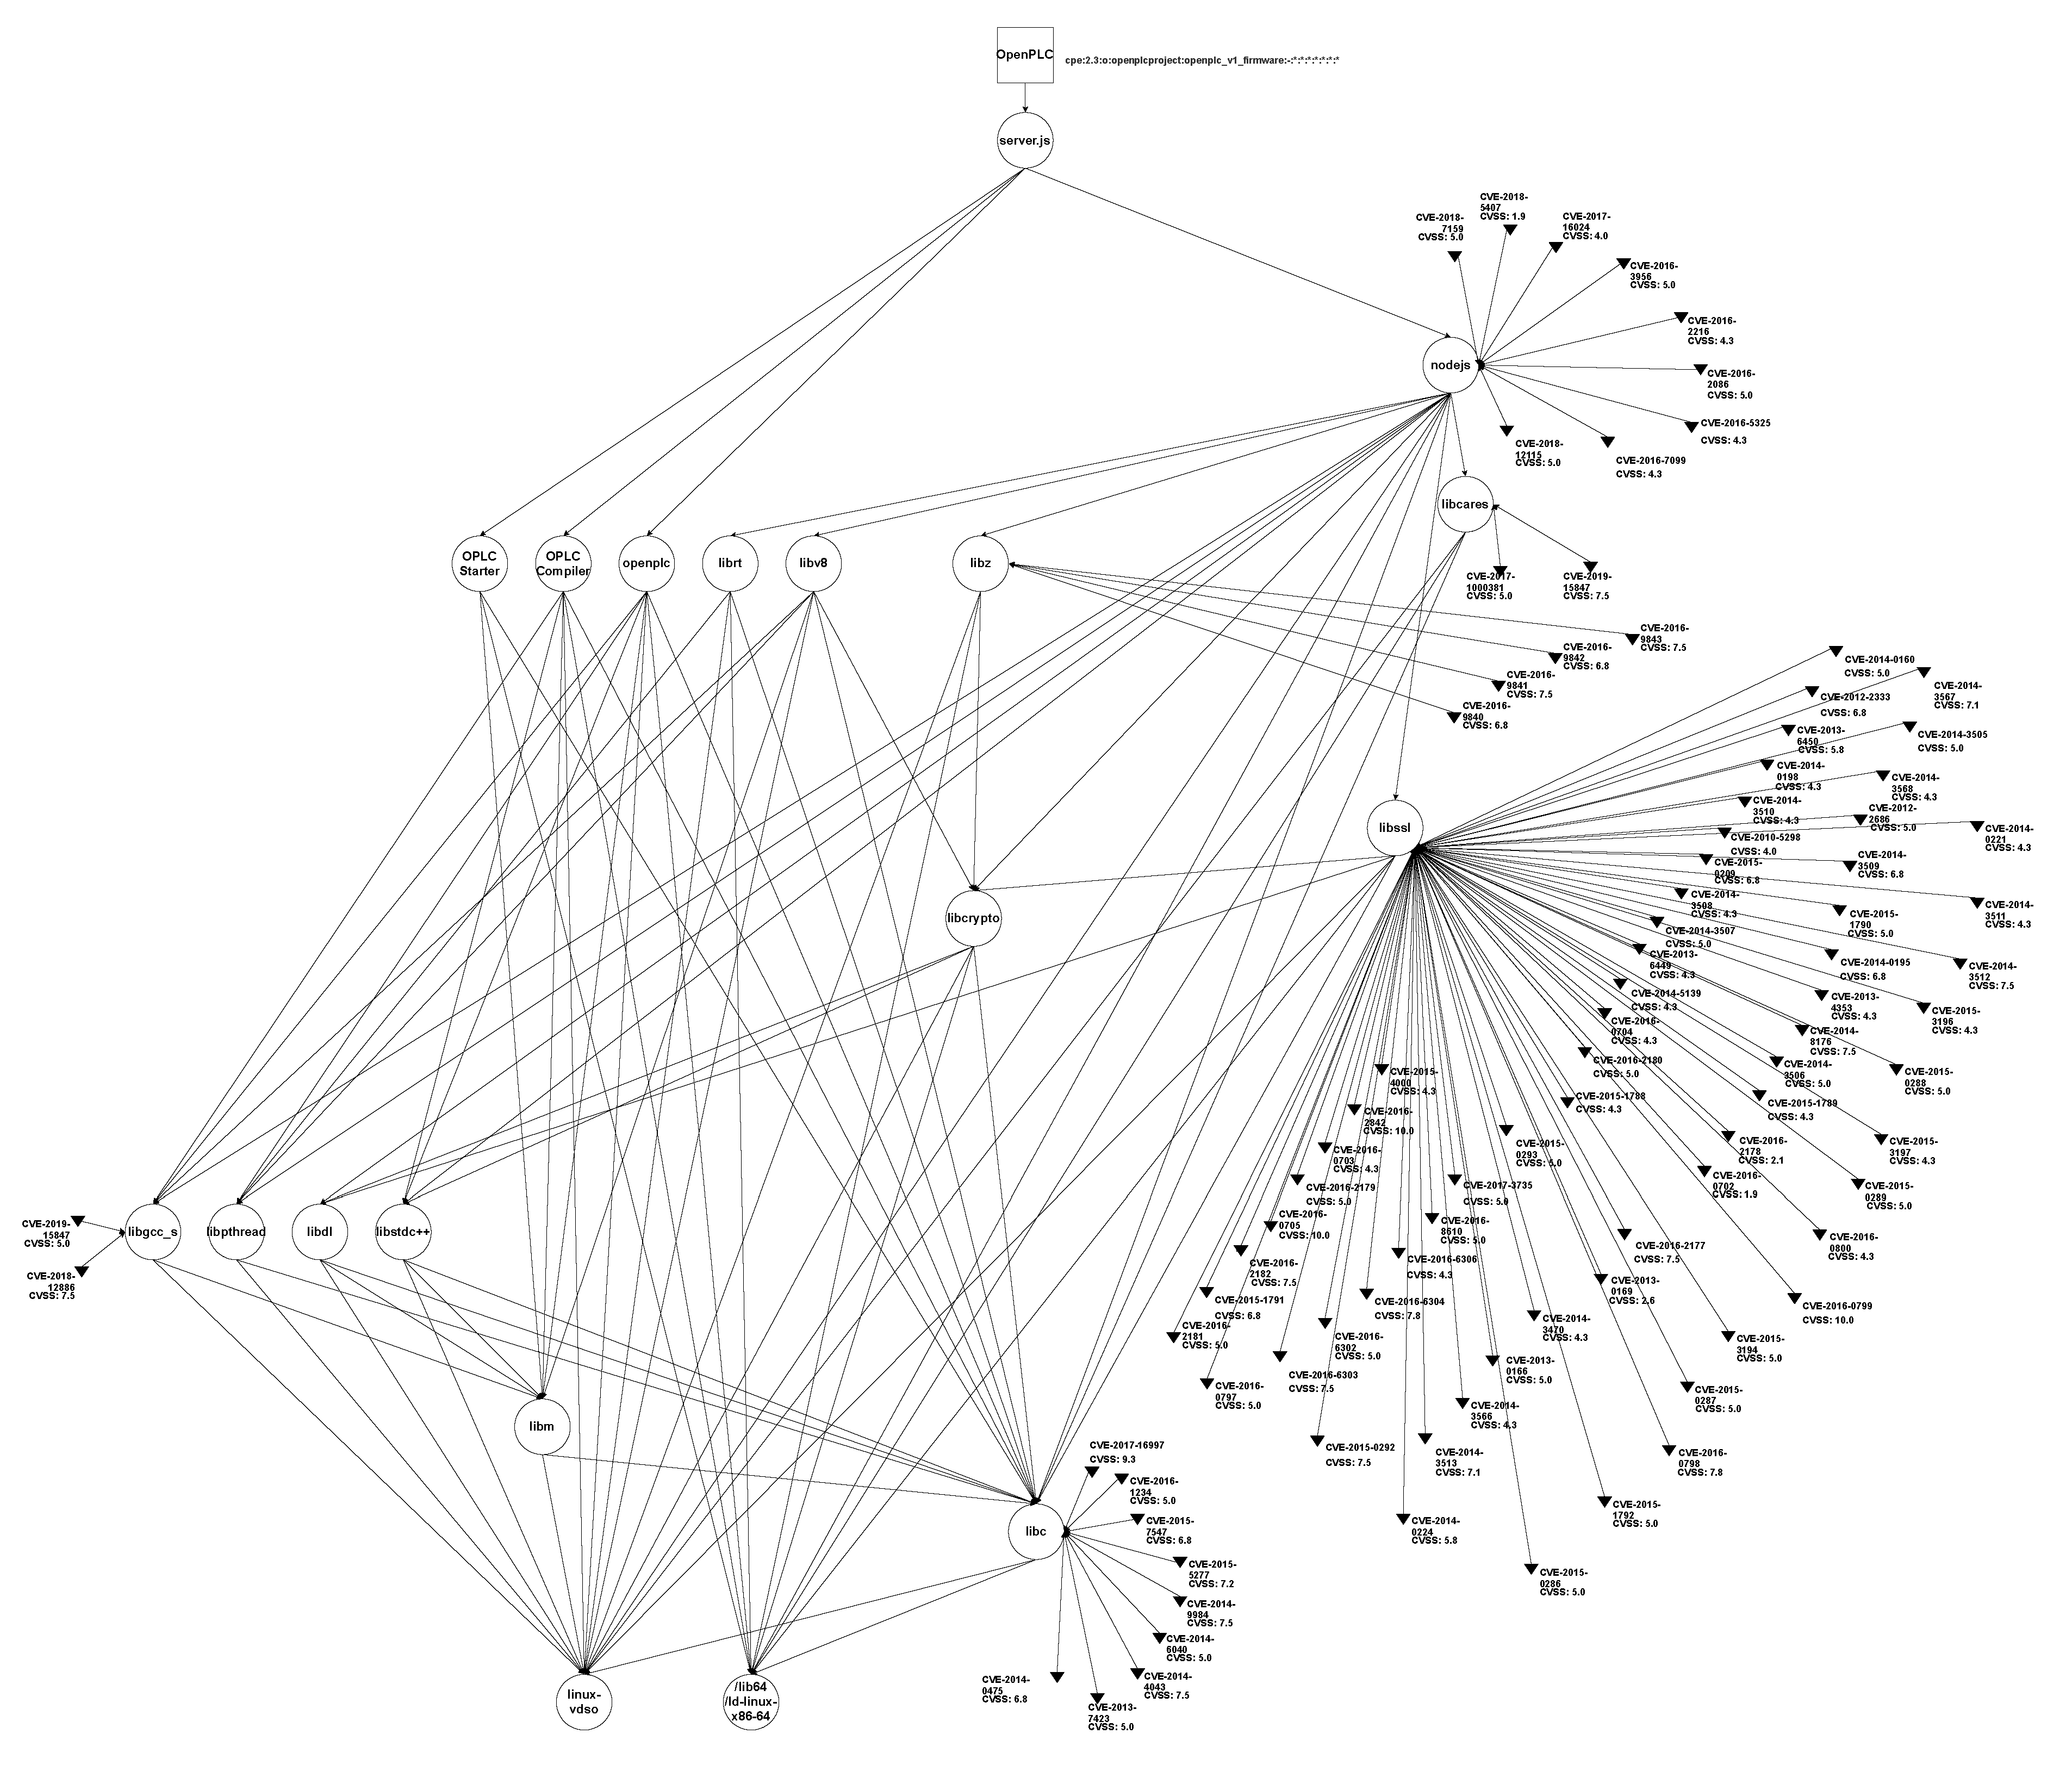
4.1. Structure of OpenPLC
- 1.
- Runtime: It is the software that plays the same role as the firmware in a traditional PLC. It executes the control program. The runtime can be installed in a variety of embedded platforms, such as the Raspberry Pi, and in Operating Systems (OSs) such as Windows or Linux.
- 2.
- Editor: An application that runs on a Windows or Linux OS that is used to write and compile the control programs that will be later executed by the runtime.
- 3.
- HMI Builder: This software is to create web-based animations that will reflect the state of the process, in the same manner as a traditional HMI.
4.2. Setup through the Analysis
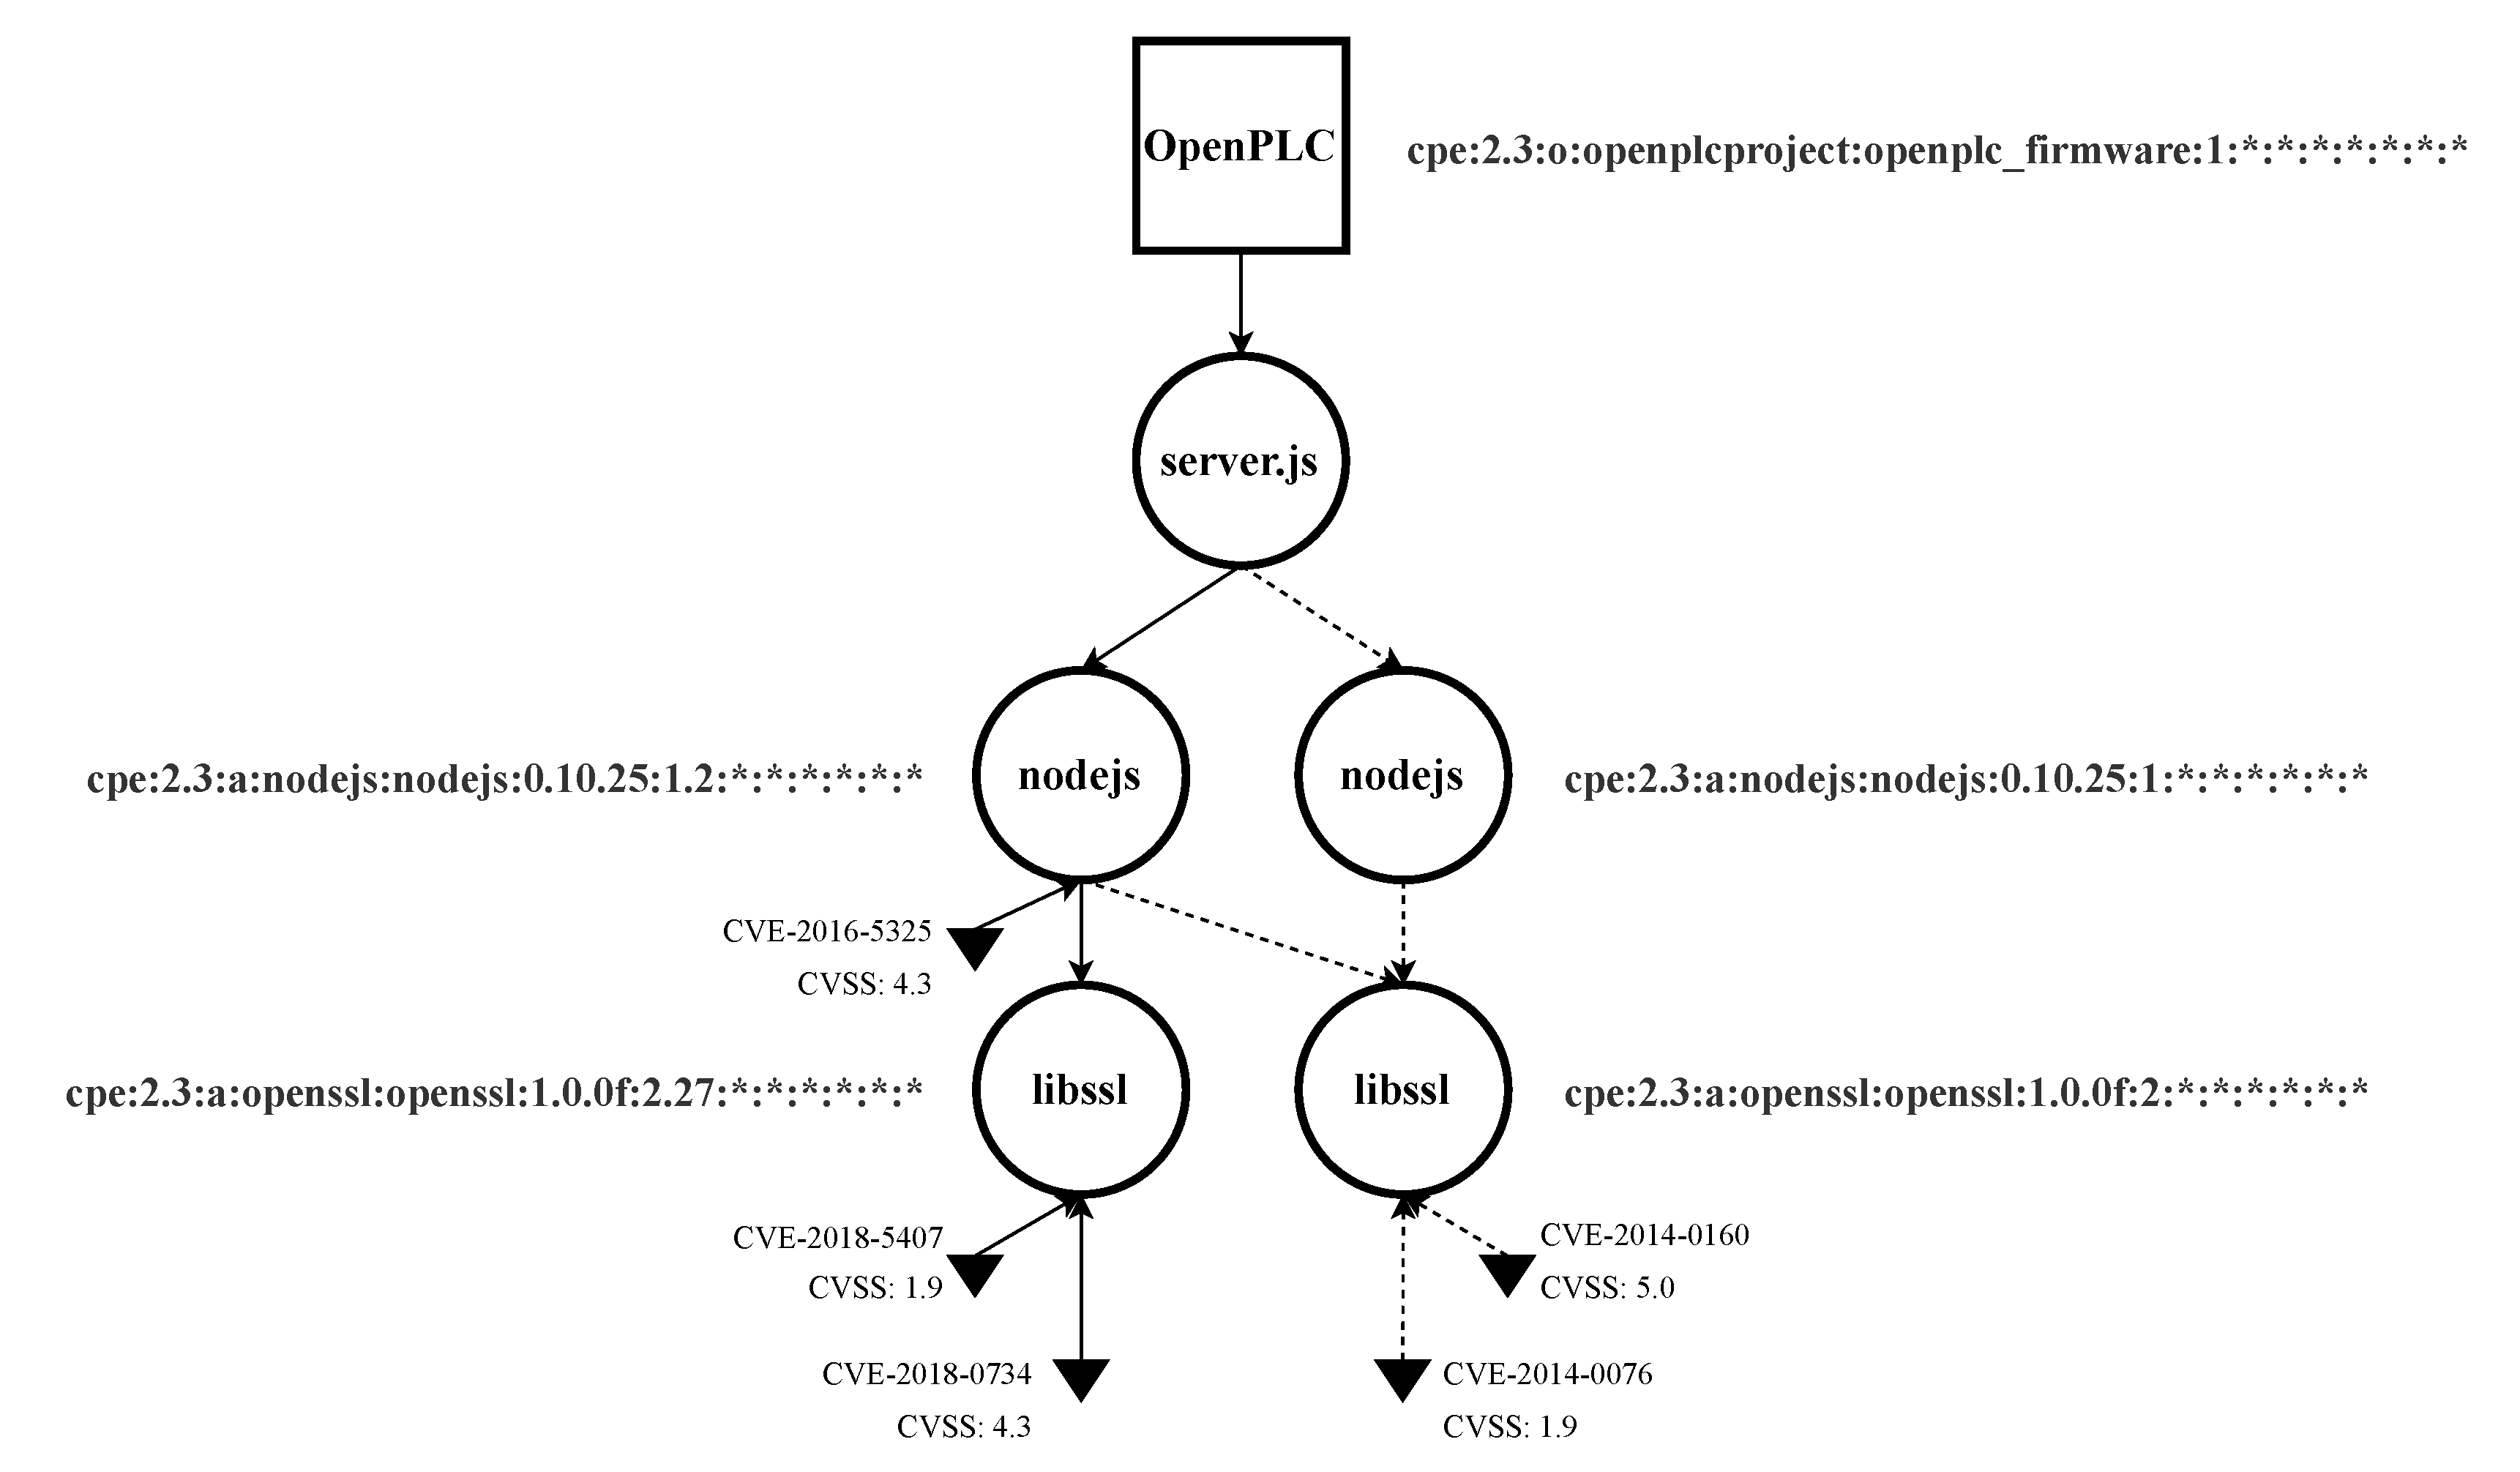
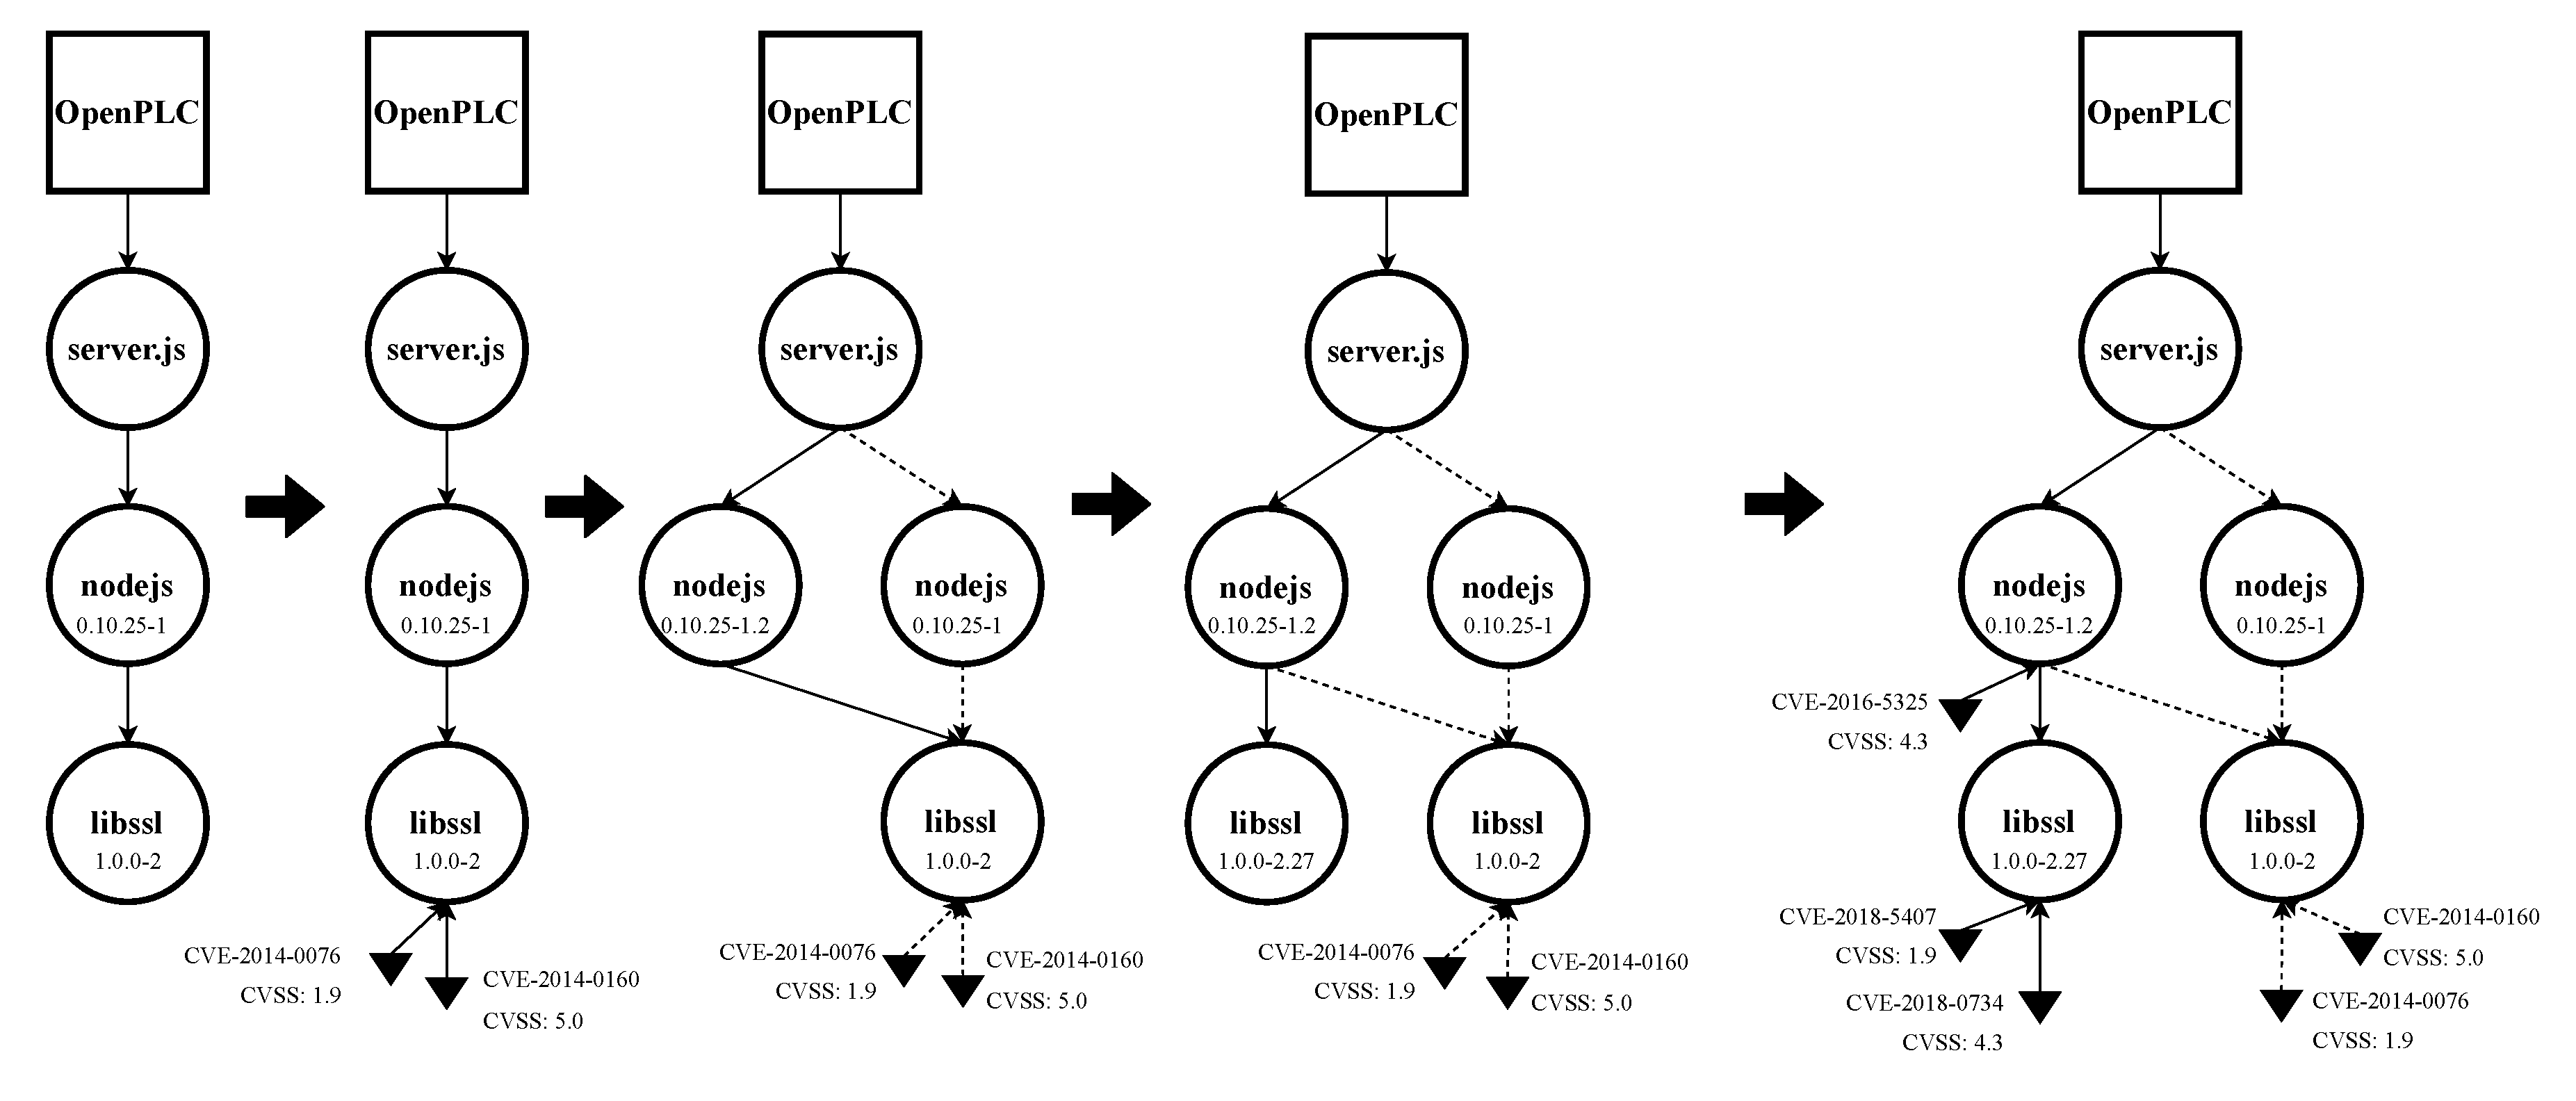
4.3. Building the EDG
4.4. Analysis of the EDG
- 1
- Analysis of the induced EDG model: The structure, assets, and dependencies are the focus of this first step.We can observe that libssl is used by nodejs, and they are not at the same level of the hierarchy. So vulnerabilities could propagate upwards through the EDG.
- 2
- Vulnerability analysis: Vulnerability number, distribution, and severity are analyzed in this step. A proposal for vulnerability prioritization is also generated.We can highlight that nodejs had one vulnerability discovered after its first update, whereas libssl had vulnerabilities in both periods of time. We could argue that, as nodejs is the most accessible asset from the exterior, its vulnerabilities should be first addressed, even though the associated CVSS is not the highest one.
- 3
- Weaknesses analysis: Finally, the root cause of each vulnerability is found. In this step, new requirements, test cases, and training activities are proposed based on the results of the analysis.Table 4 shows the root cause for each vulnerability. Using this data, new requirements, test cases, and training activities were proposed (see Appendix C).
5. Conclusions and Future Work
Author Contributions
Funding
Institutional Review Board Statement
Informed Consent Statement
Data Availability Statement
Conflicts of Interest
Abbreviations
| AI | Artificial Intelligence |
| CC | Common Criteria |
| CAPEC | Common Attack Pattern Enumeration and Classification |
| COTS | Commercial Off-The-Shelf |
| CPE | Common Platform Enumeration |
| CPS | Cyber-Physical System |
| CVE | Common Vulnerabilities and Exposures |
| CVSS | Common Vulnerability Scoring System |
| CWE | Common Weakness Enumeration |
| EAL | Evaluation Assurance Level |
| EDG | Extended Dependency Graph |
| ES | Embedded System |
| IACS | Industrial Automation Control System |
| IoT | Internet Of Things |
| PLC | Programmable Logic Controller |
| SUT | System Under Test |
Appendix A. Applicability in the Context of ISA/IEC 62443
Appendix A.1. Security Requirements—2: Threat Model (SR-2)
Appendix A.2. Security Management—13: Continuous Improvement (SM-13)
Appendix A.3. Specification of Security Requirements—5: Security Requirements Review (SR-5)
Appendix A.4. Security Verification and Validation Testing—4: Penetration Testing (SVV-4)
Appendix A.5. Management of Security-Related Issues—3: Assessing Security-Related Issues (DM-3)

| Metric | SR-2 | SR-5 | SM-13 | SVV-4 | DM-3 |
|---|---|---|---|---|---|
| ■ | ■ | ■ | ■ | ■ | |
| ■ | ■ | ■ | ■ | ■ | |
| □ | ■ | ■ | □ | □ | |
| ■ | ■ | ■ | ■ | □ | |
| □ | ■ | ■ | □ | □ | |
| ■ | ■ | ■ | ■ | □ | |
| ■ | ■ | □ | ■ | ■ | |
| ■ | □ | □ | ■ | ■ | |
| □ | ■ | ■ | □ | □ |
Appendix B. EDG for OpenPLC V1
Appendix C. Proposed Requirements, Training, and Test Cases
| CWE ID | Requirements |
|---|---|
| CWE-119 | Use languages that perform their own memory management. |
| CWE-119 | Use libraries or frameworks that make it easier to handle numbers without unexpected consequences. Examples include safe integer handling packages such as SafeInt (C++) or IntegerLib (C or C++). |
| CWE-119, CWE-200 | Use a CPU and operating system that offers Data Execution Protection (NX) or its equivalent. |
| CWE-190, CWE-200 | Ensure that all protocols are strictly defined, such that all out-of-bounds behaviors can be identified simply, and require strict conformance to the protocol. |
| CWE-310 | Clearly specify which data or resources are valuable enough that they should be protected by encryption. Require that any transmission or storage of this data/resource should use well-vetted encryption algorithms. Up-to-date algorithms must be used, and the entropy of the keys must be sufficient for the application. |
| CWE-113 | Use an input validation framework such as Struts or the OWASP ESAPI Validation API. |
| CWE-113 | Assume all input is malicious. Use an "accept known good" input validation strategy, i.e., use a list of acceptable inputs that strictly conform to specifications. Reject any input that does not strictly conform to specifications, or transform it into something that does. |
| CWE-113 | Hard-code the search path to a set of known-safe values (such as system directories), or only allow them to be specified by the administrator in a configuration file. Do not allow these settings to be modified by an external party. |
| CWE-119 | Run or compile the software using features or extensions that automatically provide a protection mechanism that mitigates or eliminates buffer overflows. |
| CWE-119 | Replace unbounded copy functions with analogous functions that support length arguments, such as strcpy with strncpy. Create these if they are not available. |
| CWE ID | Training |
|---|---|
| CWE-113, CWE-119 | Identification of all potentially relevant properties of an input (length, type of input, the full range of acceptable values, missing or extra inputs, syntax, consistency across related fields). |
| CWE-113, CWE-119 | Input validation strategies. |
| CWE-113, CWE-119, CWE-200 | Allowlists and Denylists. |
| CWE-113, CWE-119 | Character encoding compatibility. |
| CWE-113, CWE-119 | Buffer overflow detection during compilation (e.g., Microsoft Visual Studio /GS flag, Fedora/Red Hat FORTIFY_SOURCE GCC flag, StackGuard, and ProPolice). |
| CWE-113, CWE-119CWE-200 | Secure functions, such as strcpy with strncpy. Create these if they are not available. |
| CWE-113, CWE-119CWE-190 | Secure programming: memory management. |
| CWE-113, CWE-119 | Understand the programming language’s underlying representation and how it interacts with numeric calculation. |
| CWE-113, CWE-119 | System compartmentalization. |
| CWE-200, CWE-310 | Certificate management. |
| CWE-200, CWE-310 | Certificate pinning. |
| CWE-310 | Encryption integration (do not develop custom or private cryptographic algorithms). |
| CWE-310 | Secure up-to-date cryptographic algorithms. |
| CWE-200 | Shared resource management. |
| CWE-200 | Thread-safe functions. |
| Capec ID | Test Cases |
|---|---|
| CAPEC-119 | Check for buffer overflows through manipulation of environment variables. This test leverages implicit trust often placed in environment variables. |
| CAPEC-119 | Static analysis of the code: secure functions and buffer overflow. |
| CAPEC-119 | Feed overly long input strings to the program in an attempt to overwhelm the filter (by causing a buffer overflow) and hoping that the filter does not fail securely (i.e. the user input is let into the system unfiltered) |
| CAPEC-119 | This test uses symbolic links to cause buffer overflows. The evaluator can try to create or manipulate a symbolic link file such that its contents result in out-of-bounds data. When the target software processes the symbolic link file, it could potentially overflow internal buffers with insufficient bounds checking. |
| CAPEC-119 | Static analysis of the code: secure functions and buffer overflow. |
References
- Qingyu, O.; Fang, L.; Kai, H. High-Security System Primitive for Embedded Systems. In Proceedings of the 2009 International Conference on Multimedia Information Networking and Security, Wuhan, China, 18–20 November 2009; Volume 2, pp. 319–321. [Google Scholar] [CrossRef]
- Chen, T.M.; Abu-Nimeh, S. Lessons from Stuxnet. Computer 2011, 44, 91–93. [Google Scholar] [CrossRef]
- Vai, M.; Nahill, B.; Kramer, J.; Geis, M.; Utin, D.; Whelihan, D.; Khazan, R. Secure architecture for embedded systems. In Proceedings of the 2015 IEEE High Performance Extreme Computing Conference (HPEC), Waltham, MA, USA, 15–17 September 2015; pp. 1–5. [Google Scholar] [CrossRef]
- Ten, C.W.; Manimaran, G.; Liu, C.C. Cybersecurity for Critical Infrastructures: Attack and Defense Modeling. IEEE Trans. Syst. Man Cybern.-Part A Syst. Hum. 2010, 40, 853–865. [Google Scholar] [CrossRef]
- Gressl, L.; Steger, C.; Neffe, U. Design Space Exploration for Secure IoT Devices and Cyber-Physical Systems. ACM Trans. Embed. Comput. Syst. 2021, 20, 1–24. [Google Scholar] [CrossRef]
- Gupta, M.; Abdelsalam, M.; Khorsandroo, S.; Mittal, S. Security and Privacy in Smart Farming: Challenges and Opportunities. IEEE Access 2020, 8, 34564–34584. [Google Scholar] [CrossRef]
- Mumtaz, S.; Alsohaily, A.; Pang, Z.; Rayes, A.; Tsang, K.F.; Rodriguez, J. Massive Internet of Things for Industrial Applications: Addressing Wireless IIoT Connectivity Challenges and Ecosystem Fragmentation. IEEE Ind. Electron. Mag. 2017, 11, 28–33. [Google Scholar] [CrossRef]
- Ojo, M.O.; Giordano, S.; Procissi, G.; Seitanidis, I.N. A Review of Low-End, Middle-End, and High-End Iot Devices. IEEE Access 2018, 6, 70528–70554. [Google Scholar] [CrossRef]
- Shafique, K.; Khawaja, B.A.; Sabir, F.; Qazi, S.; Mustaqim, M. Internet of Things (IoT) for Next-Generation Smart Systems: A Review of Current Challenges, Future Trends and Prospects for Emerging 5G-IoT Scenarios. IEEE Access 2020, 8, 23022–23040. [Google Scholar] [CrossRef]
- Ponta, S.E.; Plate, H.; Sabetta, A. Detection, assessment and mitigation of vulnerabilities in open source dependencies. Empir. Softw. Eng. 2020, 25, 3175–3215. [Google Scholar] [CrossRef]
- Hejderup, J.I.; Van Deursen, A.; Mesbah, A. In Dependencies We Trust: How Vulnerable are Dependencies in Software Modules? Ph.D. Thesis, Department of Software Technology, TU Delft, Delft, The Netherlands, 2015. [Google Scholar]
- Pashchenko, I.; Plate, H.; Ponta, S.E.; Sabetta, A.; Massacci, F. Vulnerable Open Source Dependencies: Counting Those That Matter. In Proceedings of the 12th International Symposium on Empirical Software Engineering and Measurement (ESEM), Oulu, Finland, 11–12 October 2018. [Google Scholar] [CrossRef]
- Zografopoulos, I.; Ospina, J.; Liu, X.; Konstantinou, C. Cyber-Physical Energy Systems Security: Threat Modeling, Risk Assessment, Resources, Metrics, and Case Studies. IEEE Access 2021, 9, 29775–29818. [Google Scholar] [CrossRef]
- McLaughlin, S.; Konstantinou, C.; Wang, X.; Davi, L.; Sadeghi, A.R.; Maniatakos, M.; Karri, R. The Cybersecurity Landscape in Industrial Control Systems. Proc. IEEE 2016, 104, 1039–1057. [Google Scholar] [CrossRef]
- Mathew, A. Network Slicing in 5G and the Security Concerns. In Proceedings of the 2020 Fourth International Conference on Computing Methodologies and Communication (ICCMC), Erode, India, 11–13 March 2020; pp. 75–78. [Google Scholar] [CrossRef]
- Christidis, K.; Devetsikiotis, M. Blockchains and Smart Contracts for the Internet of Things. IEEE Access 2016, 4, 2292–2303. [Google Scholar] [CrossRef]
- Hassija, V.; Chamola, V.; Saxena, V.; Jain, D.; Goyal, P.; Sikdar, B. A Survey on IoT Security: Application Areas, Security Threats, and Solution Architectures. IEEE Access 2019, 7, 82721–82743. [Google Scholar] [CrossRef]
- Ayaz, M.; Ammad-Uddin, M.; Sharif, Z.; Mansour, A.; Aggoune, E.H.M. Internet-of-Things (IoT)-Based Smart Agriculture: Toward Making the Fields Talk. IEEE Access 2019, 7, 129551–129583. [Google Scholar] [CrossRef]
- Fuller, A.; Fan, Z.; Day, C.; Barlow, C. Digital Twin: Enabling Technologies, Challenges and Open Research. IEEE Access 2020, 8, 108952–108971. [Google Scholar] [CrossRef]
- Xin, Y.; Kong, L.; Liu, Z.; Chen, Y.; Li, Y.; Zhu, H.; Gao, M.; Hou, H.; Wang, C. Machine Learning and Deep Learning Methods for Cybersecurity. IEEE Access 2018, 6, 35365–35381. [Google Scholar] [CrossRef]
- Benias, N.; Markopoulos, A.P. A review on the readiness level and cyber-security challenges in Industry 4.0. In Proceedings of the 2017 South Eastern European Design Automation, Computer Engineering, Computer Networks and Social Media Conference (SEEDA-CECNSM), Kastoria, Greece, 23–25 September 2017; pp. 1–5. [Google Scholar] [CrossRef]
- Matsuda, W.; Fujimoto, M.; Aoyama, T.; Mitsunaga, T. Cyber Security Risk Assessment on Industry 4.0 using ICS testbed with AI and Cloud. In Proceedings of the 2019 IEEE Conference on Application, Information and Network Security (AINS), Pulau Pinang, Malaysia, 19–21 November 2019; pp. 54–59. [Google Scholar] [CrossRef]
- Culot, G.; Fattori, F.; Podrecca, M.; Sartor, M. Addressing Industry 4.0 Cybersecurity Challenges. IEEE Eng. Manag. Rev. 2019, 47, 79–86. [Google Scholar] [CrossRef]
- Lezzi, M.; Lazoi, M.; Corallo, A. Cybersecurity for Industry 4.0 in the current literature: A reference framework. Comput. Ind. 2018, 103, 97–110. [Google Scholar] [CrossRef]
- Ustundag, A.; Cevikcan, E. Industry 4.0: Managing The Digital Transformation; Springer International Publishing: Berlin/Heidelberg, Germany, 2018. [Google Scholar] [CrossRef]
- Thames, L.; Schaefer, D. (Eds.) Cybersecurity for Industry 4.0; Springer International Publishing: Berlin/Heidelberg, Germany, 2017. [Google Scholar] [CrossRef]
- Medeiros, N.; Ivaki, N.; Costa, P.; Vieira, M. Software Metrics as Indicators of Security Vulnerabilities. In Proceedings of the 2017 IEEE 28th International Symposium on Software Reliability Engineering (ISSRE), Toulouse, France, 23–26 October 2017; pp. 216–227. [Google Scholar] [CrossRef]
- Alenezi, M.; Zarour, M. On the Relationship between Software Complexity and Security. Int. J. Softw. Eng. Appl. 2020, 11, 51–60. Available online: https://aircconline.com/abstract/ijsea/v11n1/11120ijsea04.html (accessed on 27 January 2022). [CrossRef]
- Langner, R. Stuxnet: Dissecting a Cyberwarfare Weapon. IEEE Secur. Priv. 2011, 9, 49–51. [Google Scholar] [CrossRef]
- George, G.; Thampi, S.M. A Graph-Based Security Framework for Securing Industrial IoT Networks From Vulnerability Exploitations. IEEE Access 2018, 6, 43586–43601. [Google Scholar] [CrossRef]
- Papp, D.; Ma, Z.; Buttyan, L. Embedded systems security: Threats, vulnerabilities, and attack taxonomy. In Proceedings of the 2015 13th Annual Conference on Privacy, Security and Trust (PST), Izmir, Turkey, 21–23 July 2015; pp. 145–152. [Google Scholar] [CrossRef]
- Nielsen, B.B.; Torp, M.T.; Møller, A. Modular Call Graph Construction for Security Scanning of Node.Js Applications. In Proceedings of the 30th ACM SIGSOFT International Symposium on Software Testing and Analysis; Association for Computing Machinery: New York, NY, USA, 2021; pp. 29–41. [Google Scholar] [CrossRef]
- Sawilla, R.E.; Ou, X. Identifying Critical Attack Assets in Dependency Attack Graphs. In Computer Security—ESORICS 2008; Jajodia, S., Lopez, J., Eds.; Springer: Berlin/Heidelberg, Germany, 2008; pp. 18–34. Available online: https://link.springer.com/chapter/10.1007/978-3-540-88313-5_2#citeas (accessed on 27 January 2022).
- MITRE Corporation. CVE—Common Vulnerability and Exposures. Available online: https://cve.mitre.org/index.html (accessed on 27 January 2022).
- MITRE Corporation. CVE—Common Vulnerabilities and Exposures: Definitions. Available online: https://cve.mitre.org/about/terminology.html (accessed on 21 January 2022).
- National Institute for Standards and Technology (NIST). National Vulnerability Database NVD—Vulnerability List. Available online: https://nvd.nist.gov/vuln/full-listing (accessed on 27 January 2022).
- FIRST—global Forum of Incident Response and Security Teams. Common Vulnerability Scoring System (CVSS). Available online: https://www.first.org/cvss/ (accessed on 27 January 2022).
- MITRE Corporation. CWE—Common Weakness Enumeration. Available online: https://cwe.mitre.org/index.html (accessed on 27 January 2022).
- MITRE Corporation. CWE—Common Weakness Enumeration: Definitions. Available online: https://cwe.mitre.org/about/faq.html (accessed on 27 January 2022).
- Jiang, Y.; Atif, Y.; Ding, J. Cyber-Physical Systems Security Based on a Cross-Linked and Correlated Vulnerability Database. In Critical Information Infrastructures Security; Nadjm-Tehrani, S., Ed.; Springer International Publishing: Cham, Switzerland, 2020; pp. 71–82. Available online: https://link.springer.com/book/10.1007/978-3-030-37670-3 (accessed on 27 January 2022).
- Kleidermacher, D.; Kleidermacher, M. Practical Methods for Safe and Secure Software and Systems Development. In Embedded Systems Security; Kleidermacher, D., Kleidermacher, M., Eds.; Newnes: Oxford, UK, 2012. [Google Scholar] [CrossRef]
- Andreeva, O.; Gordeychik, S.; Gritsai, G.; Kochetova, O.; Potseluevskaya, E.; Sidorov, S.; Timorin, A. Industrial Control Systems Vulnerabilities Statistics; Technical Report; Karpersky: Moscow, Russia, 2016. [Google Scholar] [CrossRef]
- Hwang, D.; Schaumont, P.; Tiri, K.; Verbauwhede, I. Securing embedded systems. IEEE Secur. Priv. 2006, 4, 40–49. [Google Scholar] [CrossRef]
- Viega, J.; Thompson, H. The State of Embedded-Device Security (Spoiler Alert: It’s Bad). IEEE Secur. Priv. 2012, 10, 68–70. [Google Scholar] [CrossRef]
- Marwedel, P. Embedded Systems Foundations of Cyber-Physical Systems, and the Internet of Things. In Embedded System Design; Springer Nature: Cham, Switzerland, 2018. [Google Scholar] [CrossRef]
- Arpaia, P.; Bonavolontà, F.; Cioffi, A.; Moccaldi, N. Reproducibility Enhancement by Optimized Power Analysis Attacks in Vulnerability Assessment of IoT Transducers. IEEE Trans. Instrum. Meas. 2021, 70, 1–8. [Google Scholar] [CrossRef]
- IEC 62443; Industrial Communication Networks—Network and System Security. IEC Central Office: Geneva, Switzerland, 2010.
- Mugarza, I.; Flores, J.L.; Montero, J.L. Security Issues and Software Updates Management in the Industrial Internet of Things (IIoT) Era. Sensors 2020, 20, 7160. [Google Scholar] [CrossRef] [PubMed]
- IEC 62443; Security for Industrial Automation and Control Systems—Part 4-1: Secure Product Development Lifecycle Requirements. International Electrotechnical Commission: Geneva, Switzerland, 2018.
- Avizienis, A.; Laprie, J.; Randell, B.; Landwehr, C. Basic concepts and taxonomy of dependable and secure computing. IEEE Trans. Dependable Secur. Comput. 2004, 1, 11–33. [Google Scholar] [CrossRef] [Green Version]
- He, W.; Li, H.; Li, J. Unknown Vulnerability Risk Assessment Based on Directed Graph Models: A Survey. IEEE Access 2019, 7, 168201–168225. [Google Scholar] [CrossRef]
- ISO/IEC 30111:2019; Information Technology—Security Techniques—Vulnerability Handling Processes. International Organization for Standardization: Geneva, Switzerland, 2019. Available online: https://www.iso.org/standard/69725.html (accessed on 27 January 2022).
- Common Criteria (CC). The Common Criteria for Information Technology Security Evaluation—Introduction and General Model. Available online: https://www.commoncriteriaportal.org/files/ccfiles/CCPART1V3.1R5.pdf (accessed on 27 January 2022).
- Common Criteria (CC). Part 3: Security Assurance Components. Available online: https://commoncriteriaportal.org/files/ccfiles/CCPART3V3.1R5.pdf (accessed on 27 January 2022).
- Herrmann, D. Using the Common Criteria for IT Security Evaluation; Auerbach Publications: Boca Raton, FL, USA, 2002; pp. 1–289. [Google Scholar] [CrossRef]
- Matheu, S.N.; Hernandez-Ramos, J.L.; Skarmeta, A.F. Toward a Cybersecurity Certification Framework for the Internet of Things. IEEE Secur. Priv. 2019, 17, 66–76. [Google Scholar] [CrossRef]
- Mellado, D.; Fernández-Medina, E.; Piattini, M. A common criteria based security requirements engineering process for the development of secure information systems. Comput. Stand. Interfaces 2007, 29, 244–253. [Google Scholar] [CrossRef]
- Hohenegger, A.; Krummeck, G.; Baños, J.; Ortega, A.; Hager, M.; Sterba, J.; Kertis, T.; Novobilsky, P.; Prochazka, J.; Caracuel, B.; et al. Security certification experience for industrial cyberphysical systems using Common Criteria and IEC 62443 certifications in certMILS. In Proceedings of the 2021 4th IEEE International Conference on Industrial Cyber-Physical Systems (ICPS), Victoria, BC, Canada, 10–12 May 2021; pp. 25–30. [Google Scholar] [CrossRef]
- Homer, J.; Ou, X.; Schmidt, D. A Sound and Practical Approach to Quantifying Security Risk in Enterprise Networks. Technical Report. 2009. Available online: https://www.cse.usf.edu/~xou/publications/tr_homer_0809.pdf (accessed on 27 January 2022).
- Zhang, S.; Ou, X.; Singhal, A.; Homer, J. An Empirical Study of a Vulnerability Metric Aggregation Method; Technical Report; Kansas State University: Manhattan, KS, USA, 2011; Available online: https://www.cse.usf.edu/~xou/publications/stmacip11.pdf (accessed on 27 January 2022).
- Homer, J.; Zhang, S.; Ou, X.; Schmidt, D.; Du, Y.; Rajagopalan, S.R.; Singhal, A. Aggregating vulnerability metrics in enterprise networks using attack graphs. J. Comput. Secur. 2013, 21, 561–597. [Google Scholar] [CrossRef] [Green Version]
- Li, S.; Chen, Y.; Wu, X.; Cheng, X.; Tian, Z. Power Grid-Oriented Cascading Failure Vulnerability Identifying Method Based on Wireless Sensors. J. Sens. 2021, 2021, 8820413. [Google Scholar] [CrossRef]
- Liu, B.; Zhu, G.; Li, X.; Sun, R. Vulnerability Assessment of the Urban Rail Transit Network Based on Travel Behavior Analysis. IEEE Access 2021, 9, 1407–1419. [Google Scholar] [CrossRef]
- Poolsappasit, N.; Dewri, R.; Ray, I. Dynamic Security Risk Management Using Bayesian Attack Graphs. IEEE Trans. Dependable Secur. Comput. 2012, 9, 61–74. [Google Scholar] [CrossRef]
- Muñoz-González, L.; Sgandurra, D.; Barrère, M.; Lupu, E.C. Exact Inference Techniques for the Analysis of Bayesian Attack Graphs. IEEE Trans. Dependable Secur. Comput. 2019, 16, 231–244. [Google Scholar] [CrossRef] [Green Version]
- Liu, X.; Qian, C.; Hatcher, W.G.; Xu, H.; Liao, W.; Yu, W. Secure Internet of Things (IoT)-Based Smart-World Critical Infrastructures: Survey, Case Study and Research Opportunities. IEEE Access 2019, 7, 79523–79544. [Google Scholar] [CrossRef]
- Pascale, F.; Adinolfi, E.A.; Coppola, S.; Santonicola, E. Cybersecurity in Automotive: An Intrusion Detection System in Connected Vehicles. Electronics 2021, 10, 1765. [Google Scholar] [CrossRef]
- Hu, J.; Guo, S.; Kuang, X.; Meng, F.; Hu, D.; Shi, Z. I-HMM-Based Multidimensional Network Security Risk Assessment. IEEE Access 2020, 8, 1431–1442. [Google Scholar] [CrossRef]
- Khosravi-Farmad, M.; Bafghi, A. Bayesian Decision Network-Based Security Risk Management Framework. J. Netw. Syst. Manag. 2020, 28, 1794–1819. [Google Scholar] [CrossRef]
- Atzeni, A.; Lioy, A. Why to adopt a security metric? A brief survey. Adv. Inf. Secur. 2006, 23, 1–12. [Google Scholar] [CrossRef]
- Zeb, T.; Yousaf, M.; Afzal, H.; Mufti, M.R. A quantitative security metric model for security controls: Secure virtual machine migration protocol as target of assessment. China Commun. 2018, 15, 126–140. [Google Scholar] [CrossRef]
- Longueira-Romero, A.; Iglesias, R.; Gonzalez, D.; Garitano, I.N. How to Quantify the Security Level of Embedded Systems? A Taxonomy of Security Metrics. In Proceedings of the 2020 IEEE 18th International Conference on Industrial Informatics (INDIN), Warwick, UK, 20–23 July 2020; Volume 1, pp. 153–158. [Google Scholar] [CrossRef]
- Rudolph, M.; Schwarz, R. A Critical Survey of Security Indicator Approaches. In Proceedings of the 2012 Seventh International Conference on Availability, Reliability and Security, Prague, Czech Republic, 20–24 August 2012; pp. 291–300. [Google Scholar] [CrossRef]
- Sentilles, S.; Papatheocharous, E.; Ciccozzi, F. What Do We Know about Software Security Evaluation? A Preliminary Study. QuASoQ@APSEC, 2018. Available online: http://ceur-ws.org/Vol-2273/QuASoQ-04.pdf (accessed on 27 January 2022).
- Amutio, M.A.; Candau, J.; Mañas, J.A. MAGERIT V3.0. Methodology for Information Systems Risk Analysis and Management; Book I—The Method; National Standard; Ministry of Finance and Public Administration: Madrid, Spain, 2014.
- Dekker, M.; Karsberg, C. Guideline on Threats and Assets: Technical Guidance on Threats and Assets in Article 13a; Technical Report. European Union Agency for Network and Information Security, 2015. Available online: https://www.enisa.europa.eu/publications/technical-guideline-on-threats-and-assets (accessed on 27 January 2022).
- ISO/IEC 13335-1:2004; Information Technology—Security Techniques—Management of Information and Communications Technology Security—Part 1: Concepts and Models for Information and Communications Technology Security Management. International Organization for Standardization: Geneva, Switzerland, 2004.
- National Institute for Standards and Technology (NIST). CPE—Common Platform Enumeration. Available online: https://nvd.nist.gov/products/cpe (accessed on 27 January 2022).
- Cheikes, B.A.; Waltermire, D.; Scarfone, K. NIST Interagency Report 7695—Common Platform Enumeration: Naming Specification Version 2.3; Nist interagency Report; National Institute for Standards and Technology (NIST): Gaithersburg, MD, USA, 2011. Available online: https://tsapps.nist.gov/publication/get_pdf.cfm?pub_id=909010 (accessed on 27 January 2022).
- Parmelee, M.C.; Booth, H.; Waltermire, D.; Scarfone, K. NIST Interagency Report 7696—Common Platform Enumeration: Name Matching Specification Version 2.3; Nist Interagency Report; National Institute for Standards and Technology (NIST): Gaithersburg, MD, USA, 2011. Available online: https://tsapps.nist.gov/publication/get_pdf.cfm?pub_id=909008 (accessed on 27 January 2022).
- ISO 8601:2019; Data and time-Representation for Information Interchange—Part 1: Basic Rules. International Organization for Standardization: Geneva, Switzerland, 2019.
- MITRE Corporation. CAPEC—Common Attack Pattern Enumeration and Classification. Available online: https://capec.mitre.org/ (accessed on 27 January 2022).
- MITRE Corporation. CAPEC—Common Attack Pattern Enumeration and Classification: Glossary. Available online: https://capec.mitre.org/about/glossary.html (accessed on 27 January 2022).
- NIST—National Institute of Standards and Technology. National Vulnerability database (NVD). Available online: https://nvd.nist.gov/ (accessed on 27 January 2022).
- Dimitriadis, A.; Flores, J.L.; Kulvatunyou, B.; Ivezic, N.; Mavridis, I. ARES: Automated Risk Estimation in Smart Sensor Environments. Sensors 2020, 20, 4617. [Google Scholar] [CrossRef]
- Alves, T. OpenPLC Project. Available online: https://www.openplcproject.com/ (accessed on 27 January 2022).
- Alves, T. OpenPLC V1. Available online: https://github.com/thiagoralves/OpenPLC (accessed on 27 January 2022).
- Alves, T. OpenPLC V2. Available online: https://github.com/thiagoralves/OpenPLC_v2 (accessed on 27 January 2022).
- Alves, T. OpenPLC V3. Available online: https://github.com/thiagoralves/OpenPLC_v3 (accessed on 27 January 2022).
- Alves, T.R.; Buratto, M.; de Souza, F.M.; Rodrigues, T.V. OpenPLC: An open source alternative to automation. In Proceedings of the IEEE Global Humanitarian Technology Conference (GHTC 2014), San Jose, CA, USA, 10–13 October 2014; pp. 585–589. [Google Scholar] [CrossRef]
- Alves, T.; Morris, T. OpenPLC: An IEC 61,131—3 compliant open source industrial controller for cyber security research. Comput. Secur. 2018, 78, 364–379. [Google Scholar] [CrossRef]
- Ubuntu 14.04 and 16.04 Lifecycle Extended to Ten Years. Available online: https://ubuntu.com/blog/ubuntu-14-04-and-16-04-lifecycle-extended-to-ten-years (accessed on 27 January 2022).
- libssl1.0.0: Trusty (14.04): Ubuntu. Available online: https://launchpad.net/ubuntu/trusty/+package/libssl1.0.0/+index (accessed on 27 January 2022).
- nodejs: Trusty (14.04): Ubuntu. Available online: https://launchpad.net/ubuntu/trusty/+package/nodejs/+index (accessed on 27 January 2022).
- IEC 62443; Security for Industrial Automation and Control Systems—Part 4-2: Technical Security Requirements for IACS Components. International Electrotechnical Commission: Geneva, Switzerland, 2019. Available online: https://www.isa.org/products/ansi-isa-62443-4-1-2018-security-for-industrial-au (accessed on 27 January 2022).


| Symbol | Notation | Meaning | Values |
|---|---|---|---|
| □ | A(t) | Root Node/ Device Node | |
| ◯ | Asset Node | ||
| ◌ | Cluster | ||
| ▾ | Known Vulnerability Node | ||
| ⟶ | Dependency Relation | — | |
| ⤏ | Updated Asset/ Patched Vulnerability | — |
| Metric | Definition | Reference Value | |
|---|---|---|---|
| VULNERABILITIES | Arithmetic mean of vulnerabilities in the SUT A, where is the number of assets in a SUT at a time t. shows how many vulnerabilities would be present in each asset if they were evenly distributed among the assets of the SUT. The result of can serve as a preliminary analysis of the SUT, related to the criticality of its state. From Equation (8). | : The number of vulnerabilities is lower than the number of assets. : Every asset has at least one vulnerability. | |
| Number of vulnerabilities in a SUT A at time t. From Equation (8). | Ideally, the values of should be zero (no vulnerability in A), but the lower the value of , the better. | ||
| Number of vulnerabilities in a SUT A throughout its entire life cycle T. This metric computes the accumulated value of the number of vulnerabilities of a SUT throughout its entire life cycle. From Equation (8). | The lower the value of , the better. | ||
| Number of vulnerabilities in an asset at time t The values of can be useful during a vulnerability analysis, or when performing a penetration test, to identify the asset with more vulnerabilities. From Equation (6) | Ideally, the value of should be zero. | ||
| Relative frequency of vulnerabilities of the asset at a time t. From Equation (6). | Ideally, the value of should be zero, or at least , being the number of assets in the SUT. This value can also be expressed as the percentage of vulnerabilities of asset respect to the total number of vulnerabilities in the SUT, | ||
| Multiplicity of weakness of the asset at a time t. This metric represents the number of times a weakness is present among the vulnerabilities of the asset . This is possible because a vulnerability can have associated the same weakness as other vulnerabilities. From Equation (9). | Ideally, the value of should be zero, or at least, , being the number of assets in the SUT. The value of the metric could be further narrowed by assuming that will be present in all but one asset, so to be in acceptable values. | ||
| Multiplicity of weakness of the SUT A at a time t. This metric represents the number of times a weakness is present among the vulnerabilities of the SUT A. From Equation (11). | Ideally, the value of should be zero. | ||
| WEAKNESSES | Number of weaknesses in a SUT A at time t. From Equation (7). | Ideally, the value of should be zero (no weakness in A), but the lower the value of , the better. | |
| Number of weaknesses in a SUT A throughout its entire life cycle T. This metric computes the accumulated value of weaknesses of a SUT throughout its entire life cycle. From Equation (7) | The lower the value of , the better. | ||
| Asset | 1st Update | Solved Vulnerabilities (CVSS) | 2nd Update | Solved Vulnerabilities (CVSS) |
|---|---|---|---|---|
| libssl | 2014/04/07 | CVE-2014-0076 (1.9) CVE-2014-0160 (5.0) | 2018/12/06 | CVE-2018-5407 (1.9) CVE-2018-0734 (4.3) |
| nodejs | 2014/03/27 | — | 2018/08/10 | CVE-2016-5325 (4.3) |
| CVE | CVSS | CWE | Description |
|---|---|---|---|
| CVE-2014-0076 | 1.9 | CWE-310 | Cryptographic Issues |
| CVE-2014-0160 | 7.5 | CWE-119 | Improper Restriction of Operations within the Bounds of a Memory Buffer |
| CVE-2016-5325 | 6.1 | CWE-113 | Improper Neutralization of CRLF Sequences in HTTP Headers (‘HTTP Response Splitting’) |
| CVE-2018-0734 | 5.9 | CWE-327 | Use of a Broken or Risky Cryptographic Algorithm |
| CVE-2018-5407 | 4.7 | CWE-203 CWE-200 | Observable Discrepancy Exposure of Sensitive Information to an Unauthorized Actor |
Publisher’s Note: MDPI stays neutral with regard to jurisdictional claims in published maps and institutional affiliations. |
© 2022 by the authors. Licensee MDPI, Basel, Switzerland. This article is an open access article distributed under the terms and conditions of the Creative Commons Attribution (CC BY) license (https://creativecommons.org/licenses/by/4.0/).
Share and Cite
Longueira-Romero, Á.; Iglesias, R.; Flores, J.L.; Garitano, I. A Novel Model for Vulnerability Analysis through Enhanced Directed Graphs and Quantitative Metrics. Sensors 2022, 22, 2126. https://doi.org/10.3390/s22062126
Longueira-Romero Á, Iglesias R, Flores JL, Garitano I. A Novel Model for Vulnerability Analysis through Enhanced Directed Graphs and Quantitative Metrics. Sensors. 2022; 22(6):2126. https://doi.org/10.3390/s22062126
Chicago/Turabian StyleLongueira-Romero, Ángel, Rosa Iglesias, Jose Luis Flores, and Iñaki Garitano. 2022. "A Novel Model for Vulnerability Analysis through Enhanced Directed Graphs and Quantitative Metrics" Sensors 22, no. 6: 2126. https://doi.org/10.3390/s22062126
APA StyleLongueira-Romero, Á., Iglesias, R., Flores, J. L., & Garitano, I. (2022). A Novel Model for Vulnerability Analysis through Enhanced Directed Graphs and Quantitative Metrics. Sensors, 22(6), 2126. https://doi.org/10.3390/s22062126