
Using Acoustic Vibrations as a Method for Implant Insertion Assessment in Total Hip Arthroplasty

 , and
, and 
Abstract
:1. Introduction
- The change in measured vibration peak frequencies is linked to the insertion depth in the bone model;
- The degree of fixation of the broach in the bone affects the convergence of peak energies at peak frequencies;
- The peak frequencies of the hammer impact sound can be used to predict imminent fracture.
2. Materials and Methods
2.1. Broach Insertion Measurement System (BIMS)
2.1.1. Microphone Selection
2.1.2. Audio Recording
2.1.3. Data Analysis
2.2. In Vitro Experiments
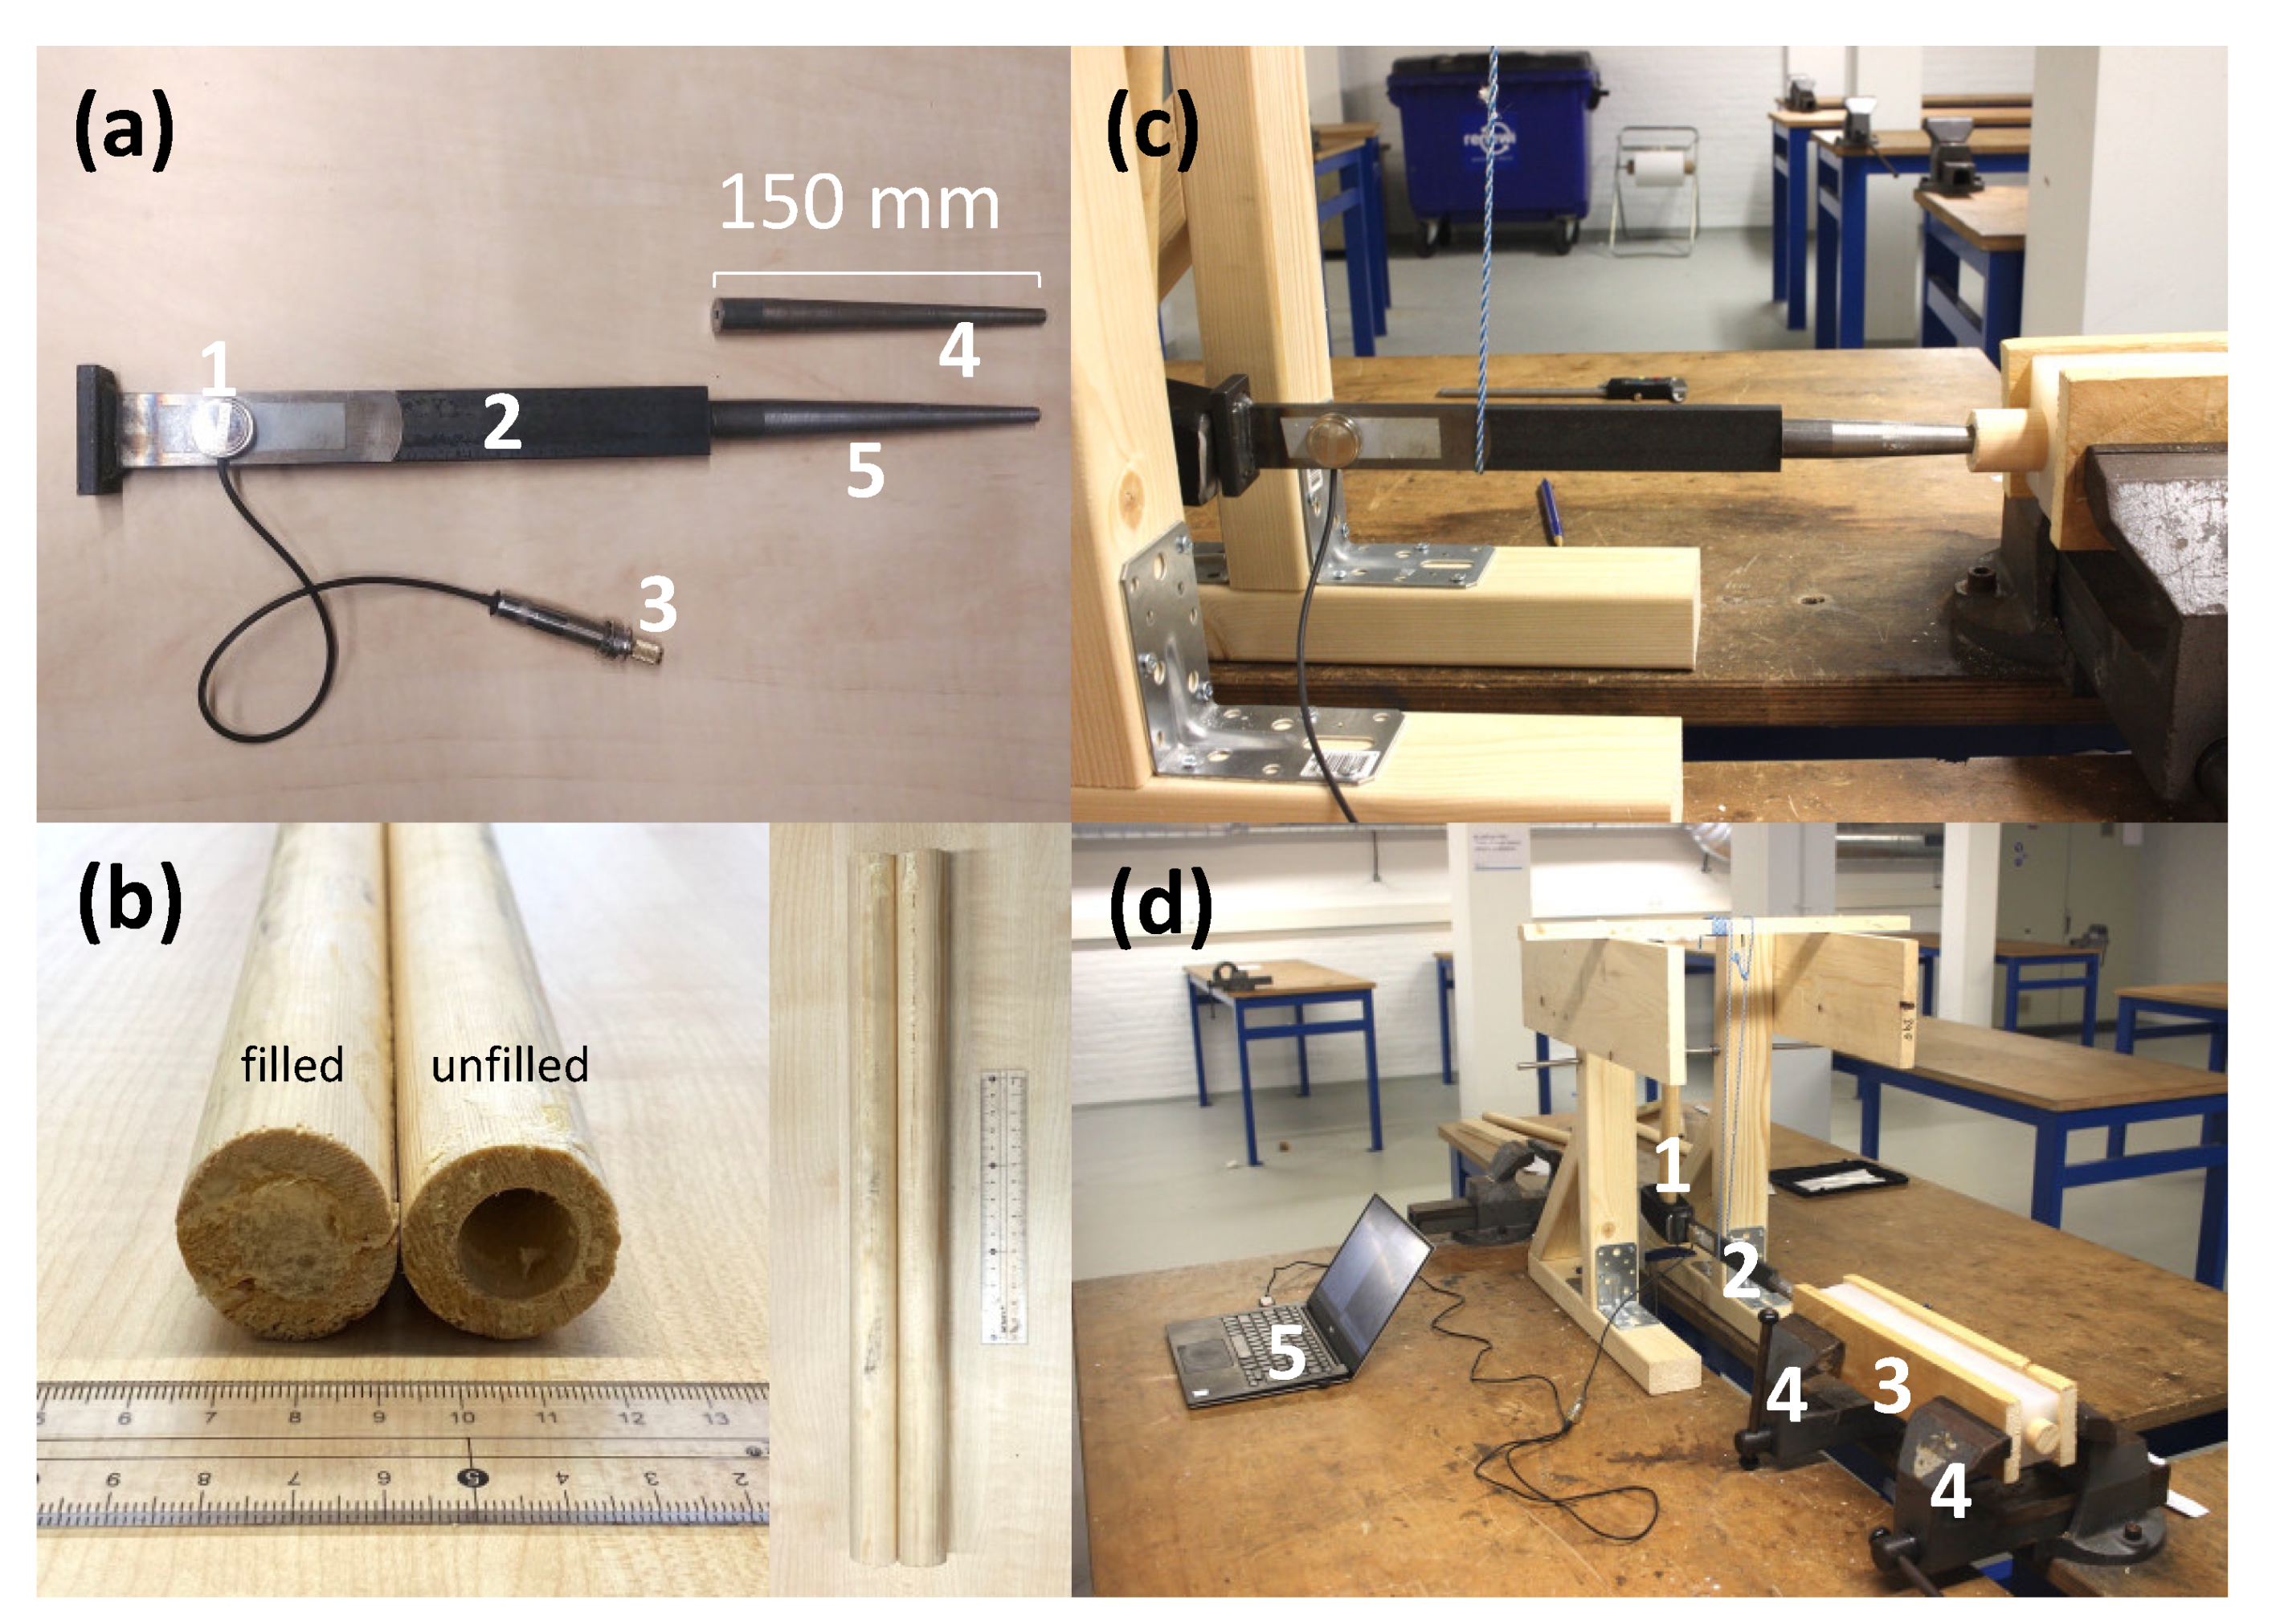
2.2.1. Custom Implant Model
2.2.2. Custom Bone Model
2.2.3. Experiment Setup
2.3. Experiments
2.3.1. Insertion Experiment
2.3.2. Fixation Experiment
2.3.3. Fracture Experiment
2.4. Pilot Trial in Cadaver Model
2.5. Eigen Frequency Estimation
2.6. Statistical Analyses
3. Results
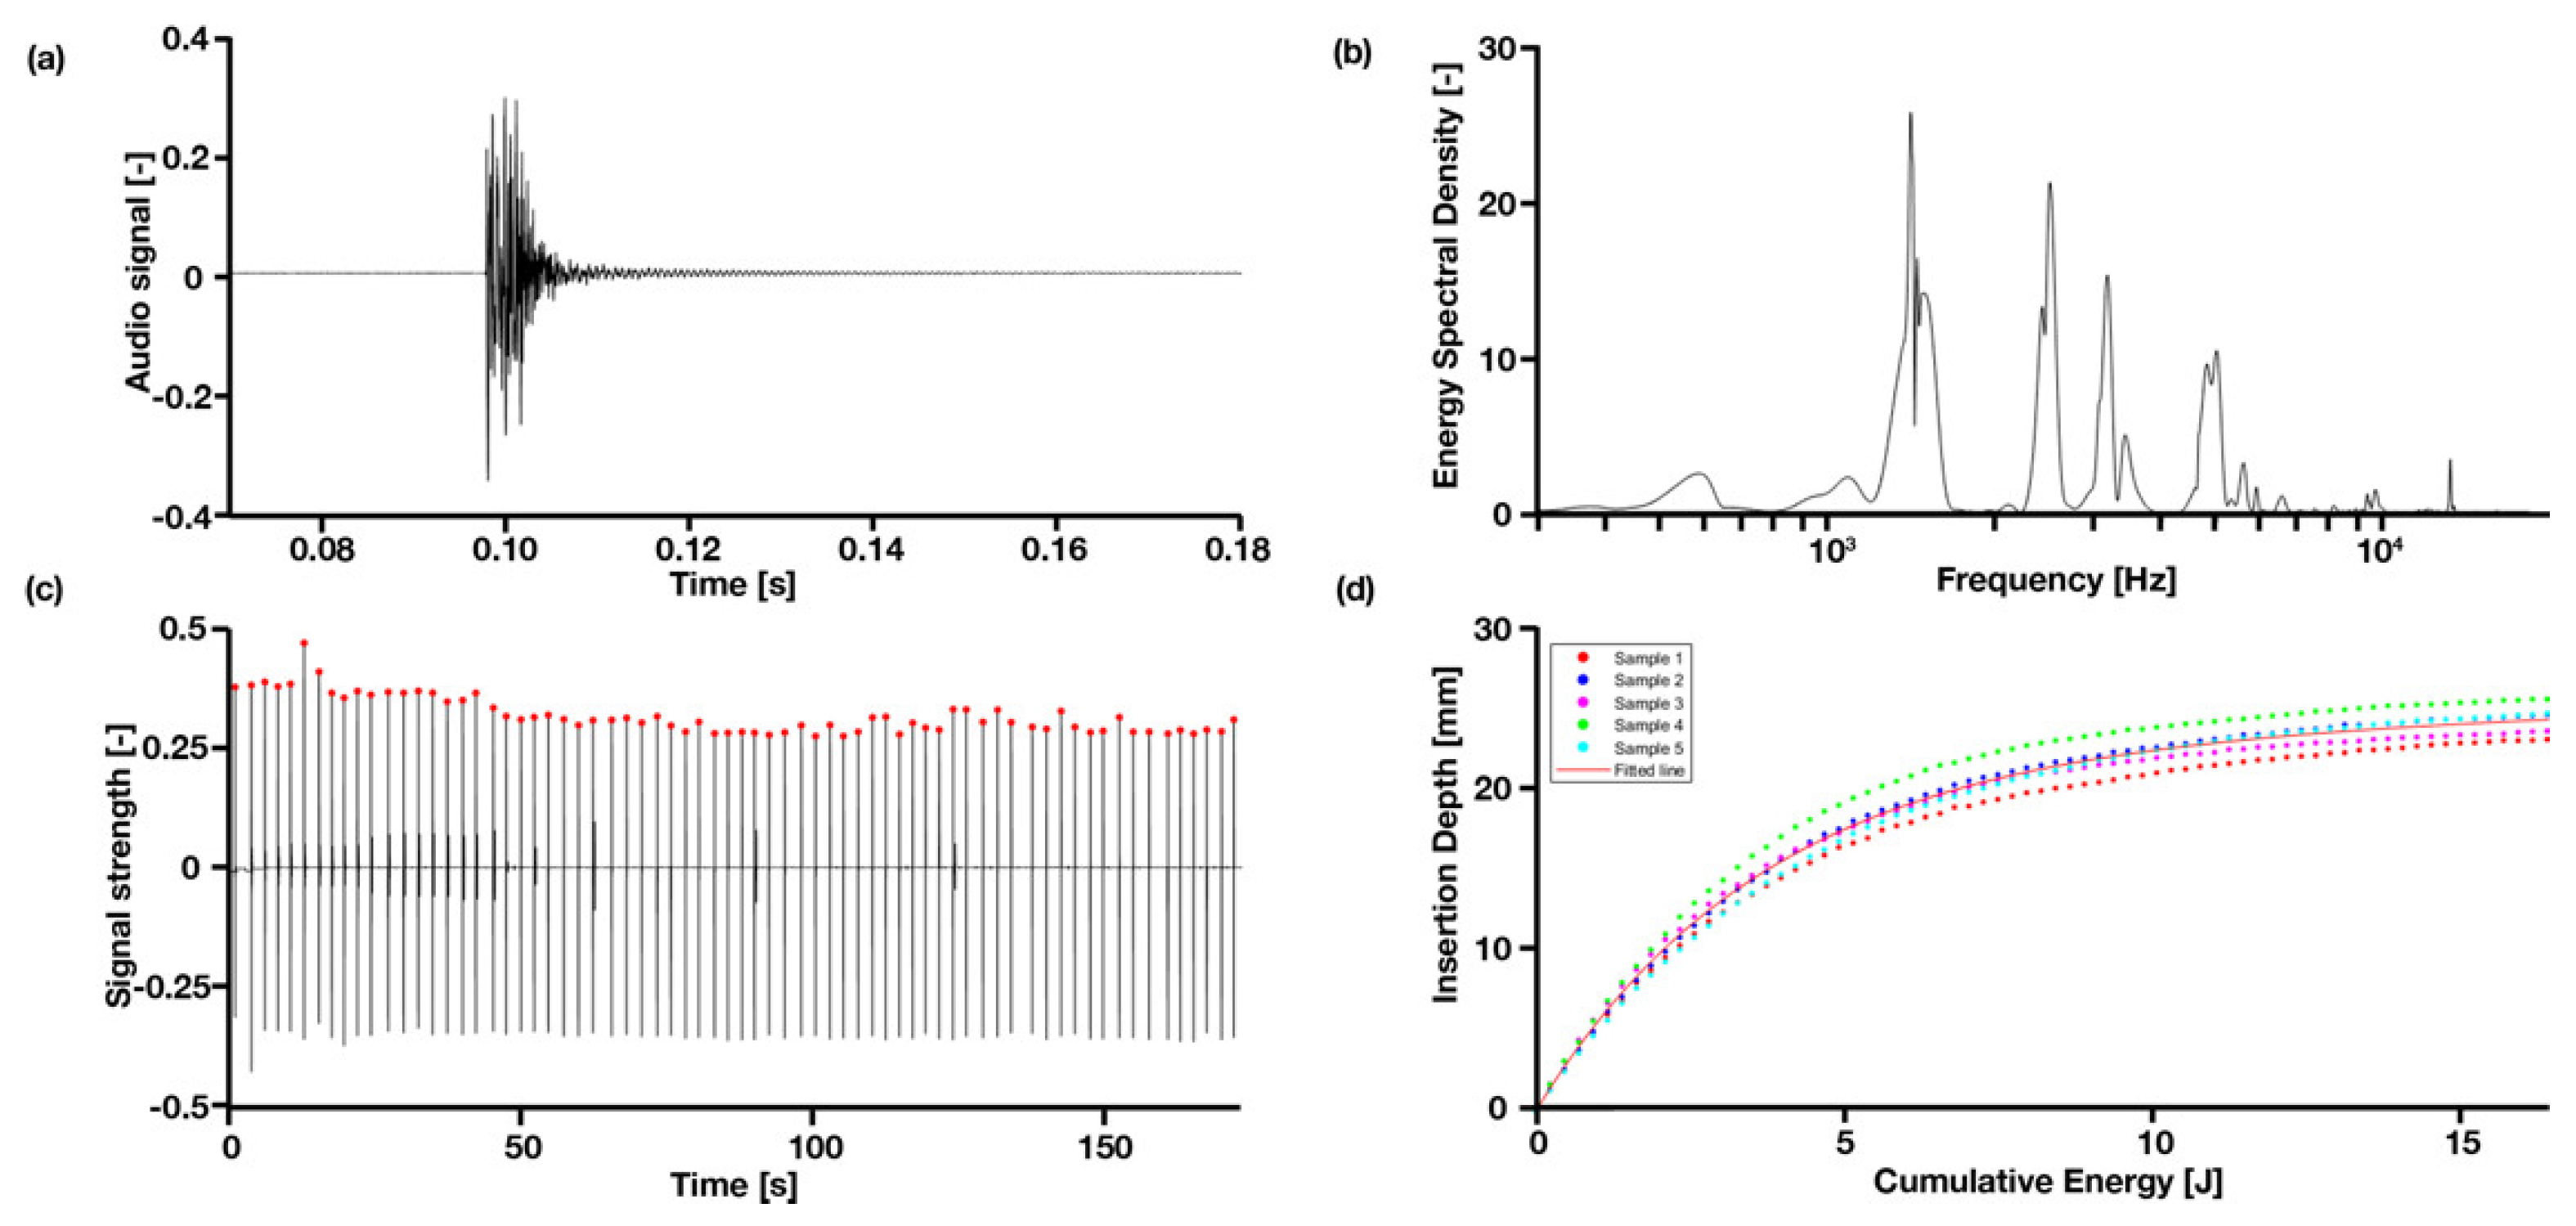
3.1. General Observations
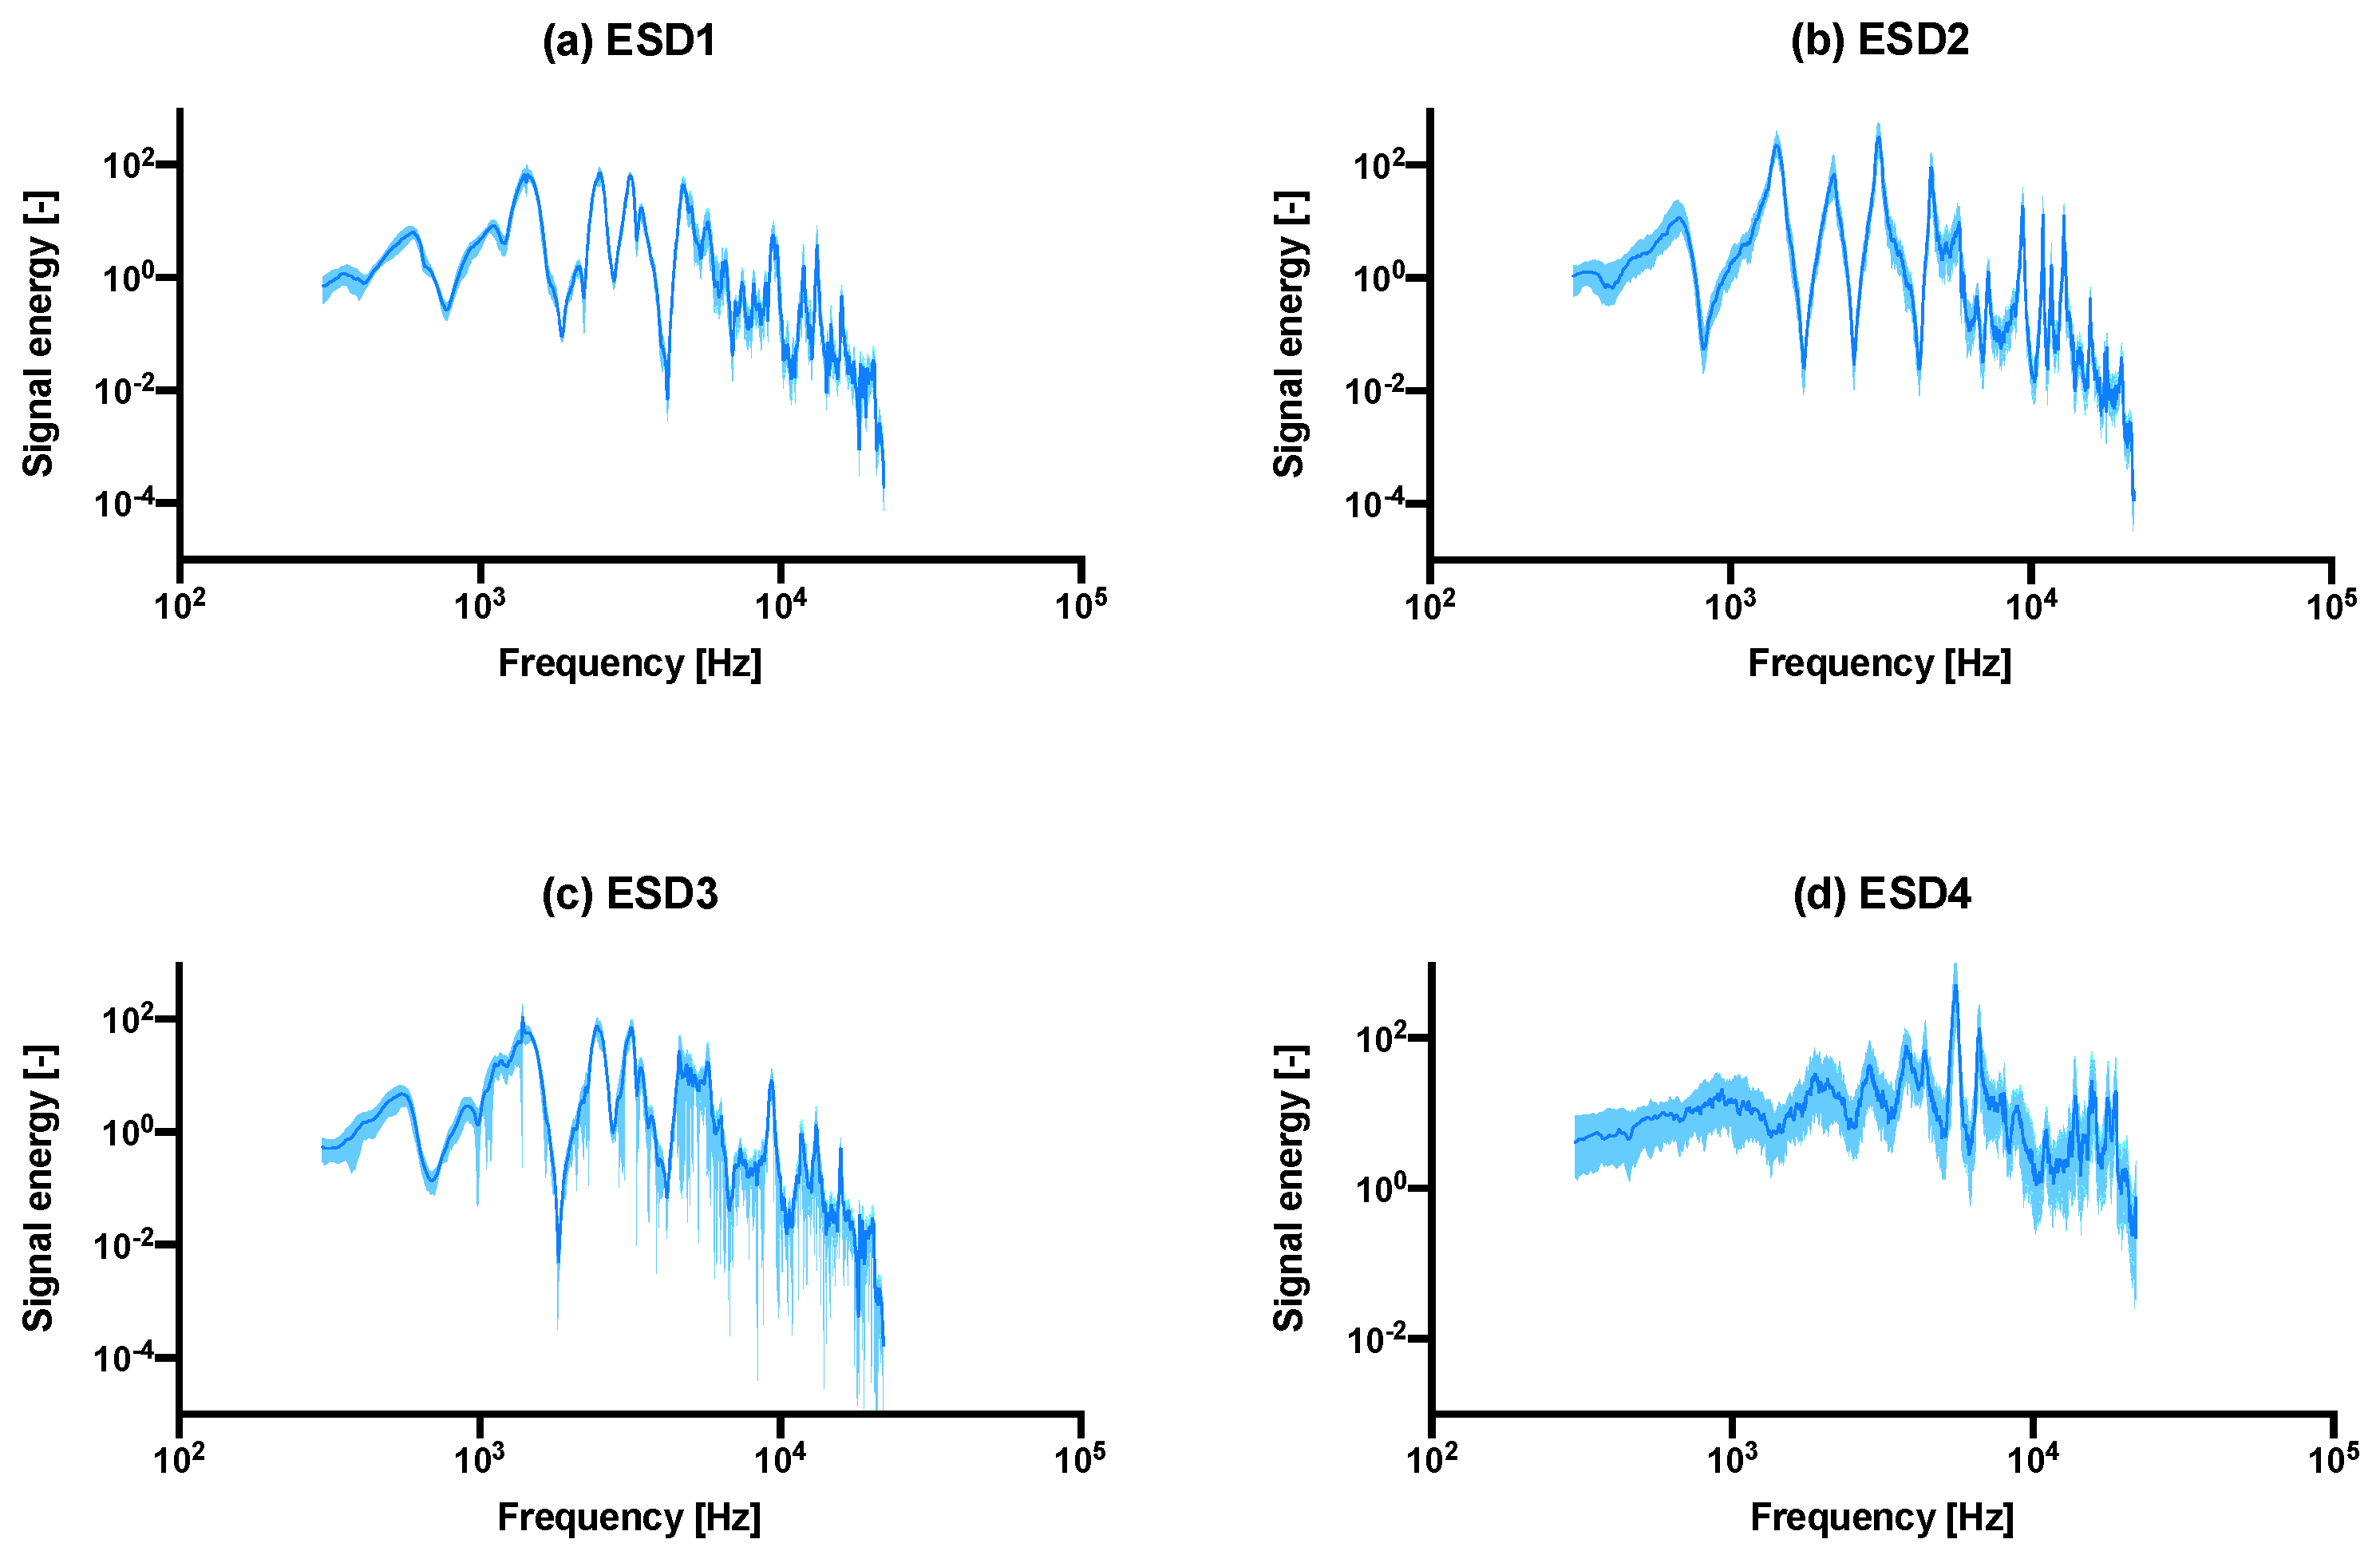
3.2. Energy Spectral Density
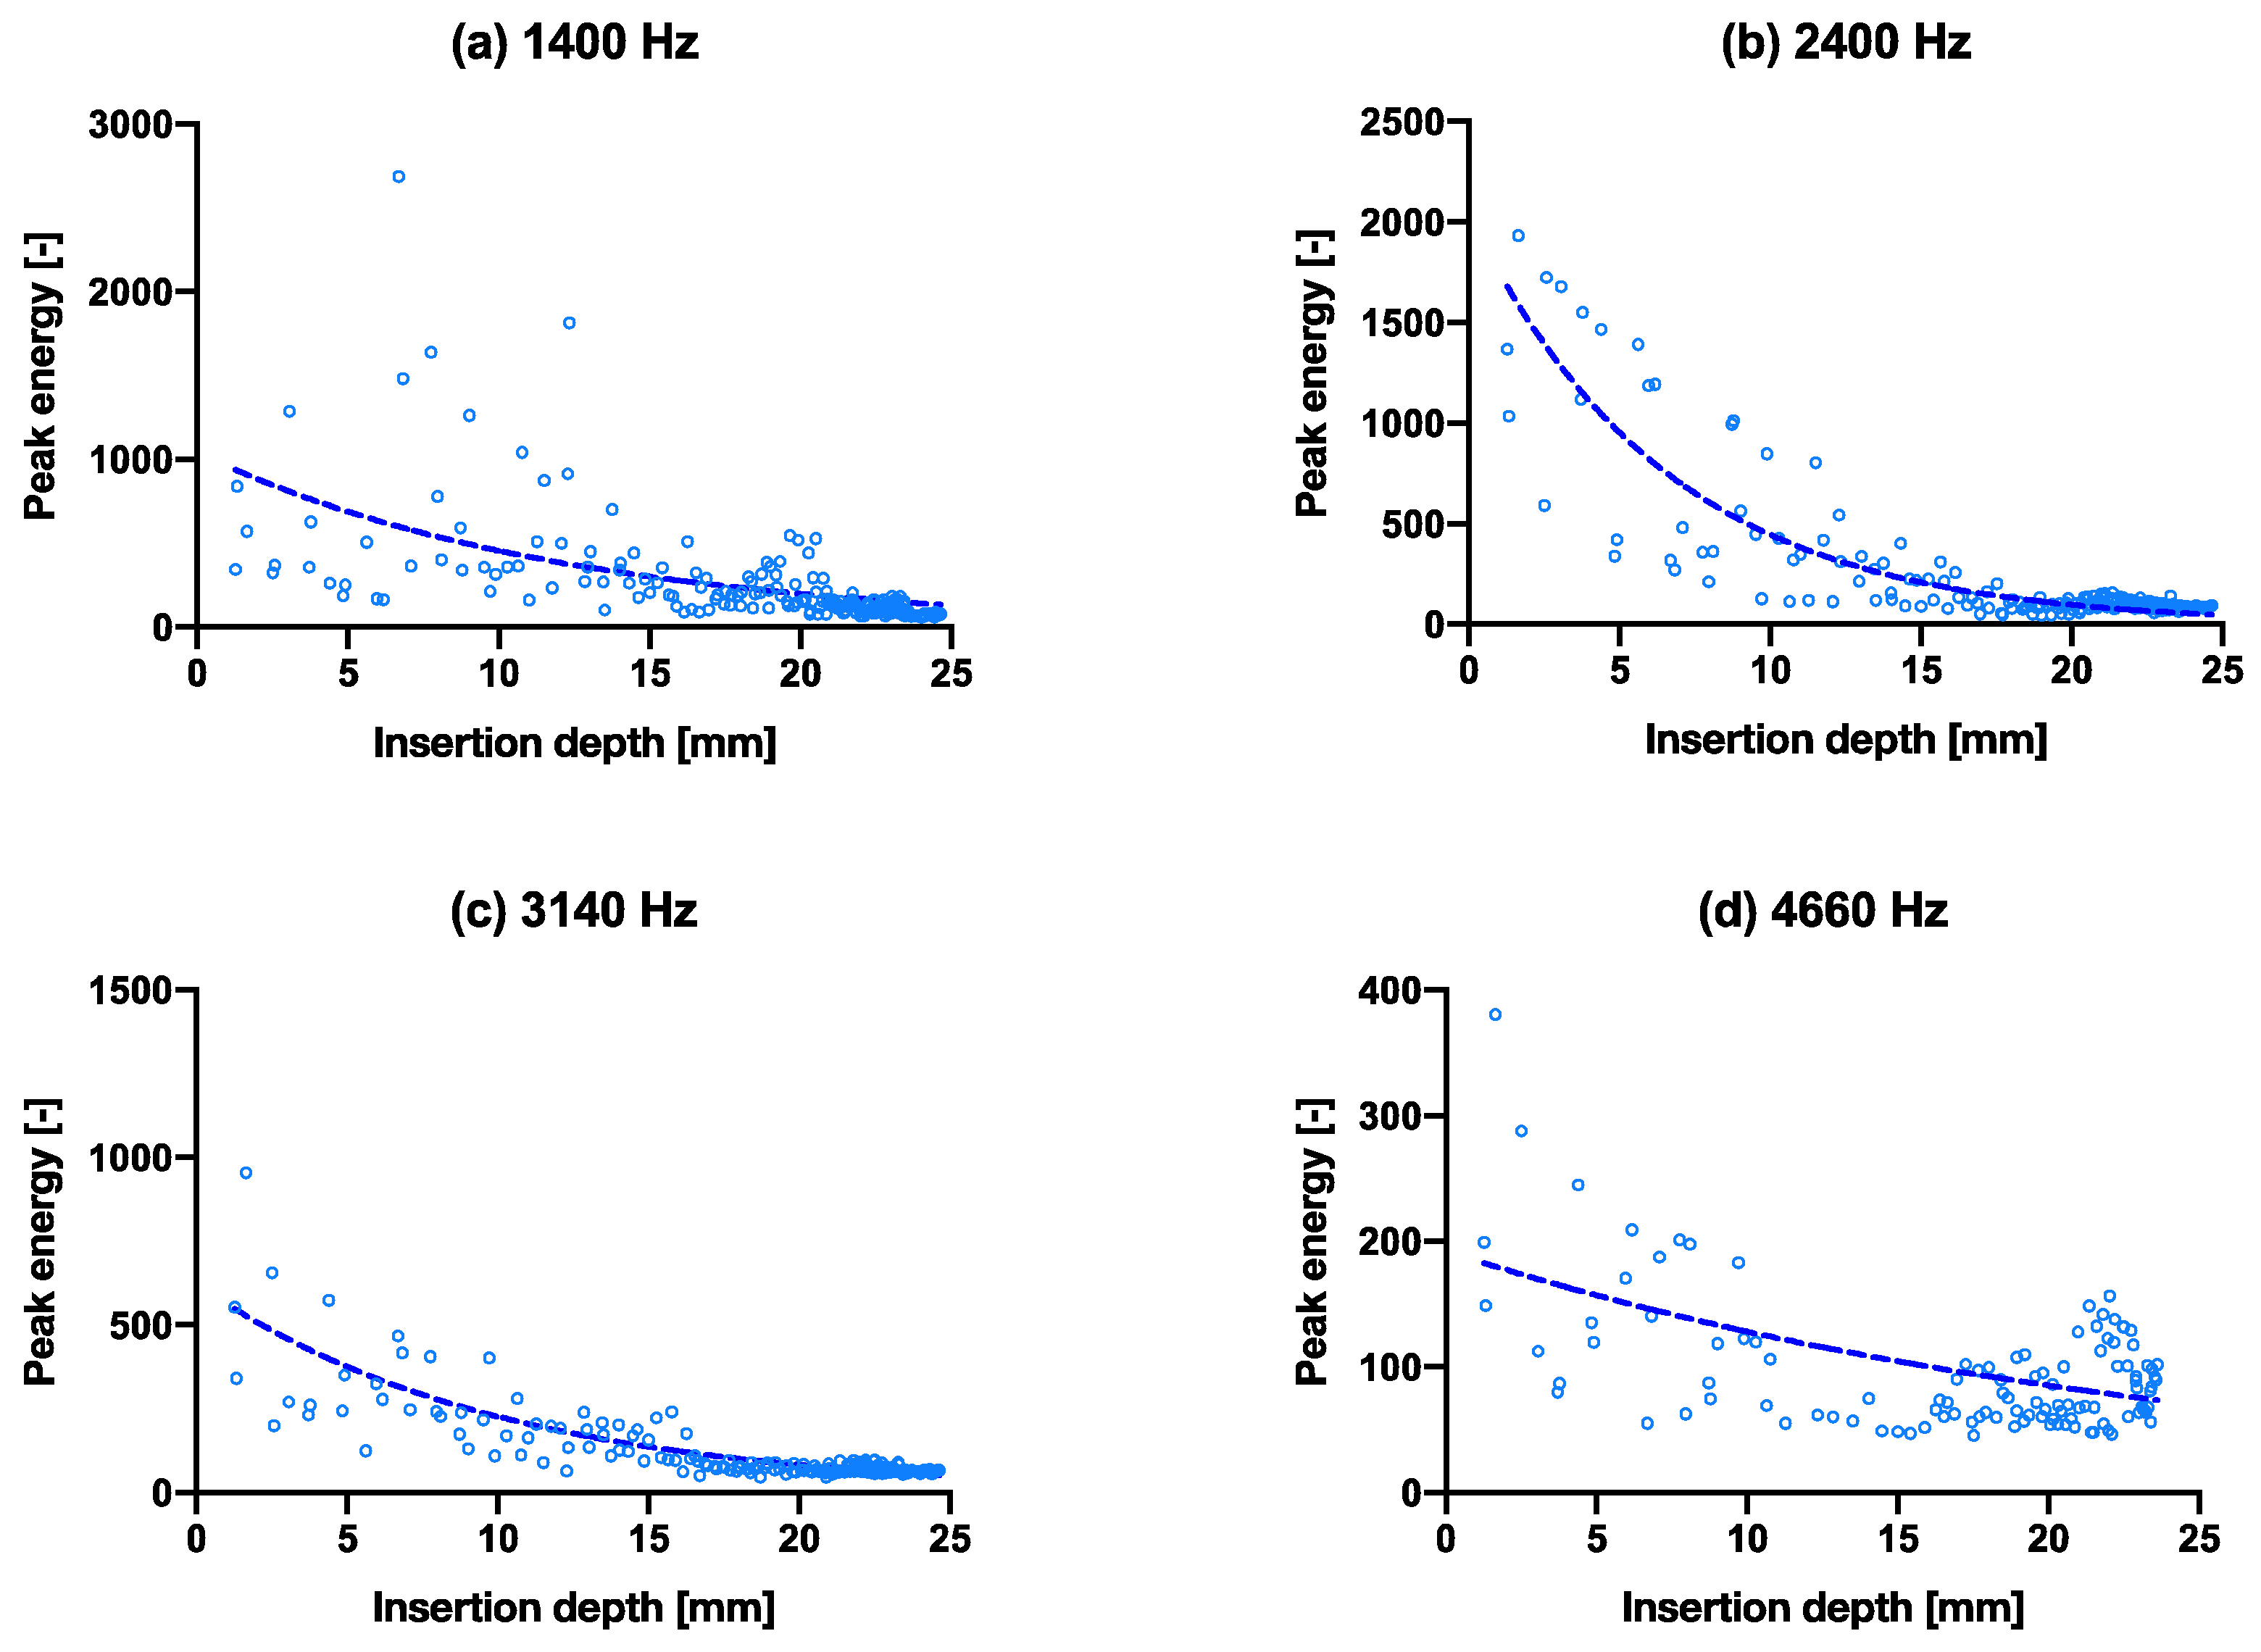
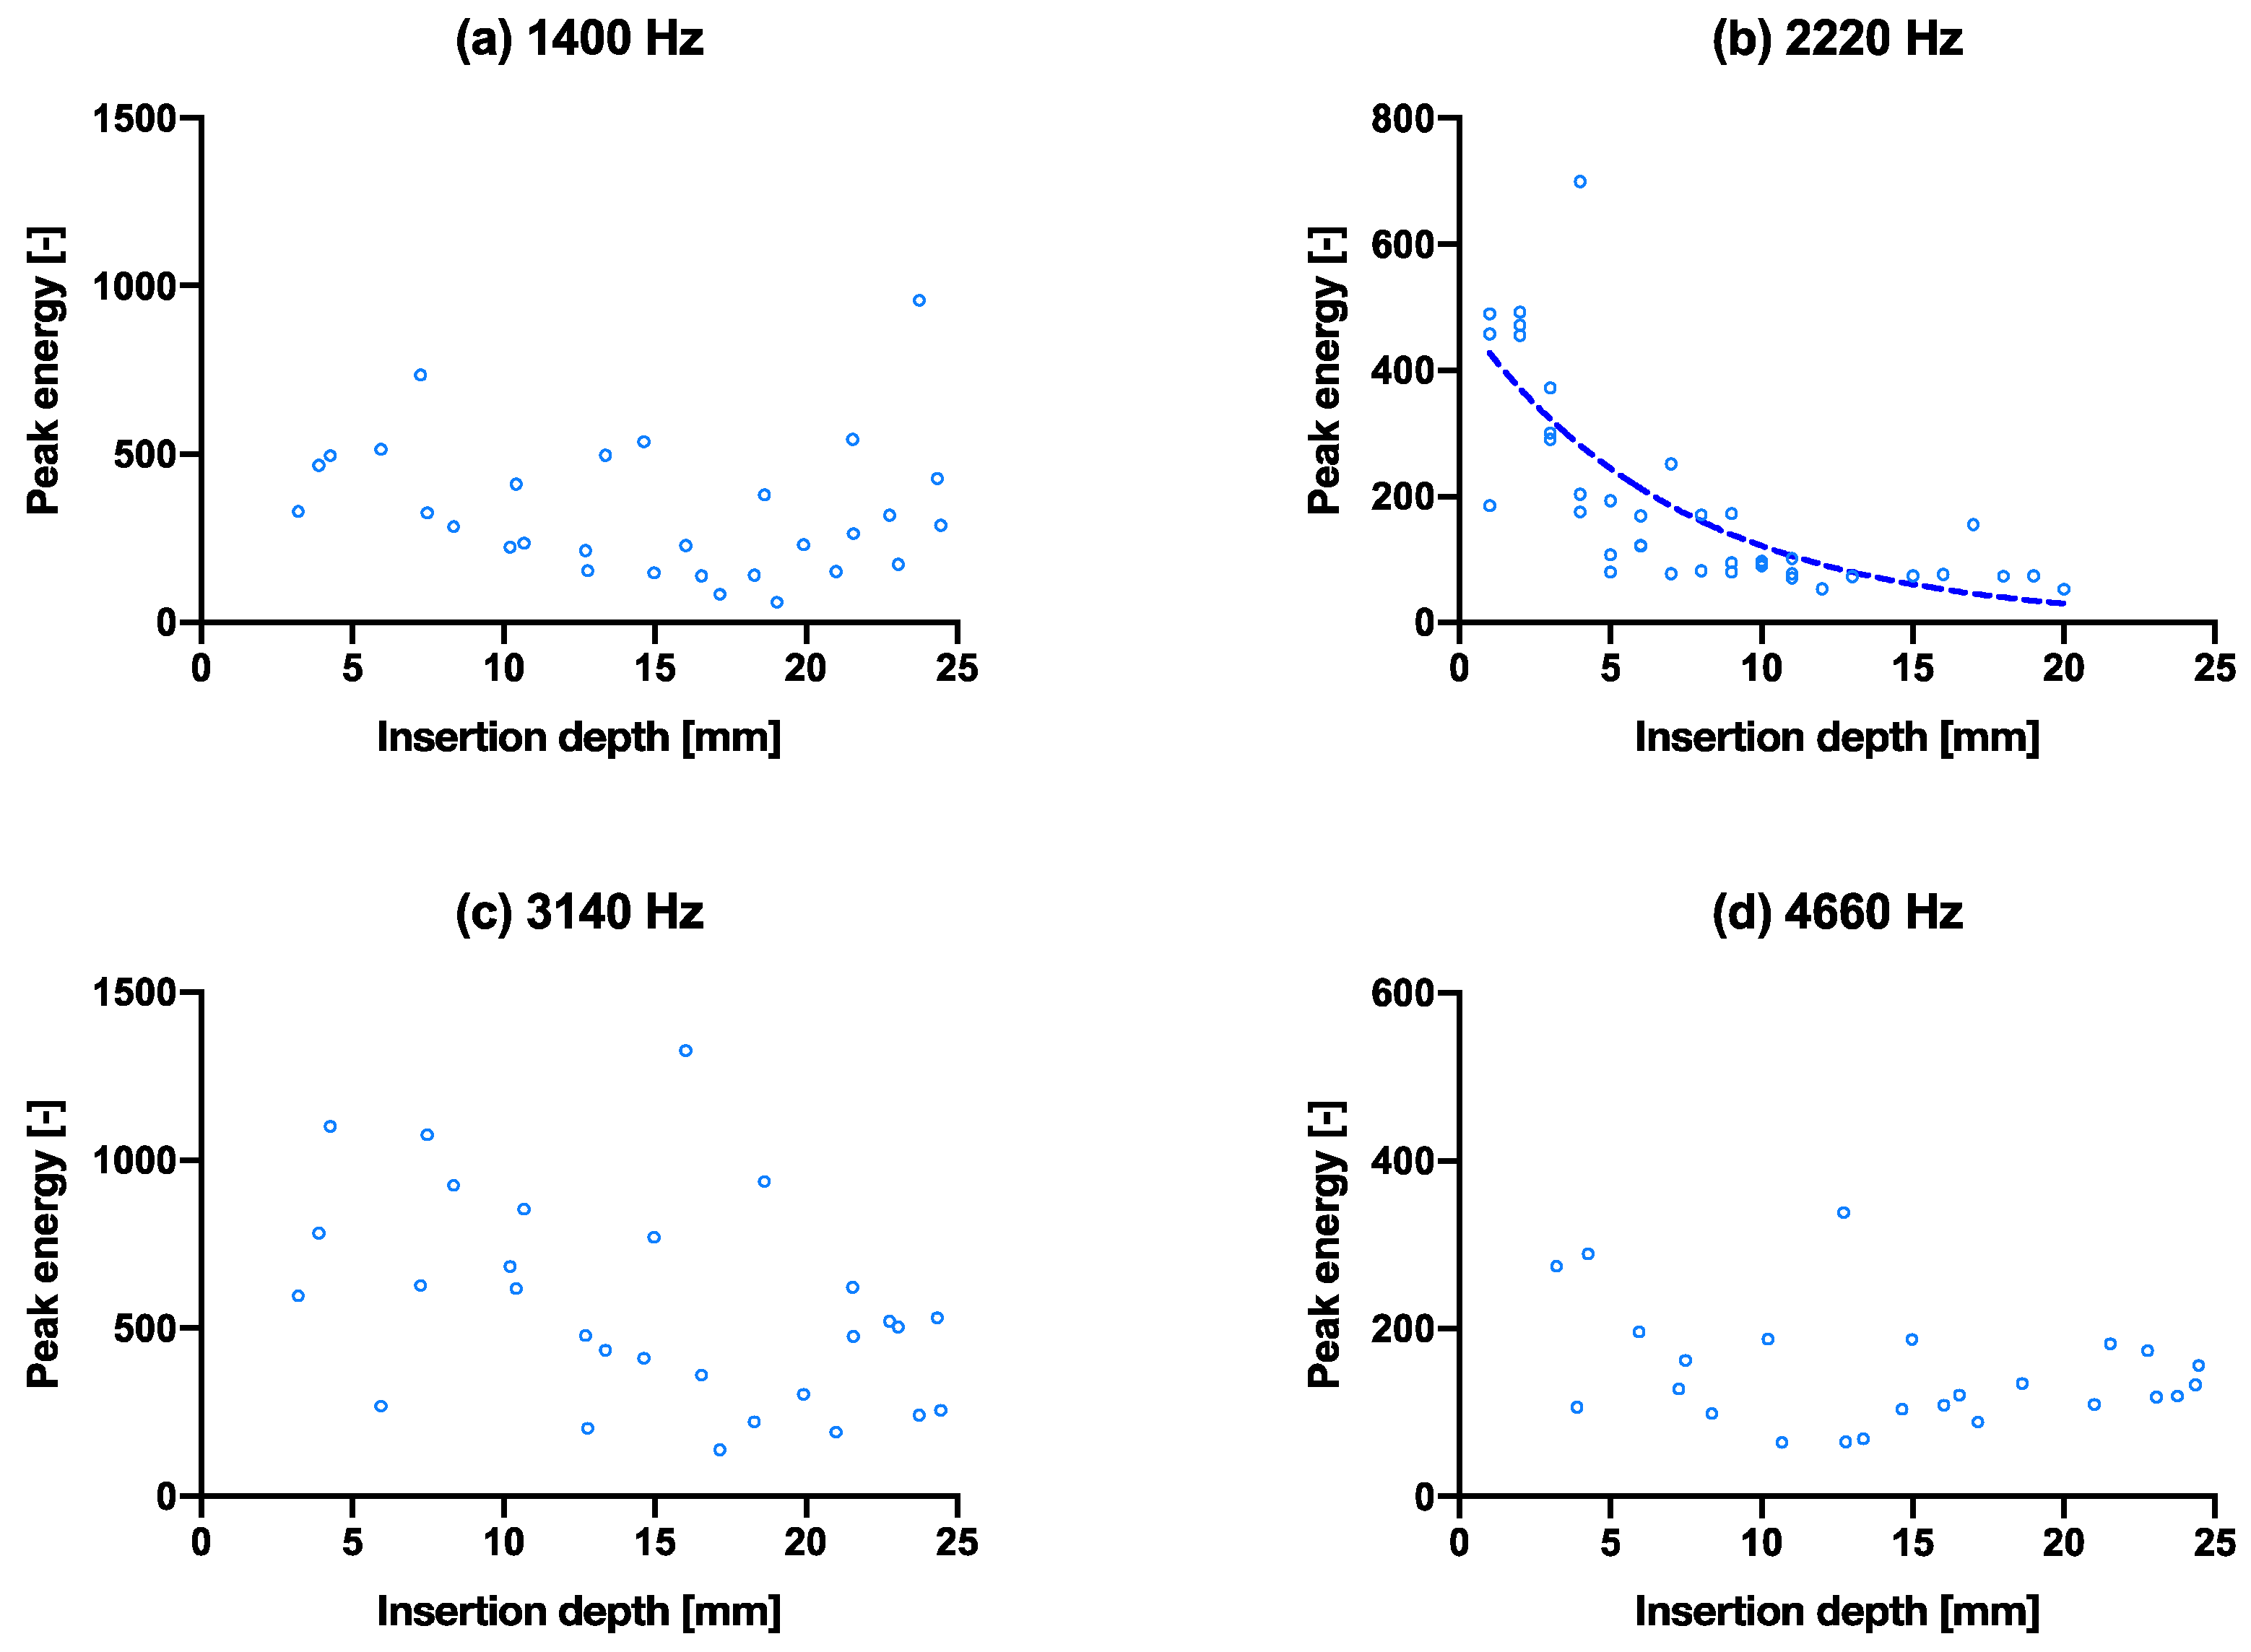
3.3. Insertion Experiment
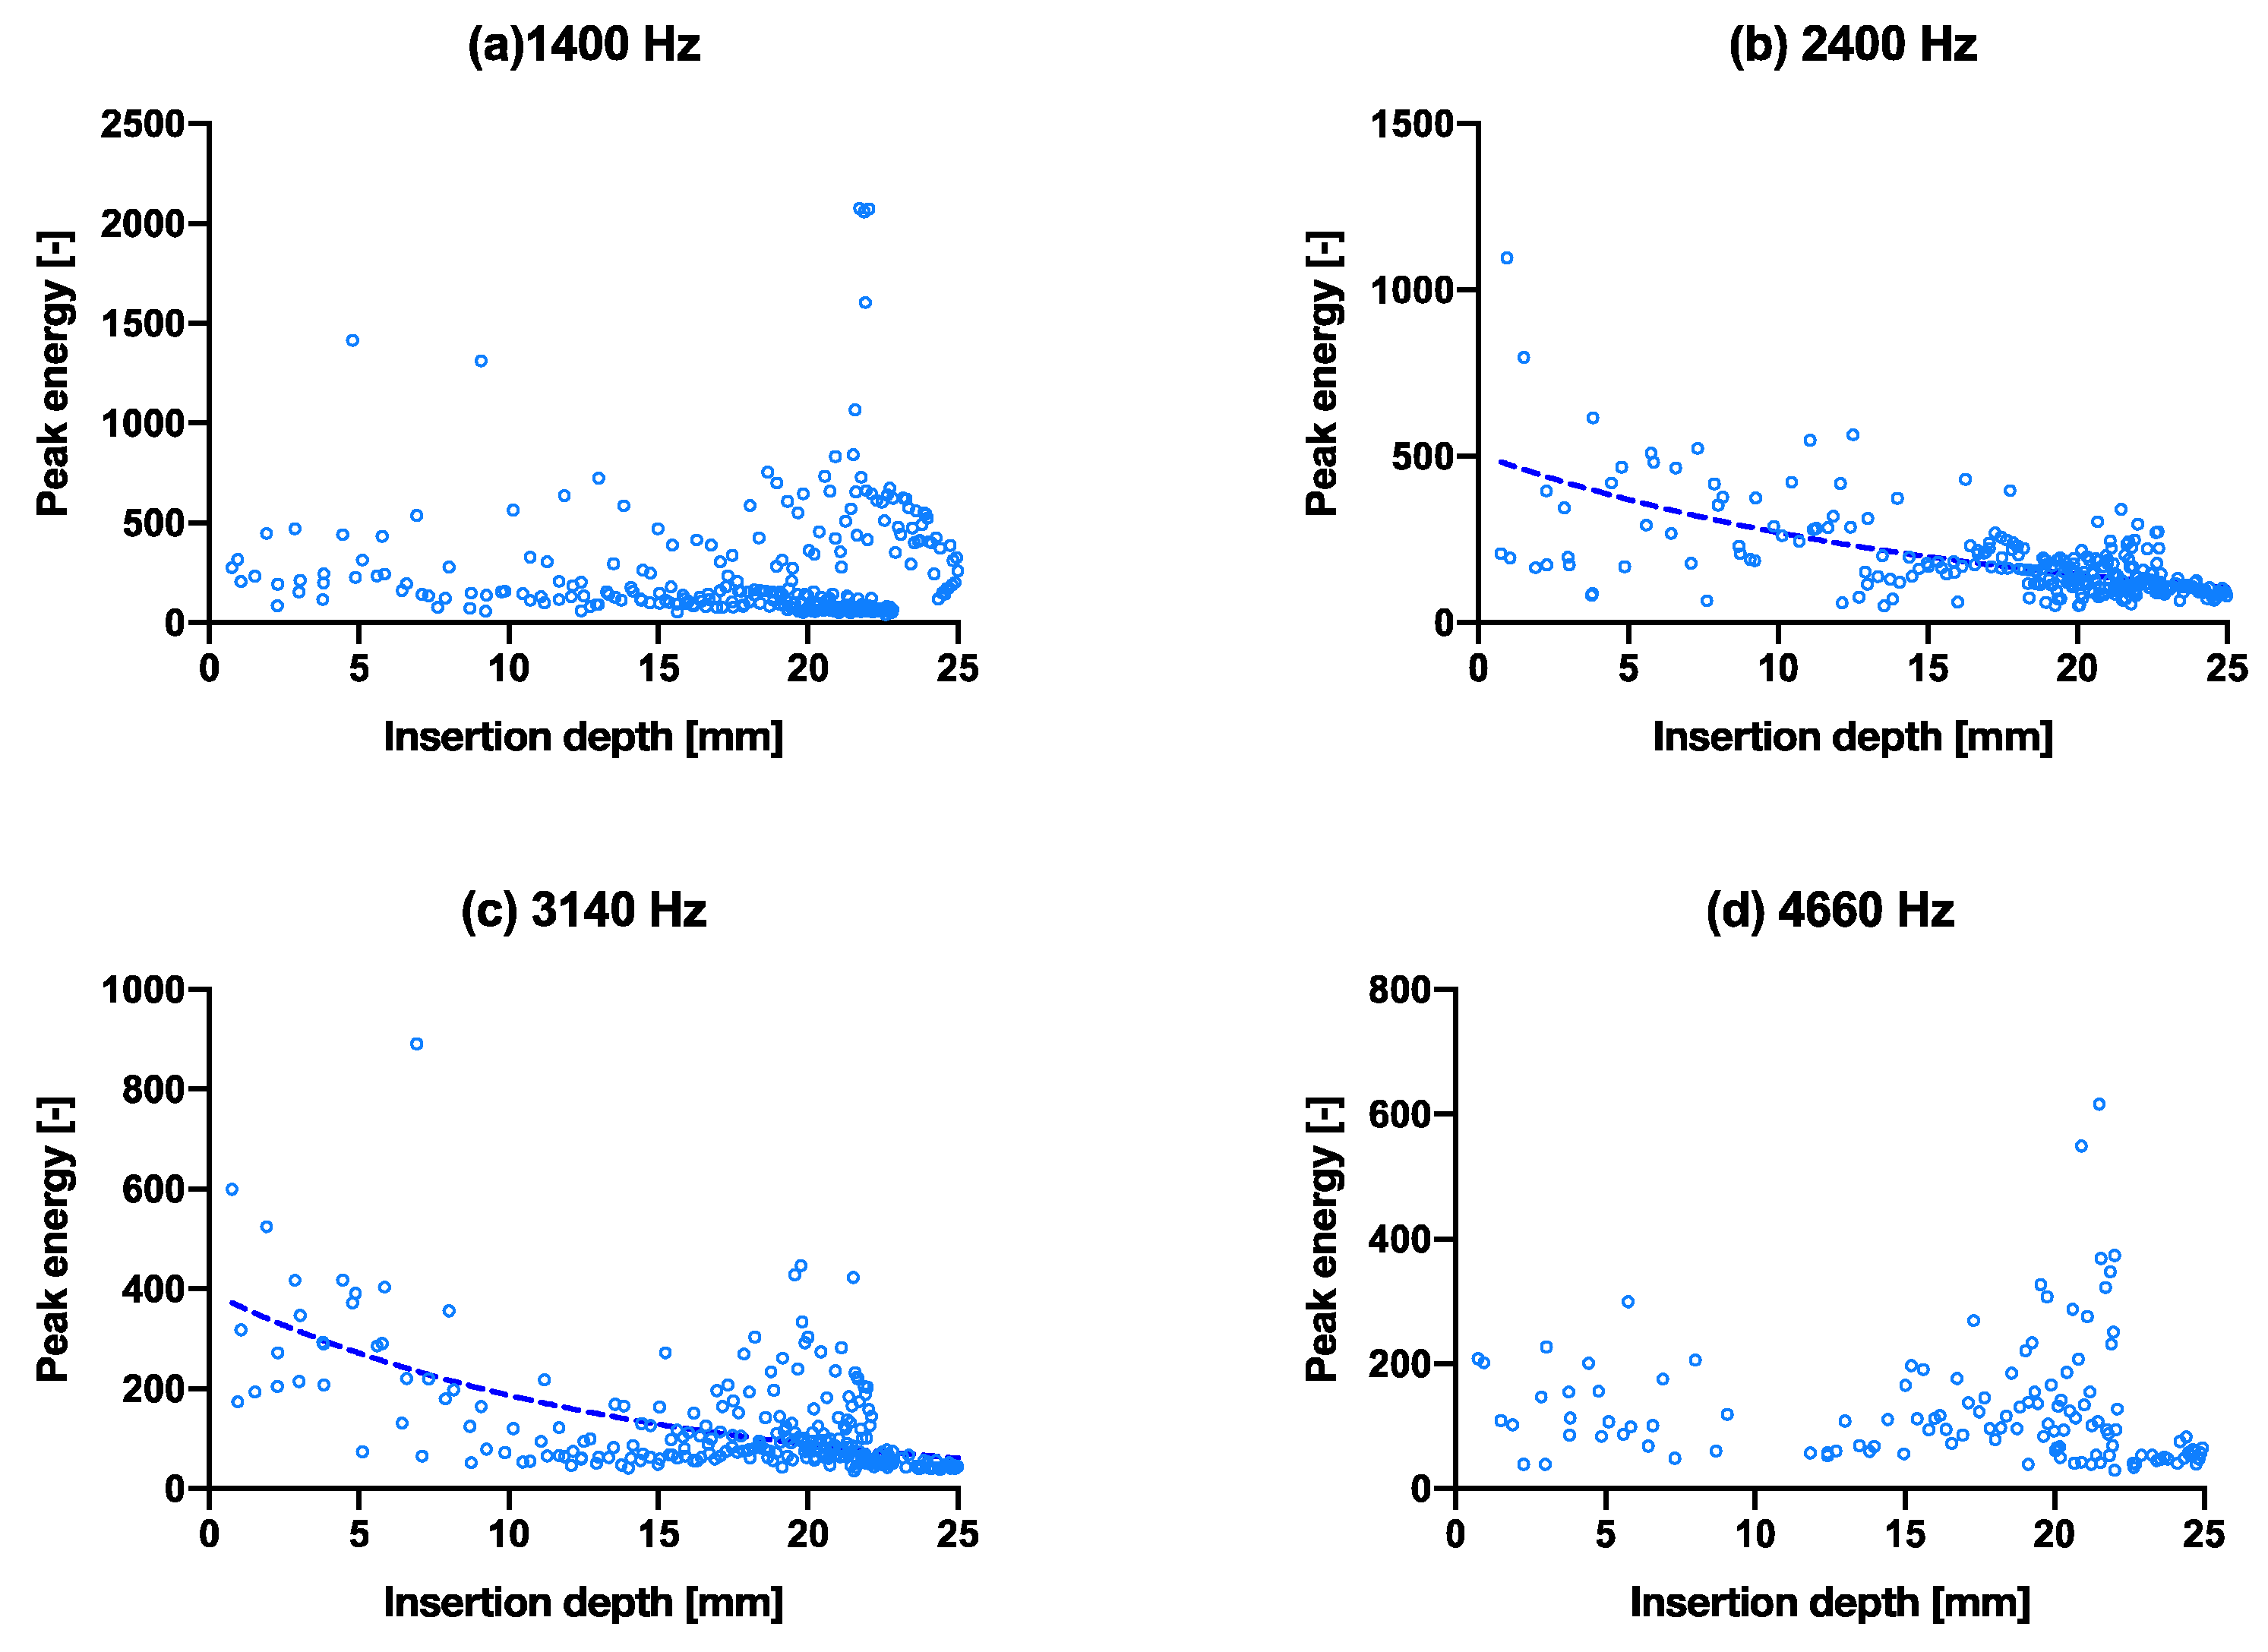
3.4. Fixation Experiment
3.5. Fixation Experiment
3.6. Cadaver Pilot Trial
4. Discussion
5. Conclusions
Supplementary Materials
Author Contributions
Funding
Institutional Review Board Statement
Informed Consent Statement
Data Availability Statement
Acknowledgments
Conflicts of Interest
References
- Landelijke Registratie Orthopedische Implantaten. Number of Registered Hip Arthroplasties Per Year of Surgery (2007–2018) in the Lroi in April 2019. Available online: http://www.lroi-rapportage.nl/2-magazines-op-home-2019-numbers-registered-procedures-2007-2018 (accessed on 4 February 2022).
- Monitoring Femoral Component Insertion in Cementless Total Hip Arthroplasty. Available online: http://citeseerx.ist.psu.edu/viewdoc/download?doi=10.1.1.506.6517&rep=rep1&type=pdf (accessed on 4 February 2022).
- Whitwell, G.; Brockett, C.L.; Young, S.; Stone, M.; Stewart, T.D. Spectral analysis of the sound produced during femoral broaching and implant insertion in uncemented total hip arthroplasty. Proc. Inst. Mech. Eng. Part H J. Eng. Med. 2013, 227, 175–180. [Google Scholar] [CrossRef] [PubMed]
- Pastrav, L.C.; Jaecques, S.V.N.; Jonkers, I.; Perre, G.V.D.; Mulier, M. In vivo evaluation of a vibration analysis technique for the per-operative monitoring of the fixation of hip prostheses. J. Orthop. Surg. Res. 2009, 4, 10. [Google Scholar] [CrossRef] [PubMed] [Green Version]
- Rashid, M.S.; Pullin, R. The sound of orthopaedic surgery—the application of acoustic emission technology in orthopaedic surgery: A review. Eur. J. Orthop. Surg. Traumatol. 2014, 24, 1–6. [Google Scholar] [CrossRef] [PubMed]
- Patrick, A.J.F.; Rodgers, G.W.; Hooper, G.J.; Woodfield, T.B. Development and validation of an acoustic emission device to measure wear in total hip replacements in-vitro and in-vivo. Biomed. Signal Processing Control. 2017, 33, 281–288. Available online: http://www.sciencedirect.com/science/article/pii/S1746809416302233 (accessed on 4 February 2022).
- Qi, G.; Mouchon, W.P.; Tan, T.E. How much can a vibrational diagnostic tool reveal in total hip arthroplasty loosening? Clin. Biomech. 2003, 18, 444–458. Available online: http://www.sciencedirect.com/science/article/pii/S0268003303000512 (accessed on 4 February 2022). [CrossRef]
- Oberst, S.; Baetz, J.; Campbell, G.; Lampe, F.; Lai, J.C.; Hoffmann, N.; Morlock, M. Vibro-acoustic and non-linear analysis of cadaveric femoral bone impaction in cavity preparations. Int. J. Mech. Sci. 2018, 144, 739–745. [Google Scholar] [CrossRef] [Green Version]
- Rodgers, G.W.; Welsh, R.; King, L.J.; Patrick, A.J.F.; Woodfield, T.B.; Hooper, G.J. Signal processing and event detection of hip implant acoustic emissions. Control Eng. Pract. 2017, 58, 287–297. [Google Scholar] [CrossRef]
- Pechon, P.H.M.; Pullin, R.; Eaton, M.J.; Jones, S.A.; Evans, S. Acoustic emission technology can warn of impending iatrogenic femur fracture during femoral canal preparation for uncemented hip replacement. a cadaveric animal bone study. J. Med. Eng. Technol. 2018, 42, 72–87. [Google Scholar] [CrossRef] [PubMed]
- Gueiral, N.; Nogueira, E. Recent Advances in Arthroplasty; InTechOpen: London, UK, 2011; Volume 8, pp. 131–146. [Google Scholar]
- Mavrogordato, M.; Taylor, M.; Taylor, A.; Browne, M. Realtime monitoring of progressive damage during loading of a simplified total hip stem construct using embedded acoustic emission sensors. Med. Eng. Phys. 2011, 33, 395–406. [Google Scholar] [CrossRef] [PubMed]
- Mulier, M.; Pastrav, C.; van der Perre, G. Per-operative vibration analysis: A valuable tool for defining correct stem insertion: Preliminary report. Ortop. Traumatol. Rehabil. 2008, 10, 576–582. [Google Scholar] [PubMed]
- Shibanuma, N.; Hata, Y.; Nishiyama, T.; Fujishiro, T.; Tateishi, H.; Kurosaka, M. Determination of total hip arthroplasty stem stability by intraoperative measurement using an acoustic testing technique. In Proceedings of the 54th Annual Meeting of the Orthopaedic Research Society, San Francisco, CA, USA, 2–5 March 2008; p. 1842. [Google Scholar]
- Poudrel, A.; Lomami, H.; Rosi, G.; Dubory, A.; Flouzat-Lachaniette, C.; Haiat, G. Estimation of Cementless Femoral Stem Stability Using an Impact Hammer. Available online: https://hal.inria.fr/hal-03235369 (accessed on 19 January 2022).
- Leuridan, S.; Goossens, Q.; Pastrav, L.; Mulier, M.; Desmet, W.; Vander Sloten, J.; Denis, K. Development of an Instrument to Assess the Stability of Cementless Femoral Implants Using Vibration Analysis During Total Hip Arthroplasty. IEEE J. Transl. Eng. Health Med. 2021, 9, 1–10. [Google Scholar] [CrossRef]
- Michel, A.; Bosc, R.; Meningaud, J.; Hernigou, P.; Haiat, G. Assessing the Acetabular Cup Implant Primary Stability by Impact Analyses: A Cadaveric Study. PLoS ONE 2016, 11, e0166778. [Google Scholar] [CrossRef] [Green Version]
- Goossens, Q.; Leuridan, S.; Henyš, P.; Roosen, J.; Pastrav, L.; Mulier, M.; Desmet, W.; Denis, K.; Vander Sloten, J. Development of an acoustic measurement protocol to monitor acetabular implant fixation in cementless total hip Arthroplasty: A preliminary study. Med. Eng. Phys. 2017, 49, 28–38. [Google Scholar] [CrossRef]
- Goossens, Q.; Pastrav, L.; Roosen, J.; Mulier, M.; Desmet, W.; Vander Sloten, J.; Denis, K. Acoustic analysis to monitor implant seating and early detect fractures in cementless THA: An in vivo study. J. Orthop. Res. 2020, 39, 1164–1173. [Google Scholar] [CrossRef]
- Morohashi, I.; Iwase, H.; Kanda, A.; Sato, T.; Homma, Y.; Mogami, A.; Obayashi, O.; Kaneko, K. Acoustic pattern evaluation during cementless hip arthroplasty surgery may be a new method for predicting complications. SICOTJ 2017, 3, 13. [Google Scholar] [CrossRef] [Green Version]
- Kutz, M. Standard Handbook of Biomedical Engineering and Design; McGraw-Hill: New York, NY, USA, 2003; pp. 15.1–15.22. [Google Scholar]
- Crisman, A.; Yoder, N.; McCuskey, M.; Meneghini, R.; Cornwell, P. Femoral Component Insertion Monitoring Using Human Cadaveric Specimens. Conference Proceedings of the Society for Experimental Mechanics Series, 01. 2007. Available online: https://citeseerx.ist.psu.edu/viewdoc/download?doi=10.1.1.529.3840&rep=rep1&type=pdf (accessed on 4 February 2022).
- Purves, D.; Augustine, G.J.; Fitzpatrick, D.; Katz, L.; LaMantia, A.-S.; McNamara, J.; Mark Williams, S. (Eds.) The Audible Spectrum. In Neuroscience, 2nd ed.; Sinauer Associates: Sunderland, MA, USA, 2001. Available online: https://www.ncbi.nlm.nih.gov/books/NBK10924 (accessed on 4 February 2022).
- O’Connor, J.; Borges, L.; Duda, F.; da Cruz, A. Growth and reabsorption in biological tissues. In Proceedings of the XXXVI Ibero-Latin American Congress on Computational Methods in Engineering (cilamce2015), Rio de Janiero, Brazil, 21–25 November 2015. [Google Scholar]
- CES EduPack Software. Available online: https://www.ansys.com/products/materials/granta-edupack (accessed on 4 February 2022).
- Eigenfrequency Analysis. Available online: https://www.comsol.com/multiphysics/eigenfrequency-analysis (accessed on 4 February 2022).
- Blevins, R.D. Natural Frequency of Beams. In Formulas for Dynamics, Acoustics and Vibration; Blevins, R.D., Ed.; John Wiley & Sons: Hoboken, NJ, USA, 2015. [Google Scholar] [CrossRef]
- Actis Surgical Technique. Available online: http://synthes.vo.llnwd.net/o16/LLNWMB8/US%20Mobile/Synthes%20North%20America/Product%20Support%20Materials/Technique%20Guides/Actis%20Surgical%20Technique%20March%202018.pdf (accessed on 4 February 2022).
- Mosekilde, L. Sex Differences in Age-Related Loss of Vertebral Trabecular Bone Mass and Structure—Biomechanical Consequences. Bone 1989, 10, 425–432. Available online: http://www.sciencedirect.com/science/article/pii/8756328289900744 (accessed on 4 February 2022). [CrossRef]
- Childers, C.P.; Maggard-Gibbons, M. Understanding costs of care in the operating room. JAMA Surg. 2018, 153, e176233. [Google Scholar] [CrossRef]

| Mode i | ωs,x,i (Hz) | ωs,y,i (Hz) | ωe,x,i (Hz) | ωe,y,i (Hz) |
|---|---|---|---|---|
| 1 | 241 | 902 | 279 | 105 |
| 2 | 2170 | 8120 | 2510 | 9420 |
| 3 | 6010 | 22,600 | 6980 | 26,200 |
| 4 | 11,800 | 44,200 | 13,700 | 51,300 |
| Nonlinear Regression | Peak Energy | |||
|---|---|---|---|---|
| Figure | 4a | 4b | 4c | 4d |
| Exp. eqn. best-fit values | ||||
| R2 | 0.3103 | 0.7783 | 0.6959 | 0.2554 |
| Figure | 5a | 5b | 5c | 5d |
| Exp. eqn. best-fit values | ||||
| R2 | 0.1199 | 0.5147 | 0.1979 | 0.1682 |
| Figure | 6a | 6b | 6c | 6d |
| Exp. eqn. best-fit values | ||||
| R2 | 0.0001 | 0.4357 | 0.3550 | 0.0201 |
| (a) F. Peak 1 | (a) F. Peak 2 | (a) F. Peak 3 | (a) F. Peak 4 | (b) F. Peak 1 | (b) F. Peak 2 | (b) F. Peak 3 | (b) F. Peak 4 | |
|---|---|---|---|---|---|---|---|---|
| R2 | 0.002108 | 0.05928 | 0.09989 | 0.1856 | 0.04461 | 0.008432 | 0.1517 | 0.1351 |
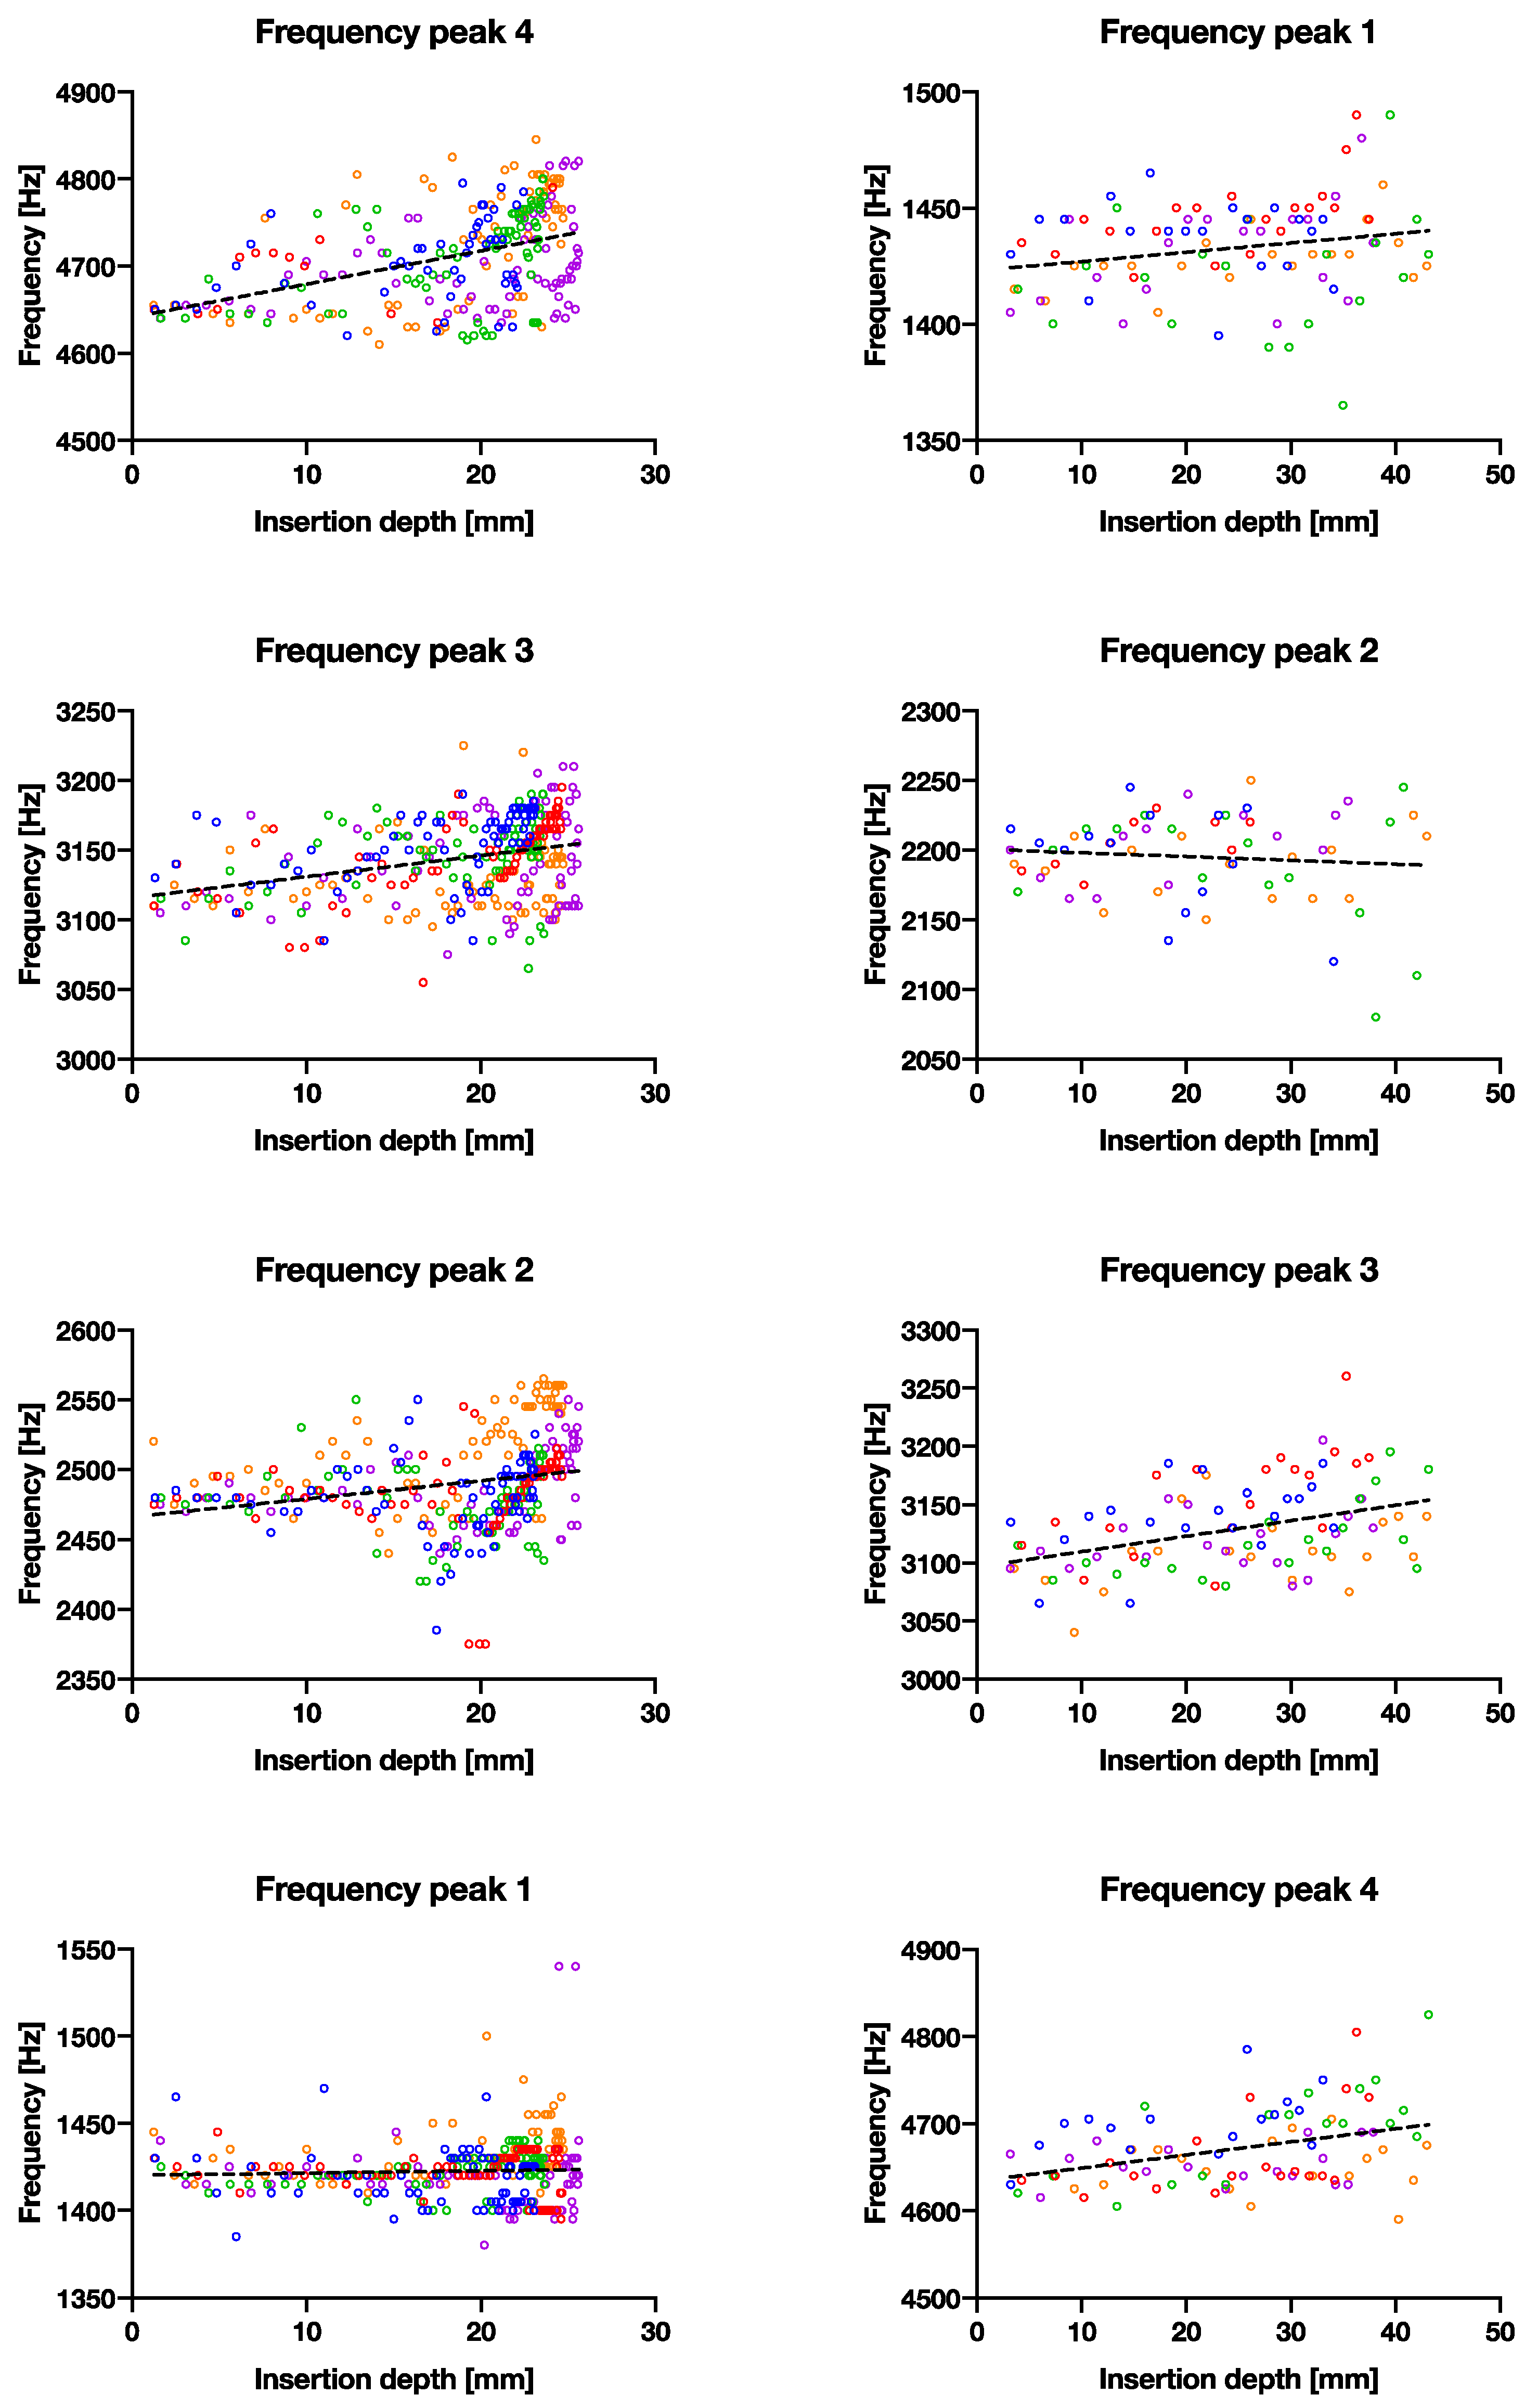
| p value | 0.3925 | <0.0001 | <0.0001 | <0.0001 | 0.0359 | 0.453 | <0.0001 | 0.0004 |
| Deviation from zero? | NS | **** | **** | **** | * | NS | **** | *** |
| Equation | Y = 0.1314X + 1420 | Y = 1.273X + 2466 | Y = 1.519X + 3116 | Y = 3.812X + 4641 | Y = 0.3982X + 1423 | Y = −0.2705X + 2201 | Y = 1.331X + 3096 | Y = 1.500X + 4634 |
| Bone Model Insertion Experiment | Cadaver Trial | |
|---|---|---|
| Hammer blows | 50 | 59 |
| Insertion depth [mm] | 23 | 20 |
| Energy per blow [J] | 0.24 | 1.75 |
| Cumulative energy [J] | 12 | 103.25 |
| Energy needed to advance broach [J/mm] | 0.52 | 5.16 |
Publisher’s Note: MDPI stays neutral with regard to jurisdictional claims in published maps and institutional affiliations. |
© 2022 by the authors. Licensee MDPI, Basel, Switzerland. This article is an open access article distributed under the terms and conditions of the Creative Commons Attribution (CC BY) license (https://creativecommons.org/licenses/by/4.0/).
Share and Cite
Wei, J.C.J.; Crezee, W.H.A.; Jongeneel, H.; De Haas, T.S.A.; Kool, W.L.A.; Blaauw, B.J.; Dankelman, J.; Horeman, T. Using Acoustic Vibrations as a Method for Implant Insertion Assessment in Total Hip Arthroplasty. Sensors 2022, 22, 1609. https://doi.org/10.3390/s22041609
Wei JCJ, Crezee WHA, Jongeneel H, De Haas TSA, Kool WLA, Blaauw BJ, Dankelman J, Horeman T. Using Acoustic Vibrations as a Method for Implant Insertion Assessment in Total Hip Arthroplasty. Sensors. 2022; 22(4):1609. https://doi.org/10.3390/s22041609
Chicago/Turabian StyleWei, Jonathan C. J., Willem H. A. Crezee, Hilda Jongeneel, Tobias S. A. De Haas, Wesley L. A. Kool, Bryan J. Blaauw, Jenny Dankelman, and Tim Horeman. 2022. "Using Acoustic Vibrations as a Method for Implant Insertion Assessment in Total Hip Arthroplasty" Sensors 22, no. 4: 1609. https://doi.org/10.3390/s22041609
APA StyleWei, J. C. J., Crezee, W. H. A., Jongeneel, H., De Haas, T. S. A., Kool, W. L. A., Blaauw, B. J., Dankelman, J., & Horeman, T. (2022). Using Acoustic Vibrations as a Method for Implant Insertion Assessment in Total Hip Arthroplasty. Sensors, 22(4), 1609. https://doi.org/10.3390/s22041609