Abstract
This article presents two procedures involving a maximal hyperconnected function and a hyperconnected lower leveling to segment the brain in a magnetic resonance imaging T1 weighted using new openings on a max-tree structure. The openings are hyperconnected and are viscous transformations. The first procedure considers finding the higher hyperconnected maximum by using an increasing criterion that plays a central role during segmentation. The second procedure utilizes hyperconnected lower leveling, which acts as a marker, controlling the reconstruction process into the mask. As a result, the proposal allows an efficient segmentation of the brain to be obtained. In total, 38 magnetic resonance T1-weighted images obtained from the Internet Brain Segmentation Repository are segmented. The Jaccard and Dice indices are computed, compared, and validated with the efficiency of the Brain Extraction Tool software and other algorithms provided in the literature.
1. Introduction
Magnetic resonance imaging (MRI) allows the noninvasive assessment of the patient, and it is useful for early diagnosis, medical monitoring, and the detection of many diseases, such as Alzheimer’s disease, brain aneurysm, brain tumor, and melanoma of the eye [1]. However, there are many applications related to brain imaging that require accurate brain segmentation to separate the skull, scalp, dura, eyes, etc. This procedure is known as skull stripping [2,3]. Several applications of brain segmentation include brain volume estimation [4], image registration [5], automatic tumor detection [6], the first state in cortical flattening procedures [7], and structural studies [8,9,10].
Algorithms for skull stripping can be placed into six broad categories mentioned in the literature [1,11]. The categories include: mathematical morphology, pixel intensity analysis, deformable surfaces, brain atlas, hybrid approaches, and deep learning focus.
Furthermore, there are several software programs designed to complete the skull-stripping task. One of the most widely used software programs is BET (Brain Extraction Tool) [12], which quickly processes complete volumes of images. BET evolves a tessellated mesh of triangles to fit the brain’s surface. However, the resulting crude “skull” image contains a relatively large number of false negatives and positives [13]. Considering the disadvantage mentioned above, BET2 is presented as a new software version, an automated tool for extracting mesh surfaces of the brain, the inner and outer skull, and the scalp from an MRI. Ideally, it requires both T1- and T2-weighted anatomical MRIs, each of a <2 mm resolution in each direction. Another BET improvement is presented in [14], where the authors proposed a faster convergence of the algorithm since they enhanced the vertex displacement, added a new search path, and embedded an independent surface reconstruction process. Other popular algorithms used to separate the skull are the following [15]: BSE (Brain Surface Extractor), SPM2 (Statistical Parametric Mapping v2), McStrip (Minneapolis Consensus Strip), ROBEX (robust brain extraction), and TMBE (Threshold Morphologic Brain Extraction). In [16], the authors used the Richardson–Lucy deconvolution, obtaining high-quality results. However, CoLoRS (coherent local intensity rough segmentation) is a new algorithm to segment an MRI that considers intensity inhomogeneity or bias fields presented in MR volumes [17]. The algorithm is based on clustering and a rough sets theory for simultaneous segmentation and bias field correction of brain MR volumes. The clustering technique allows separating or segmenting components in an image, where statistics are used to group and classify considering texture, color, and form factor, among others. In [18], researchers obtained brain tissue using graph theory, supervoxels, and filtering. In [19], the authors explain the evolution of computational methods in human brain connectivity from 1990 to the present, focusing on graph theory. Graph theory has become a powerful approach for brain imaging analysis, mainly because of its potential to study dynamic behavior over time and disease-related brain changes [20]. In using graph theory, the first step in creating brain graphs is to define the nodes and edges connecting them. It is worth mentioning that connectivity is a powerful concept because the processed images under this notion preserve the contours, avoiding the creation of new maxima or minima.
This paper provides two new openings and introduces two procedures for separating the brain in the MRI T1. Regardless of the method used to separate the skull and nonbrain tissue in an MRI, it is necessary to compare the resultant segmentation to evaluate the performance of the proposed method. The Jaccard and Dice [21,22] indices will be used to compare the resulting segmentations.
The proposals use hyperconnectivity [23], the max-tree [24], viscous transformations [25], and lower levelings [26]. To introduce morphological transformations, Section 2 provides some notions of morphological filtering, connectivity, and hyperconnectivity. Such concepts are explained in detail, and several images illustrate how they operate practically. Section 3 gives the mathematical formalism of the openings defined under the hyperconnectivity. The proposals given in this section are also explained widely to follow the ideas related to mathematical morphology. Section 3.1 shows the criterion based on the maxima of the image to detect the maximum hyperconnectivity, and Section 3.2 formalizes the use of lower leveling applied from the higher extreme. Section 4 illustrates the application of hyperconnected viscous transformations, which allow the skull stripping of the 38 MRI T1 images provided by the IBSR [27]. Once the brain is segmented, the indices of Jaccard and Dice [21,22] are computed and compared with the information obtained from the current literature. Section 5 corresponds to the conclusions.
2. Some Basic Concepts of Morphological Filtering and Connections
2.1. Basic Notions of Morphological Filtering
Figure 1 shows the elementary structuring element in 3D containing its origin used in this study. denotes the transposed set with respect to its origin, and is a homothetic parameter. The morphological opening, closing, erosion, and dilation transformations are expressed as, , , , and , respectively [28]. Furthermore, the opening and closing by reconstruction propagate a marker to filter components by size without introducing new contours [29], where represents the reconstruction transformation.
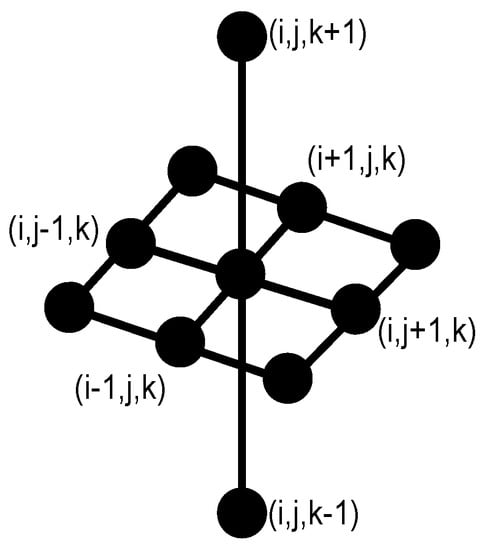
Figure 1.
Three-dimensional structuring element B with 11 neighbors. This configuration allows processing 11 pixels into 3 slices. The nine points are taken from the central image, and the two points remaining take information from neighbor images.
2.2. Connectivity
One of the most interesting concepts proposed in mathematical morphology is the connected class introduced by Serra [30]. The transformations defined under specific connectivity do not modify the shapes during the processing, and fused regions preserve the contours of the original image. The connected opening is used in practice to separate each one of the components. Figure 2 clarifies this concept.
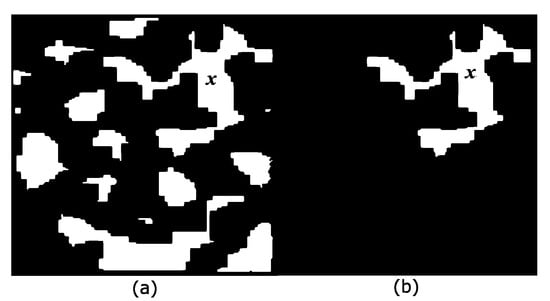
Figure 2.
Punctual opening. (a) Original image X and the marker x; (b) The punctual opening extracts the component where marker x is located.
2.3. Viscous Opening
Serra proposed a connection class on the space generated by dilated [31]. The viscous opening belongs to this class and discovers the connected components eroding the image. This transformation is expressed as follows:
The number of connected components depends on the viscosity parameter . Figure 3a displays the original image composed of three arcwise-connected components or three components at viscosity . Figure 3b–e show the eroded images using disks of sizes 20, 22, 27, and 36. Then, at viscosity = 20, there are 4 connected components, whereas, at viscosity = 22, the image has 5 connected components, as exemplified in Figure 3b,c. The image in Figure 3f presents the connected components for viscosity . However, by considering disks as the elementary shapes of the image, it is not possible to detect six connected components for any viscosity. The solution to this problem is to select the connected components at different viscosities (scales), and one option is the traditional algorithm known as ultimate erosion. This consists of choosing the connected components at a specific viscosity , such that the viscosity will remove them. Another method to select the connected components is to compute the distance function, as shown in Figure 3g, and detect their maxima. The image in Figure 3h contains the ultimate eroded components for viscosities (sizes), and 68. Figure 3i illustrates the connected components in the viscous lattice sense. Viscous connectivity is interesting because it exploits the goal in binary image segmentation, which consists of splitting the connected components into a set of elementary shapes.
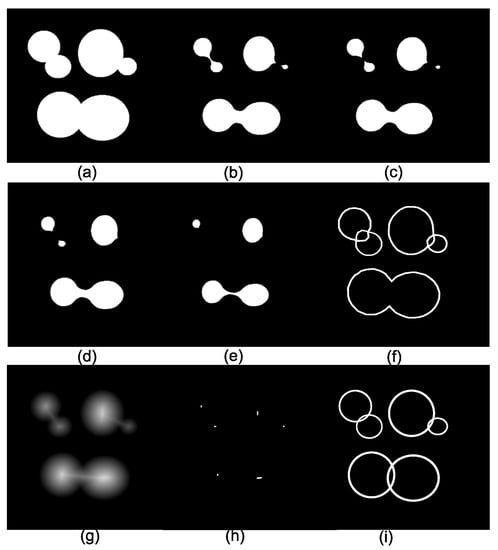
Figure 3.
Connected components in viscous lattices. (a) The original set; (b–e) eroded images by disks of sizes 20, 22, 27, and 36; (f) connected components for viscosity = 22; (g) distance function; (h) ultimate eroded components for viscosities (sizes) 25, 34, 45, 64, 66, and 68; and (i) connected components in the viscous lattice sense.
2.4. Morphologically Connected Filtering in Viscous Lattices
Equation (1) utilizes the marker x to detect the image components using the punctual opening . However, the trivial opening uses other criteria, for example, area, the size of the structuring element, or volume. This opening is presented as follows:
The operator detects and recovers all image components, fulfilling an increasing criterion. Then, from Equation (1), the connected viscous opening is expressed as follows:
For the case of functions, it is denoted as:
2.5. Hyperconnectivity
Serra introduced the hyperconnectivity concept [23], which permits working with joined or overlapped components. Figure 4 helps to understand this notion for the 2D case. Notice that the eyes link the brain and the skull in Figure 4a, i.e., they are hyperconnected because they form a unique component. Figure 4b presents the regional maxima obtained from Figure 4a. Each of these maxima are located on the brain, eyes, white matter, or skull.
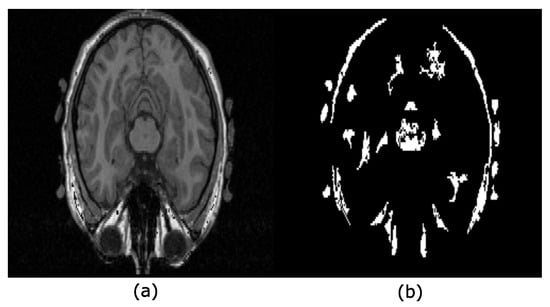
Figure 4.
Hyperconnectivity concept. (a) The image shows a hyperconnection because all the structures into the head overlap, forming a unique component; (b) regional maxima detected from the image in (a) after applying the filter .
From here, we let be the set of the maxima of f, whereas denotes the set of maxima of f at the k level.
Serra [23] considered a class of functions admitting a unique maximal connected component , where the horizontal cross-sections of functions are connected in such away that functions that admit a unique maximum generate a hyperconnection. An example of this situation is illustrated in Figure 5c,d.
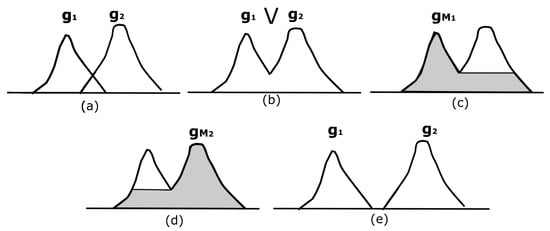
Figure 5.
Hyperconnected functions. (a) Two functions and ; (b) supremum of the functions in (a); (c,d) display two hyperconnected functions with a maximum; (e) trivial hyperconnected functions and .
3. Proposal of Using Hyperconnections and Viscous Transformations
3.1. Hyperconnected Opening
Similarly to Serra, we consider the class W of those functions admitting a maximal connected component. Particularly, we define the class W as those extracted from a function f, containing only one maximum using the reconstruction transformation . We let be the set of the maxima of the function f. The marker is expressed as follows, , and otherwise, . Thus, a particular set of functions recovered from f with a unique maximum is composed of functions. Then, the set W is defined as follows: .
Figure 5 exemplifies this situation. Figure 5a shows two overlapping functions, and . For the MRI case, represents a maximum on the brain, and is a maximum on the skull; however, the regions under the intersection of both functions indicate that the brain and the skull overlap, i.e., they are connected or hyperconnected. Figure 5b illustrates the supremum between and . Note that it is not possible to recover or from . This is what we visualize in reality; our eyes would observe how the brain and the skull appear in two places in a certain slice; nevertheless, lower slices connect them.
The reconstructed functions correspond to and , displayed in Figure 5c,d. These images come from an individual reconstruction using each maximum computed from Figure 5b. Figure 5c,d illustrate how to detect the markers to separate the brain and skull, and Equation (6) represents it formally. The maximum to be treated is selected and subsequently reconstructed using the transformation by reconstruction R. In Figure 5e, the two functions and do not overlap; hence, both functions can be retrieved. However, this is not what really happens in image segmentation.
Figure 6 illustrates a real example where there are several hyperconnected functions. Figure 6a,b show the original image and its maxima, respectively. In contrast, Figure 6c illustrates the obtention of a hyperconnected function computed from the extreme region marked with a circle of green color. Note that each maximum can be used to produce a hyperconnected function.
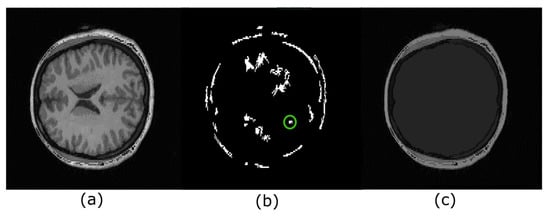
Figure 6.
Hyperconnected functions. (a) Original image; (b) each regional maximum detected corresponds to different regions within the brain, and each maximum can be used to recover other internal structures. However, our work currently investigates this case. The maximum in a green circle is the marker to produce the image in (c); (c) hyperconnected function associated with regional maximum marked with the green circle.
Now, we introduce the trivial criterion to build openings as follows:
where represents the volume, and denotes the increasing criterion given by volume. The opening is expressed as:
Equation (8) specifies that is obtained from those reconstructed maxima that fulfill the increasing criterion; for this, the supremum operator is necessary.
Formally, the next expression considers the highest maximum, called extreme hyperconnectivity:
In the present work, the following connected viscous opening is used:
Figure 7 shows an example in 2D using the input image in Figure 7a. The erosion is in Figure 7b. The maxima computed using the max-tree can be found in Figure 7c. Figure 7d shows the maximum fulfilling the increasing criterion to compute the most important hyperconnected component, whereas Figure 7e exemplifies the opening . Figure 7f contains the threshold calculated by the Otsu algorithm. The output image corresponds to the image in Figure 7g, and a mask with the input image permits brain recovery.
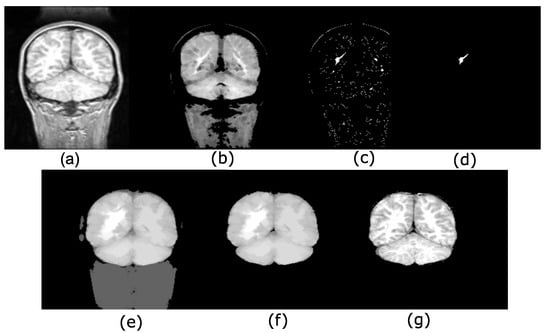
Figure 7.
Maximum hyperconnectivity and ultimate connected viscous opening example. (a) Original image; (b) size . The morphological erosion separates brain and skull; (c) maxima detection; (d) maximum fulfilling the increasing criterion, i.e., the greater volume obtained of a max-tree branch; (e) ; (f) Otsu threshold to eliminate low-intensity levels; (g) mask with the original image.
3.2. Hyperconnected Functions and Lower Leveling
Another useful transformation used in this work to segment the brain is the lower leveling, [26]. This transformation works similar to the opening by reconstruction; nonetheless, the parameter permits controlling the reconstruction of the marker into the original image.
The proposed marker g considers the regional maxima similar to those defined in Section 3.1, and subsequently, it is iterated using the lower leveling transformation. Therefore, following similar steps to deduce Equation (10), Equation (11) is obtained:
with
In practice, Equation (11) indicates that the erosion is computed on the input image to separate connected components. Posteriorly, the marker is established on a specific maximum selected by an increasing criterion. The marker g is iterated following the lower leveling operator. During the reconstruction process, the parameter avoids a complete marker reconstruction into the reference image. In the end, the output image is dilated.
4. Results: Brain Extraction Using Hyperconnectivity
4.1. Brain Extraction Based on the Maximum Hyperconnected Function
The difficulties found in the skull stripping procedure and its importance have led to the introduction of a wide range of proposals to address the problems with the procedure. A fundamental challenge to segment the brain in an MRI is the connection between the brain and the skull. Based on classical connectivity, the brain and skull make a connected component. Therefore, to overcome this problem, another type of connection must be used: for example, the viscous connectivity to separate them. The MRI dataset of 38 normal subjects processed in this paper comes from the Internet Brain Segmentation Repository (IBSR), developed by the Center for Morphometric Analysis (CMA) at the Massachusetts General Hospital [27]. However, considering that the images of this database contain intense contrast changes between the different three-dimensional image sections, converting our analysis is a real challenge. This problem, linked to the low quality of images, cannot always be avoided. Thus, robust methods must be implemented to process the images to resolve these difficulties. The proposed morphological transformations presented in this work give good results even when working with poor-quality images. The basic idea behind the segmentation problem of MRI images is the use of viscous connected transformations. Instead of computing the classically connected components on the original image, the morphological erosion provides them (step one in Figure 8), and the following consists of determining the maximum hyperconnected function (step two in the diagram of Figure 8). Morphological dilation permits the generation of a viscous component in step three, and a threshold based on the Otsu method (step four) enables brain detection. Figure 7 shows the sequence of operators proposed to separate the brain. The Jaccard () and Dice () [21,22] indices are computed to compare our results with those presented in the current literature. The Jaccard and Dice indices were designed to measure the overlap between two given objects and yield a value between zero (no overlap) and one (complete overlap). The metrics are straightforward to compute and interpret, but they should be applied carefully. These indices are not appropriate for use in the following cases [32]: (1) in small segmented structures such as brain lesions, cell images at low magnification, or distant cars; (2) in the presence of noise; (3) they do not have the capability of distinguish differences in shapes; (4) they are not appropriate for detection and localization tasks.
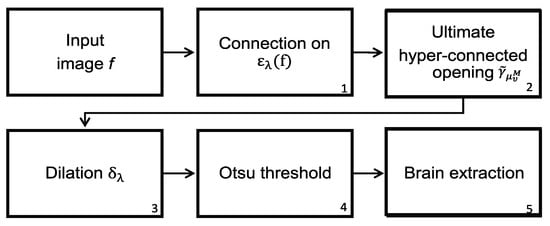
Figure 8.
Steps to segment the brain using the maximum hyperconected function (MHF), denoted as the MHF procedure.
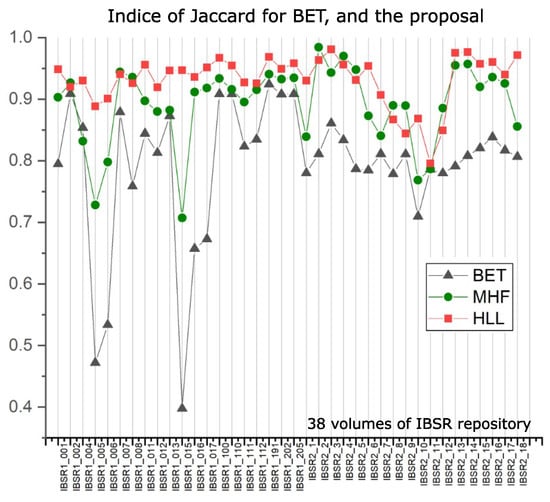
Our interest is evaluating the intersection with the ground truth images provided by databases utilized here. Table 1 displays such indices for the BET algorithm in columns “BET Jaccard” and “BET Dice”, and our results are in columns “MHF Jaccard” and “MHF Dice”. The data reported in Table 1 use 38 volumes of the IBSR repository, and they are plotted in Figure 15.

Table 1.
Jaccard and Dice indices computed for 38 volumes of an MRI obtained from the IBSR repository. The brain segmentation in this work utilizes the steps provided in Figure 8, and the computed indices are in columns MHF Jaccard and MHF Dice.
4.2. Brain Extraction Based on Hyperconnected Functions and Lower Leveling
The procedure to separate the brain using hyperconnectivity and the viscous opening is similar to that presented in Section 4.1. The diagram in Figure 9 presents the new opening in step 2. Because the lower leveling is iterated with some value, the marker propagation stops in the image minima more quickly. In this case, the dura represents a relevant minimum in the picture. Therefore, the skull will never reach high-intensity levels, and as a result, the lower leveling transformation produces an excellent outcome. The last step consists of separating the complete reconstructed brain using the Otsu threshold. Figure 10 presents a set of processed images following the steps given in Figure 9. The Jaccard and Dice indices are computed and presented in Table 2. Thus, Figure 11 shows several brain slices in different planes to appreciate the performance of the hyperconnected opening on a specific volume. Moreover, Figure 12 illustrates how the brain is reconstructed by iterating the hyperconnected leveling transformation with different slopes .
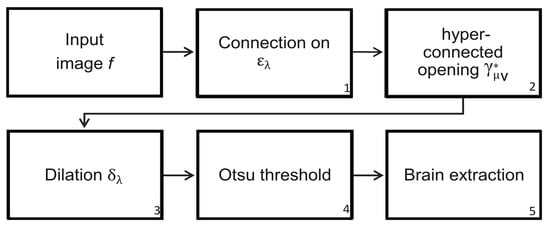
Figure 9.
Steps to segment the brain using the Hyperconnected Lower Leveling (HLL) procedure.
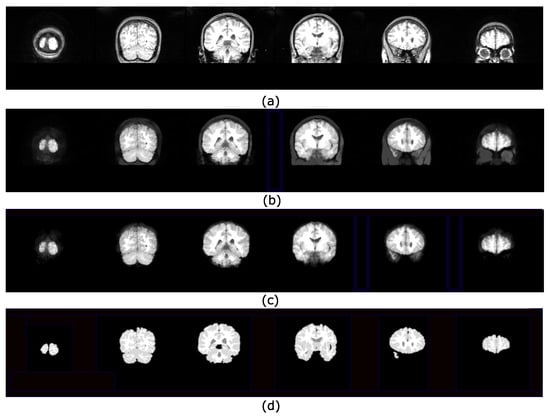
Figure 10.
Set of images processed using the HLL procedure presented in Figure 9: (a) Input images; (b) viscous components obtained from step (3) using and the greater volume computed from a max-tree branch; (c) brain segmentation after applying the Otsu threshold; (d) ground truth images obtained from the IBSR repository.

Table 2.
Jaccard and Dice indices computed for 38 volumes of MRI obtained from the IBSR repository. The brain segmentation in this work utilized the steps provided in Figure 9, and the computed indices are in columns HLL Jaccard and HHL Dice.
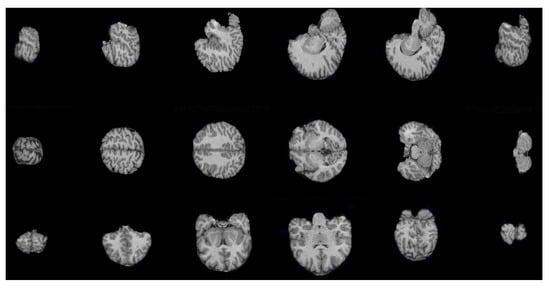
Figure 11.
Brain slices in axial, sagittal, and coronal planes obtained by applying the hyperconnected viscous opening , with .

Figure 12.
Illustration of the control in the reconstruction process by applying the hyperconnected lower leveling to the volume used in Figure 11 by varying the slope : (a) ; (b) ; (c) ; and (d) ; (e) contours illustrating the reconstruction process of the brain using the leveling, with, in green, in blue, in fuchsia, and in purple.
In addition, Figure 13 shows the performance of the algorithm presented in Figure 8 using a file obtained from the Neurofeedback Skull-stripped (NFBS) repository [33]. Ten brain IMR volumes of the NFBS are processed using the MHF algorithm displayed in Figure 8, and their respective Jaccard and Dice indices can be observed in Table 3. The mean values of Table 3 are displayed in Table 4. Such indices are useful to be compared with other results presented in the current literature.
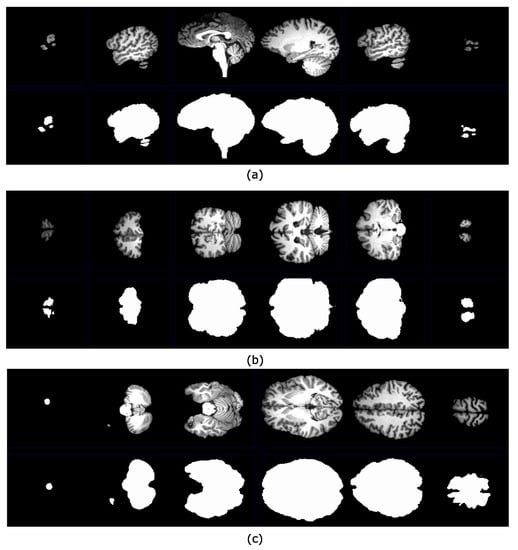
Figure 13.
File A00028185 belongs to the NFBS repository. This volume was processed by using the algorithm presented in Figure 8. (a) Segmented brain slices in the sagittal plane with their corresponding ground truth images; (b) segmented brain slices in the coronal plane with their corresponding ground truth images; (c) segmented brain slices in the axial plane with their corresponding ground truth images.

Table 3.
Jaccard and Dice indices computed for 10 volumes obtained from the neurofeedback skull-stripped (NFBS) repository.

Table 4.
Jaccard and Dice indices mean values reported in the literature.
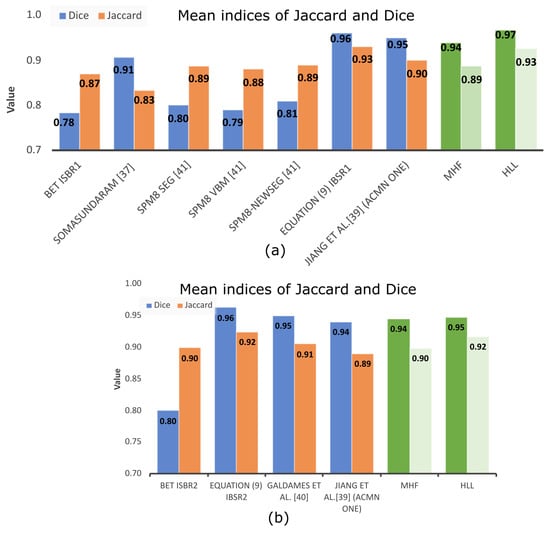
Table 4 displays the mean values of the Dice and Jaccard indices computed from the number of volumes specified in the last column utilizing different methodologies, and most of them utilize the IBSR dataset. Most articles compare with BET, for which Table 4 includes the indices associated with this methodology.
For the SPM8 Seg, SPM8 VBM, SPM8-NewSeg, FSL, and Brainsuite methods [34], the authors did not report the results for BET. However, by comparing such indices related to the MHF and HLL procedures, a better performance is observed for the algorithms proposed in this paper. The same situation is found when compared to the methodology introduced by Somasundaram et al. [35]. The results from the 10 brain MRIs obtained from the NFBS repository are high because the MRI volumes do not present the eyes, facilitating skull segmentation. Nevertheless, similar performances are presented when MHF and HLL procedures are compared to Zhang et al. [36], Jiang et al. [37], Mendiola et. al. [38], and Galdames et al. [39]. In Jiang et al. [37], the authors use a nonlinear speed function in the hybrid level set model to eliminate boundary leakage. When using the method, an active contour neighborhood model is applied iteratively slice by slice until the neighborhood of the brain boundary is obtained. The results show high values for the computed indices because of the edges enhancement. However, there are two problems: (1) the brain extraction requires a semi-global understanding of the image and (2) the weak boundaries between the brain tissues and surrounding tissues.
Additionally, in Mendiola et al. [38], indices of Jaccard and Dice are high, and so is the algorithm’s execution time. To overcome this disadvantage, in this paper, the max-tree structure, and the hyperconnectivity notion are utilized. The results displayed in Table 5 show two faster procedures with indices comparable to those obtained in [37,38]. The results indicate minimal differences between the methods [37,38], and the paper presented here. The proposal introduced here has the disadvantage that before loading the flat areas to the max-tree, smoothing filtering is performed to reduce the amount of regions that are loaded to the structure, producing the fusion of elongated and narrow regions. Furthermore, separately comparing the indices of the averages of the 18 (IBSR1) and 20 (IBSR2) volumes, our procedure overcame the indices reported in [37] for the IBSR1 data set and are similar to the IBSR2. Furthermore, the execution time of our proposal can be found in Table 5, together with the times reported in [38,40].

Table 5.
Time in seconds to segment a volume with 5 and 60 slices using different algorithms. The experiments are conduced in a PC Intel i7, 3.4 GHz, memory ram of 16 Gb with a 64-bit operating system.
Nonetheless, as noted in Table 4, the BET method presents low indices when compared to other methodologies. To better appreciate the data provided in Table 4, Figure 14 presents such information. BET is used widely around the world for the following reasons: (i) Usually, researchers do not need complete brain segmentation, and (ii) it is quicker. The computation time, which is not commonly reported in papers, should be considered as an important parameter. With this in mind, Table 5 indicates that the computation time of the proposed HLL method is close to that of the BET algorithm, but with a high degree of efficiency in brain segmentation. This situation is illustrated clearly in Figure 15, where MHF and HLL algorithms outperform BET. The BET algorithm produces approximated segmentations. However, sometimes, when images contain important variations in illumination, brain segmentation is similar to a sphere [38].
5. Conclusions
The two methods proposed in this paper utilize hyperconnectivity and viscous lattices, which permit separating the brain, even with poor-quality images. A criterion of maximum hyperconnectivity to extract the main component (the brain) and a threshold based on the Otsu method guarantee automation in the process. The efficiency related to segmentation is better than that of the BET algorithm and similar to the results shown in [36,37,38,39]. Moreover, the computation time is comparable to the BET and quicker than that of the method presented in [38]. However, segmenting hyperconnected components entails separating overlapping parts. If the pixel intensity level between the elements is notable, the possibility of obtaining the right segmentation is high; otherwise, it is necessary to use other criteria to separate components mainly during the reconstruction process. Moreover, the computed indices for volumes of teh NFBS repository are high because the IMR volumes lack eyes, and the segmentation is simple. Furthermore, the better execution time to separate brain corresponds to our proposal when compared with those reported in [37,38], whereas the Jaccard and Dice indices are similar.
Three things should be considered in future work: (1) hippocampal segmentation, where the intensity levels among the regions are similar; (2) white and gray matter separation, since they are related to neural damage and memory problems due to aging; and (3) the proposed transformations work adequately for T1 images, and not for other modalities. This inconvenience will be solved.
Author Contributions
Formal analysis, J.D.M.-S.; Investigation, C.P.-O. and G.D.-F.; Methodology, C.P.-O. and J.R.-R.; Resources, G.D.-F. and C.A.O.-O.; Software, C.P.-O.; Supervision, J.D.M.-S.; Validation, C.A.O.-O.; Writing—original draft, D.I.; Writing—review and editing, D.I. and J.R.-R. All authors have read and agreed to the published version of the manuscript.
Funding
This research received no external funding.
Institutional Review Board Statement
The study was conducted according to the guidelines of the Declaration of Helsinki, and approved by the Institutional Review Board.
Informed Consent Statement
Informed consent was obtained from all subjects involved in the study.
Data Availability Statement
Data were obtained from IBSR and NFBS repositories.
Acknowledgments
We are thankful to Ivan Terol for his invaluable support and the Artificial Vision Laboratory CIO Aguascalientes and especially to Gustavo Acevedo.
Conflicts of Interest
The authors declare no conflict of interest.
References
- Kalavathi, P.; Prasath, V.S. Methods on skull stripping of MRI head scan images—A review. J. Digit. Imaging 2016, 29, 365–379. [Google Scholar] [CrossRef] [PubMed]
- Sharma, A.; Singh, S.N.; Kumar, S. An innovative approach based on skull stripping for MRI images of human brain. In Proceedings of the 2017 2nd International Conference on Telecommunication and Networks (TEL-NET), Noida, India, 10–11 August 2017; pp. 1–4. [Google Scholar]
- Lucena, O.; Souza, R.; Rittner, L.; Frayne, R.; Lotufo, R. Convolutional neural networks for skull-stripping in brain MR imaging using silver standard masks. Artif. Intell. Med. 2019, 98, 48–58. [Google Scholar] [CrossRef] [PubMed]
- Keihaninejad, S.; Heckemann, R.A.; Fagiolo, G.; Symms, M.R.; Hajnal, J.V.; Hammers, A. A robust method to estimate the intracranial volume across MRI field strengths (1.5T and 3T). NeuroImage 2010, 50, 1427–1437. [Google Scholar] [CrossRef] [PubMed]
- Carass, A.; Wheeler, M.B.; Cuzzocreo, J.; Bazin, P.L.; Bassett, S.S.; Prince, J.L. A joint registration and segmentation approach to skull stripping. In Proceedings of the 2007 4th IEEE International Symposium on Biomedical Imaging: From Nano to Macro, Arlington, VA, USA, 12–15 April 2007; pp. 656–659. [Google Scholar]
- Chaddad, A.; Tanougast, C. Quantitative evaluation of robust skull stripping and tumor detection applied to axial MR images. Brain Inform. 2016, 3, 53–61. [Google Scholar] [CrossRef] [PubMed]
- Dale, A.M.; Fischl, B.; Sereno, M.I. Cortical Surface-Based Analysis: I. Segmentation and Surface Reconstruction. NeuroImage 1999, 9, 179–194. [Google Scholar] [CrossRef] [PubMed]
- Wang, G.; Hu, Y.; Li, X.; Wang, M.; Liu, C.; Yang, J.; Jin, C. Impacts of skull stripping on construction of three-dimensional T1-weighted imaging-based brain structural network in full-term neonates. Biomed. Eng. Online 2020, 19, 41. [Google Scholar] [CrossRef]
- Wadhwa, A.; Bhardwaj, A.; Verma, V.S. A review on brain tumor segmentation of MRI images. Magn. Reson. Imaging 2019, 61, 247–259. [Google Scholar] [CrossRef]
- González-Villà, S.; Oliver, A.; Valverde, S.; Wang, L.; Zwiggelaar, R.; Lladó, X. A review on brain structures segmentation in magnetic resonance imaging. Artif. Intell. Med. 2016, 73, 45–69. [Google Scholar] [CrossRef]
- Hwang, H.; Rehman, H.Z.U.; Lee, S. 3D U-Net for skull stripping in brain MRI. Appl. Sci. 2019, 9, 569. [Google Scholar] [CrossRef]
- Smith, S.M. Fast robust automated brain extraction. Hum. Brain Mapp. 2002, 17, 143–155. [Google Scholar] [CrossRef]
- Jenkinson, M.; Pechaud, M.; Smith, S. BET2: MR-based estimation of brain, skull and scalp surfaces. In Proceedings of the Eleventh Annual Meeting of the Organization for Human Brain Mapping, Toronto, ON, Canada, 13–16 June 2005; Volume 17, p. 167. [Google Scholar]
- Wang, L.; Zeng, Z.; Zwiggelaar, R. An Improved BET Method for Brain Segmentation. In Proceedings of the 2014 22nd International Conference on Pattern Recognition, Stockholm, Sweden, 24–28 August 2014; pp. 3221–3226. [Google Scholar] [CrossRef]
- Sara, S.; Samir, B.; Ahmed, H.; Bouchaib, C. A robust comparative study of five brain extraction algorithms (BET; BSE; McStrip; SPM2; TMBE). In Proceedings of the 2014 Second World Conference on Complex Systems (WCCS), Agadir, Morocco, 10–12 November 2014; pp. 632–636. [Google Scholar] [CrossRef]
- Somasundaram, K.; Kalaividya, P.A. Brain portion segmentation from Magnetic Resonance Images(MRI) of human head scan using Richardson Lucy deconvolution and intensity thresholding. In Proceedings of the 2016 International Computer Science and Engineering Conference (ICSEC), Chiang Mai, Thailand, 14–17 December 2016; pp. 1–5. [Google Scholar] [CrossRef]
- Roy, S.; Maji, P. Rough segmentation of coherent local intensity for bias induced 3-D MR brain images. Pattern Recognit. 2020, 97, 106997. [Google Scholar] [CrossRef]
- Kong, Y.; Chen, X.; Wu, J.; Zhang, P.; Chen, Y.; Shu, H. Automatic brain tissue segmentation based on graph filter. BMC Med. Imaging 2018, 18, 9. [Google Scholar] [CrossRef] [PubMed]
- Farahani, F.V.; Karwowski, W.; Lighthall, N.R. Application of Graph Theory for Identifying Connectivity Patterns in Human Brain Networks: A Systematic Review. Front. Neurosci. 2019, 13, 585. [Google Scholar] [CrossRef] [PubMed]
- Yu, Q.; Du, Y.; Chen, J.; Sui, J.; Adali, T.; Pearlson, G.; Calhoun, V.D. Application of Graph Theory to Assess Static and Dynamic Brain Connectivity: Approaches for Building Brain Graphs. Proc. IEEE. Inst. Electr. Electron. Eng. 2018, 106, 886–906. [Google Scholar] [CrossRef] [PubMed]
- Jaccard, P. The distribution of the flora in the alpine zone. New Phytol. 1912, 11, 37–50. [Google Scholar] [CrossRef]
- Dice, L.R. Measures of the Amount of Ecologic Association between Species. Ecology 1945, 26, 297–302. [Google Scholar] [CrossRef]
- Serra, J. Connectivity on Complete Lattices. J. Math. Imaging Vis. 1998, 9, 231–251. [Google Scholar] [CrossRef]
- Salembier, P.; Oliveras, A.; Garrido, L. Antiextensive connected operators for image and sequence processing. IEEE Trans. Image Process. 1998, 7, 555–570. [Google Scholar] [CrossRef]
- Santillán, I.; Herrera-Navarro, A.M.; Mendiola-Santibáñez, J.D.; Terol-Villalobos, I.R. Morphological Connected Filtering on Viscous Lattices. J. Math. Imaging Vis. 2010, 36, 254–269. [Google Scholar] [CrossRef]
- Meyer, F. From Connected Operators to Levelings. In Proceedings of the Fourth International Symposium on Mathematical Morphology and Its Applications to Image and Signal Processing, Amsterdam, The Netherlands, 3–5 June 1998; Kluwer Academic Publishers: Norwell, MA, USA, 1998. ISMM98. pp. 191–198. [Google Scholar]
- Cocosco, C.A.; Kollokian, V.; Kwan, R.K.S.; Pike, G.B.; Evans, A.C. BrainWeb: Online Interface to a 3D MRI Simulated Brain Database. NeuroImage 1997, 5, 425. [Google Scholar]
- Heijmans, H. Morphological Image Operators; Academic Press: Boston, MA, USA, 1994. [Google Scholar]
- Vincent, L. Morphological Grayscale Reconstruction in Image Analysis: Applications and Efficient Algorithms. IEEE Trans. Image Process. 1993, 2, 176–201. [Google Scholar] [CrossRef] [PubMed]
- Serra, J. Image Analysis and Mathematical Morphology, Vol. II: Theoretical Advances; Academic: New York, NY, USA, 1988. [Google Scholar]
- Serra, J.P.F. Viscous Lattices. J. Math. Imaging Vis. 2005, 22, 269–282. [Google Scholar] [CrossRef]
- Reinke, A.; Eisenmann, M.; Tizabi, M.D.; Sudre, C.H.; Rädsch, T.; Antonelli, M.; Arbel, T.; Bakas, S.; Cardoso, M.J.; Cheplygina, V.; et al. Common limitations of image processing metrics: A picture story. arXiv 2021, arXiv:2104.05642. [Google Scholar]
- Eskildsen, S.F.; Coupé, P.; Fonov, V.; Manjón, J.V.; Leung, K.K.; Guizard, N.; Wassef, S.N.; Østergaard, L.R.; Collins, D.L.; Initiative, A.D.N.; et al. BEaST: Brain extraction based on nonlocal segmentation technique. NeuroImage 2012, 59, 2362–2373. [Google Scholar] [CrossRef] [PubMed]
- Kazemi, K.; Noorizadeh, N. Quantitative comparison of SPM, FSL, and brainsuite for brain MR image segmentation. J. Biomed. Phys. Eng. 2014, 4, 13. [Google Scholar] [PubMed]
- Somasundaram, K.; Kalaividya, P.; Kalaiselvi, T.; Krishnamoorthy, R.; Praveenkumar, S. Edge detection using Chebyshev’s orthogonal polynomial and brain extraction from magnetic resonance images of human head. Int. J. Imaging Syst. Technol. 2019, 29, 110–120. [Google Scholar] [CrossRef]
- Zhang, H.; Liu, J.; Zhu, Z.; Li, H. An automated and simple method for brain MR image extraction. Biomed. Eng. Online 2011, 10, 81. [Google Scholar] [CrossRef]
- Jiang, S.; Zhang, W.; Wang, Y.; Chen, Z. Brain extraction from cerebral MRI volume using a hybrid level set based active contour neighborhood model. Biomed. Eng. Online 2013, 12, 31. [Google Scholar] [CrossRef]
- Mendiola-Santibañez, J.D.; Gallegos-Duarte, M.; Arias-Estrada, M.O.; Santillán-Méndez, I.M.; Rodríguez-Reséndiz, J.; Terol-Villalobos, I.R. Sequential application of viscous opening and lower leveling for three-dimensional brain extraction on magnetic resonance imaging T1. J. Electron. Imaging 2014, 23, 033010. [Google Scholar] [CrossRef][Green Version]
- Galdames, F.J.; Jaillet, F.; Perez, C.A. An accurate skull stripping method based on simplex meshes and histogram analysis for magnetic resonance images. J. Neurosci. Methods 2012, 206, 103–119. [Google Scholar] [CrossRef]
- Jiang, S.; Wang, Y.; Zhou, X.; Chen, Z.; Yang, S. Brain Extraction Using Active Contour Neighborhood-Based Graph Cuts Model. Symmetry 2020, 12, 559. [Google Scholar] [CrossRef]
Publisher’s Note: MDPI stays neutral with regard to jurisdictional claims in published maps and institutional affiliations. |
© 2022 by the authors. Licensee MDPI, Basel, Switzerland. This article is an open access article distributed under the terms and conditions of the Creative Commons Attribution (CC BY) license (https://creativecommons.org/licenses/by/4.0/).
