Article

Analysis of Land Use/Cover Change and Driving Forces in the Selenga River Basin

1
Institute of Geographic Sciences and Natural Resources Research, Chinese Academy of Sciences, Beijing 100101, China
2
Faculty of Geography, Lomonosov Moscow State University, 119991 Moscow, Russia
3
Department of Resources and Environment, University of Chinese Academy of Sciences, Beijing 100049, China
4
Department of Geography and Ecotourism, Southwest Forestry University, Kunming 650224, China
*
Author to whom correspondence should be addressed.
Sensors 2022, 22(3), 1041; https://doi.org/10.3390/s22031041
Submission received: 20 December 2021 / Revised: 24 January 2022 / Accepted: 25 January 2022 / Published: 28 January 2022

Abstract

:
The Selenga River basin is an important section of the Sino-Mongolian Economic Corridor. It is an important connecting piece of the Eurasian Continental Bridge and an important part of Northeast Asia. Against the background of the evolution of the geopolitical pattern since the disintegration of the Soviet Union and global warming, based on the land cover data in the Selenga River basin from 1992, 2000, 2009, and 2015, this paper describes the dynamic changes in land use in the basin. Through a logistic model, the driving factors of land cover change were revealed, and the CA-Markov model was used to predict the land cover pattern of 2027. The results showed that (1) from 1992 to 2015, the agricultural population in the Selenga River basin continued to decrease, which led to a reduction in agricultural sown area. The intensification of climate warming and drying had a significant impact on the spatial distribution of crops. Grassland expansion mostly occurred in areas with relatively abundant rainfall, low temperature, and low human activity. (2) The simulation results showed that, according to the current development trend, the construction land area of the Selenga River basin will be slightly expanded in 2027, the area of arable land and grassland will be slightly reduced, and the areas of forest, water/wetland, and bare land will remain stable. In the future, human activities in the basin will increase in the process of the construction of the China-Mongolia-Russia economic corridor. Coupled with global warming, the land/cover of the basin will be affected by both man-made and natural disturbances, and attention should be paid to the possible risk of vegetation degradation.

1. Introduction

Land use is the most direct and extensive human activity that changes the natural environment. Land use changes produce significant changes to the land surface and also have an impact on the material and energy flows of natural ecosystems, which in turn change the structure and function of ecosystems and affect ecosystem services and human survival and development [1]. In the process of global change research, land use change is the most closely intersecting issue between nature and humanity, and is a vivid manifestation of the human-earth relationship [2,3]. At present, land use change research is still one of the hot spots in the research of global change issues by scholars at home and abroad [4], and it is a key task to achieve the goal of sustainable development. The case studies in typical regions can grasp the characteristics of land use and cover change and scientifically explain the impact of human behavior on land cover and the interaction with ecological environment. The “Belt and Road” Ecological and Environmental Protection Cooperation Plan (2017) emphasizes that scientific research on land use is a new trend for future ecological protection cooperation among countries along the route to maintain the stability of regional ecosystems and human well-being.
For the relationship between driving forces and land use, quantitative research is mainly conducted by mathematical methods and analyzed by constructing models [5]. Among the typical methods of driving force research are: principal component analysis, typical correlation analysis methods, etc. The models are mainly system dynamics models, gray prediction models, Markov models, regression statistical models, etc. Logistic regression models can be applied with full consideration of whether the independent variables are continuous or not, and for categorical variables can also be added to the independent variable index system as factors. Moreover, the spatial heterogeneity of land type changes is taken into account, and the spatial driving factors are comprehensively covered, making the analysis process of driving mechanism more comprehensive and objective. Therefore, Logistic model is chosen in the analysis process of driving mechanism in this paper.
LUCC models need to be gradually developed and applied while continuously improving model functions and building an integrated and complete theoretical system to better realize simulation and prediction. Integrated models usually combine two or more modeling techniques, which can consider both spatial characteristics of land use change and non-spatial quantitative change characteristics. The CA-Markov model combines the Markov model’s focus on the quantitative land use change simulation and the CA model’s sensitivity to the spatial characteristics, so that the model can simulate the land use change process The CA-Markov model is applicable to the watershed scale and combines the relationship between land change and drivers to simulate and predict the spatial and temporal patterns of future land use types with high simulation accuracy, which is suitable for long-term prediction.
There are few studies on LUCC and dynamic analysis in the Selenga River basin. The literature search found that international articles on the study of the Selenga River basin are mostly directed at the physical properties, geochemical characteristics, and water resources of the basin. Wang Juanle [6,7] conducted a surface analysis of land-use change in Mongolia but did not quantitatively analyze its change mechanism. For the study of land change and landscape ecological impact in the outer area of Baikal and its typical cities [8], based on a surface analysis of the land-use patterns and changes in the outer Baikal region, the intrinsic driving mechanism and typical urban contrast landscape ecology are detailed. The results reveal the characteristics of socioeconomic development in the region from a unique perspective. The analysis of land-use changes and driving forces in the China-Mongolia-Russia cross-border region is limited, and there is room for further analysis and discussion. Therefore, based on remote sensing technology, combined with natural and socioeconomic data, this paper analyzes the spatial and temporal characteristics of LUCC and the driving forces, and provides a scientific basis for ecosystem protection in cross-border basin areas.

2. Case Area Overview and Method

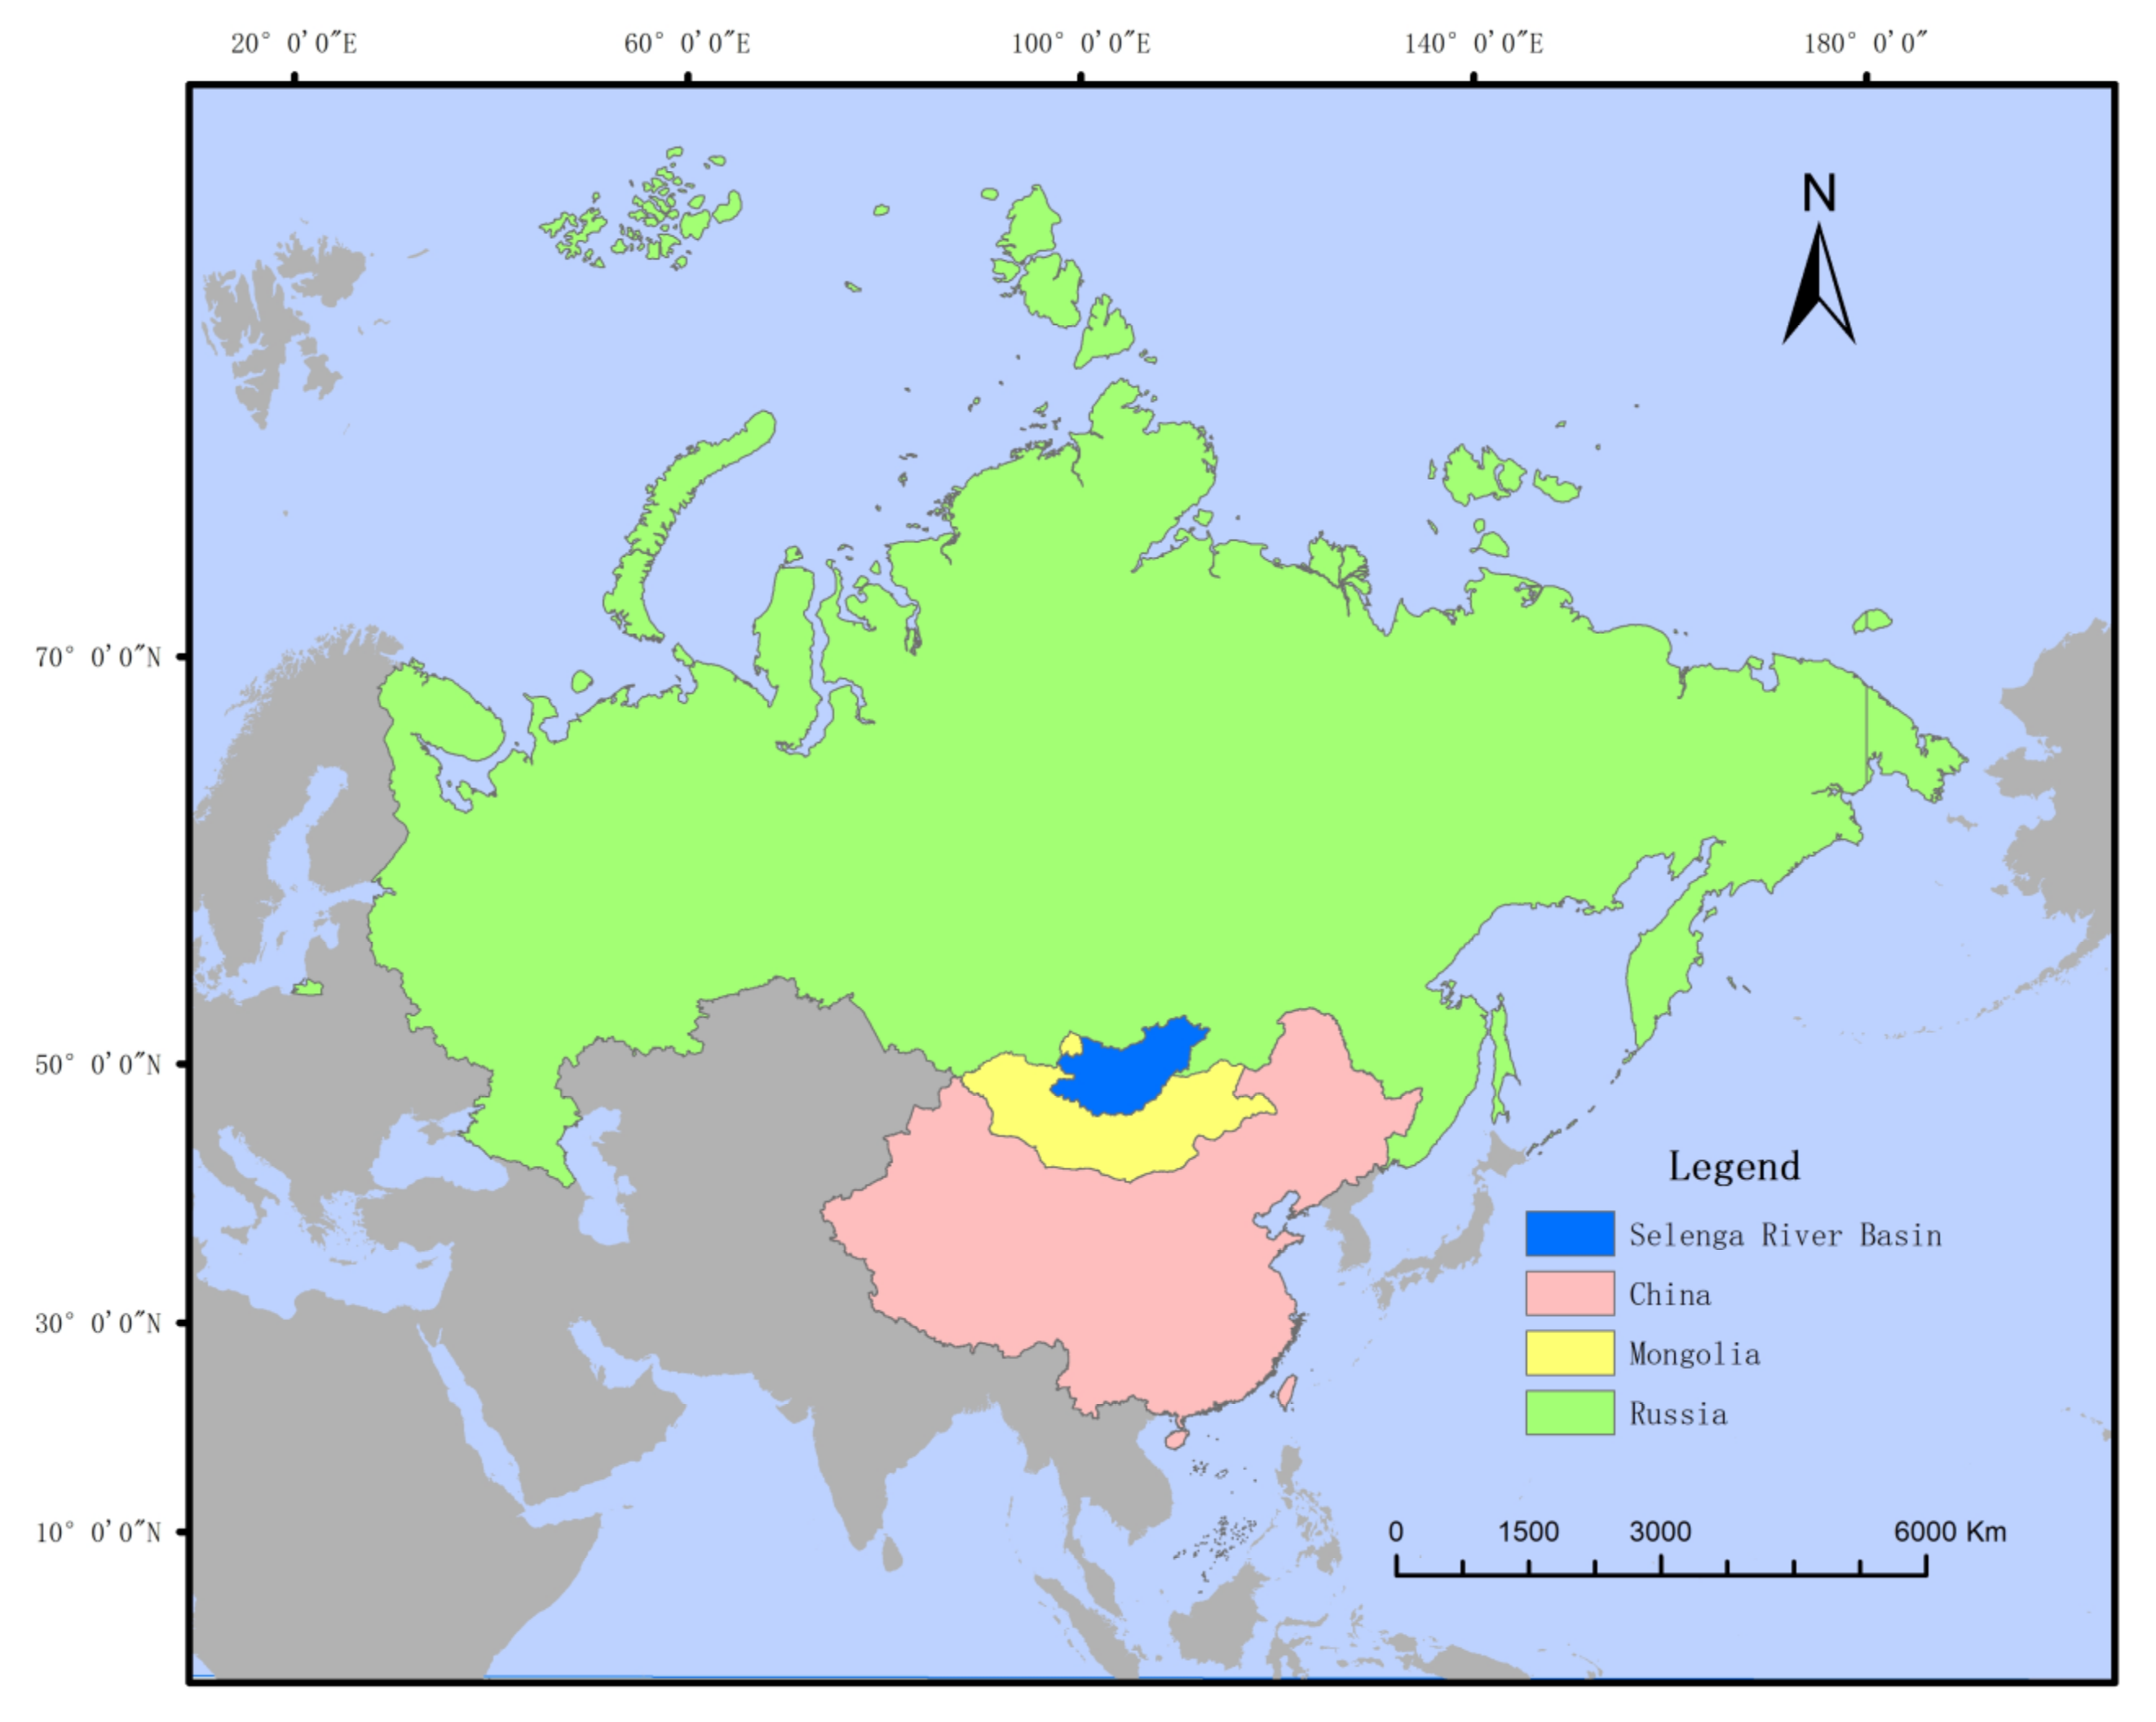
2.1. Overview of the Study Area

Lake Baikal, located in the Buryatia Republic of Siberia, Russia, is the oldest and deepest lake on Earth and is known for its rich freshwater resources and biodiversity [9]. The water system in the Buryatia Republic is well developed, with many rivers flowing into Lake Baikal, and the Selenga River is one of its most important rivers [10].
The Selenga River originates from the northern slope of Mount Hangai in Mongolia, flows through northern Mongolia and east-central Russia, and flows into Lake Baikal, Russia, replenishing more than 60% of the lake’s water volume. The Selenga River forms the world’s largest lake delta with an area of nearly 700 km2 at the entrance of the lake [11]. As the largest tributary of Lake Baikal, it has a total length of 1024 km and a drainage area of 447,060 km2, accounting for 82% of the area of Lake Baikal. In recent years, the amount of water in the Selenga River basin has decreased, and the water level of Lake Baikal has dropped, causing increasing concern about the water environment. As the main upstream river and water source of Lake Baikal, the Selenga River basin is an area that is sensitive to global change, and it is a node of the Sino-Mongolian Economic Corridor, the Russian Eurasian Economic Union, the Mongolian Prairie Road, and the Sino-Mongolian crossborder high-speed rail corridor (Figure 1). The area overlaps with major constructive strategies among major powers and has unique politics and a unique economic geostrategic status. The ecological environmental pattern in this region is complex and diverse, and the interaction between natural processes and human activities has a profound impact on Northeast Asia’s resources, environment and social and economic development. Land use/cover change (LUCC) directly affects the water resource changes in the basin and affects the ecological security of Lake Baikal.
The Selenge River basin plays an important role in the socioeconomic life of Mongolia, with 19.2% of the total area of Mongolia [12], including the capital city of UlaanBator, and the second and third largest cities (Dalhan and Erdenet), where more than 60% and 80% of agricultural and industrial products, respectively, are produced in the Selenge river basin [13]. After the collapse of the Soviet Union, the Russian population decreased significantly, with the westward migration of the population from Siberia and the Far East and the migration of a large number of rural laborers, especially young ones, to the cities. Together with policies such as land privatization and collective farm reorganization, there was a significant abandonment of agricultural land and urban expansion in Siberia, resulting in a significant shift in the original land use patterns and trends. Land use/cover change studies are conducted in this watershed to analyze the processes and mechanisms of land change for sustainable watershed development.

2.2. Methods and Data

2.2.1. Data

The land cover data of the Selenga River basin were extracted from the global land cover products. The data in 1992 were extracted from the UMD Land Cover data set, with a spatial resolution of 1 km and a temporal resolution of year 1992–1993; the data extracted for 2000 were from the Global Land Cover 2000 data set, the spatial resolution was 1 km; the 2009 data were extracted from the GlobCover data set; the 2015 data were extracted from FROM-GLC 2015_v1 download web URL data set.
The monthly average temperature and precipitation data from 1992 to 2015 were obtained from the Climatic Research Unit (CRU) of the University of East Anglia, with a spatial resolution of 0.5°.
The 90 m resolution SRTM DEM data set (Shuttle Radar Topography Mission Digital Elevation Model) was obtained from the Consortium for Spatial Information. The data came from the Global 3D graphical data project, jointly established by the National Aeronautics and Space Administration (NASA) and the National Geospatial-intelligence Agency (NGA), and we had access to 1:100,000 terrain and other raster data, administrative divisions, water systems, roads, and other vector data.

2.2.2. Methods

  • Unifying the land use/cover classification of the Selenga River basin
In view of the different classifications adopted for the different phases of land cover products in the Selenga River basin required for the study, to meet the research objectives and based on the retrieved datasets, a new classification scheme with nine categories (Table 1) was proposed, comparison of different classification systems as shown in the Table 2 [14,15].
2.
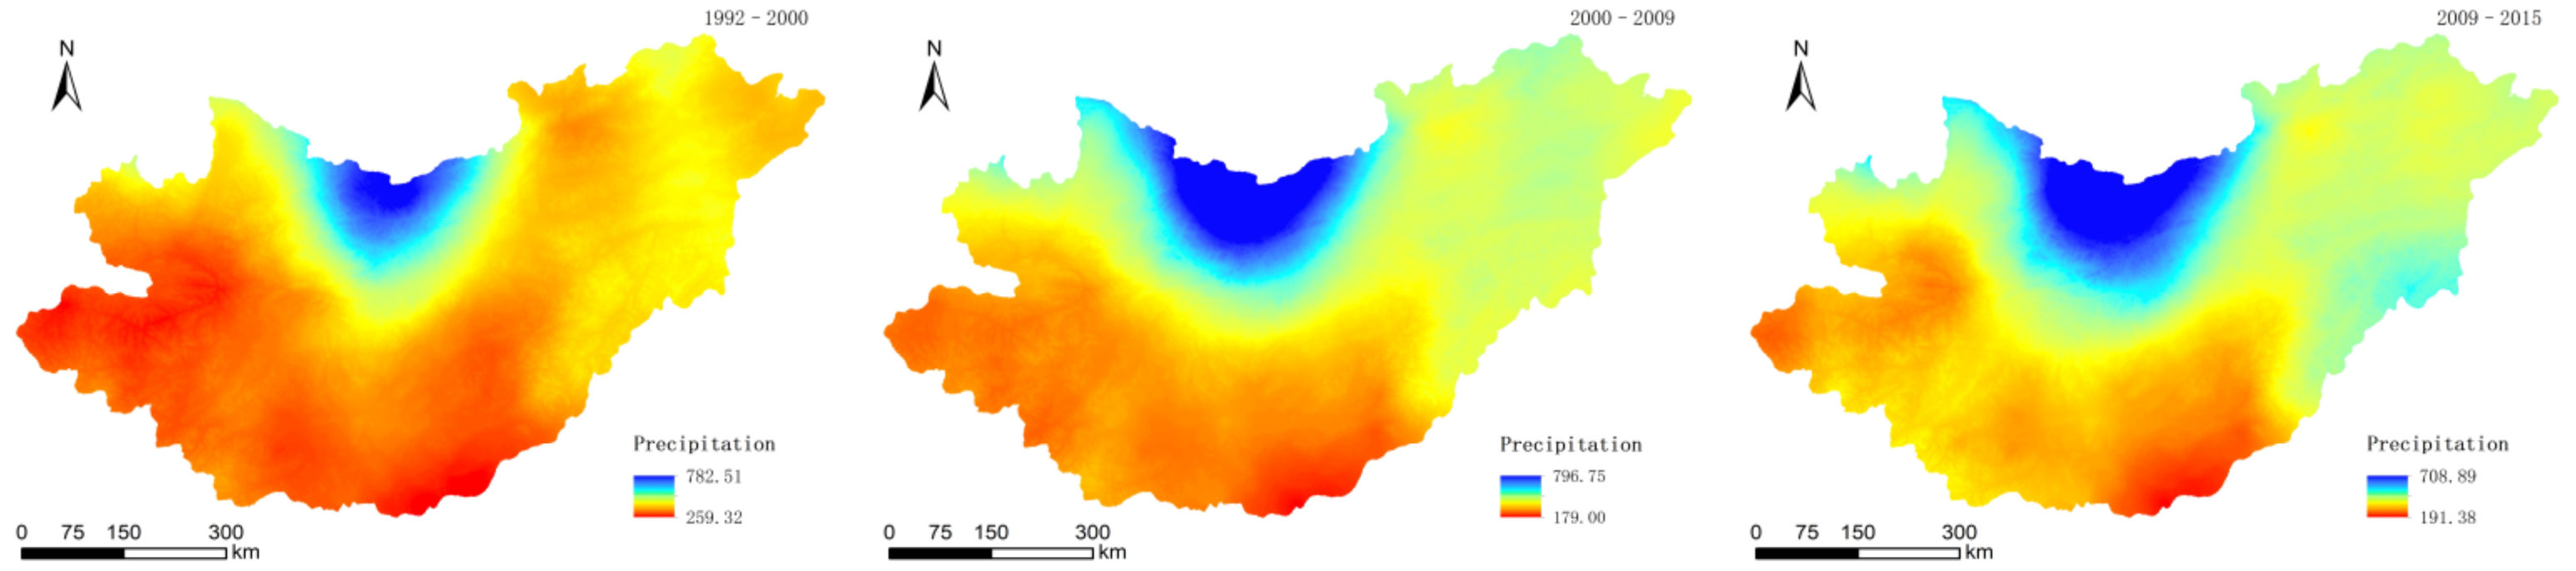
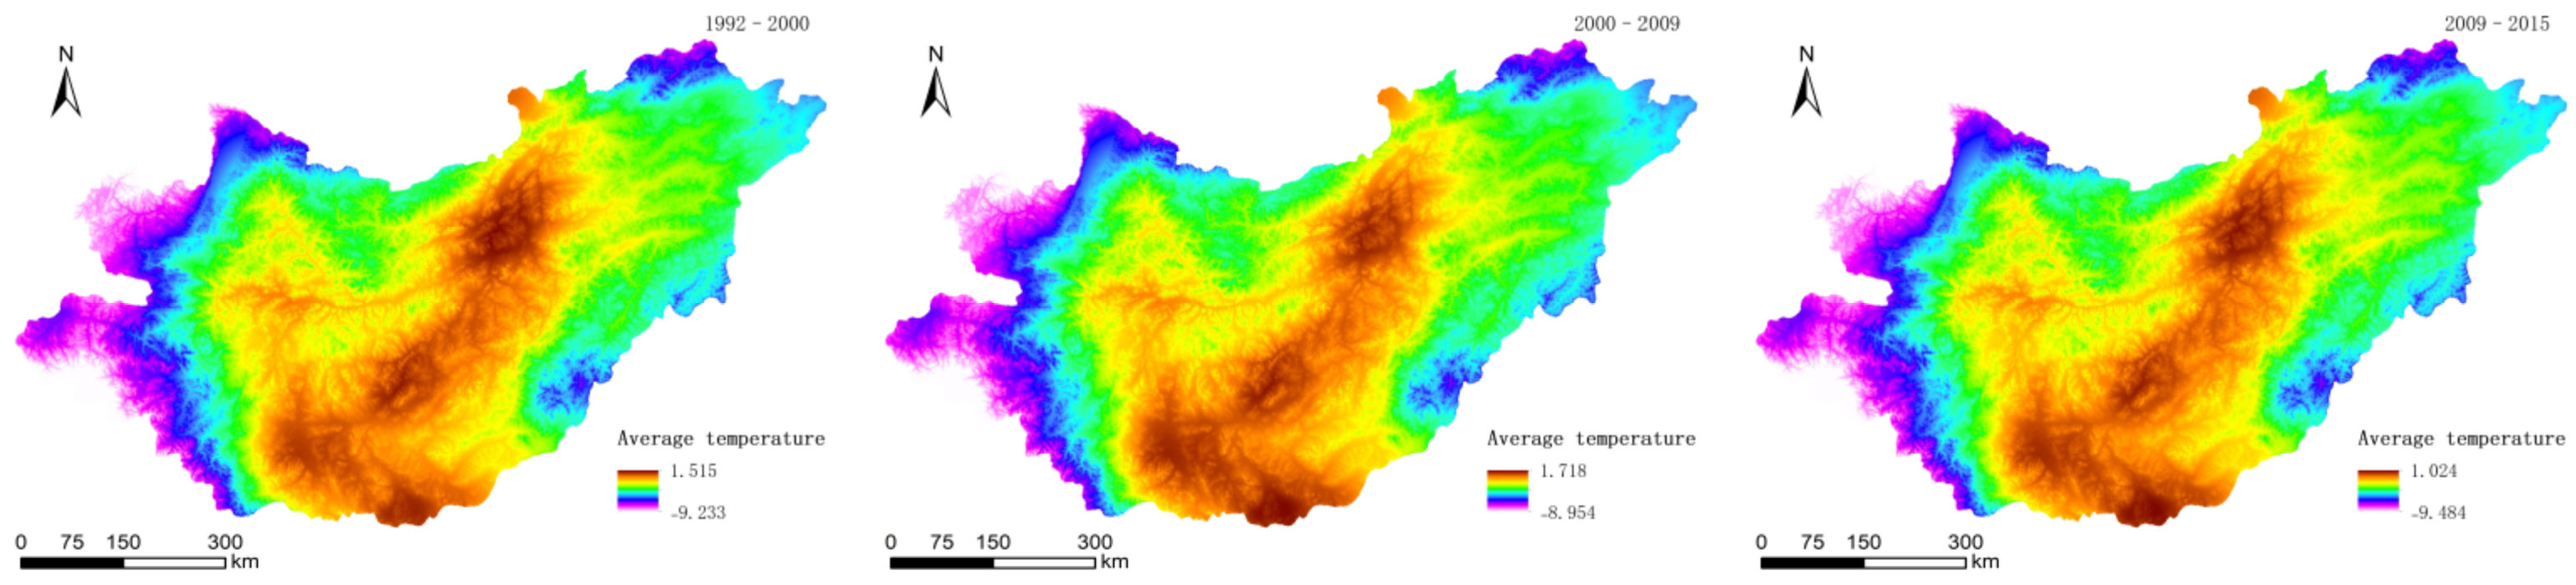
ANUSPLIN interpolation
Anusplin, a surface fitting software for climate data written by Australian scientist Hutchinson based on the theory of thin plate smoothing splines [16], is a professional software suitable for spatial interpolation of long-term meteorological elements [17]. This research used software to interpolate the meteorological driving force factors (temperature and precipitation) in the land-use change of the watershed to satisfy the driving force analysis process.
3.
Logistic regression model construction
Using SPSS 24.0 software, this paper quantitatively studied the relationship between land-use types and driving factors by binary logistic regression analysis and obtained the regression coefficients of land-use types.
We took the changes (expansion or contraction) in the main land types (croplands, needleleaf forest, grassland) as the dependent variable, with the value “1” (indicating sample points where land use/cover changes have occurred), “0” (indicating sample points where no land use changes have occurred). Assign a value of “1” to the sample point of the gain of the land type, and assign a value of “0” to the sample point that has not changed and loss, and analyze the main driving factors of land type expansion; conversely, the loss of the land type is assigned a value of “1”, and the unchanged and gain value is assigned a value of “0” to analyze the main driving factors of land type contraction. Input the dependent variable and continuous and categorical independent variables into SPSS. After standardizing the continuous independent variable data, we used the logistic model in SPSS to perform regression analysis on the standardized continuous independent variables, categorical independent variables, and dependent variables to obtain the driving force for changes in main land types from 1992–2000, 2000–2009, and 2009–2015 and perform corresponding analysis. We used the HL (Hosmer and Lemeshow test) index as the goodness-of-fit index to test the model. According to the test result, using the significance level of >0.05, all passed the test, which meant the results were credible.
(1)
Create a land-use change layer
Three land-use change layers (1992–2000, 2000–2009, and 2009–2015) were made from cultivated land, coniferous forest land and grassland (Figure 2, Figure 3 and Figure 4).
(2)
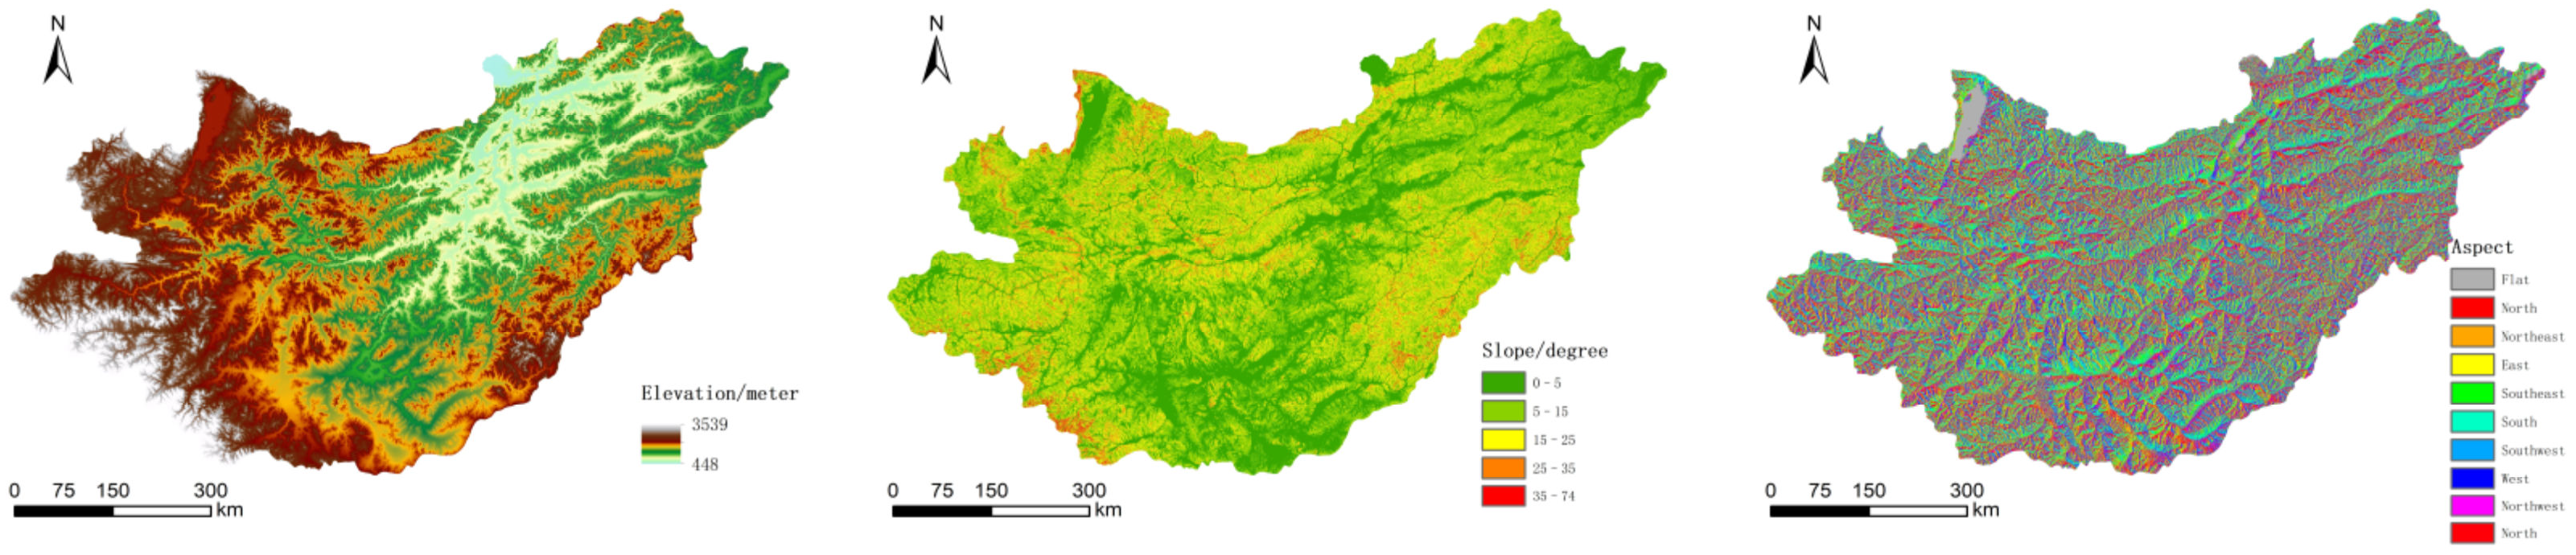
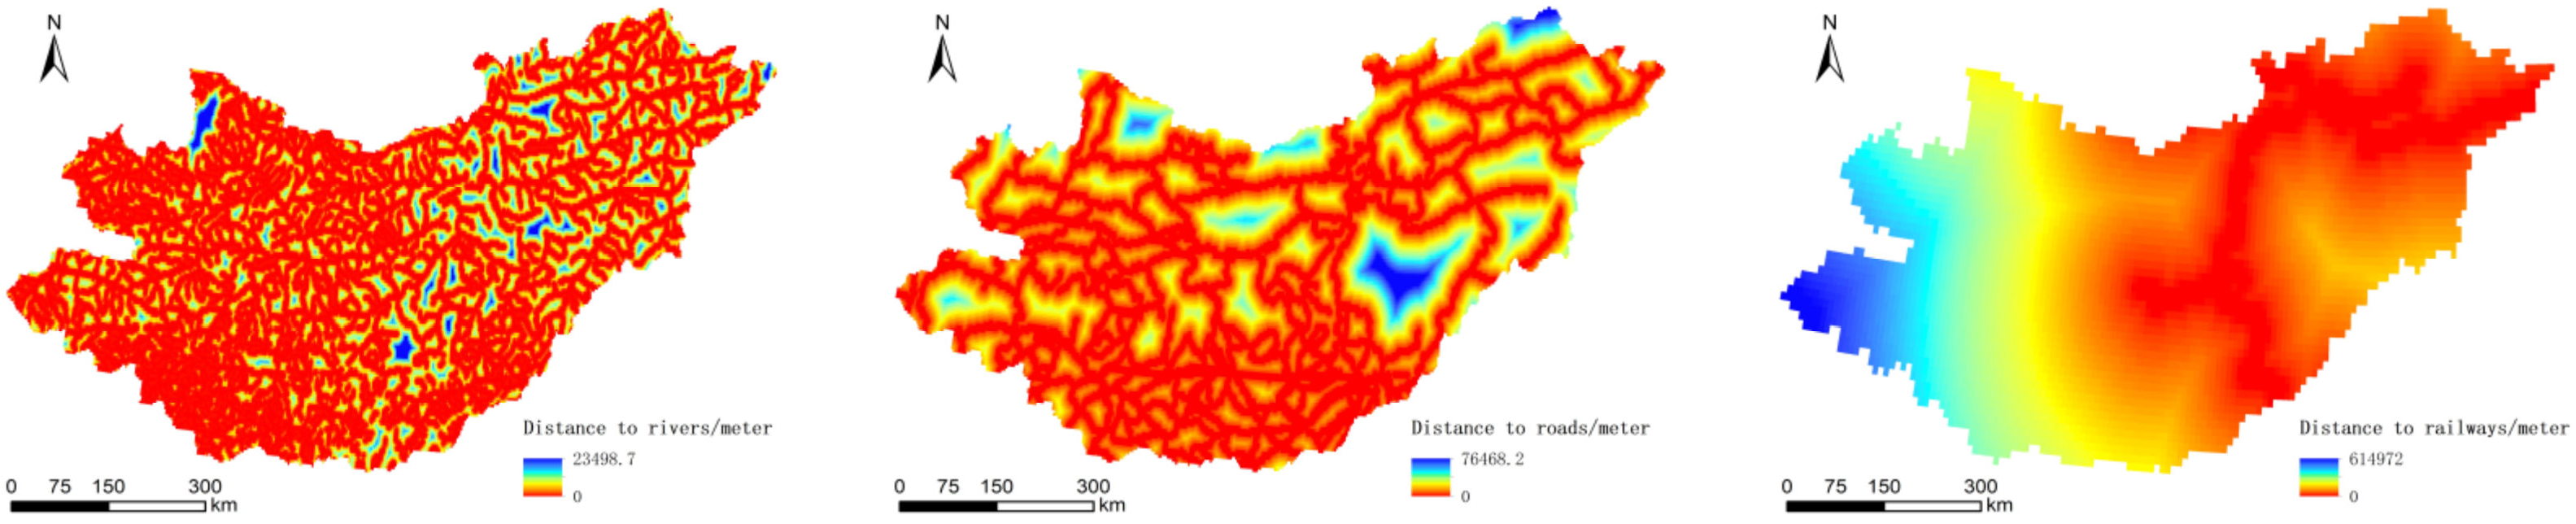
Establish driving factor layers
According to the principles of comprehensiveness, representativeness, accessibility, and regional difference in the driving force factors, combined with the natural environment and the social situation of the basin, nine influencing factors were selected from meteorology, society, space, and topography in this paper (Table 3).
This paper used 90-m DEM data and obtained the corresponding slope and aspect data through Spatial Analyst Tools/Surface/Slope and Aspect in ArcGIS (Figure 5).
The traffic neighborhood data were obtained by Spatial Analyst Tools/Distance/Euclidean Distance in the ArcGIS platform (Figure 6).
Through ANUSPLIN, the raster data layers of the precipitation (Figure 7) and average temperatures (Figure 8) in 1992–2000, 2000–2009, and 2009–2015 were obtained.
According to the official statistics of NASA, raster data of the world population in 1990, 2000, 2010, and 2015 were obtained, and raster layers of population density changes in the basin in 1992–2000, 2000–2009, and 2009–2015 were obtained (Figure 9).
The raster data obtained above needed to be standardized, that is, the projections needed to be uniformly converted into WGS-84, UTM49N, and the raster size was set to 100 m × 100 m.
(3)
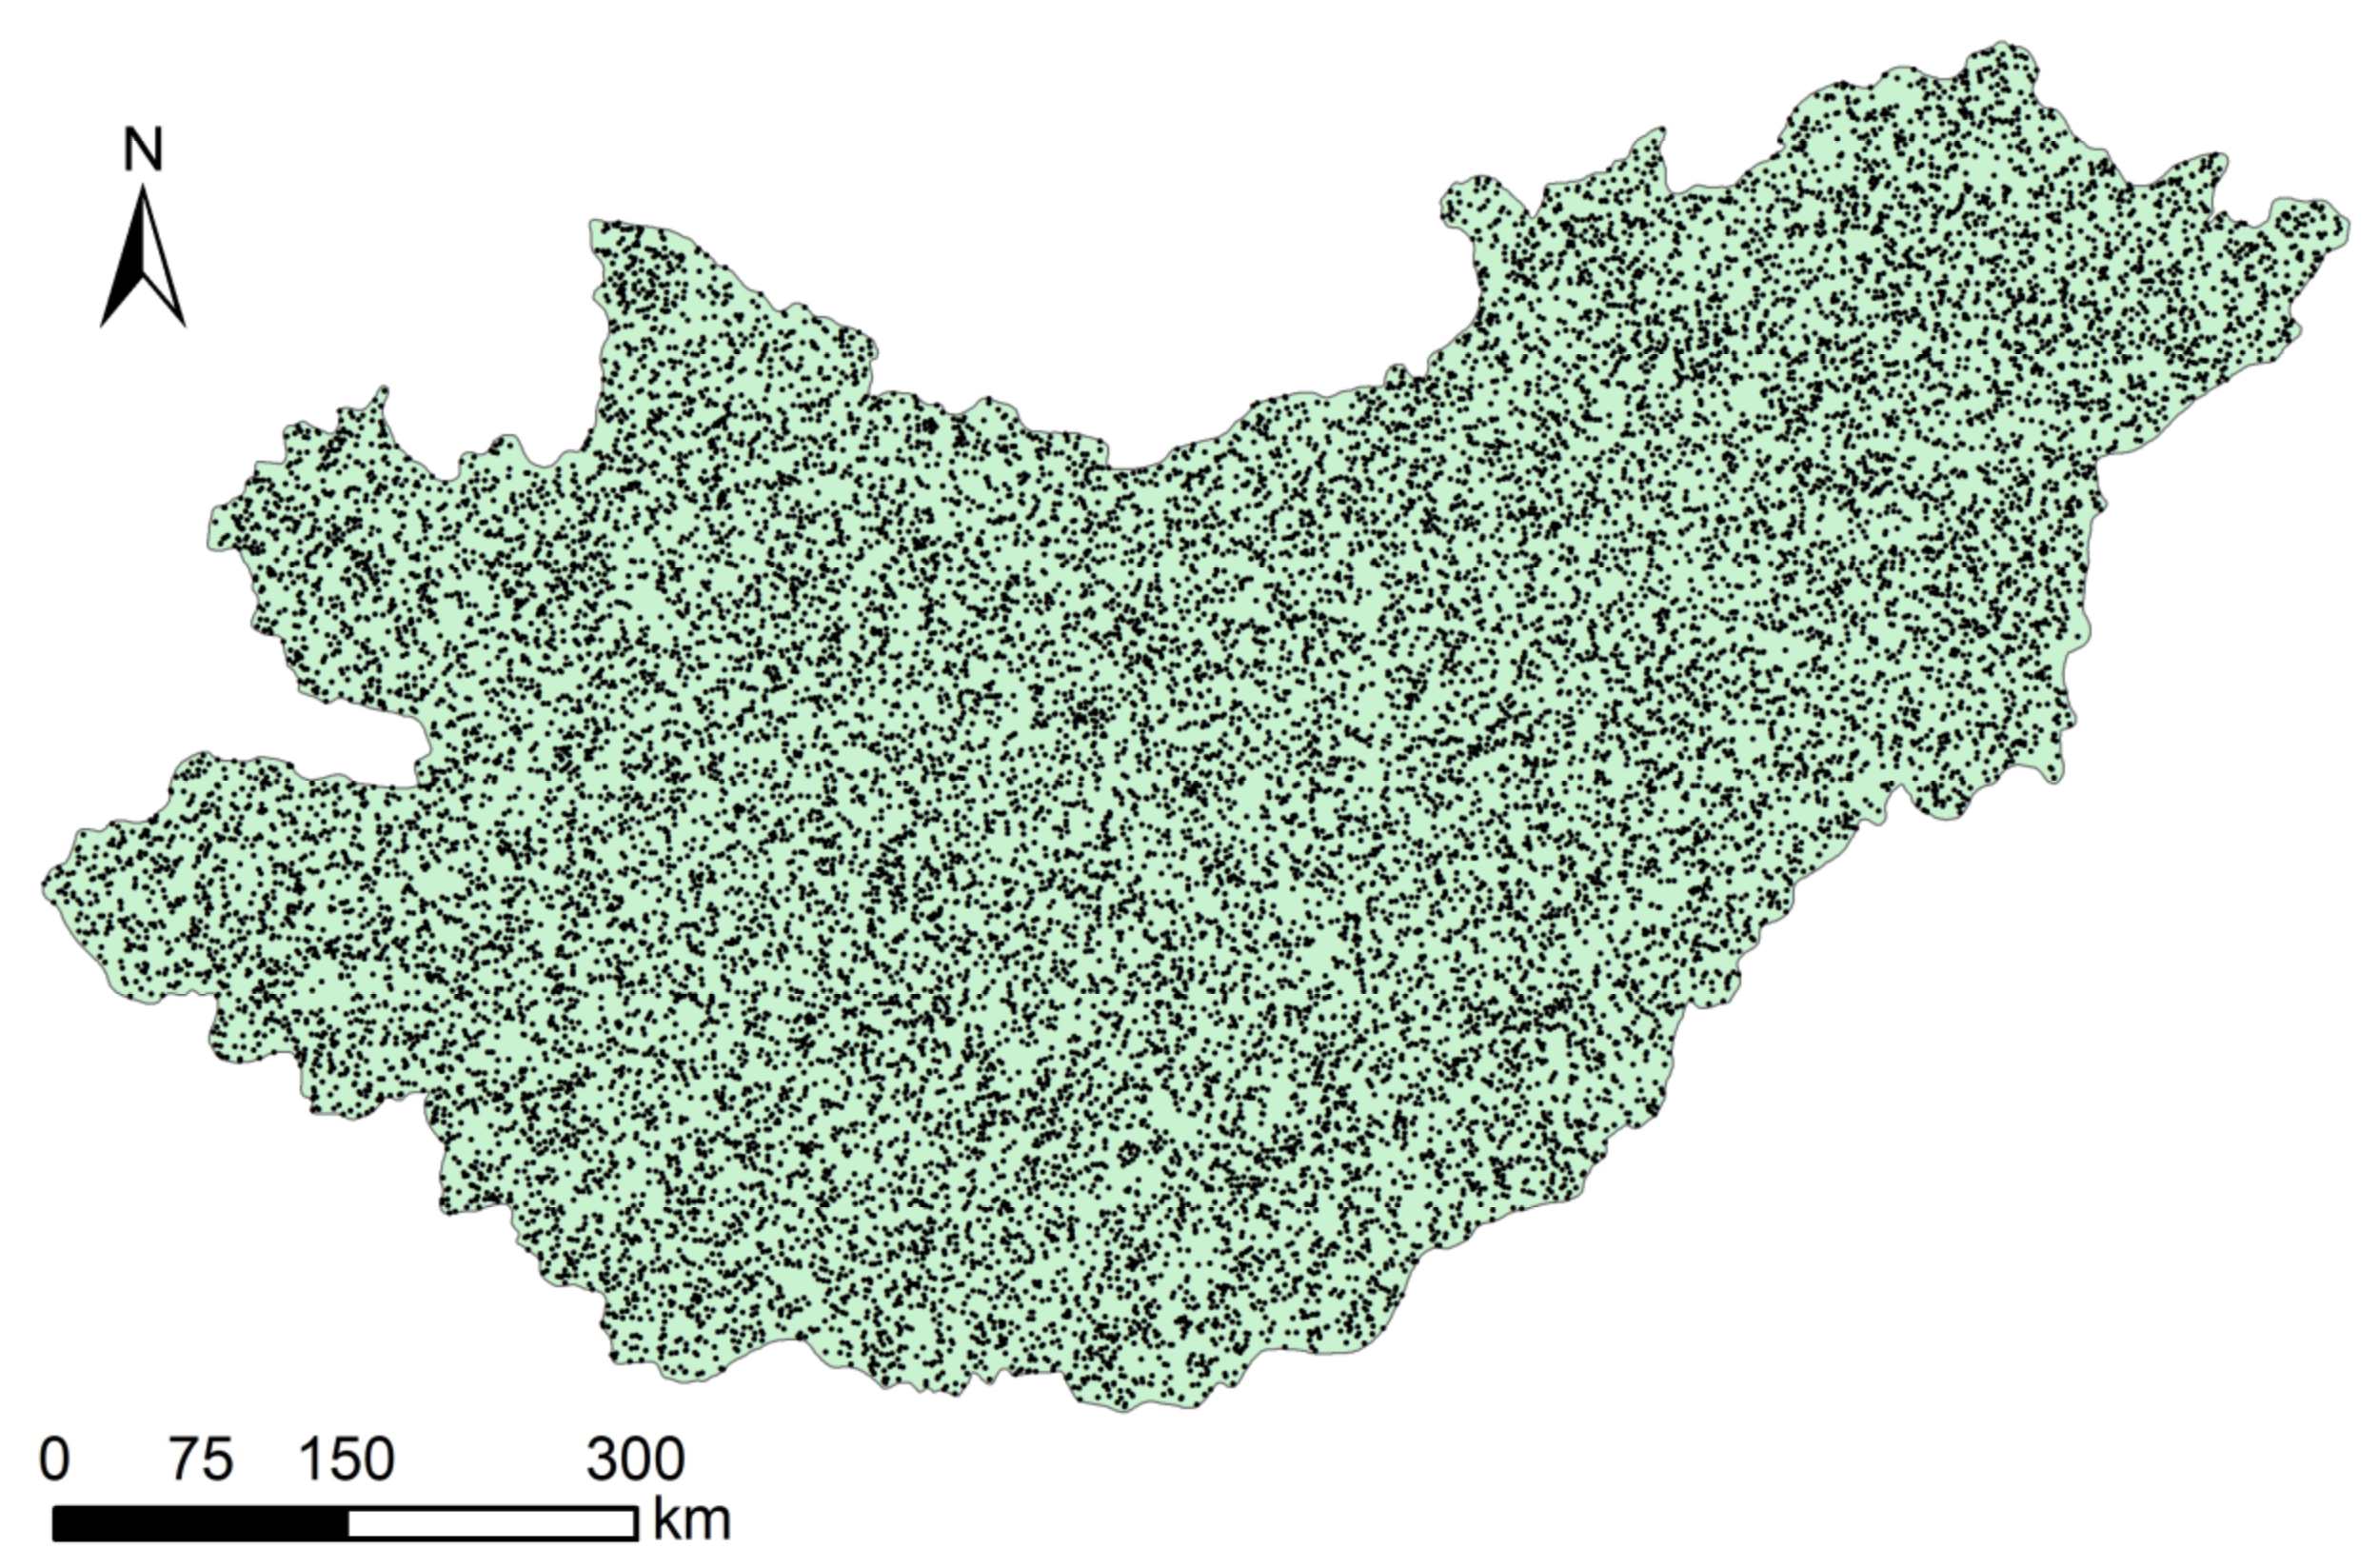
Random sampling and extraction of variable values
Through the pattern of random sampling, 20,000 sample data points uniformly distributed throughout the study area were selected (Figure 10).
(4)
CA-Markov model construction
Using IDRISI Selva software, based on the land use distribution in 2000, combined with the land use type transfer matrix and suitability atlas from 2000 to 2009, the time span is 6 years to simulate and predict the land use distribution in 2015. The forecast results are compared with the actual land use distribution map in 2015. After the simulation accuracy is verified, the land use pattern in 2027 is simulated based on the land use in 2015 and the driving factors in 2009–2015.
(1)
Cell composition
A 5 × 5 filter is used, that is, the 5 × 5 neighborhood cells around each central grid unit strongly act on the central cell and play a key role in its change.
(2)
Make 2000–2009 (verification of prediction accuracy), 2009–2015 of each land type transfer area matrix and conditional probability matrix.
(3)
Creating an atlas of land transfer suitability
Combined with the analysis of the driving forces of land use change, this paper will make conversion rules for construction land, cultivated land, coniferous forest land, grassland from the aspects of slope, aspect, distance to railway, distance to river, and distance to road to provide a basis for simulating the future land use distribution pattern of the watershed. The following main land types are obtained under the constraints of the suitability of each factor (Table 4), and make a suitability atlas through the suitability graphs of each category, which provides a basis for CA-Markov simulation prediction.
(4)
Land use simulation and prediction
Based on the land use distribution map in 2000, combined with the 2000–2009 land use type transition matrix and suitability atlas, the time span is six years, and the land use distribution in 2015 is simulated and predicted, and the prediction results (Figure 11) Compared with the actual land use distribution map in 2015, the Kappa coefficient is 0.76. Due to the long simulation period and changes in the objective natural environment and economic and social conditions, the simulation effect of this experiment is good and credible.

3. Results and Analysis

3.1. Land Use/Cover Pattern and Change

From 1992 to 2015, the land use/cover pattern in the Selenga River basin (Figure 12) was mainly grassland and forest (coniferous forest, mixed forest, broad-leaved forest, shrubland). In 1992, these land types accounted for 28.4% and 59.33% of the total land area, respectively; in 2015, they accounted for 43.80% and 41.81%, respectively. These types are followed by cultivated land, water/wetland and barren, and the proportion of urban and rural construction land is relatively small.
From 1992 to 2000, the proportion of cultivated land and coniferous forest in the Selenga River basin increased from 11.14% and 19.56% to 24.41% and 29.75%, respectively; that of mixed forest and shrub decreased from 19.88% and 19.82% to 8.41% and 2.73%, respectively; the area of urban and rural construction land decreased slightly; and the area of broad-leaved forest increased slightly. From 2000 to 2009, the proportion of grassland, shrub and mixed forest increased to 37.95%, 3.45%, and 17.07%, respectively, the proportion of cultivated land and broad-leaved forest decreased to 15.11% and 0.11%, respectively, the area of coniferous forest decreased slightly, and the area of urban and rural construction land remained basically stable. Between 2009 and 2015, the proportion of cultivated land decreased to 10.60%, the area of forest land decreased slightly, and the grassland area increased to 43.80% (Figure 13).
Through the overlay analysis of land use data in 1992 and 2015, the land transfer matrix is obtained (Table 5). From 1992 to 2015, cropland was converted to forest and grassland, some of which were converted to barren; broadleaf forest, needleleaf forest, mixed forest, and shrubland were weakly converted to grassland at the same time; grassland was partially converted barren and forest; barren occupies a small proportion, which focuses on the transformation of grassland, forest, and cropland.

3.2. Changes and Distribution of Major Land Types

The land type conversion maps from 1992 to 2015 were superimposed and analyzed, and the plots that did not change were extracted. Such plots were mainly distributed in the central and western regions of the study area, with an area of 172,951.95 km2, accounting for 38.23% of the total area of the study area (Figure 14). The land use/cover changes in the Selenga River basin had obvious spatial differences in the past 23 years, and the land-use types of cities along the main railway lines in the river basin changed significantly. The eastern part of the basin, that is, the eastern part of the Russian Transbaikal, and the southern part of the basin, that is, the northern part of Mongolia, were relatively stable. The main railway lines from Russia to Mongolia had a direct impact on the land cover, and the conversion of various land-use types was relatively frequent; however, because the population densities of Russia and other areas of Mongolia are relatively small and human intervention is relatively weak, the land-use change in the region is relatively stable.
From 1992 to 2015, arable land changed significantly, and the conversion of cultivated land to grassland was mainly concentrated in western and central Mongolia and the southern Buryat Republic, Russia. There was also a certain degree of transformation along the railway. The conversion of cultivated land into forest land and bare land areas was mostly scattered in central and western Mongolia and Russia.
Broad-leaved forest, coniferous forest, mixed forest, and shrubland shifted, and the conversion of forestland to grassland was mainly distributed in northern Mongolia, while the conversion of forest land to bare land mainly occurred in western and central Mongolia. The conversion of shrubland to grassland mostly occurred in central Mongolia and along the railway; the conversion of mixed forest land to grassland was mostly concentrated in northern Mongolia and along the railway line; and the conversion of coniferous forest land to grassland was distributed in northern and eastern Mongolia.
The areas where grassland was converted to forest were mostly distributed in northwestern Mongolia and the central and southern regions of the Republic of Buryatia, Russia, with significant changes along the railway. In the city of Sukhbaatar in northern Mongolia, some grasslands were converted into cultivated land. In the central and northwestern parts of Mongolia, grassland was mostly transformed into bare land (Figure 15).

3.3. Analysis of Driving Factors of Major Land-Type Changes

According to the results of regression analysis (Table A1, Table A2, Table A3, Table A4, Table A5 and Table A6 in Appendix A), in the research stage, analyzing the contraction of croplands from natural factors, the declining precipitation and the rising temperatures had an important influence on the farmers’ decisions related to crop cultivation and the designation of development areas. Due to changes in natural conditions, the suitable area and environment for cultivation were changed, thus leading to a change in the area of croplands. In the later stage of the research, due to the deepening of human activities and the improvement of farming technology, farmers’ abilities to transform natural conditions improved, resulting in a decrease in precipitation and a decrease in cropland contraction probability. The effect of slope was not obvious, but in areas with higher elevations, the probability of cropland contraction went from increasing to decreasing. This pattern was because cropland contraction was more likely to occur in higher altitude areas where the natural environment was relatively unsuitable for crop growth. With the degree of human activity and the change in global climate, higher altitude areas were gradually developed for croplands; thus, the probability of contraction also decreased. Then, as the distance to the traffic lines decreased, the degree of human activity increased, and the more likely it was to be adversely affected. As distance from the rivers increased, there were fewer water sources and croplands were more likely to shrink. The higher the degree of population aggregation with the higher demand for reclamation was, the more severe the human disturbance to croplands was, and the greater the probability of contraction was.
With the decline in precipitation, the increase in temperatures and the decreasing probability of forest expansion, natural factors played an important role in the change in forest area, and their increase or decrease was closely related to natural conditions. Elevation and slope played major roles in forest expansion. The expansion of needleleaf forest land mainly occurred under topographic conditions with a slope of 5–15°, and its probability increased in higher altitude areas, which was closely related to the growth characteristics of needleleaf forests that were resistant to cold and drought. As distance from the traffic lines increased, the probability of forest land expansion increased. In addition, areas with lower population density had fewer human activities and weaker impacts on the natural environment, and the probability of needleleaf forest land expansion increased.
From the perspective of natural factors, precipitation, and average temperature played dominant roles in grassland expansion. Due to the unique climate environment in high elevation areas, the lower precipitation and the lower average temperature, the probability of grassland expansion decreased. Under topographic conditions with a slope of 5–15°, grassland was more likely to expand. The probability of grassland expansion in higher altitude areas first increased and then decreased, which had a certain relationship with the reduction in human activities in addition to the impact of the natural environment. The closer the distance to the rivers was, the more suitable the grass growth conditions were and the greater the probability of expansion was. In the later stage of the research, grassland expansion was more likely to occur in areas far from rivers because human activities were mostly concentrated in water sources. The farther the distance from roads and railways was, the weaker the influence of human activities was, and the probability of grassland expansion increased. Therefore, human activities had a great negative impact on grassland expansion.

3.4. Land Use/Cover Simulation and Prediction Analysis

Taking the land-use distribution data in 2015 as the base period, assuming that the land cover continues to develop according to the current law of change, using the 2009–2015 land-use transfer matrix and suitability atlas, we selected the interval year two times that was 2027, and we simulated and predicted the distribution pattern of land use in the basin in 2027 (Figure 16).
From the perspective of the spatial distribution pattern of land use in the Selenga River basin, the overall trend of land use was consistent. From the changes in land area, it was found that the area of construction land expanded slightly, the area of forest remained stable, and the area of grassland decreased. In terms of spatial distribution, the area of reduced croplands with obvious changes will mainly occur on the southern side of the Republic of Buryatia in Russia and the southwestern side of Mongolia, and a certain increase in cropland area will occur in the middle reaches of the basin. The area of forest will change more obviously along the main railway lines, mainly concentrated in the Republic of Buryatia in Russia and northeastern Mongolia. The change in grassland area will mainly occur in Mongolia, concentrated along the mainstream and tributaries of the upper and middle reaches of the Selenga River. The change and transfer of construction land area will mainly occur in the adjacent areas of cities in the two countries and around main railway lines. The water area will increase to a certain extent along the river system, mostly concentrated in the basin of the Selenga River in Russia into the Baikal Delta.
In future development, we should plan rationally and attach great importance to the characteristics of regional development. While rationally developing animal husbandry on the Mongolian side of the basin, we should also focus on improving the quality of grassland and achieving the improvement of both ecological and economic benefits. The abandonment of cultivated land on the Russian side has a profound impact on ensuring people’s production and living needs and stabilizing domestic food security. Therefore, in the process of the continuous deepening of urbanization and the continuous improvement of the economic level, the stability of cultivated land should be considered to better guarantee the area and quality of cultivated land. We should improve the level of basin development through more scientific and efficient planning and practices and provide support for the construction of important strategic nodes in the Silk Road Economic Belt and the China-Mongolia-Russia Economic Corridor.

4. Discussion

1. About the factors of land use change in the watershed. The transformation of various land-use types in the Selenga River basin over 23 years was closely related to the changes in local temperature and precipitation over time, and the indirect factors produced by human activities also had certain influences. The Selenga River Basin occupies only 22% of Mongolia’s total area, however, it contains between 55–60% of the nation’s population. Within the amigas in the basin, population densities range from a minuscule 1.3 to a massive 196.6 people per square kilometer. The obvious gap in population density fully reflects the differences in human settlements, and the basin still maintains the pattern of rural-to-urban migration. It is manifested in the gradual shrinking of small rural settlements, while the concentration of large urban settlements gradually increases. About 54% or Mongolians now live in urban areas, and more than 25% of the population live in the capital city [18].
With the increasing urbanization level in Mongolia [19], the population engaged in agriculture and animal husbandry continues to decrease. This further led to a reduction in cropland area, thus giving up a certain amount of agricultural land. Under severe changes in the natural environment, Mongolia in the basin has a high agricultural land use efficiency. The area of croplands in the basin has decreased since agricultural transformation, and the area of croplands in Mongolia in the basin has decreased by 27.5%. So far, there has been a trend of decreasing arable land. [20].
Although agriculture and livestock remained important to the Mongolian economy, state-directed economic planning onward increasingly emphasized developing Mongolia’s considerable and varied mineral resources. In addition to the migration and gathering to big cities, some industrial towns have appeared, linked by the Trans-Mongolian Railway to Ulaanbaatar as well as to Siberia. The development of new commodities (notably cashmere) and the establishment of mining ventures with foreign companies, tourism and other industries have become new channels for economic development [21].
The contraction of croplands was also driven by climatic factors such as reduced precipitation, which had an important influence on farmers’ decisions regarding crop cultivation and development areas. At the same time, climate disasters caused by climate change had a serious impact on crop harvest and cropland reclamation. Between 1999 and 2016, the area of farmland was further reduced by 25% [22].
2. Future development direction and cooperation. Despite the natural conditions, the intensity of development of the Mongolian food economy and the efficiency of farmland use in the agricultural economy is higher than in the Russian part of the basin. The efficiency of plant cultivation in Mongolia is positively influenced by the privatization of land and the dominance of agricultural organizations in land use. The existing structure of sown land in the Republic of Buryatia with a high proportion of fodder crops, satisfying livestock and bringing a small but stable profit for agribusiness. In the future, the development of new high-yielding drought-tolerant and early-maturing varieties will be the focus of development and then their introduction into the Buryat and Mongolian parts of the basin. To further increase the productivity of livestock and grazing livestock, there is a need to increase pasture production [20]. Land use change, which is currently more pronounced in the Mongolian than the Russian part of the Selenga River basin, is driven chiefly by mining and the expansion of agriculture [23,24]. The conversion of forests and natural grasslands into pastures and fields has implications for both hydrology [25] and water quality [26]. The resource cannot exist in isolation, and the integrity of the groundwater resource provides the primary source of water for urban centers, nomads and their livestock, agricultural lands, mining and tourism, and maintains the function of natural ecosystems. There are many contaminants that can endanger groundwater systems, such as increasing livestock access to streambeds leading to erosion problems and agricultural pollution, and direct discharges of manure and urine to surface waters. In addition, the relative inexperience of agricultural production may also lead to contaminants entering water sources, and both soil and water resources are negatively affected [18]. In the development process of the basin in the past few decades, more attention has been given to the ecological environment and water source protection of the basin. In the future, the basin will continue to warm, and the permafrost will continue to melt [27], which will cause profound changes in land use and water use. We should pay more attention to the important position of basin ecological strategies and improve the efficiency of agricultural land use. At the same time, to restore land cover, we recommend partially prohibiting grazing on degraded land and strictly controlling the implementation of environmental protection measures [28]. A more extensive program of integrated land and water resources management is needed in the future to gradually address these issues.
3. Sustainable Development under Policy Guidance. The “China-Mongolia-Russia Economic Corridor” is one of the six economic corridors of the “Belt and Road”, and its development and construction and related projects can, on the one hand, promote the advantageous production capacity cooperation of all parties, innovate the multilateral cooperation model, actively implement the development tasks under the leaders’ mechanism, and improve infrastructure construction and efficient economic cooperation. At the same time, it is also necessary to take into account local ecological sensitivities and constraints in the basin, to avoid nature reserves and harsh natural conditions as much as possible, and to proactively reduce the damage to the ecological environment caused by human activities. In this context, cooperation in the field of environmental protection is crucial, and the development of technologies and standards for the rational use of soil and water resources and pollution prevention, as well as permafrost protection, will minimize negative ecological impacts in order to achieve sustainable development [29]. The idea of sustainable land use was first introduced at the International Symposium on Sustainable Land Use Systems in 1990 and has gradually developed into a focus of land science research. The form and use of land will change at different times, and these changes may have certain negative effects on the ecological environment. In order to achieve the requirements of sustainability and adjust the internal structure to avoid damage to the limited land resources, it is necessary to coordinate the contradiction between ecological environment and social development in the process of land use, and finally achieve the coordination and sustainable development among population, resources, environment, and economy.
The concept of developing green economy has been agreed between China, Mongolia, and Russia, and sustainable development has become the main line of regional economic development. The type of land use and management should be configured in a rational way in order to maximize or optimize its ecological functions, production potential, and economic efficiency. It is not only to rely on high technology and good varieties, but more importantly to build a series of optimization models, such as optimizing the development model of regional land use in the construction of China-Mongolia-Russia economic corridor, actively developing low-carbon, and recycling economy, reducing the pressure of economic activities on ecological environment, reducing the impact of desertification and permafrost disasters, and achieving sustainable regional development. For Russia, its industrial structure is also homogeneous; Mongolia’s resource economy is more dependent. It should gradually find new dynamics of economic development in the development of regional economic cooperation and improve the level of open economic development; and it should unify the planning of the scope of ecological reserves, develop short-term and long-term protection plans, and establish ecological water connotation circles [30]. The implementation of the “North-South Water Transfer” project between Mongolia and Russia can be scientifically proven, and the joint ecological protection can completely eliminate desertification in the China-Mongolia-Russia Economic Corridor region; the indiscriminate cutting of forests, overgrazing, large-scale mining and other man-made activities are prohibited. Reasonable control of population growth in the region to avoid high population density. Reasonable use of water resources, water conservation, according to local conditions, to achieve a balance of water and soil. Adjust the structure of pastoralism and livestock grazing methods to improve the output rate and maintain land use stability; adopt seasonal pastures and avoid overgrazing [31]. Optimize the land use pattern, adjust the ratio of different land use types, rationalize development, and improve land use efficiency.
Close cooperation and collaboration are necessary among all stakeholders, including government agencies, communities, etc. Due to the uneven distribution of land and various resource uses within the watershed, many institutional improvements are needed. A multi-pronged approach is needed from macro and micro perspectives. At the international level, the Selenge River Basin is managed cooperatively by Mongolia and Russia for the benefit of both countries. Local-level management will complement the implementation of regional management strategies and promote efficient use of resources. There is also a need for educational activities for the public and general awareness of relevant issues such as resource conservation and wise exploitation. The cross-border basin ecosystem as a whole is in the same line as the neighboring countries and regions. Russia, Mongolia and neighboring countries should work together to protect the important ecosystems of forests, grasslands and wetlands in this region. This cross-border basin will become an important link of the “Belt and Road Initiatives” strategy and the construction of the China-Mongolia-Russia Economic Corridor, effectively enrich cross-border exchanges, broaden the direction of cooperation, become a new engine for development among countries, and promote cooperation between countries.
4. Deficiencies and Prospects. This paper introduces models to describe the relationship between land use changes and influencing factors in a time period, so as to reasonably adjust social and economic activities and scientifically utilize land resources. Because the problem of agricultural land abandonment is very complicated, it not only requires the analysis of objective images, but also the support and analysis of local actual first-hand data. It is a pity that this part has not been studied in depth and objectively due to objective factors. In the future scientific research, the agricultural land in this basin will also be analyzed in more depth. However, the research in this paper can not only grasp the changes of the Selenge River Basin in the time interval, but also provide methods and ideas for land use changes in other river basins. At the same time, the Selenga River Basin is a cross-border watershed, which involves different land resource conditions, different national backgrounds, and different lifestyles. The transboundary river basin ecosystem is a whole, and it is in the same line with the countries and regions along the route. The neighboring countries should act together to protect the ecological environment. Research in transboundary watersheds is conducive to comparative analysis of the ways and impacts of different countries on land resource use, and this impact can be amplified through long-term data accumulation. In order to grasp the changes of local land use and existing problems, scientifically explain the impact of human behavior on land cover and the interaction with the ecological environment. In order to better formulate development strategies, it can provide a useful reference for realizing the coordinated and sustainable development of the river basin.
In this study, the combination of manual visual interpretation and supervised classification is used for land change detection. AI, especially deep learning technology, has greatly improved the automation capability and accuracy of spatial information extraction from GIS, and has been playing an important role in several aspects, such as for remote sensing image feature extraction [32,33]. Therefore, in the future we will explore the application of AI algorithms in land classification research, not only to fully consider the complex land cover situation in different regions, but also to be able to carry out big data level land change monitoring and comparative analysis.
In the process of driving force analysis, there are also various methods and models, such as principal component analysis, which mainly selects several principal component factors instead of the original variables, thus reflecting most of the information; typical correlation analysis takes each group of variables as a whole, and quantitatively discriminates the degree of contribution through typical loading coefficients. In the future application process, suitable methods should be adopted according to the actual cases, sample size, and data accessibility.
In terms of model prediction, this paper focuses on the simulation of natural development scenarios, which is limited by the availability of data and therefore does not fully take into account the impact of policies. Therefore, an important direction for future research is to fully consider the two-sided effects of policies such as the China-Mongolia-Russia cooperation strategy. After obtaining the data related to the local ecological control line range and the planning strategy map, we can use them as the reference factors for the simulation, so that we can make simulation predictions for different scenarios, thus improving the simulation accuracy, making the land use pattern fitting results closer to the actual development situation, and better simulating the land use change development process.

5. Conclusions

In this paper, the Selenge River transboundary basin, which has an important geostrategic position, was selected as the study area. The global land cover dataset was used to obtain the 1992, 2000, 2009, and 2015 land use/cover change datasets of the basin to characterize the spatial and temporal dynamic patterns and processes of LUCC. Logistic models were used to model the driving mechanisms and to comprehensively analyze the driving forces of land use changes in the watershed from 1992 to 2015. The CA-Markov model was used to simulate and predict the future land use/cover distribution in the basin, with the aim of providing a scientific basis for the conservation and development of land resources in the cross-border region, and to better develop international land resource cooperation, prevent related ecological and environmental risks, and achieve sustainable development during the construction of the “One Belt, One Road” and the China-Mongolia-Russia Economic Corridor.
The main conclusions are:
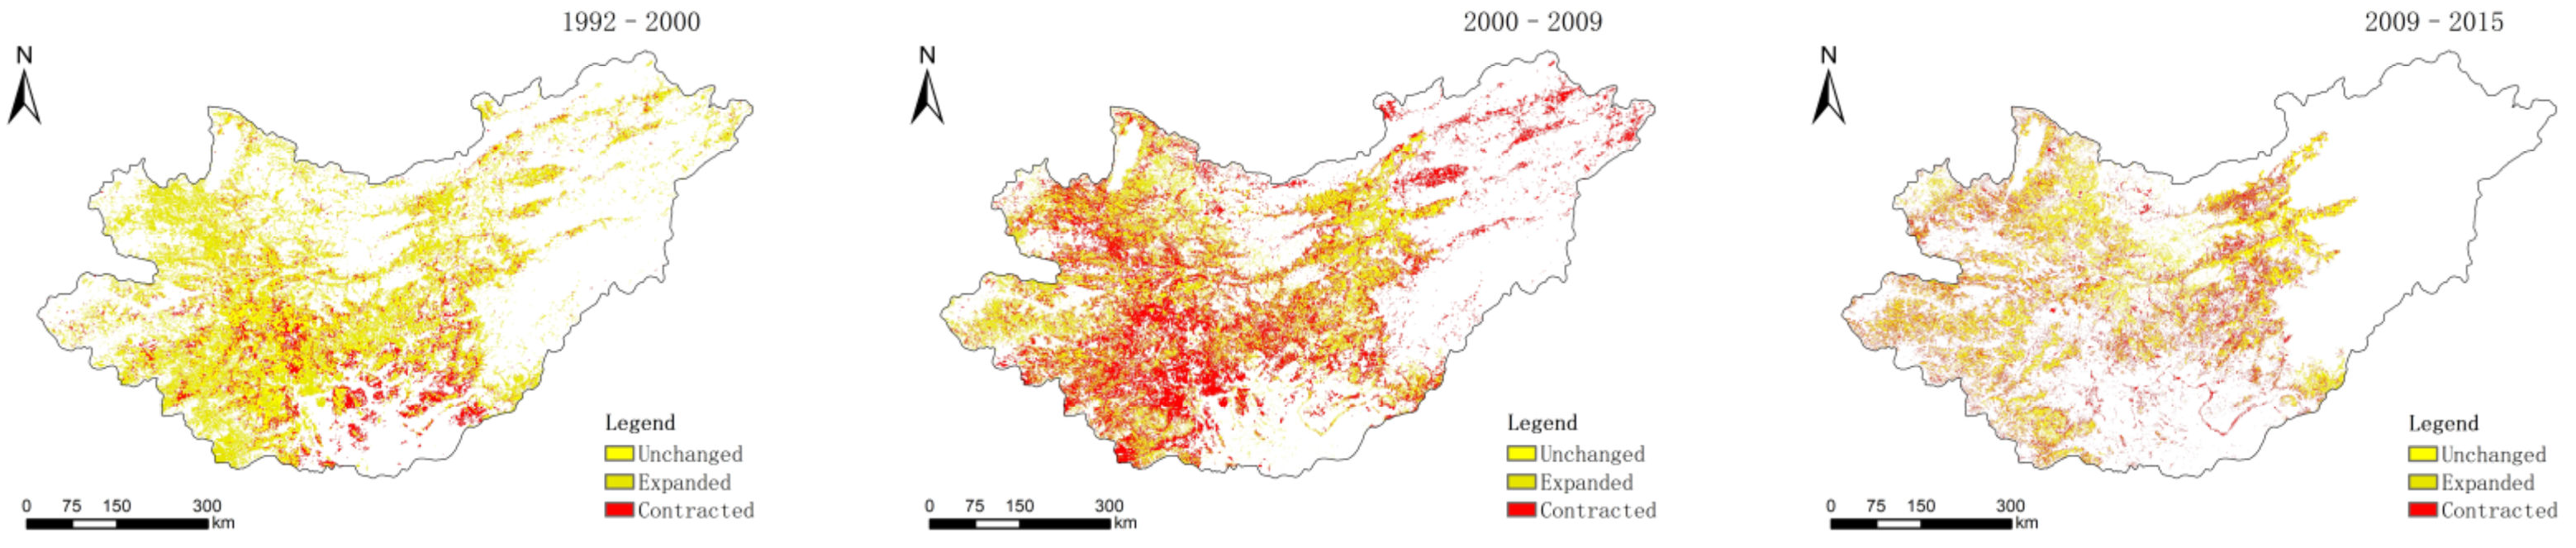
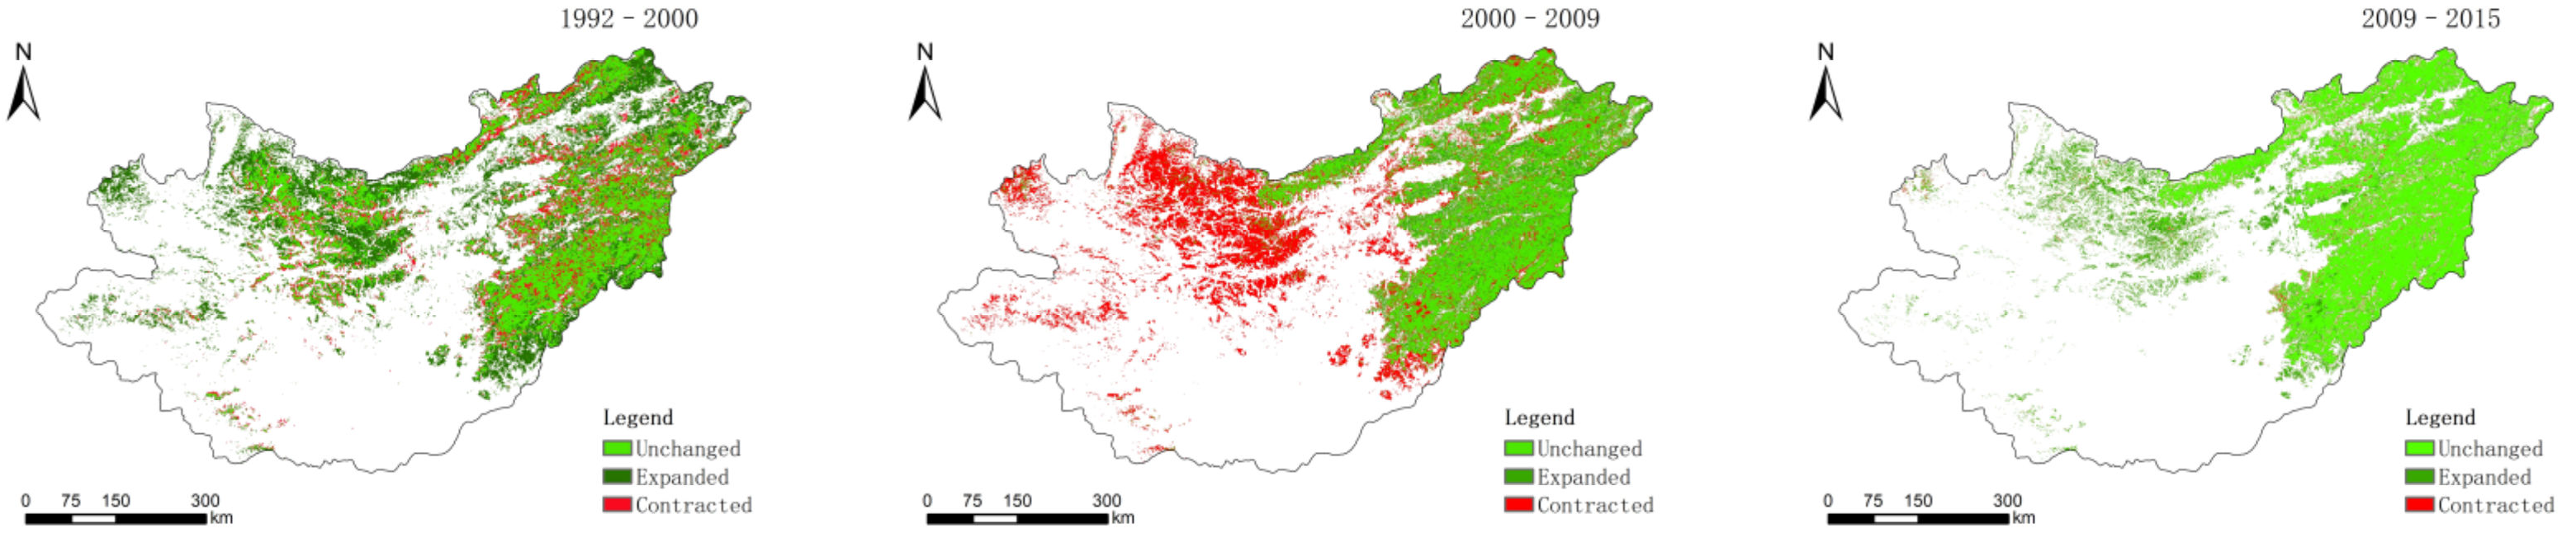
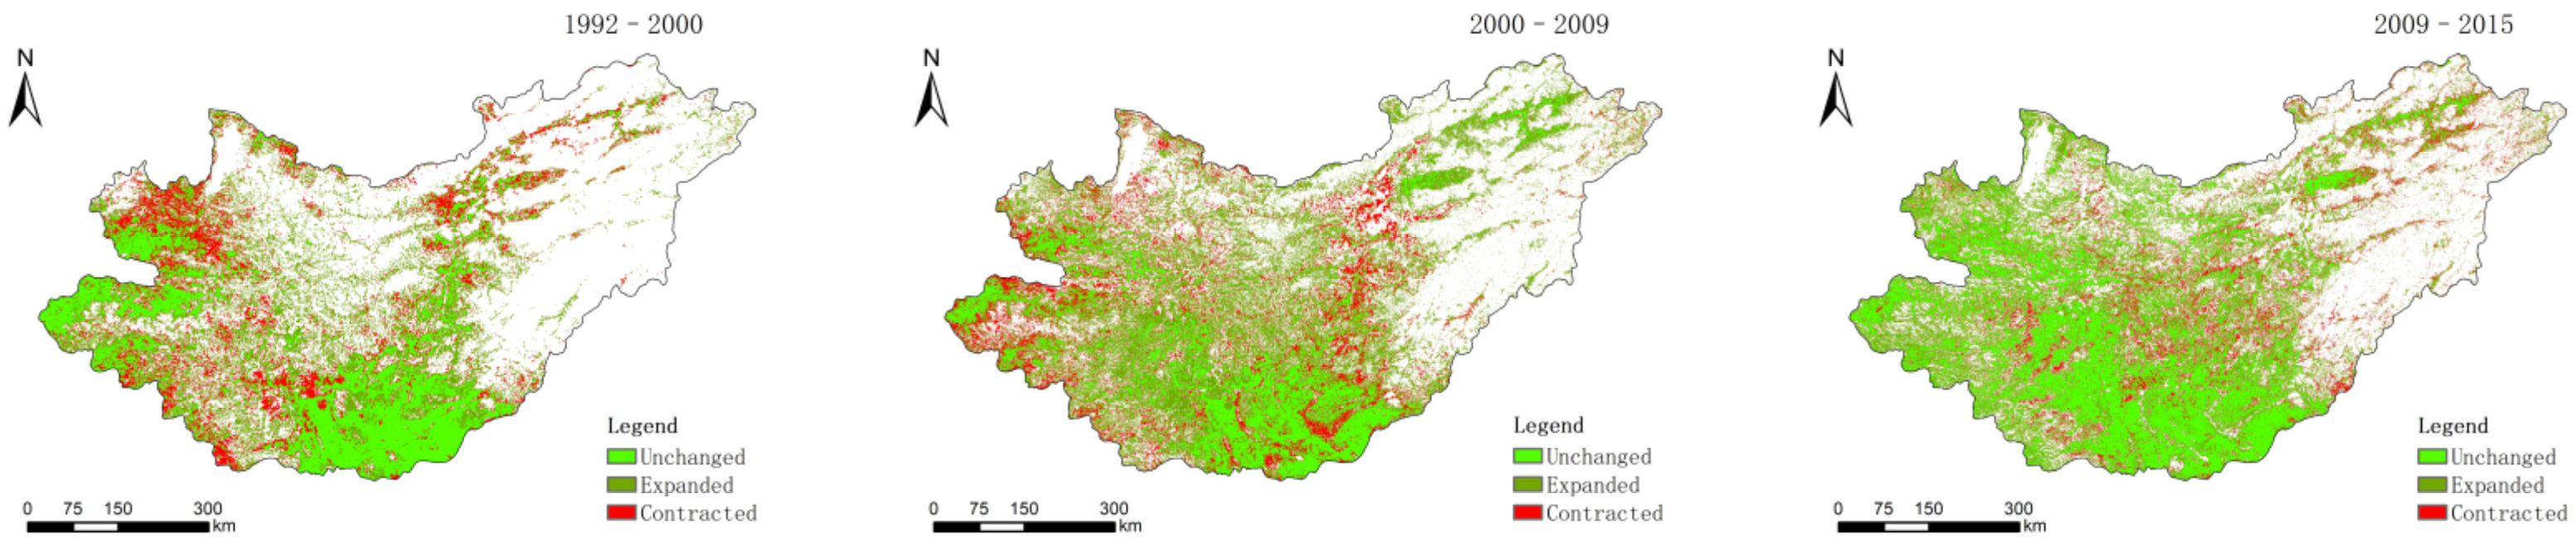
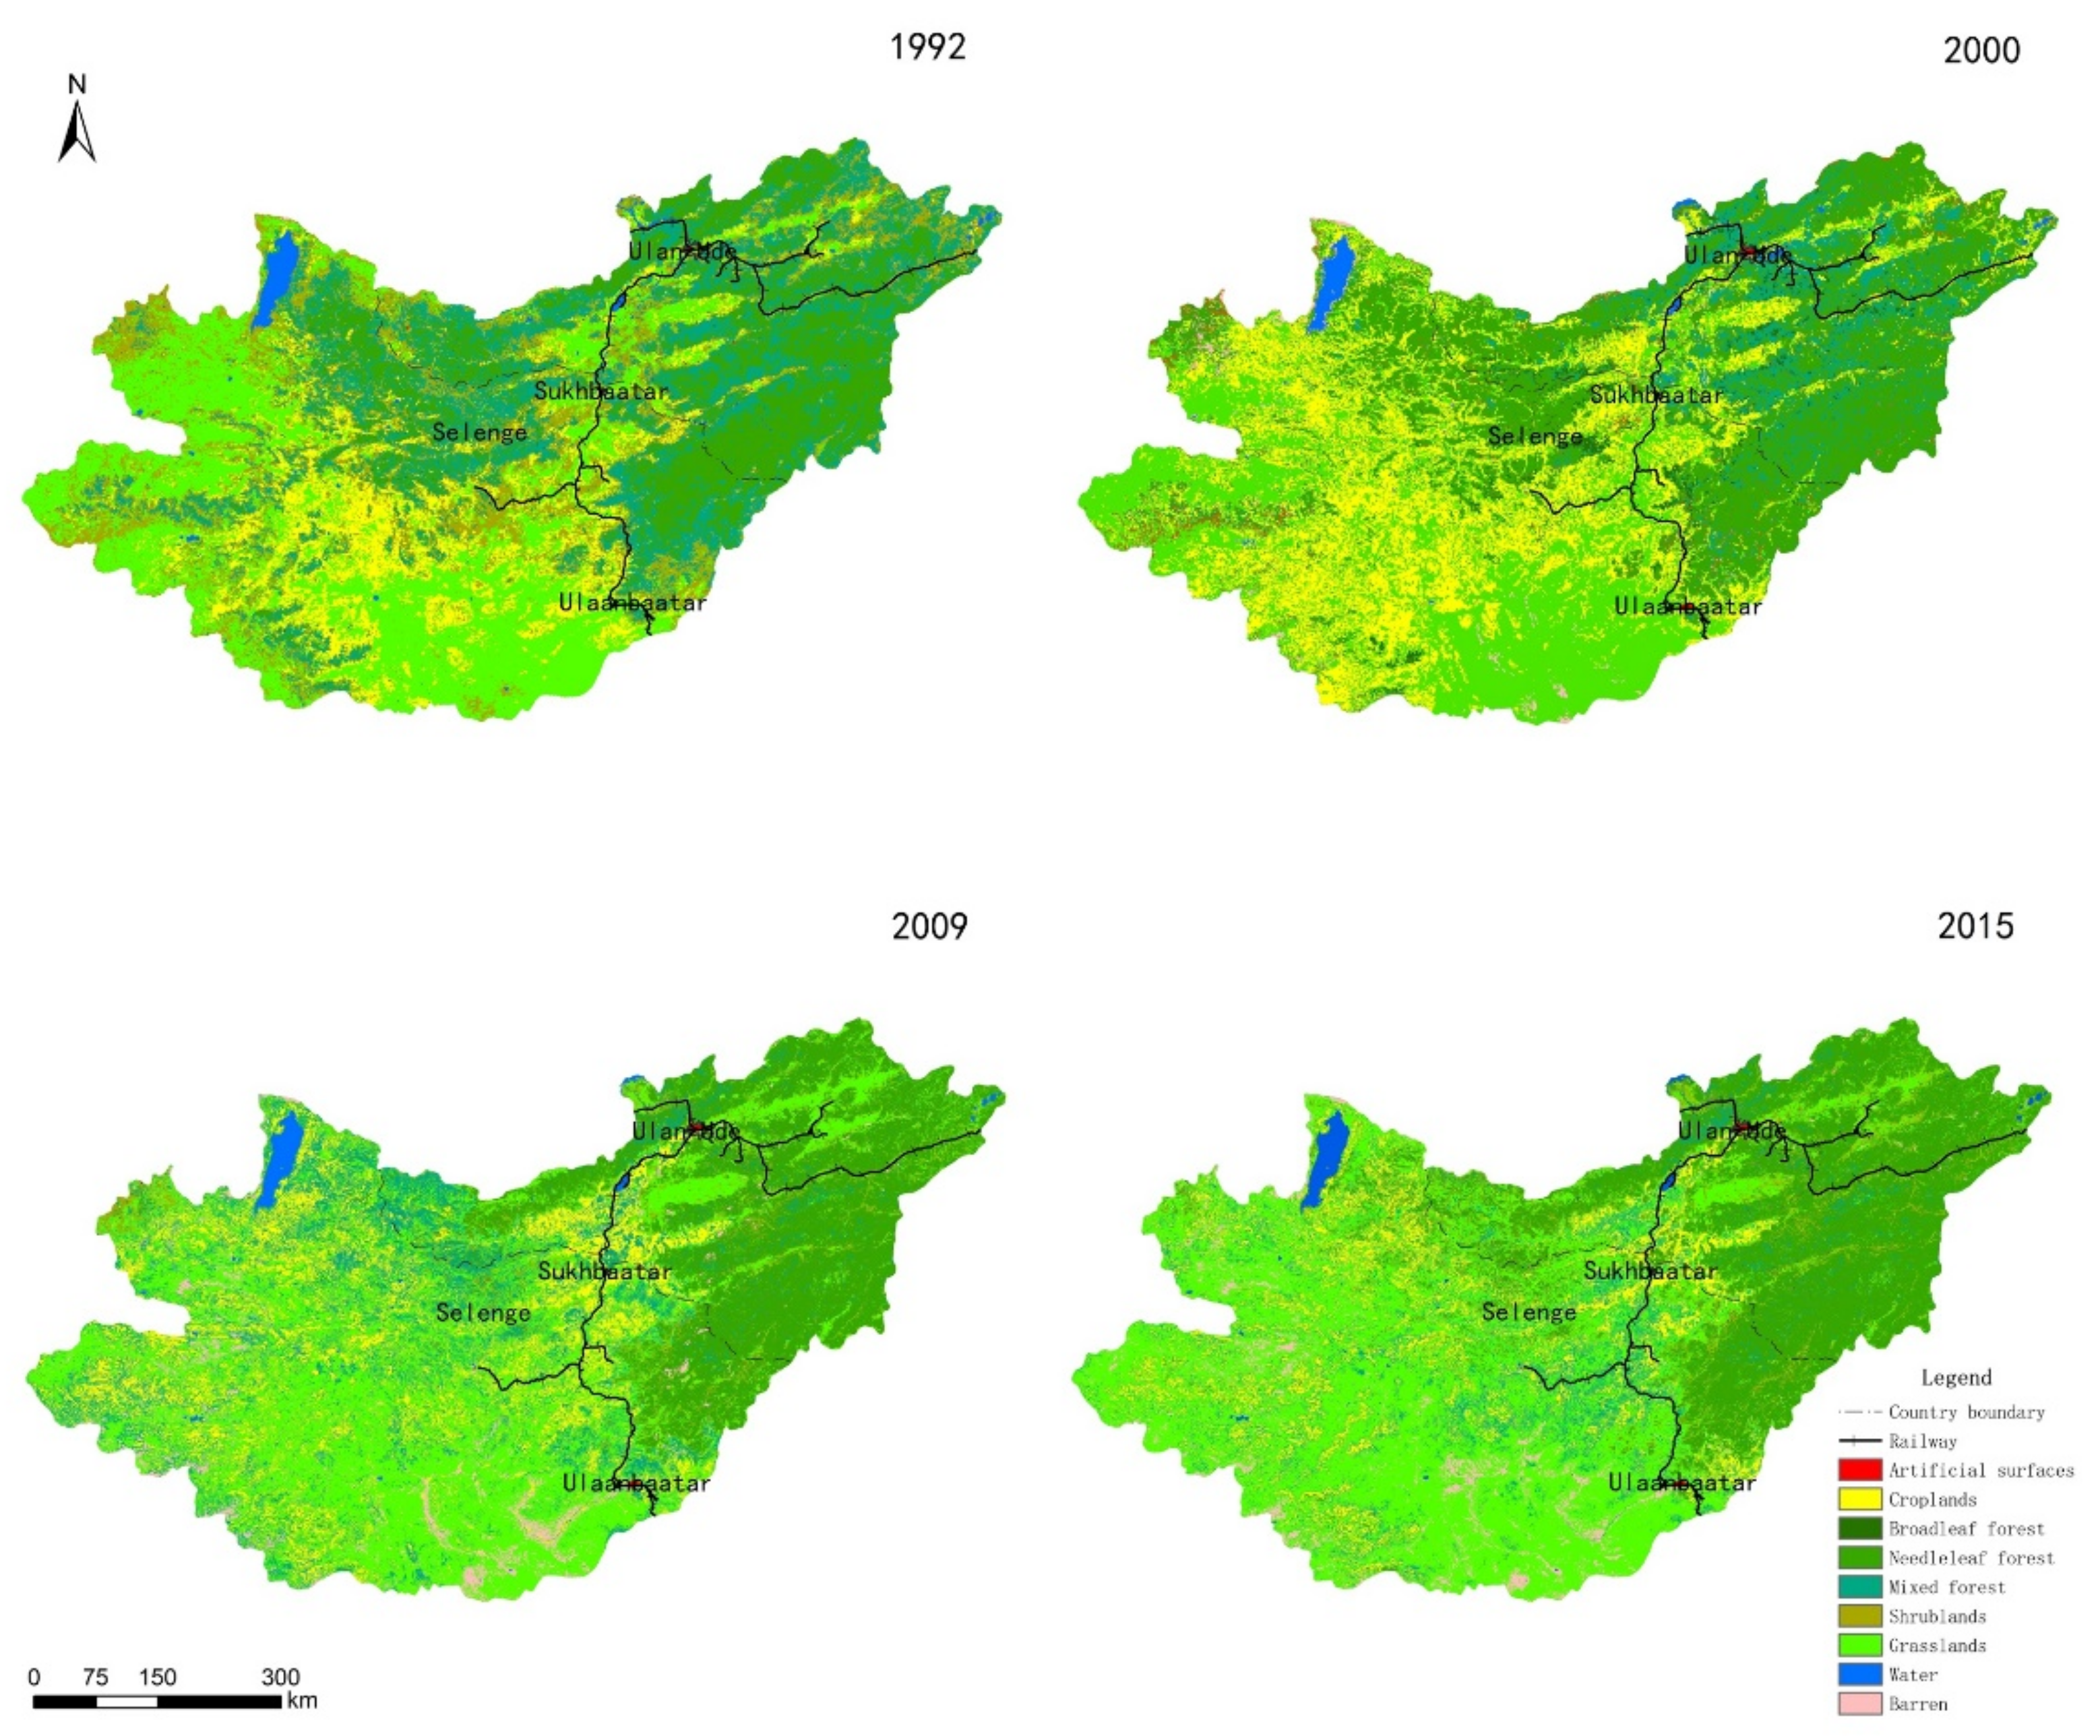
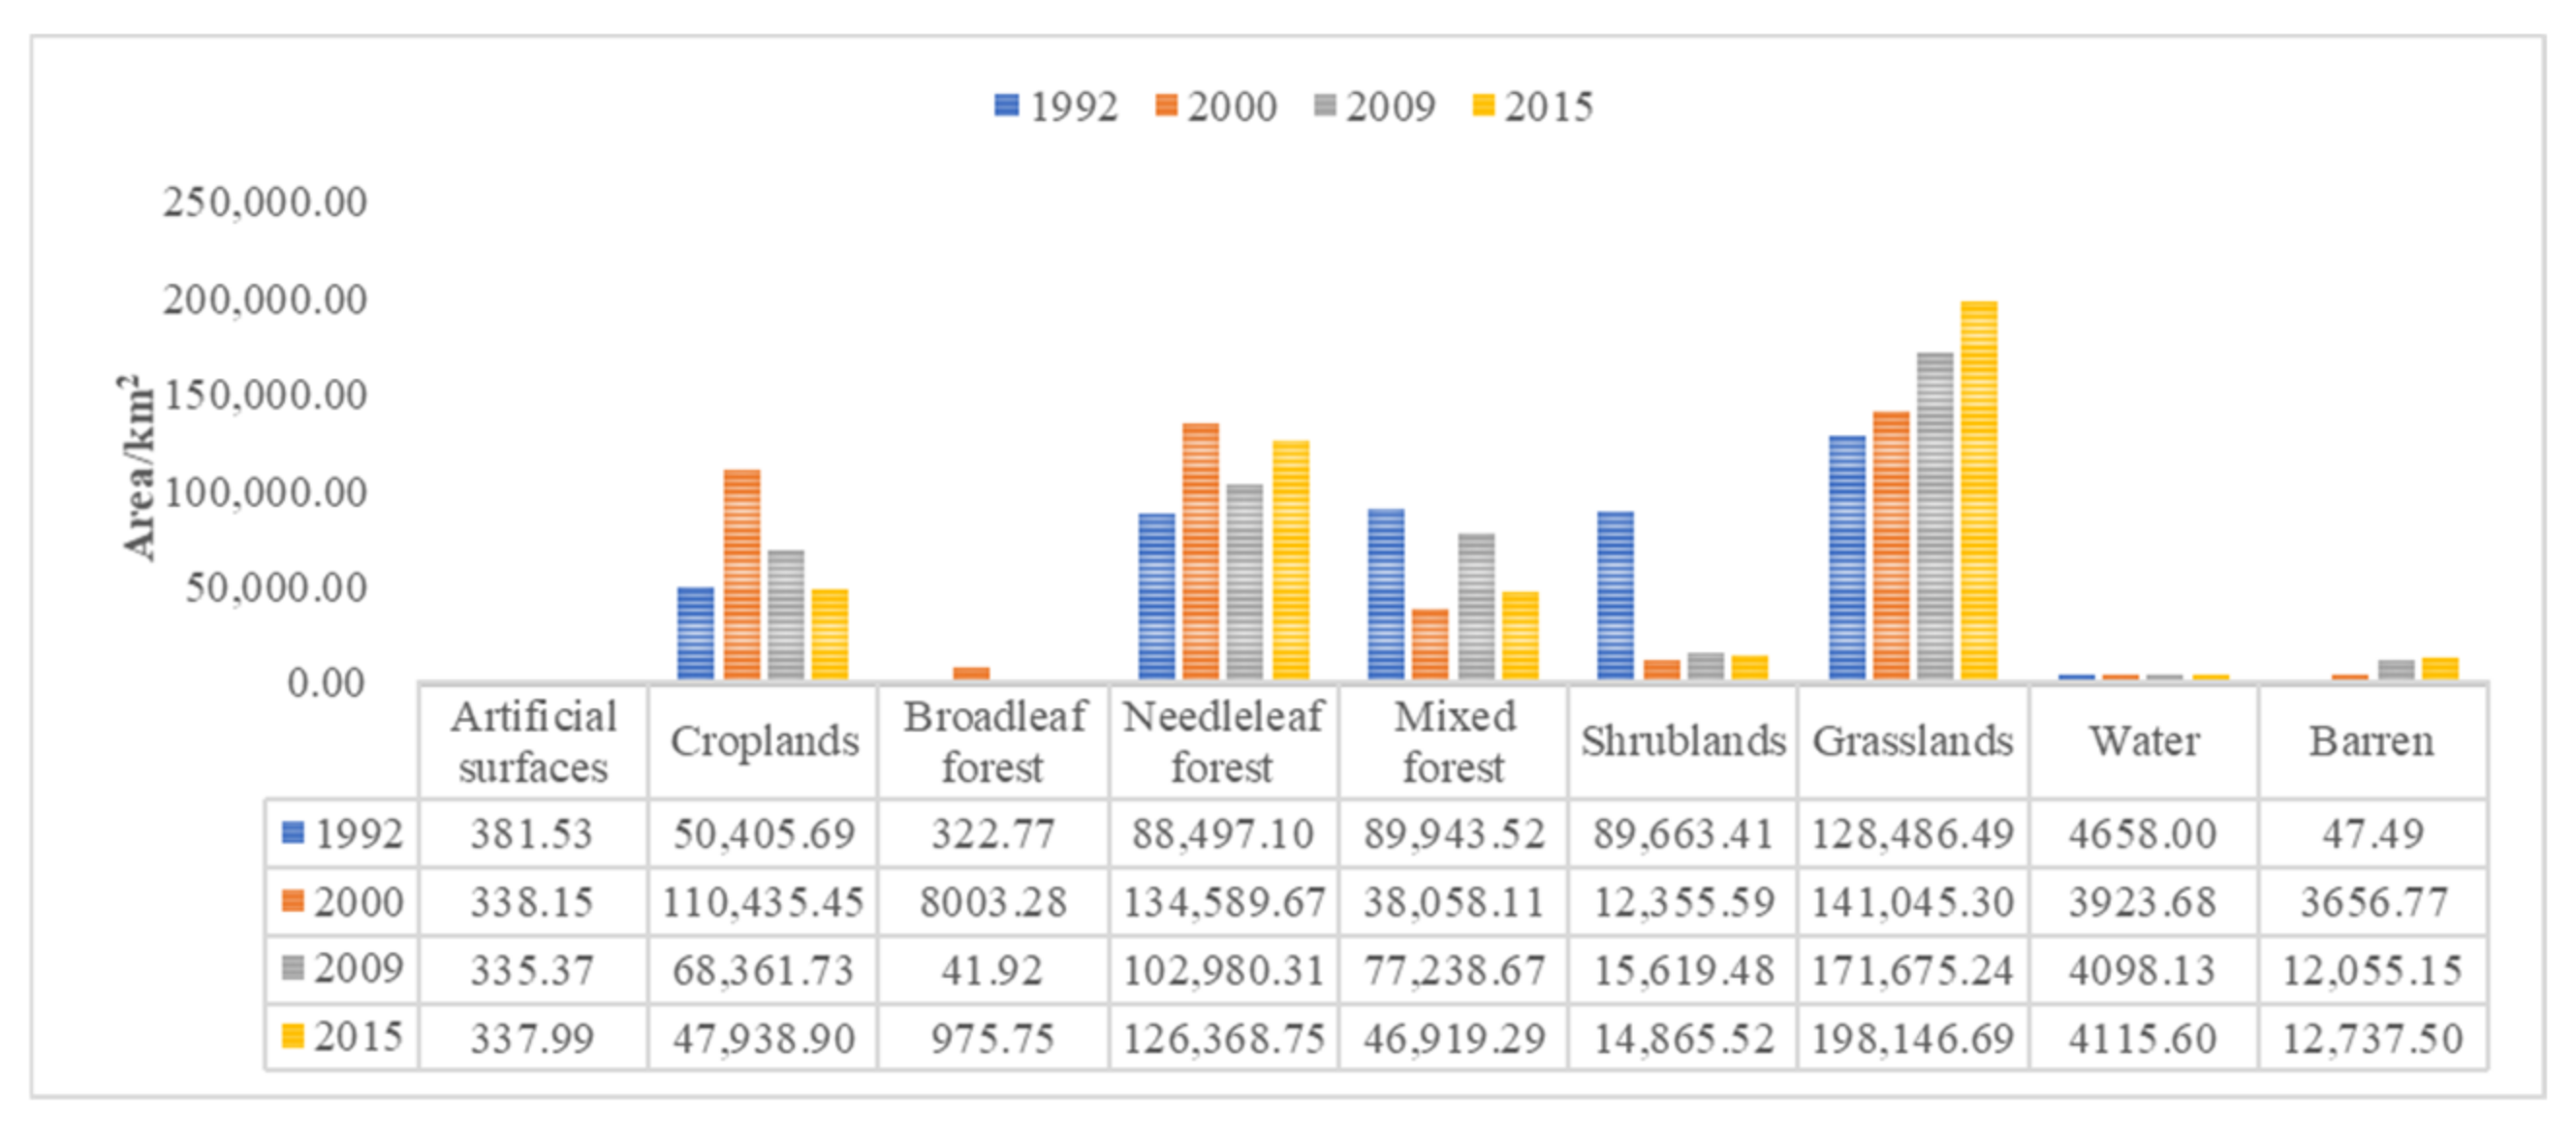
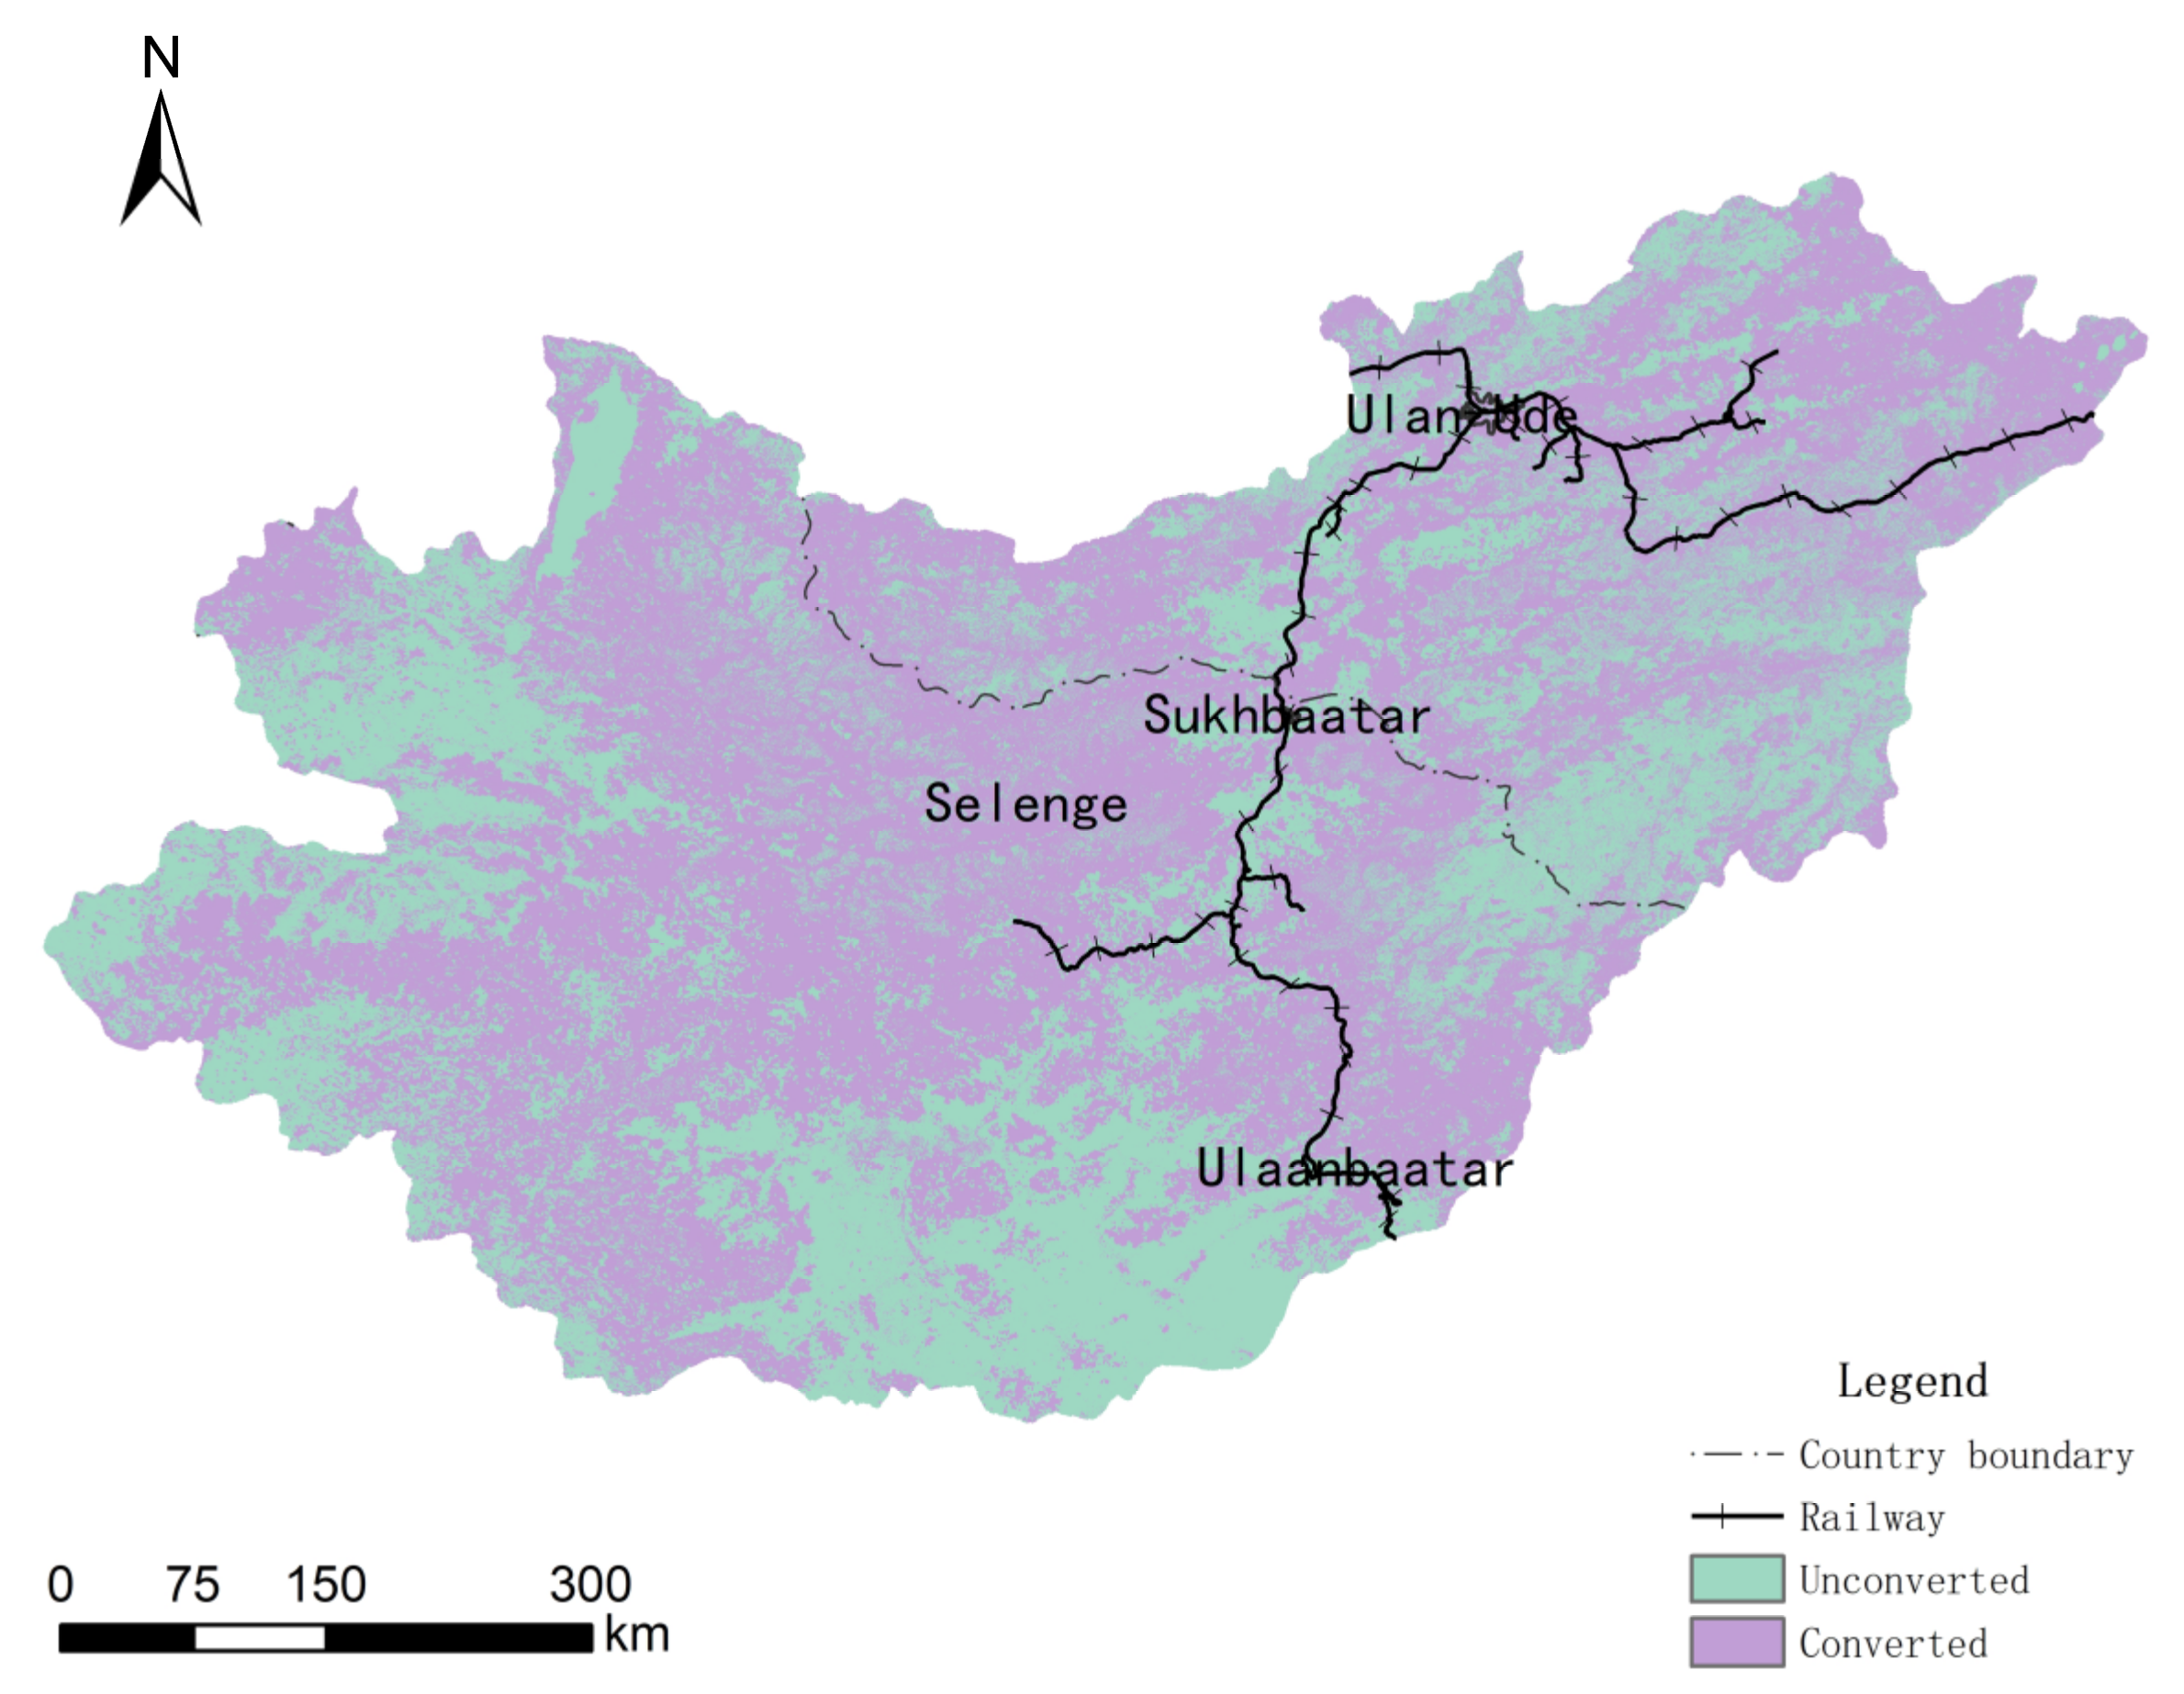
  • From 1992 to 2015, the land-use types of the basin were mainly forest and grassland, plots of the land use/cover change were mainly distributed in the central and western regions of the research region, and the area of change accounted for 38.23% of the total area of the research region. The land use/cover change had obvious spatial differences, and the land-use transfer in the regions along the traffic lines was relatively severe. The area of construction land decreased slightly from 1992 to 2000, and maintained a generally stable trend from 2000 to 2015. The area of croplands increased from 1992 to 2000 and showed a decreasing trend from 2000 to 2015. The area of forest decreased during the study period, while the area of bare land and grassland kept increasing. The area of water/wetlands is basically unchanged.
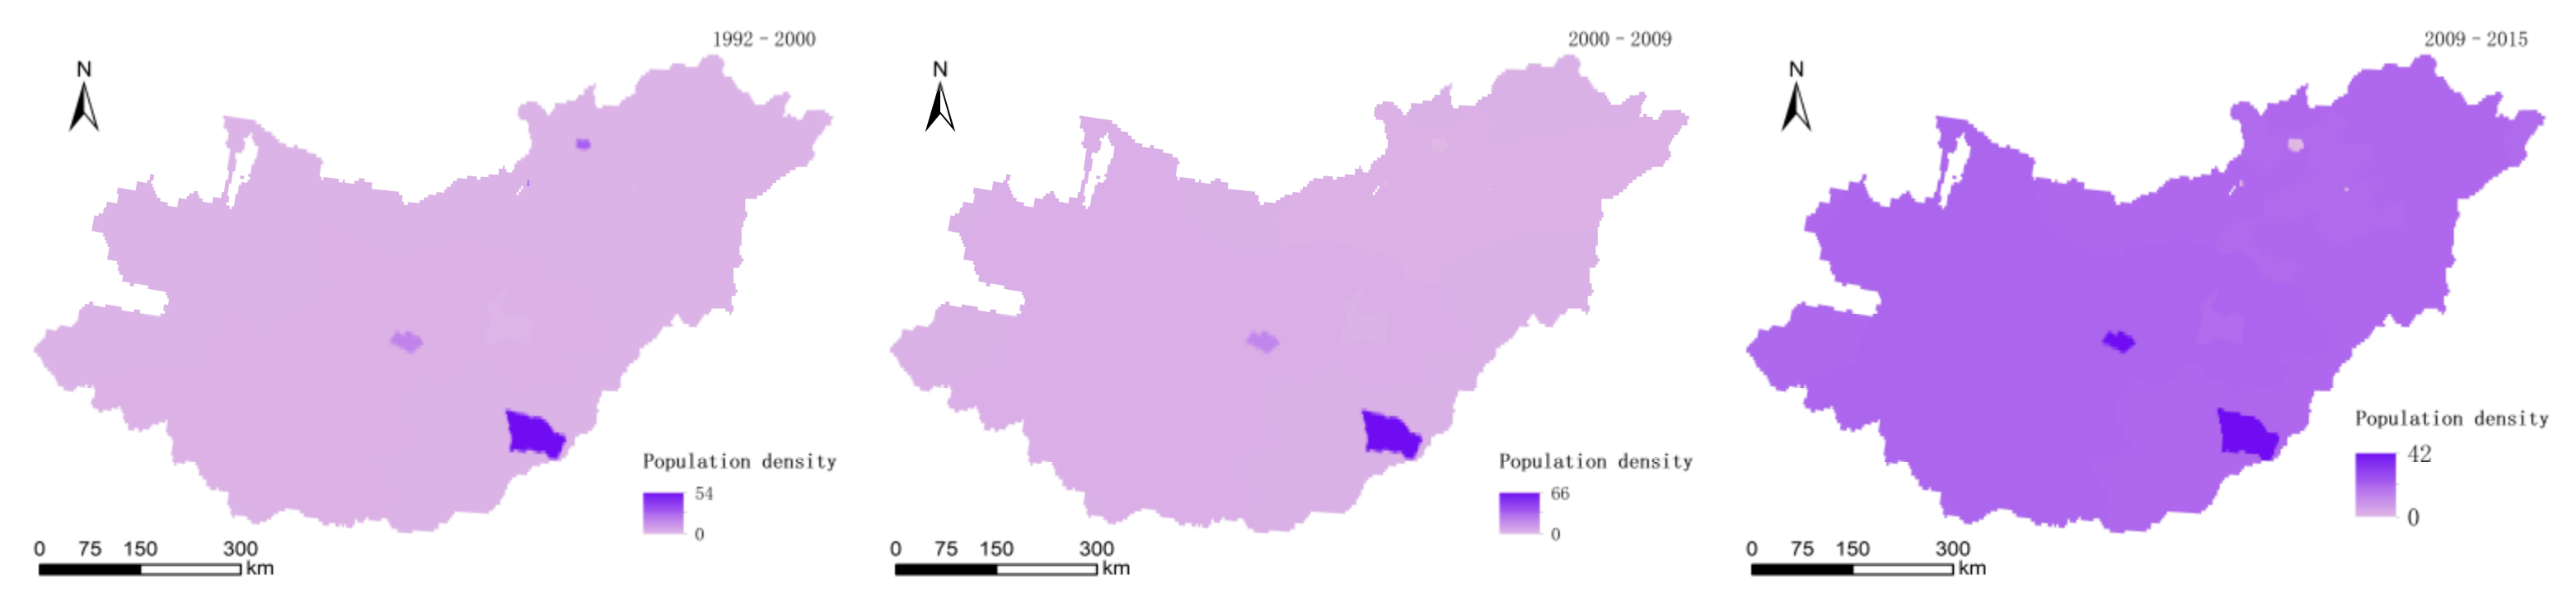
  • Mathematical models were used to quantitatively and comprehensively characterize the effects of natural and social factors on land use changes. It was found that the transformation of each land use type in the Selenge River Basin over 23 years was closely related to the changes in local temperature and precipitation over the years, while indirect factors generated by human activities also had some influence. With the rising level of urbanization within Mongolia, the farming and herding population has been decreasing, leading to a decrease in arable land area. Other drivers of arable land shrinkage are climatic factors such as decreasing precipitation, which have a significant impact on farmers’ decisions on crop selection and development areas, and climatic disasters caused by climate change, which have a serious impact on crop harvesting and arable land reclamation. In addition, cropland shrinkage is preferred in higher altitude areas, but with the deepening of human activities and global climate change, these areas are also gradually used for cropland development, thus the probability of shrinkage decreases to a certain extent; due to the cold and drought tolerant growth characteristics of coniferous forests, area expansion is more likely to occur in areas with reduced precipitation, higher temperature, and higher altitude, while less human intervention also has a certain impact; in areas with abundant precipitation and lower temperature In the early stage, the closer the distance from rivers, the more likely the expansion of grassland will occur, while in the later stage of the study, the farther the distance from water systems and traffic arteries, the more likely the expansion of grassland in areas with inactive human activities.
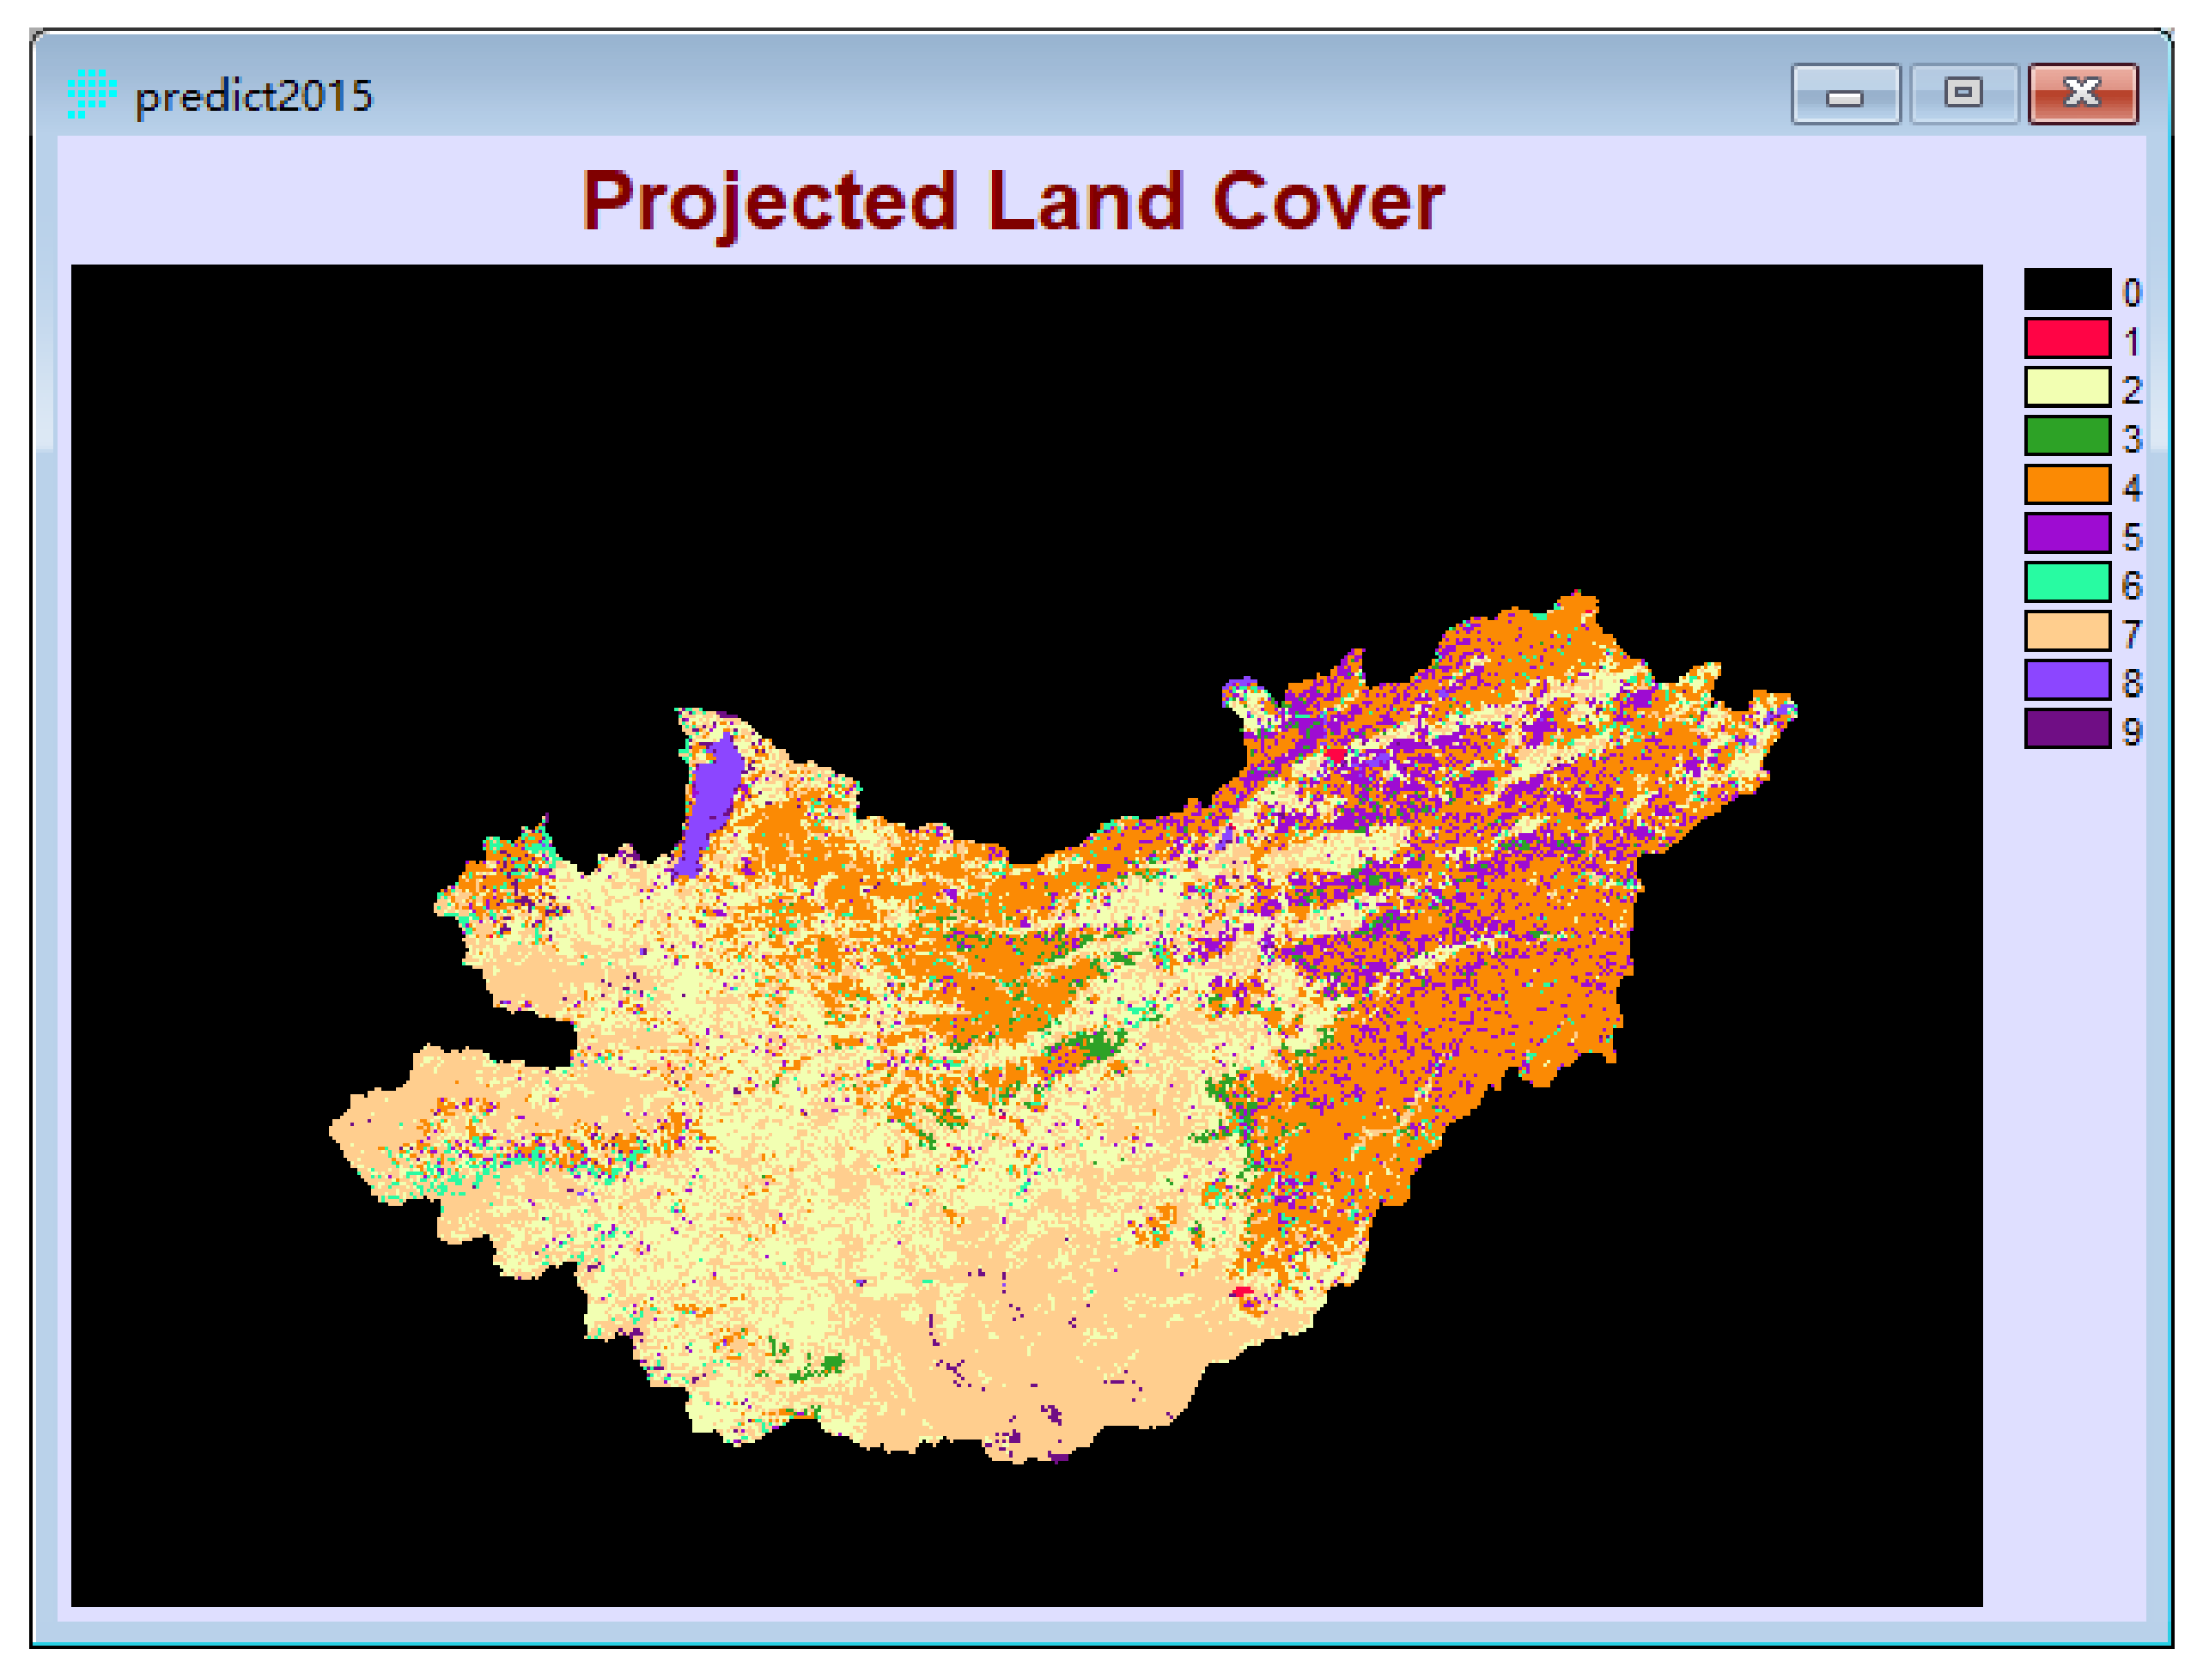
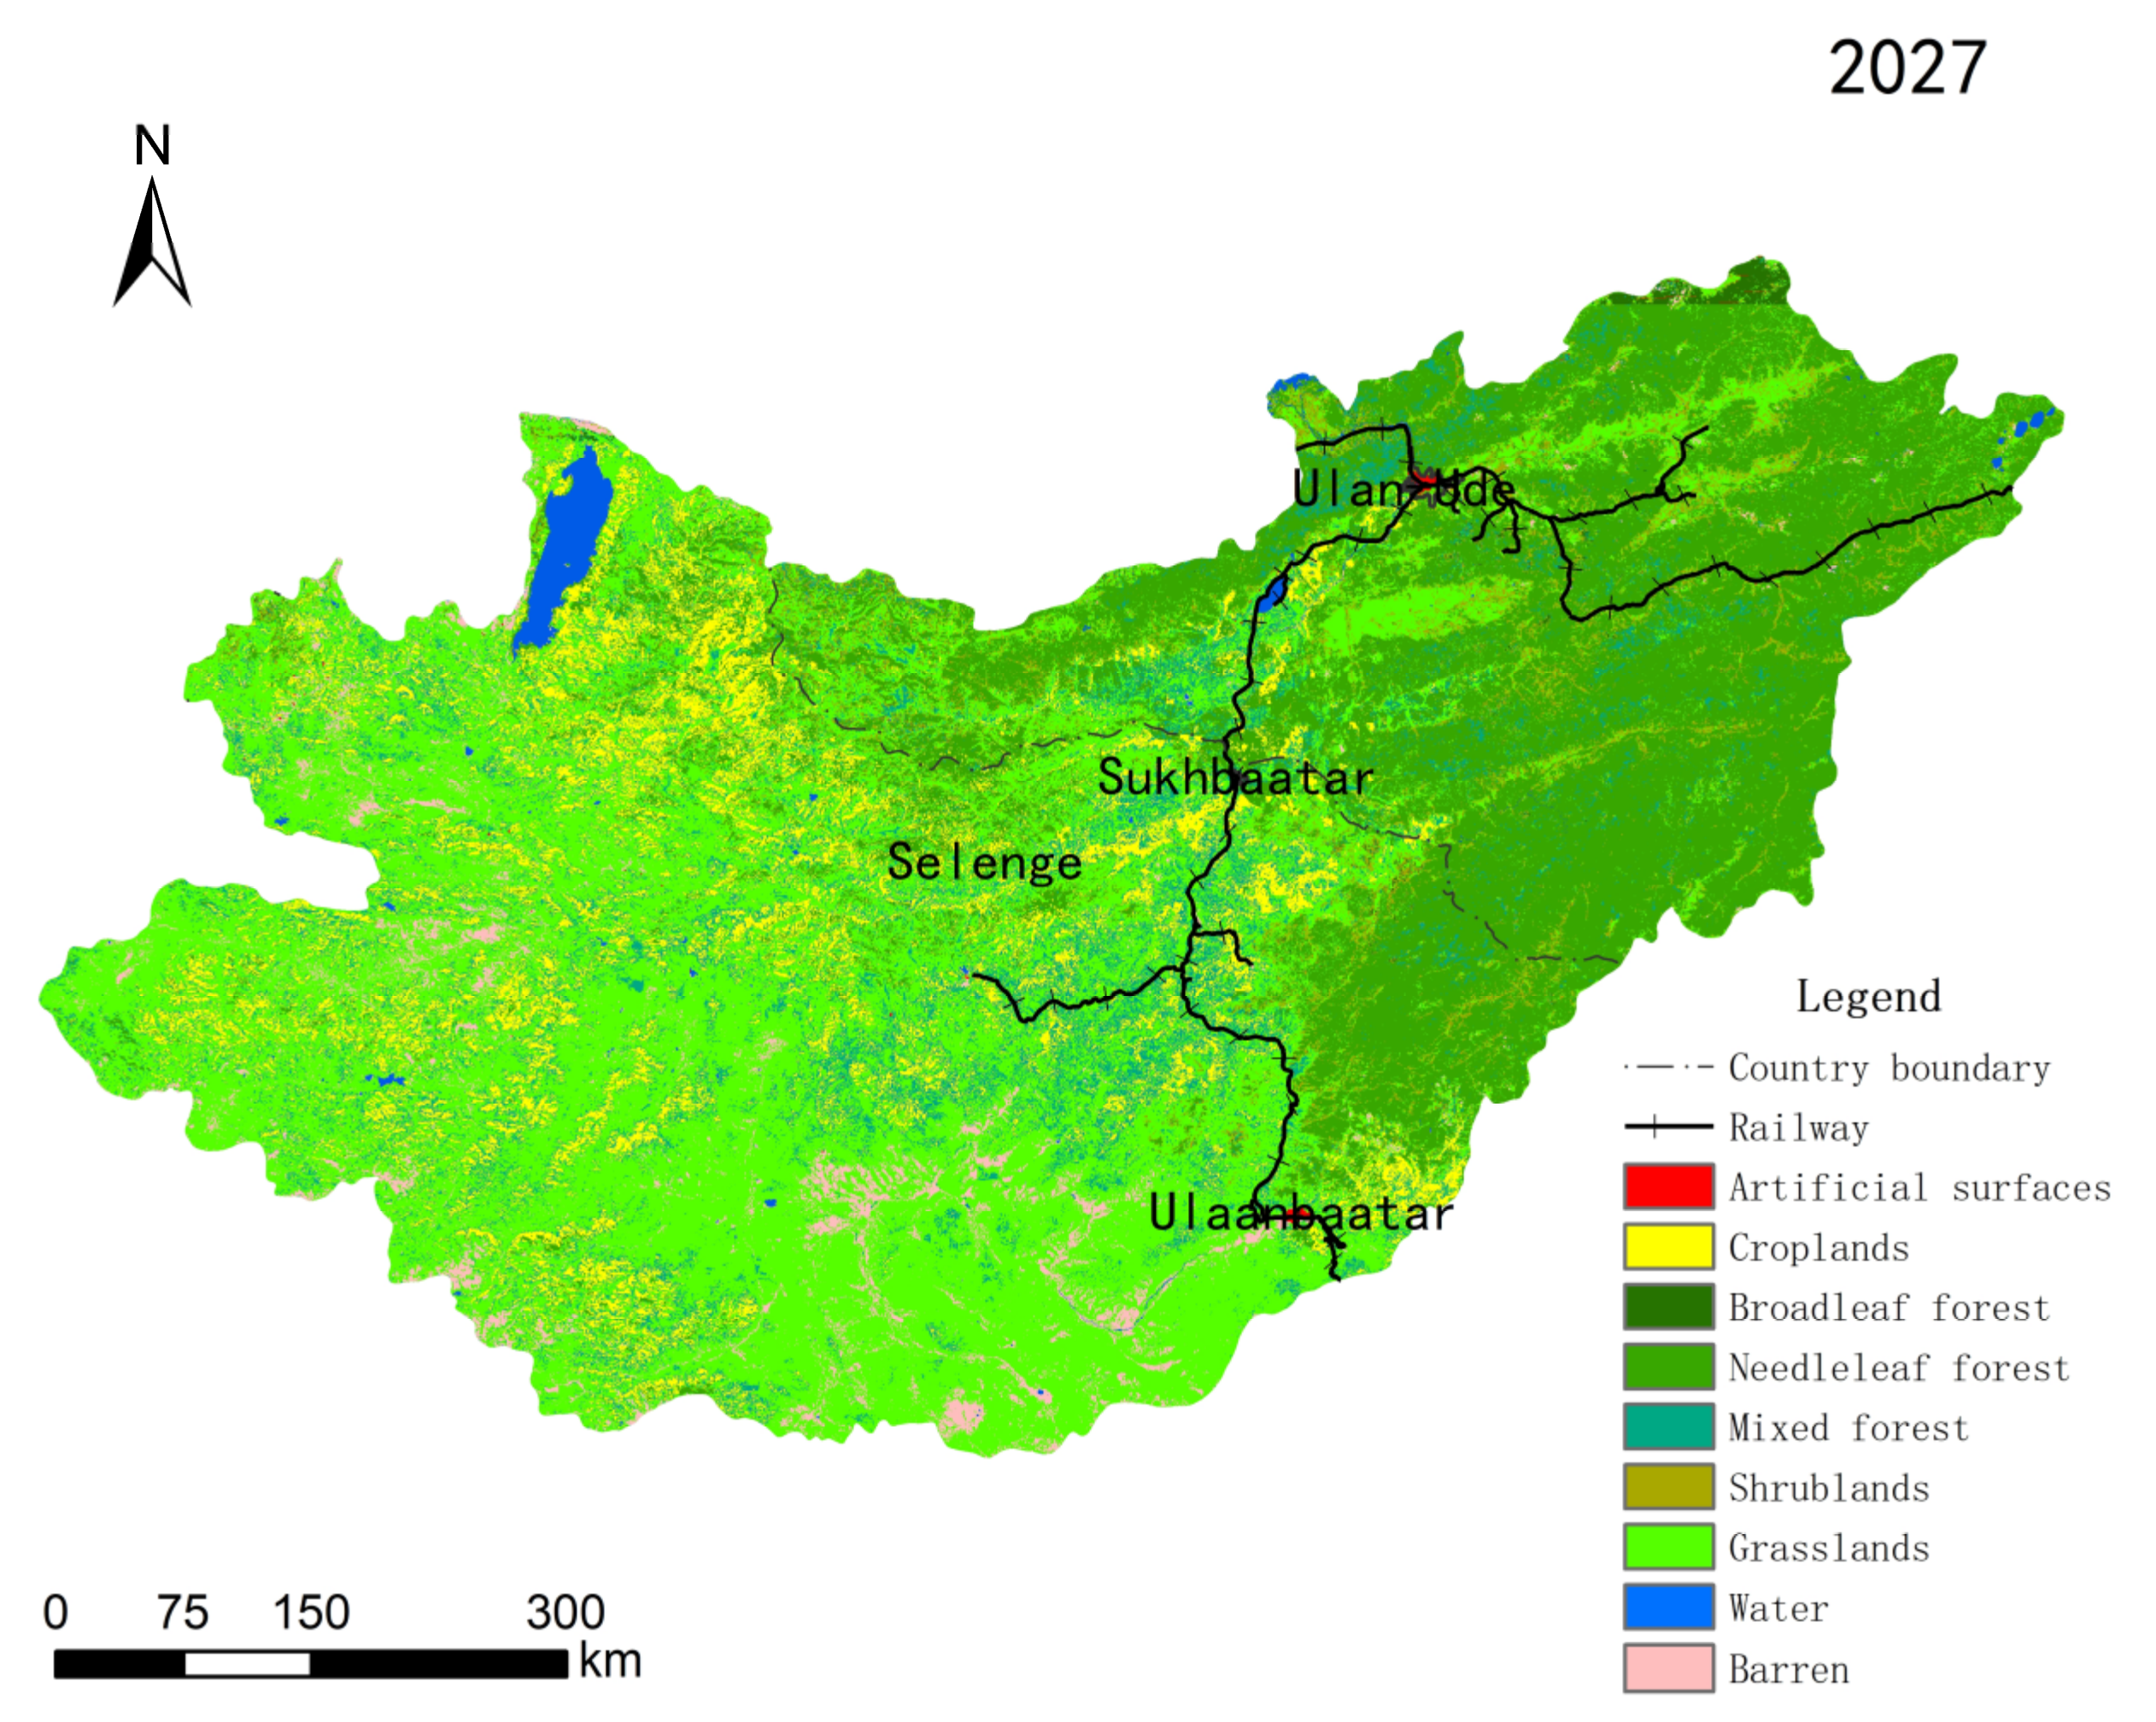
  • The CA-Markov model was used to predict the land use/cover pattern of Selenge River Basin in 2027. From the change in the number of land types, it was found that the area of construction land expanded slightly, the area of forest land remained stable, and the area of grassland decreased. In terms of spatial distribution, the area of construction land around the cities in both countries increases slightly, the area of cultivated land increases somewhat in the middle reaches of the basin, but tends to shrink in the southwest side of Mongolia and the south side of Russia, the area of forest land expands in the northeast side, and the area of grassland expands significantly in the upper and middle reaches of the basin. There is a certain expansion of water area in the delta area of Selenge River.

Author Contributions

Conceptualization, Y.R. and Z.L.; methodology, Y.R.; software, Y.R.; validation, Y.R., J.L. and Z.L.; formal analysis, J.L.; investigation, Y.R.; resources, Y.R. and Z.L.; data curation, Y.R.; writing—original draft preparation, Y.R.; writing—review and editing, Y.R., Z.L., J.L., Y.D. and X.M.; visualization, Y.R. and J.L.; supervision, Z.L.; project administration, Z.L.; funding acquisition, Z.L. All authors have read and agreed to the published version of the manuscript.

Funding

This research was funded by [Strategic Priority Research Program of the Chinese Academy of Sciences Sub-project (Class A)] grant number [XDA20030201], [Special Foundation for National Science and Technology Basic Research Program of China] grant number [2017FY101302], [National Natural Science Foundation of China Sino-Russian Cooperation and Exchange Program] grant number [42011530079], [Key Research Program of the Chinese Academy of Sciences] grant number [ZDRWZS201812].

Data Availability Statement

Not applicable.

Conflicts of Interest

The authors declare no conflict of interest.

Appendix A

Table A1. Model estimates for cultivated land expansion driving forces.
Variable1992–20002000–20092009–2015
Regression Coefficient βWaldEXP
(β)
Regression Coefficient βWaldEXP
(β)
Regression CoefficientβWaldEXP
(β)
Altitude−0.41229.7070.662−0.1997.2610.8190.3514.6761.421
Slope 1−2.3650.0000.000−2.7130.0000.000−2.0390.0000.000
Slope 2−0.5371.0370.584−0.2520.4540.777−0.2990.4170.742
Slope 3−0.1990.1440.8200.0670.0261.0700.1620.1311.176
Slope 40.1460.0761.1570.1770.1771.1930.1280.0811.136
Slope 50.4200.5491.5210.2810.4061.324−0.2360.2450.790
North slope−0.9582.1910.3840.0190.0161.0200.1320.5801.142
Northeast slope0.0090.0021.009−0.0480.0860.9530.1710.8611.186
East slope−0.0060.0010.994−0.2272.1900.7970.2752.4321.317
Southeast Slope0.2652.1541.3030.0320.0361.0330.0890.1711.093
South slope−0.0760.2120.927−0.0080.0020.9920.1840.6681.202
Southwest slope−0.1500.9100.861−0.1400.7710.8700.1060.2531.112
West slope−0.2532.3960.776−0.0740.2140.928−0.1670.6680.846
Northwest slope0.0210.0131.021−0.0260.0230.9750.2541.7691.289
Distance to river0.18725.5931.2050.0360.9031.037−0.0571.4280.944
Distance to road0.1128.0961.118−0.1158.4051.1210.0591.5761.061
Distance to railway0.1524.6311.1640.0610.5601.0630.30213.7860.739
Average annual temperature−0.695117.6580.499−0.2217.2640.802−0.1250.3740.121
Annual precipitation0.39750.5131.4880.1807.6320.8350.2357.5131.265
Population density0.0562.3711.0580.0712.9001.0730.0173.1411.017
Constant1.5998.8504.9490.3730.7781.452−0.8913.7420.410
Table A2. Model estimates for cultivated land contraction driving forces.
Variable1992–20002000–20092009–2015
Regression Coefficient βWaldEXP
(β)
Regression Coefficient βWaldEXP
(β)
Regression Coefficient βWaldEXP
(β)
Altitude0.2189.4590.804−0.0416.4621.0420.2066.4691.228
Slope 10.4290.8240.653−2.0270.0000.0001.4610.9664.309
Slope 20.8311.0280.7950.8153.8562.2590.9054.9262.471
Slope 30.8271.0150.7870.8113.8832.2500.3510.7721.421
Slope 40.5730.9220.2730.5591.8261.750−0.2360.3440.790
Slope 50.3270.5640.3860.3100.5071.363−0.3490.6820.706
North slope−2.1293.7440.1190.8771.2252.4030.5840.3971.792
Northeast slope−0.1530.4850.8580.2773.1821.3190.1250.5951.134
East slope−0.0500.0620.9510.3656.4371.4410.3565.3671.428
Southeast Slope−0.0820.1380.9220.63116.0471.8790.64813.8741.913
South slope−0.1740.7520.8400.88934.7262.4331.15042.7693.158
Southwest slope−0.2151.2880.8061.05454.3362.8691.16750.1403.212
West slope−0.2141.1800.8080.74425.6292.1040.69318.5272.000
Northwest slope−0.0330.0240.9670.4327.4671.5410.2622.4171.299
Distance to river0.0793.1631.0820.0907.2720.9140.0020.0041.002
Distance to road−0.1308.8220.878−0.0421.5750.959−0.0864.8900.918
Distance to railway−0.1956.6210.823−0.0260.1880.9740.32018.7001.377
Average annual temperature−0.11213.3180.8940.3631.0240.0540.6164.1170.540
Annual precipitation−0.24518.7640.783−0.0420.7071.0430.30915.4731.362
Population density−0.0100.0550.990−0.0090.0750.9910.14512.3051.156
Constant−0.0924.4660.912−0.2500.3510.779−0.7273.2060.483
Table A3. Model estimates for Coniferous Forest land expansion driving forces.
Variable1992–20002000–20092009–2015
Regression Coefficient βWaldEXP
(β)
Regression Coefficient βWaldEXP
(β)
Regression Coefficient βWaldEXP
(β)
Altitude−0.0040.0080.9960.3385.5310.7130.70217.7102.018
Slope 1−2.1930.0000.000−2.8440.0000.000−1.9180.0000.000
Slope 20.8649.4702.3730.8252.7022.2810.6272.9611.872
Slope 30.3681.8221.4450.6941.9502.002−0.0440.0150.957
Slope 40.2500.8331.2840.4900.9681.6330.0360.0101.037
Slope 50.2770.9381.3190.3550.4741.4260.0560.0231.058
North slope−0.1381.3990.871−0.1020.5320.903−0.0120.0070.988
Northeast slope0.0080.0051.008−0.0110.0050.9890.0350.0531.035
East slope−0.1281.1880.880−0.2542.9260.7750.1801.5101.197
Southeast Slope−0.1040.6240.9010.0140.0071.0140.1761.1501.192
South slope−0.1271.0580.8810.2242.3181.2520.2282.1641.256
Southwest slope−0.0750.4470.928−0.2012.1200.8180.2563.2651.292
West slope−0.1531.6050.858−0.0950.4080.9100.0920.3731.097
Northwest slope0.0870.4551.091−0.1300.6890.8780.0890.3191.093
Distance to river−0.1188.1910.8890.0755.1181.078−0.24847.3770.780
Distance to road−0.3122.3010.7320.18423.7290.8320.33380.5150.717
Distance to railway0.2867.5191.331−0.0884.2260.9150.50182.9371.651
Average annual temperature−0.08510.5100.9180.0561.0850.491−0.7433.2590.223
Annual precipitation0.11014.8751.1170.25944.7881.2960.87594.9582.399
Population density−0.2256.5851.252−0.0871.5630.917−0.1289.4861.137
Constant−0.1500.2800.861−1.4678.4700.231−1.56618.1220.209
Table A4. Model estimates for Coniferous Forest land contraction driving forces.
Variable1992–20002000–20092009–2015
Regression Coefficient βWaldEXP
(β)
Regression Coefficient βWaldEXP
(β)
Regression Coefficient βWaldEXP
(β)
Altitude−0.33641.2400.715−0.89647.3792.449−0.0740.7160.928
Slope 1−2.4940.0000.000−9.0390.0000.000−2.2280.0000.000
Slope 20.4651.1801.5920.7745.7892.169−1.0339.5260.356
Slope 30.3830.8351.4670.2150.4741.240−1.2755.1340.280
Slope 40.0910.0471.0960.0950.0921.100−1.65614.6620.191
Slope 50.0010.0001.0010.0890.0751.093−1.3187.7460.268
North slope−0.1090.4610.896−0.2723.7490.7620.7580.4442.133
Northeast slope0.0660.1521.068−0.1030.4730.9030.2040.4601.227
East slope−0.0220.0190.9780.2733.8321.3140.0580.0351.059
Southeast Slope0.2241.6511.2510.2983.6811.3470.1240.1351.132
South slope0.3895.8281.4750.3746.5741.4540.93111.1792.537
Southwest slope0.0390.0651.0400.47312.4901.6050.5023.3571.651
West slope−0.0280.0290.9730.1761.5021.1920.1320.1821.141
Northwest slope0.0910.2631.095−0.0060.0020.9940.0000.0001.000
Distance to river−0.0140.1530.986−0.25117.1900.7780.0270.1921.028
Distance to road−0.24612.9760.782−0.35631.0190.7010.0030.0021.003
Distance to railway0.16010.9861.173−1.13361.3953.105−0.32020.9581.378
Average annual temperature0.35167.8301.4200.6737.1420.5480.5785.1320.367
Annual precipitation−0.13738.0970.872−1.23063.4123.423−0.31919.7541.375
Population density−0.0220.2250.9780.1689.5411.183−0.0946.0520.910
Constant−1.2418.2420.289−0.5683.0350.566−1.79614.8830.166
Table A5. Model estimates for Coniferous grassland expansion driving forces.
Variable1992–20002000–20092009–2015
Regression Coefficient βWaldEXP
(β)
Regression Coefficient βWaldEXP
(β)
Regression Coefficient βWaldEXP
(β)
Altitude0.0020.0001.002−0.18020.2070.835−0.1077.0360.899
Slope 1−1.7120.0000.000−2.9420.0000.000−2.8760.0000.000
Slope 2−0.3421.1520.710−1.3359.6040.263−0.99915.0480.368
Slope 3−0.0410.0170.960−0.7853.3360.456−0.7769.2810.460
Slope 40.4071.6271.502−0.2800.4210.755−0.5544.6160.575
Slope 50.3731.2001.452−0.3030.4600.738−0.6094.9870.544
North slope0.0480.0051.0490.9201.4792.5080.5580.9631.748
Northeast slope0.0560.1641.058−0.1361.0110.873−0.0520.1720.949
East slope0.0340.0701.034−0.1681.8500.845−0.0980.7330.907
Southeast Slope−0.1160.7090.890−0.0610.2190.941−0.2293.6430.795
South slope−0.1952.2810.823−0.1150.8850.892−0.2665.6030.766
Southwest slope−0.1962.5360.822−0.1521.7130.859−0.35510.9030.701
West slope−0.1020.6210.903−0.1411.3160.869−0.3519.4900.704
Northwest slope0.0730.2831.076−0.1641.5180.849−0.1521.4670.859
Distance to river−0.11517.3440.891−0.0150.3720.9850.0120.2471.012
Distance to road0.1874.3871.2060.300105.3791.3500.13533.1611.145
Distance to railway−0.1124.4610.8940.577175.6120.5620.0552.0280.946
Average annual temperature0.10043.4841.1050.7435.6170.4610.2393.7850.257
Annual precipitation0.652221.7951.9180.552235.5660.576−0.38397.7930.682
Population density−0.0341.5090.966−0.08110.7940.922−0.05025.0451.052
Constant−0.0940.0840.9101.1096.3793.0310.4362.6651.547
Table A6. Model estimates for Coniferous grassland contraction driving forces.
Variable1992–20002000–20092009–2015
Regression Coefficient βWaldEXP
(β)
Regression Coefficient βWaldEXP
(β)
Regression Coefficient βWaldEXP
(β)
Altitude0.0520.8571.053−0.08173.4140.922−0.3903.3730.677
Slope 1−1.7420.0000.000−3.0840.0000.000−2.2560.0000.000
Slope 2−0.3541.2760.702−1.92723.0380.146−0.9787.7230.376
Slope 3−0.0640.0430.938−1.71418.4140.180−0.3561.0420.701
Slope 40.2960.8921.344−1.2729.9950.2800.0740.0451.077
Slope 50.2200.4261.246−1.1427.4460.319−0.2490.4480.780
North slope0.2540.1331.2901.2082.9173.3450.1690.0651.184
Northeast slope−0.1200.6900.887−0.2623.6680.7690.1180.7211.126
East slope−0.1691.5910.844−0.3206.3820.726−0.3045.4070.738
Southeast Slope−0.0800.3190.923−0.4289.9650.652−0.3948.1590.674
South slope−0.2262.8980.798−0.51716.5860.596−0.52616.3970.591
Southwest slope−0.2253.1800.798−0.65629.0170.519−0.69631.5640.498
West slope−0.2934.6990.746−0.42311.0630.655−0.69027.1830.502
Northwest slope−0.1120.5930.894−0.3004.8610.741−0.0720.2670.931
Distance to river−0.0624.2800.9400.0462.9771.0470.0250.8481.025
Distance to road0.0310.9741.0320.15531.8191.167−0.07658.0781.079
Distance to railway0.1811.1201.198−0.38859.4260.678−0.42081.0660.657
Average annual temperature−0.0659.0581.067−0.4873.2910.8540.5395.7320.386
Annual precipitation−0.7989.1562.220−0.604153.9220.547−0.462130.9460.630
Population density0.0380.0301.039−0.0010.0010.9990.0130.2781.013
Constant−0.1980.3170.8211.71217.6675.542−0.2000.3070.819

References

  1. Turner, B.L., II; Skole, D.; Sanderson, S.; Fischer, G.; Fresco, L.; Leemans, R. Land Use and Land Cover Change Science/Research Plan; IGBP Report No.35 and HDP Report No.7; IGBP: Stockholm, Sweden, 1995. [Google Scholar]
  2. Li, X. International research trends in land use/land cover change, a core area of global environmental change research. J. Geogr. 1996, 51, 553–558. [Google Scholar]
  3. Yu, X.; Yang, G. Current status and problems of land use/cover change research in China. Adv. Geogr. Sci. 2002, 21, 51–57. [Google Scholar]
  4. Feng, Z.; Liu, Y. Review and prospect of land resources research. Resour. Sci. 2004, 26, 2–10. [Google Scholar]
  5. Mondal, A.; Khare, D.; Kundu, S.; Mishra, P. Detection of Land Use Change and Future Prediction with Markov Chain Model in a Part of Narmada River Basin, Madhya Pradesh. Landsc. Ecol. Water Manag. 2014, 2, 3–14. [Google Scholar]
  6. Yang, Y.; Wang, J. Comprehensive Scientific Survey Data Set of Northern CHINA and Its Adjacent Areas; Science Press: Beijing, China, 2016. [Google Scholar]
  7. Kai, C.; Juanle, W.; Davaadorj, J.; Xuehua, H. Urban expansion and its driving force analysis in Ulaanbaatar, Mongolia in the past 30 years. Remote Sens. Technol. Appl. 2019, 34, 90–100. [Google Scholar]
  8. Zhu, L.; Wang, J.; Darbalaeva, D.; Beshentsev, A. Research on Driving Mechanism of Land Cover Change in Transbaikal. Geomat. Spat. Inf. Technol. 2012, 35, 30–33. [Google Scholar]
  9. Atutov, A.A.; Pronin, N.M.; Tulokhonov, A.K. Gidroenergetikia i Sostoyanie Ekosistemy Ozera Baikal (Hydropower and the State of the Ecosystem of Lake Baikal); Izd. SO, RAN: Novosibirsk, Russia, 1999. [Google Scholar]
  10. Zhao, H. The Republic of Buryatia on Lake Baikal. Sib. Stud. 1994, 4, 30–35. [Google Scholar]
  11. Frolova, N.L.; Belyakova, P.A.; Grigor’ev, V.Y.; Sazonov, A.A. Many-year variations of river runoff in the Selenga basin. Water Resour. 2017, 44, 359–371. [Google Scholar] [CrossRef]
  12. Dalai, B.; Ishiga, H. Geochemical evaluation of present-day Tuul river sediments, Ulaanbaatar basin. Mong. Environ. Monit. Assess. 2013, 185, 2869–2881. [Google Scholar] [CrossRef] [PubMed]
  13. Kida, M.; Myangan, O.; Oyuntsetseg, B.; Khakhinov, V.; Kawahigashi, M.; Fujitake, N. Dissolved organic matter distribution and its association with colloidal aluminum and iron in the Selenga River Basin from Ulaanbaatar to Lake Baikal. Environ. Sci. Pollut. Res. Int. 2018, 25, 1–10. [Google Scholar] [CrossRef]
  14. Wang, J.; Jia, S.; Zhu, L. Construction of Resource and Environment Science Expedition Data Resources Integration System in Northeast Asia. J. Geo-Inf. Sci. 2012, 14, 74–80. [Google Scholar] [CrossRef]
  15. Zhu, L. Comparative Study on the Ecological Impact of Transbaikal LUCC and Typical Urban Landscape; University of Chinese Academy of Sciences: Beijing, China, 2013. [Google Scholar]
  16. Hutchinson, M.F. The Application of thin plate smoothing splines to continent-wide data assimilation, Data Assimilation Systems, BMRC Research Report NO.27. Melb. Bur. Meteorol. 1991, 27, 104–113. [Google Scholar]
  17. Zhihong, L.; Tim, R.M.; Lingtao, L. Spatial interpolation of time series meteorological elements based on ANUSPLIN. J. Northwest Sci-Tech Univ. Agric. For. 2008, 36, 227–234. [Google Scholar]
  18. Hiller, B.T.; Jadamba, N. Groundwater Use in the Selenge River Basin, Mongolia. J. Groundw. Sci. Eng. 2013, 1, 11–32. [Google Scholar]
  19. Cui, D.; Wu, D.; Liu, J.; Xiao, Y.; Yembuu, B.; Adiya, Z. Understanding urbanization and its impact on the livelihood levels of urban residents in Ulaanbaatar, Mongolia. Growth Change 2019, 50, 745–774. [Google Scholar] [CrossRef]
  20. Ekimovskaya, O.A.; Belozertseva, I.A.; Amgalan, S.E.; Badmaev, N.B. Economic-geographical characteristics of agricultural land use within the Selenga river basin. IOP Conf. Ser. Earth Environ. Sci. 2018, 190, 012019. [Google Scholar] [CrossRef]
  21. Sanders, A.J.K.; Harris, C.D.; Lattimore, O. Mongolia. In Encyclopedia Britannica; Encyclopædia Britannica, Inc.: Chicago, IL, USA, 2021. [Google Scholar]
  22. Yekimovskaya, O.A.; Lopatina, D.N. The features of development of agricultural land use in the Republic of Buryatia and Mongolia (the Selenga River basin). IOP Conf. Ser. Earth Environ. Sci. 2019, 320, 012007. [Google Scholar] [CrossRef]
  23. Mun, Y.; Ko, I.H.; Janchivdorj, L.; Gomboev, B.; Kang, S.I.; Lee, C.H. Integrated Water Management Model on the Selenga River Basin—Status Survey and Integration (Phase I); Korea Environment Institute: Seoul, Korea, 2008. [Google Scholar]
  24. Priess, J.; Schweitzer, C.; Wimmer, F.; Batkhishig, O.; Mimler, M. The consequences of land-use change and water demands in Central Mongolia. Land Use Pol. 2011, 28, 4–10. [Google Scholar] [CrossRef]
  25. Minderlein, S.; Menzel, L. Evapotranspiration and energy balance dynamics of a semi-arid mountainous steppe and shrubland site in northern Mongolia. Env. Earth Sci. 2015, 73, 593–609. [Google Scholar] [CrossRef]
  26. Kasimov, N.; Karthe, D.; Chalov, S. Environmental change in the Selenga River—Lake Baikal Basin. Reg. Environ. Change 2017, 17, 1945–1949. [Google Scholar] [CrossRef]
  27. Törnqvist, R.; Jarsjö, J.; Pietroń, J.; Bring, A.; Rogberg, P.; Asokan, S.M.; Destouni, G. Evolution of the hydro-climate system in the Lake Baikal basin. J. Hydrol. 2014, 519, 1953–1962. [Google Scholar] [CrossRef] [Green Version]
  28. Belozertseva, I.A.; Ekimovskaya, O.A.; Enkhtayvan, D. Agricultural land use and land degradation in the Selenga river basin. Adv. Curr. Nat. Sci. 2016, 2, 142–147. [Google Scholar]
  29. Jun, G.; Yongfei, X.; Xueyang, A.; Aoxue, W.; Chunxiang, H. Analysis of ecologically sensitive areas in the China-Mongolia-Russia Economic Corridor under the background of “One Belt, One Road”. J. Ecol. 2019, 14, 41–47. [Google Scholar]
  30. Zhao, R. The status and role of ecological protection in the construction of China-Mongolia-Russia economic corridor. China Econ. Trade J. 2018, 5, 22–24. [Google Scholar]
  31. Suocheng, D.; Yijia, L.; Fujia, L.; Jingwen, L.; Yu, L.; Zehong, L.; Hao, C.; Guoyu, L.; Shengyu, L. Ecological risk zoning and countermeasures for the construction of transportation and pipelines in the China-Mongolia-Russia Economic Corridor. J. Chin. Acad. Sci. 2021, 36, 141–149. [Google Scholar]
  32. Merghadia, A.; Yunusb, A.P.; Doucd, J.; Whiteley, J.; ThaiPham, B.; TienBui, D.; Avtar, R.; Abderrahmane, B. Machine learning methods for landslide susceptibility studies: A comparative overview of algorithm performance. Earth-Sci. Rev. 2020, 207, 103225. [Google Scholar] [CrossRef]
  33. Sardooi, E.R.; Azareh, A.; Mesbahzadeh, T.; Sardoo, F.S.; Parteli, E.J.R.; Pradhan, B. A hybrid model using data mining and multi-criteria decision-making methods for landslide risk mapping at Golestan Province, Iran. Environ. Earth Sci. 2021, 80, 1–25. [Google Scholar]
Figure 1. The location of the Selenga River basin.
Sensors 22 01041 g001
Figure 2. Distribution of cultivated land changes in 1992–2000, 2000–2009, and 2009–2015.
Sensors 22 01041 g002
Figure 3. Distribution of coniferous forest land changes in 1992–2000, 2000–2009, and 2009–2015.
Sensors 22 01041 g003
Figure 4. Distribution of grassland changes in 1992–2000, 2000–2009, and 2009–2015.
Sensors 22 01041 g004
Figure 5. Elevation, slope, and aspect raster data in the basin.
Sensors 22 01041 g005
Figure 6. Raster data on distance to rivers, roads, railways.
Sensors 22 01041 g006
Figure 7. Precipitation in 1992–2000, 2000–2009, and 2009–2015.
Sensors 22 01041 g007
Figure 8. Average temperatures in 1992–2000, 2000–2009, and 2009–2015.
Sensors 22 01041 g008
Figure 9. Population density changes in 1992–2000, 2000–2009, 2009–2015.
Sensors 22 01041 g009
Figure 10. Random sampling points.
Sensors 22 01041 g010
Figure 11. Land use Prediction in 2015.
Sensors 22 01041 g011
Figure 12. Land use/cover map of the Selenga River basin in 1992, 2000, 2009 and 2015.
Sensors 22 01041 g012
Figure 13. Classification and statistics of land use/cover patterns in the Selenga River basin.
Sensors 22 01041 g013
Figure 14. Distribution of transformed/untransformed plots in 1992–2015.
Sensors 22 01041 g014
Figure 15. Cultivated land, forest land, and grassland conversion map of the Selenga River basin in 1992–2015.
Sensors 22 01041 g015
Figure 16. Land use prediction in the 2027 Selenga River basin.
Sensors 22 01041 g016
Table 1. Classification and Description of Land Use/Cover in the Selenga River Basin.
ClassDescription
Artificial surfacesMainly include urban and rural areas, industrial and mining regions, transportation and other construction lands.
CroplandsLand mainly covered by crops that do not require irrigation or seasonal irrigation or crops that require periodic irrigation (mainly rice), including indistinguishable vegetation mosaic types containing farmland.
Broadleaf forestLand covered by evergreen or seasonally deciduous broad-leaved trees.
Needleleaf forestLand covered by evergreen or seasonally deciduous conifers.
Mixed forestLand covered by broad-leaved and conifer trees with a coverage of 25–75% for each species.
ShrublandsWoody vegetation, height between 0.3–5 m.
GrasslandsLand covered by more than 15% herbaceous plants.
WaterMainly include rivers, lakes, reservoirs, and areas that are periodically submerged by water.
BarrenMainly refers to the surface almost no vegetation cover or vegetation is relatively sparse.
Table 2. Comparison of land use classification systems.
This Article Class CodeUmd 1992 Land Cover Data SetGLCC 2000Glob Cover 2009FROM-GLC 2015
CodeClassCodeClassCodeClassCodeClass
111Croplands17Mosaic: Cropland/Tree Cover/Other natural vegetation11Post-flooding or irrigated croplands (or aquatic)11Rice paddy
18Mosaic: Cropland/Shrub and/or grass cover14Rainfed croplands12Greenhouse
16Cultivated and managed areas20Mosaic cropland (50–70%)/vegetation (grassland/shrubland/forest) (20–50%)13Other Cropland
14Orchard
15Bare farmland
214Urban and Built-Up22Artificial surfaces and associated areas190Artificial surfaces and associated areas (Urban areas > 50%)80Impervious surface
32Evergreen Broadleaf Forest1Tree Cover, broadleaved, evergreen40Closed to open (>15%) broadleaved evergreen or semi-deciduous forest (>5 m)21Broadleaf, leaf-on
4Deciduous Broadleaf Forest2Tree Cover, broadleaved, deciduous, closed50Closed (>40%) broadleaved deciduous forest (>5 m)22Broadleaf, leaf-off
3Tree Cover, broadleaved, deciduous, open60Open (15–40%) broadleaved deciduous forest/woodland (>5 m)
160Closed to open (>15%) broadleaved forest regularly flooded (semi-permanently or temporarily)—Fresh or brackish water
41Evergreen Needleleaf Forest4Tree Cover, needle-leaved, evergreen70Closed (>40%) needleleaved evergreen forest (>5 m)23Needleleaf, leaf-on
3Deciduous Needleleaf Forest5Tree Cover, needle-leaved, deciduous90Open (15–40%) needleleaved deciduous or evergreen forest (>5 m)24Needleleaf, leaf-off
55Mixed Forest6Tree Cover, mixed leaf type30Mosaic vegetation (grassland/shrubland/forest) (50–70%)/cropland (20–50%)25Mixed leaf, leaf-on
6Woodlands7Tree Cover, regularly flooded, fresh water100Closed to open (>15%) mixed broadleaved and needleleaved forest (>5 m)26Mixed leaf, leaf-off
8Tree Cover, regularly flooded, saline water
9Mosaic: Tree Cover/Other natural vegetation
10Tree Cover, burnt
67Wooded Grasslands/Shrublands11Shrub Cover, closed-open, evergreen110Mosaic forest or shrubland (50–70%)/grassland (20–50%)41Shrubland, leaf-on
8Closed Bushlands or Shrublands12Shrub Cover, closed-open, deciduous130Closed to open (>15%) (broadleaved or needleleaved, evergreen or deciduous) shrubland (<5 m)42Shrubland, leaf-off
9Open Shrublands15Regularly flooded shrub and/or herbaceous cover170Closed (>40%) broadleaved forest or shrubland permanently flooded—Saline or brackish water71Shrub and brush tundra
710Grasslands13Herbaceous Cover, closed-open120Mosaic grassland (50–70%)/forest or shrubland (20–50%)31Pasture
14Sparse herbaceous or sparse shrub cover140Closed to open (>15%) herbaceous vegetation (grassland, savannas or lichens/mosses)32Natural grassland
150Sparse (<15%) vegetation33Grassland, leaf-off
180Closed to open (>15%) grassland or woody vegetation on regularly flooded or waterlogged soil—Fresh, brackish or saline water72Herbaceous tundra
80Water20Water Bodies210Water bodies51Marshland
52Mudflat
53Marshland, leaf-off
60Water
912Barren19Bare Areas200Bare areas90Bareland
21Snow and Ice220Permanent snow and ice101Snow
102Ice
Table 3. Driving factors system.
VariableDescriptionUnitSource
TopographyAltitudeElevationmDEM
SlopeThe degree of steepness of the surface unit°DEM
AspectThe degree of acceptance of sunlight-DEM
NeighborhoodThe distance to the riverHuman turbulencemVector
The distance to the roadHuman turbulencemVector
The distance to the railwayHuman turbulencemVector
MeteorologyAverage annual temperatureMultiyear average temperatureCRU
Annual precipitationMultiyear precipitationmmCRU
SocietyPopulation densityHuman activitypeople/km2NASA
Table 4. Suitability constraints for changes in construction land, cultivated land, forest land and grassland.
ClassSlopeAspectThe Distance to the RailwayThe Distance to the RiverThe Distance to the Road
Artificial surfaces1–23–811–31
Croplands1–23–81–41–31–2
Forest1–33–71–21–41–3
Grasslands1–32–81–51–31–2
Table 5. Land Use Transfer Matrix of Selenga River Basin from 1992 to 2015. Unit: km2.
1992Artificial SurfacesCroplandsBroadleaf ForestNeedleleaf ForestMixed ForestShrublandsGrasslandsWaterBarren
2015
Artificial surfaces82.4715.950.533.331.9241.15168.663.7413.7
Croplands6.684505.3451.48757.118711.32881.8137,079.0253.281020.64
Broadleaf forest01.3258.8689.2130.5212.63149.910.670.26
Needleleaf forest1.255331.52273.5566662.514729.213465.2510,325.6440.01144.16
Mixed forest36.2437.816649.2646,452.410,900.395094.6722,348.0282.02300
Shrublands35.18183.164120.5416,203.6712,828.8116,871.9939,469.03262.961821.17
Grasslands180.579633.5369.112516.1115,185.461872.593,250.9210.0111,261.12
Water10.46113.924.02348.5974.698.28395.913521.6681.6
Barren 00.78000.360.662.4611.1117.32
Publisher’s Note: MDPI stays neutral with regard to jurisdictional claims in published maps and institutional affiliations.

