Article

Cesium Lead Bromide Nanocrystals: Synthesis, Modification, and Application to O2 Sensing

1
Department of Chemical and Materials Engineering, Chang Gung University, Taoyuan City 33302, Taiwan
2
Department of Materials Engineering, Ming Chi University of Technology, New Taipei City 24301, Taiwan
3
School of Engineering, Brown University, Providence, RI 02912, USA
4
Department of Pediatrics, Division of Neonatology, Chang Gung Memorial Hospital, Taoyuan City 33305, Taiwan
*
Authors to whom correspondence should be addressed.
Sensors 2022, 22(22), 8853; https://doi.org/10.3390/s22228853
Submission received: 20 October 2022 / Revised: 8 November 2022 / Accepted: 14 November 2022 / Published: 16 November 2022
(This article belongs to the Special Issue Frontiers in Tactile Sensors)

Abstract

:
The fluorescence intensity of inorganic CsPbBr3 (CPB) perovskite nanocrystals (NCs) decreases in the presence of O2. In this study, we synthesized CPB NCs with various shapes and sizes for use as optical gas sensing materials. We fabricated O2 gas sensors from the various CPB NCs on several porous and nonporous substrates and examined the effects of the NC shapes and aggregate sizes and the substrate pore size on the device response. Our sensor fabricated from CPB nanocrystals on a porous substrate exhibited the highest response; the porous substrate allowed the rapid diffusion of O2 such that the NC surface was exposed effectively to the gas. Thus, the interfacial interaction between NC surfaces and substrates is a critical factor for consideration when preparing gas sensors with a high response.

1. Introduction

As functional devices for detecting toxic and combustible gases in the surrounding environment, gas sensors have become an indispensable part of modern life [1,2,3]. Many sensing methods have been proposed based on semiconductor, electrochemical, and optical sensors [4,5,6]. Among them, optical gas sensing through photoluminescence (PL) quenching can provide good sensitivity, high selectivity, fast sensitivity, and a long operating lifetimes [7,8,9,10]. Nevertheless, optical gas sensors remain expensive and difficult to miniaturize, and there are display issues relating to poor thermal stability [9,11]. Oxygen (O2) is consumed by almost all living organisms to breath or produce energy. Under extreme conditions, excessive levels of O2 can seriously affect the central nervous system, eyes, and lungs, causing cell damage or death (so-called O2 poisoning) [12]. Therefore, monitoring O2 is important not only to ensure appropriate cellular respiration but also in industrial processes. Several O2-sensitive molecules have been used in O2 monitoring devices, including metal oxide semiconductors [13,14], fullerenes [15,16], and metal–organic frameworks (MOFs). Recently, luminescent nanocrystals (NCs) have become emerging alternative O2-sensitive materials because of their excellent optical properties and high surface-to-volume ratios [17,18,19].
Lead halide perovskite materials have been used as photoactive layers in various photonic and optoelectronic devices, including lasers [20], solar cells [21,22], light emitting diodes (LEDs) [23,24], and photodetectors [25,26]. Perovskite materials possess the chemical structure ABX3, where A, B, and X are typically organic or inorganic cations, metal cations, and halide anions, respectively. Organic/inorganic hybrid halide perovskites can be used as gas sensors for the detection of NH3 [27], HCl [28], and O2 [29], due to their high charge mobilities, tunable spectra, high-intensity PL emissions, and good defect tolerance [30,31]. Recently, researchers have been paying greater attention to the technological development of all-inorganic perovskites. Because they lack organic molecules in their chemical structures, all-inorganic perovskites possess structural and environmental stability superior to that of organic/inorganic hybrid halide perovskites. For example, cesium lead bromide (CsPbBr3, CPB) has been studied broadly because of its high charge mobility, stability, and photoresponsivity [32,33,34]. Recently, Chen et al. used CPB NCs to detect toxic and corrosive HCl vapors at concentrations as low as 5 ppm through visual observation of a facile gaseous anion-exchange reaction [28]. Wu et al. prepared an impedance-type humidity sensor based on CPB NCs that displayed excellent repeatability, low hysteresis, and good stability in terms of rapid response and recovery at room temperature [35]. Kim et al. found that p-type CPB NCs possessed high gas-sensing selectivity for the detection of NO2; sequential treatment of CPB NCs thin films with methyl acetate soft soaking and Ostwald ripening improved their transport properties and dramatically enhanced the carrier lifetime from 11.56 to 112.5 ns [36]. Although some reports have appeared describing the use of CPB NCs in gas sensors, there have been no deep explorations of their applications. In addition, O2 sensors have continued to exhibit issues that have limited their commercial application, including a lack of selectivity, response to humidity, slow recovery times, short lifetimes, low stability, and high cost.
In this study, we used ligand-assisted reprecipitation (LARP) to synthesize CPB NCs having various aggregate sizes and shapes, and then investigated the effects of these structures on their O2 sensing ability. The response of resulting devices depended greatly on the thickness of the deposited film and the pore size. Therefore, we deposited the various CPB NCs on nonporous and porous substrates to find matching substrates and NCs that enhanced the response of O2 detection. Through this simple and inexpensive method for the synthesis and modification of CPB NCs, we developed a facile sensor device that appears to be conducive to the construction of cost-effective gas sensors in the future.

2. Experimental Section

2.1. Materials

Cesium bromide (CsBr, 99.9%), lead (II) bromide (PbBr2, 99.9%), oleic acid (C18H34O2, 65–80%), and n-hexane (C6H14, anhydrous, 95%) were purchased from Sigma–Aldrich. Oleylamine (C18H35NH2, 80–90%) and acetone (CH3COCH3, 99.8%, extra dry) were obtained from Acros Organics. Octylamine (C8H19N, 99%) and toluene (C7H8) was purchased from Alfa Aesar and Tedia, respectively. Filter paper (pore size: 5–6 µm) and membrane filters (pore size: 2 µm–200 nm) were acquired from Advantec MFS. An anodic aluminum oxide (AAO) membrane filter (pore size: 200 nm) was purchased from Whatman. All materials and substrates were used as received without any further purification.

2.2. Synthesis and Shape Modification

The synthesis of the CPB NCs was performed mainly as described previously [37], but with slight modifications to obtain CPB NCs with different shapes. Three solutions were prepared: 0.3 mmol CsBr in deionized water (500 µL) (solution 1); 0.3 mmol PbBr2 in dimethylformamide (DMF, 500 µL) (solution 2); and n-hexane (10 mL) mixed with oleic acid (2 mL) and octylamine (0.25 mL) (solution 3). Solutions 1 and 2 were added to solution 3 (dropwise) followed by rapid addition of acetone (8 mL). The mixture was then centrifuged (6000 rpm, 10 min). The precipitate was re-dissolved in n-hexane (2 mL) and centrifuged again (6000 rpm, 10 min). The supernatant was collected. This procedure was repeated two more times to produce two more colloidal solutions. Post-synthesis modification was performed based on the procedure described by Fanizza, Elisabetta, et al. [38]. Oleic acid (25 and 50 µL; providing samples Olac 25 and Olac 50, respectively) and oleylamine (25 and 50 µL; providing samples Olam 25 and Olam 50, respectively) were separately added dropwise into the as-synthesized CPB NC solutions (1 mL). The resulting solutions were centrifuged (1000 rpm, 10 min) at room temperature (25 °C) and the colloidal solids were collected.

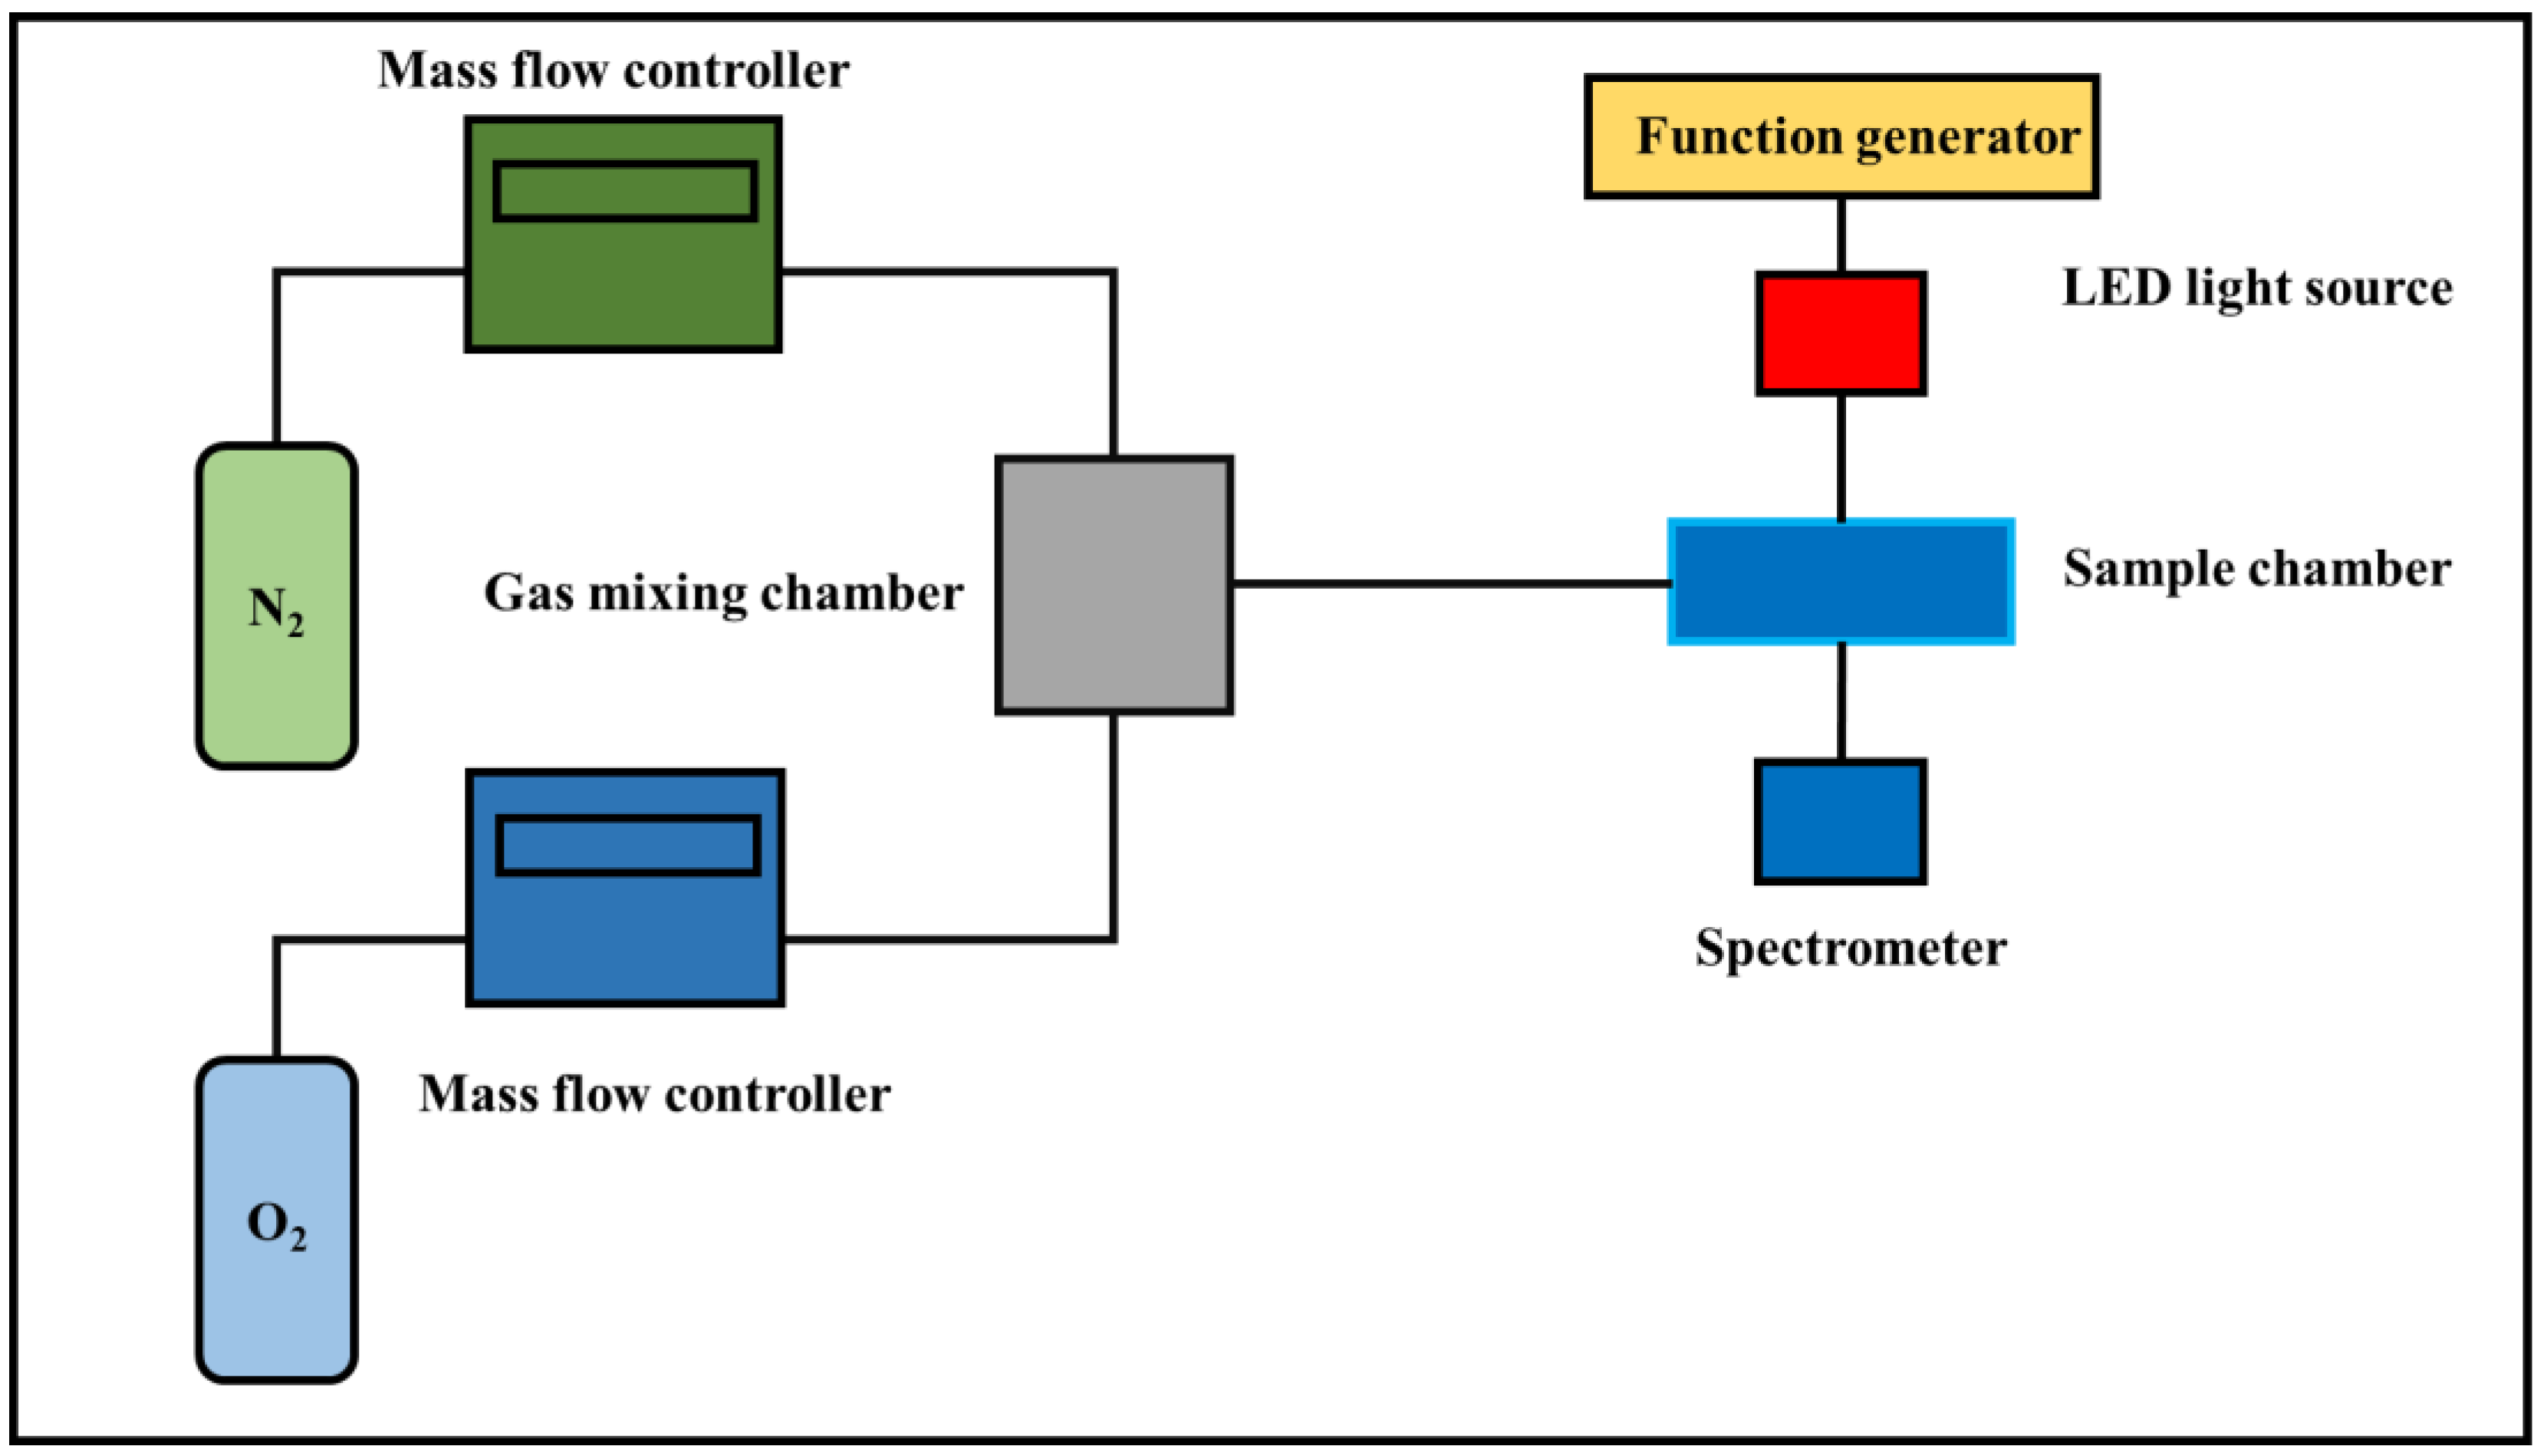
2.3. Device Fabrication and Characterization

Solutions of the CPB NCs, Olac 25, Olac 50, Olam 25, and Olam 50 were spin-coated onto glass, filter paper, a membrane filter, and an AAO membrane filter at spin-coating rates of 1000, 2000, 3000, 4000, and 5000 rpm. The resulting samples were dried at room temperature to obtain the sensing layers. UV–Vis spectrometry (JASCO, V-770) was used to measure the film absorption behavior. Transmission electron microscopy (TEM, JEOL, JEM-2100) was used to identify the shapes of the CPB NCs. The particle size distributions were measured using a particle size analyzer (Malvern Panalytical, Zetasizer 2000) and scanning electron microscopy (SEM, Phenom Pro-X). Figure 1 provides a schematic representation of the gas sensing process. The O2 and N2 gas flows were controlled using a mass flow controller (Aalborg Instruments and Controls, Model GFC 17). The gases were mixed in the chamber and the flow rates were changed as required. Fluorescence excitation was provided by an LED with a central wavelength of 405 nm and output power of 10 mW/cm2 driven by a waveform generator (TGA1240, Thurlby Thandar Instruments); the spectrum was recorded using a USB4000 fiber optics spectrometer (U.S Ocean Optics). All measurements performed done at 25 °C.

2.4. Mechanism of Sensing

Perovskite materials have been extensively used for oxygen sensing. Stoeckel et al., in 2017, used CH3NH3PbI3 for oxygen gas detection using the change of output current [29]. As the oxygen concentration decreased, the device output current also decreased. Once the O2 was withdrawn from the sensing environment, the resistance of the film went back to its original value, indicating the reversibility of the sensor. The sensor showed a fast response (~0.4 s) and had a detection limit of ~70 ppm. The authors concluded that the oxygen diffuses inside the crystals and heals the iodine vacancies on the perovskite surface. These vacancies act as charge trap state. In the presence of oxygen, the trap heals and the availability of the charges increases. This in turn increases the output current.

3. Results and Discussion

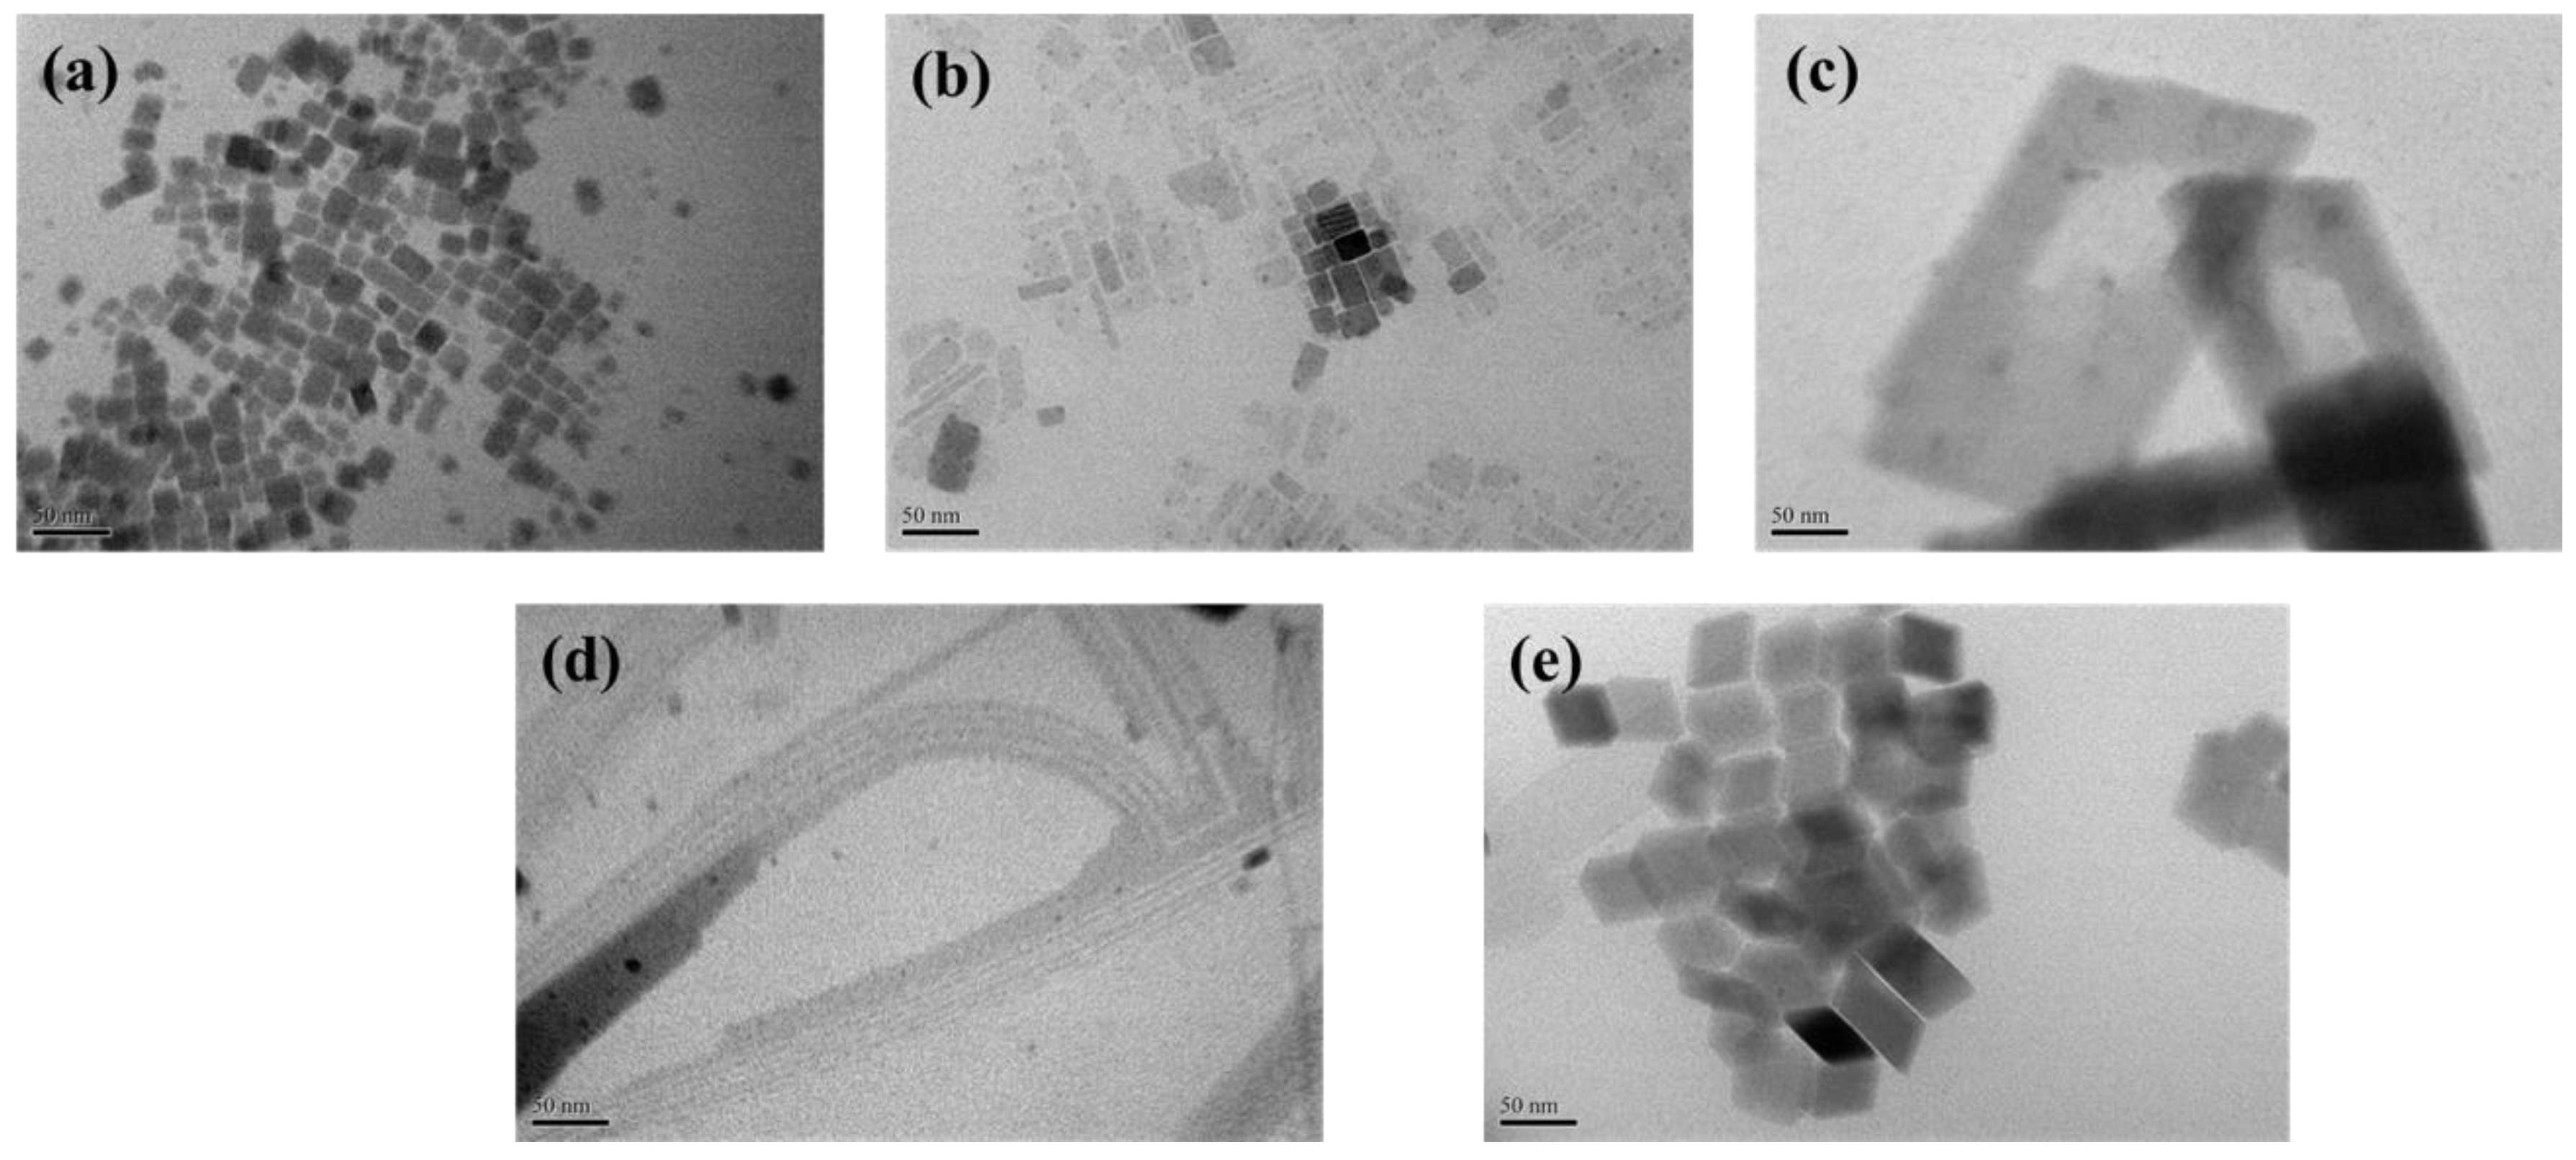
3.1. Effect of Different NC Shapes on Device Response

The TEM images (Figure 2a) and diffraction pattern (Figure S1) of the CPB NCs revealed a cube-shaped polycrystalline structure that had a (100) interplanar spacing of 0.42 nm. We synthesized CPB NCs with various shapes to investigate the effect of the shape on the device response. Upon adding various amounts of oleic acid and oleylamine, the originally nanocube-structured CPB NCs transformed into a diverse array of nanostructures. Figure 2b,c present TEM images of the Olac 25 and Olac 50 NCs, respectively; their shapes changed from nanocubes into nanosheets of various sizes. The Olam 25 and Olam 50 NCs possessed nanowire (Figure 2d) and rhombus (Figure 2e) structures, respectively. Figure S2 displays the colors and fluorescence properties of solutions of the variously shaped NCs. The Olac 25 and Olac 50 solutions were yellow, while the Olam 25 and Olam 50 solutions were bright green. Notably, after modification for 3 h, the color of the Olam 50 solution changed from bright green to white, with the disappearance of its fluorescence. Thus, because of instability, we did not use Olam 50 to fabricate a gas sensor. Figure S3 presents the size distributions of the synthesized and modified NCs; the average particle sizes of the as-synthesized, Olac-25, Olac-50, and Olam-25 NCs were 47.32 ± 0.08, 49.72 ± 0.26, 74.3 ± 0.06, and 32.1 ± 0.16 nm, respectively.
Figure 3a,b displays the UV–Vis absorption and PL spectra of the CPB NCs. The CPB NCs featured a typical absorption peak near 500 nm, with slight changes in the absorption spectra of the Olac 25 and Olac 50 samples. The PL emission wavelength of the as-synthesized CPB NCs was 512 nm; for Olac 25, Olac 50, and Olam 25 it had slightly shifted to 514 nm. In addition, the spectra of Olac 25 and Olac 50 also featured a PL emission signal at 475 nm, due to the presence of nanosheets, which might explain the absence of any peaks below 500 nm for Olam 25. We spin-coated the various solutions onto a glass substrate to fabricate gas sensor devices, which we placed in a chamber and exposed to atmospheres of various N2/O2 mixtures and recorded the changes in fluorescence. Figure S4 displays the changes in fluorescence intensity of these sensors with respect to the O2 concentration. The fluorescence intensity decreased upon increasing the O2 concentration. Response is a parameter used to assess the ability of a gas sensor to detect a particular analyte. The physical and chemical properties of a sensor change in the presence of a gas [39]. In this work, we defined the response as the ratio of the initial and final values of the measured parameters of the gas sensor. The formula used to determine the response is:
R = I0/If
where R is the response, I0 is the initial intensity in absence of analyte, and If is the intensity in the presence of a particular analyte. The measured fluorescence intensities of the devices in the chamber containing 100% N2 and 100% O2 are reported herein as the initial (I0) and final (If) fluorescence intensities, respectively. The response of each device was identified by the ratio of I0 and If. Because of collisional interactions between O2 gas and the CPB NCs, the molecules of O2 removed photogenerated electrons from the conduction band, resulting in a decrease in fluorescence intensity for the CPB NCs in the presence of O2 [24]. Figure 3c reveals the response of the as-synthesized Olac 25 and Olac 50 CPB NC samples. The fluorescence peak of the Olam 25 sample was indistinguishable from the error signal, due to its low emission (Figure S4d). The response of the as-synthesized CPB nanocubes was higher than that of the Olac-modified samples. The maximum response achieved was 1.6. We tested the photostability of the sensors by subjecting them to continuous UV excitation and recording the changes in fluorescence intensity. After 1 h, the changes in fluorescence intensity of the CPB nanocubes and Olac 25, and Olac 50 samples, as shown in Figure 3d, were 1.10, 1.03, and 0.92%, respectively. Thus, these gas sensors were stable towards continuous UV excitation.

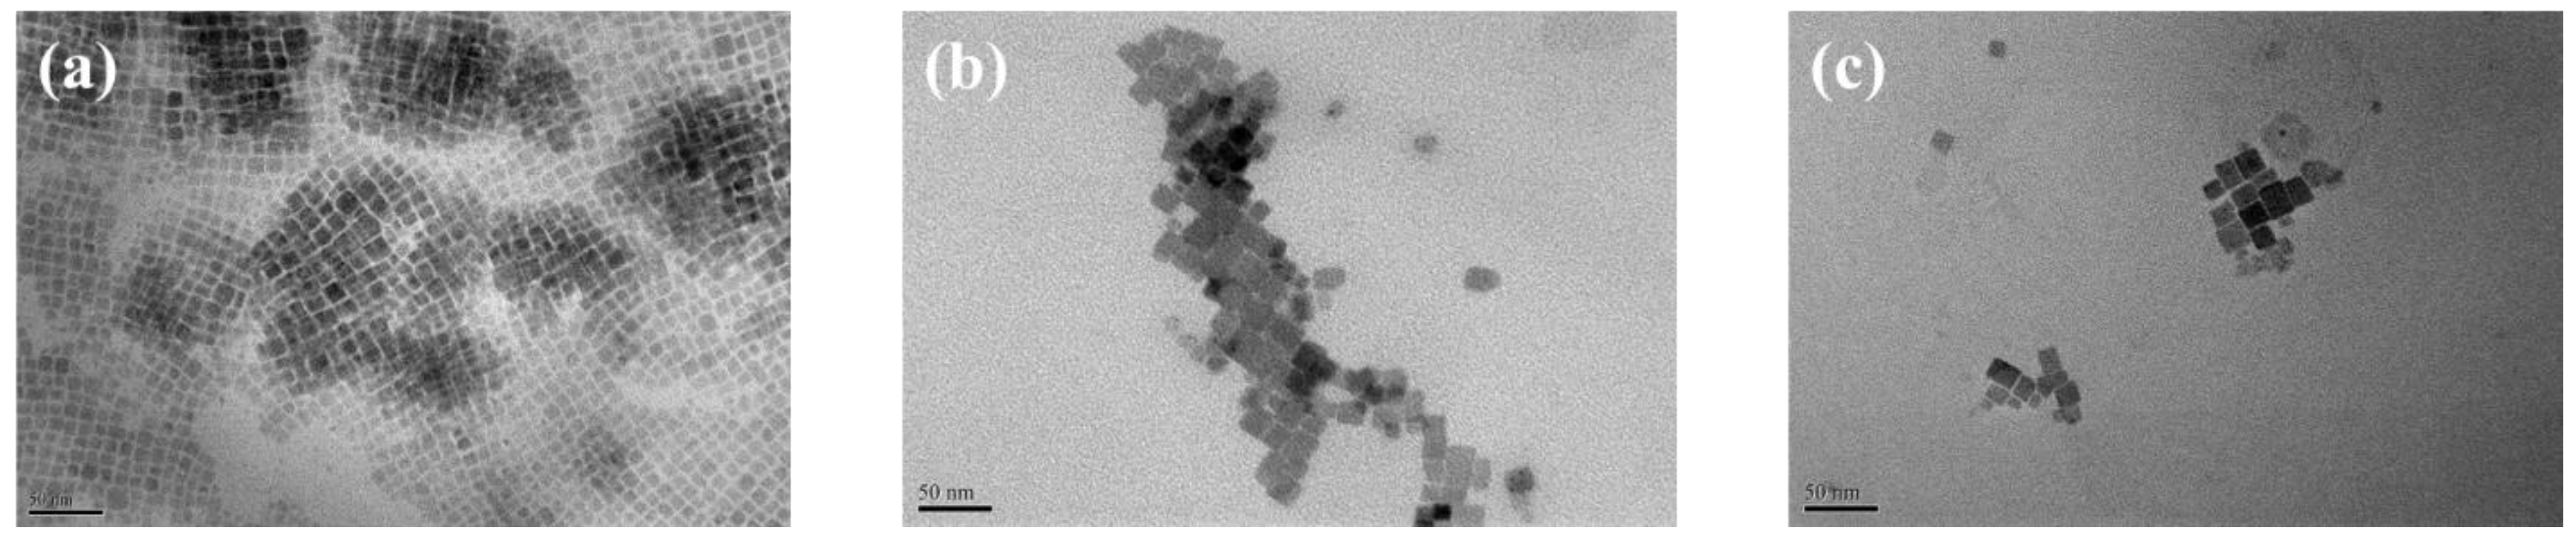
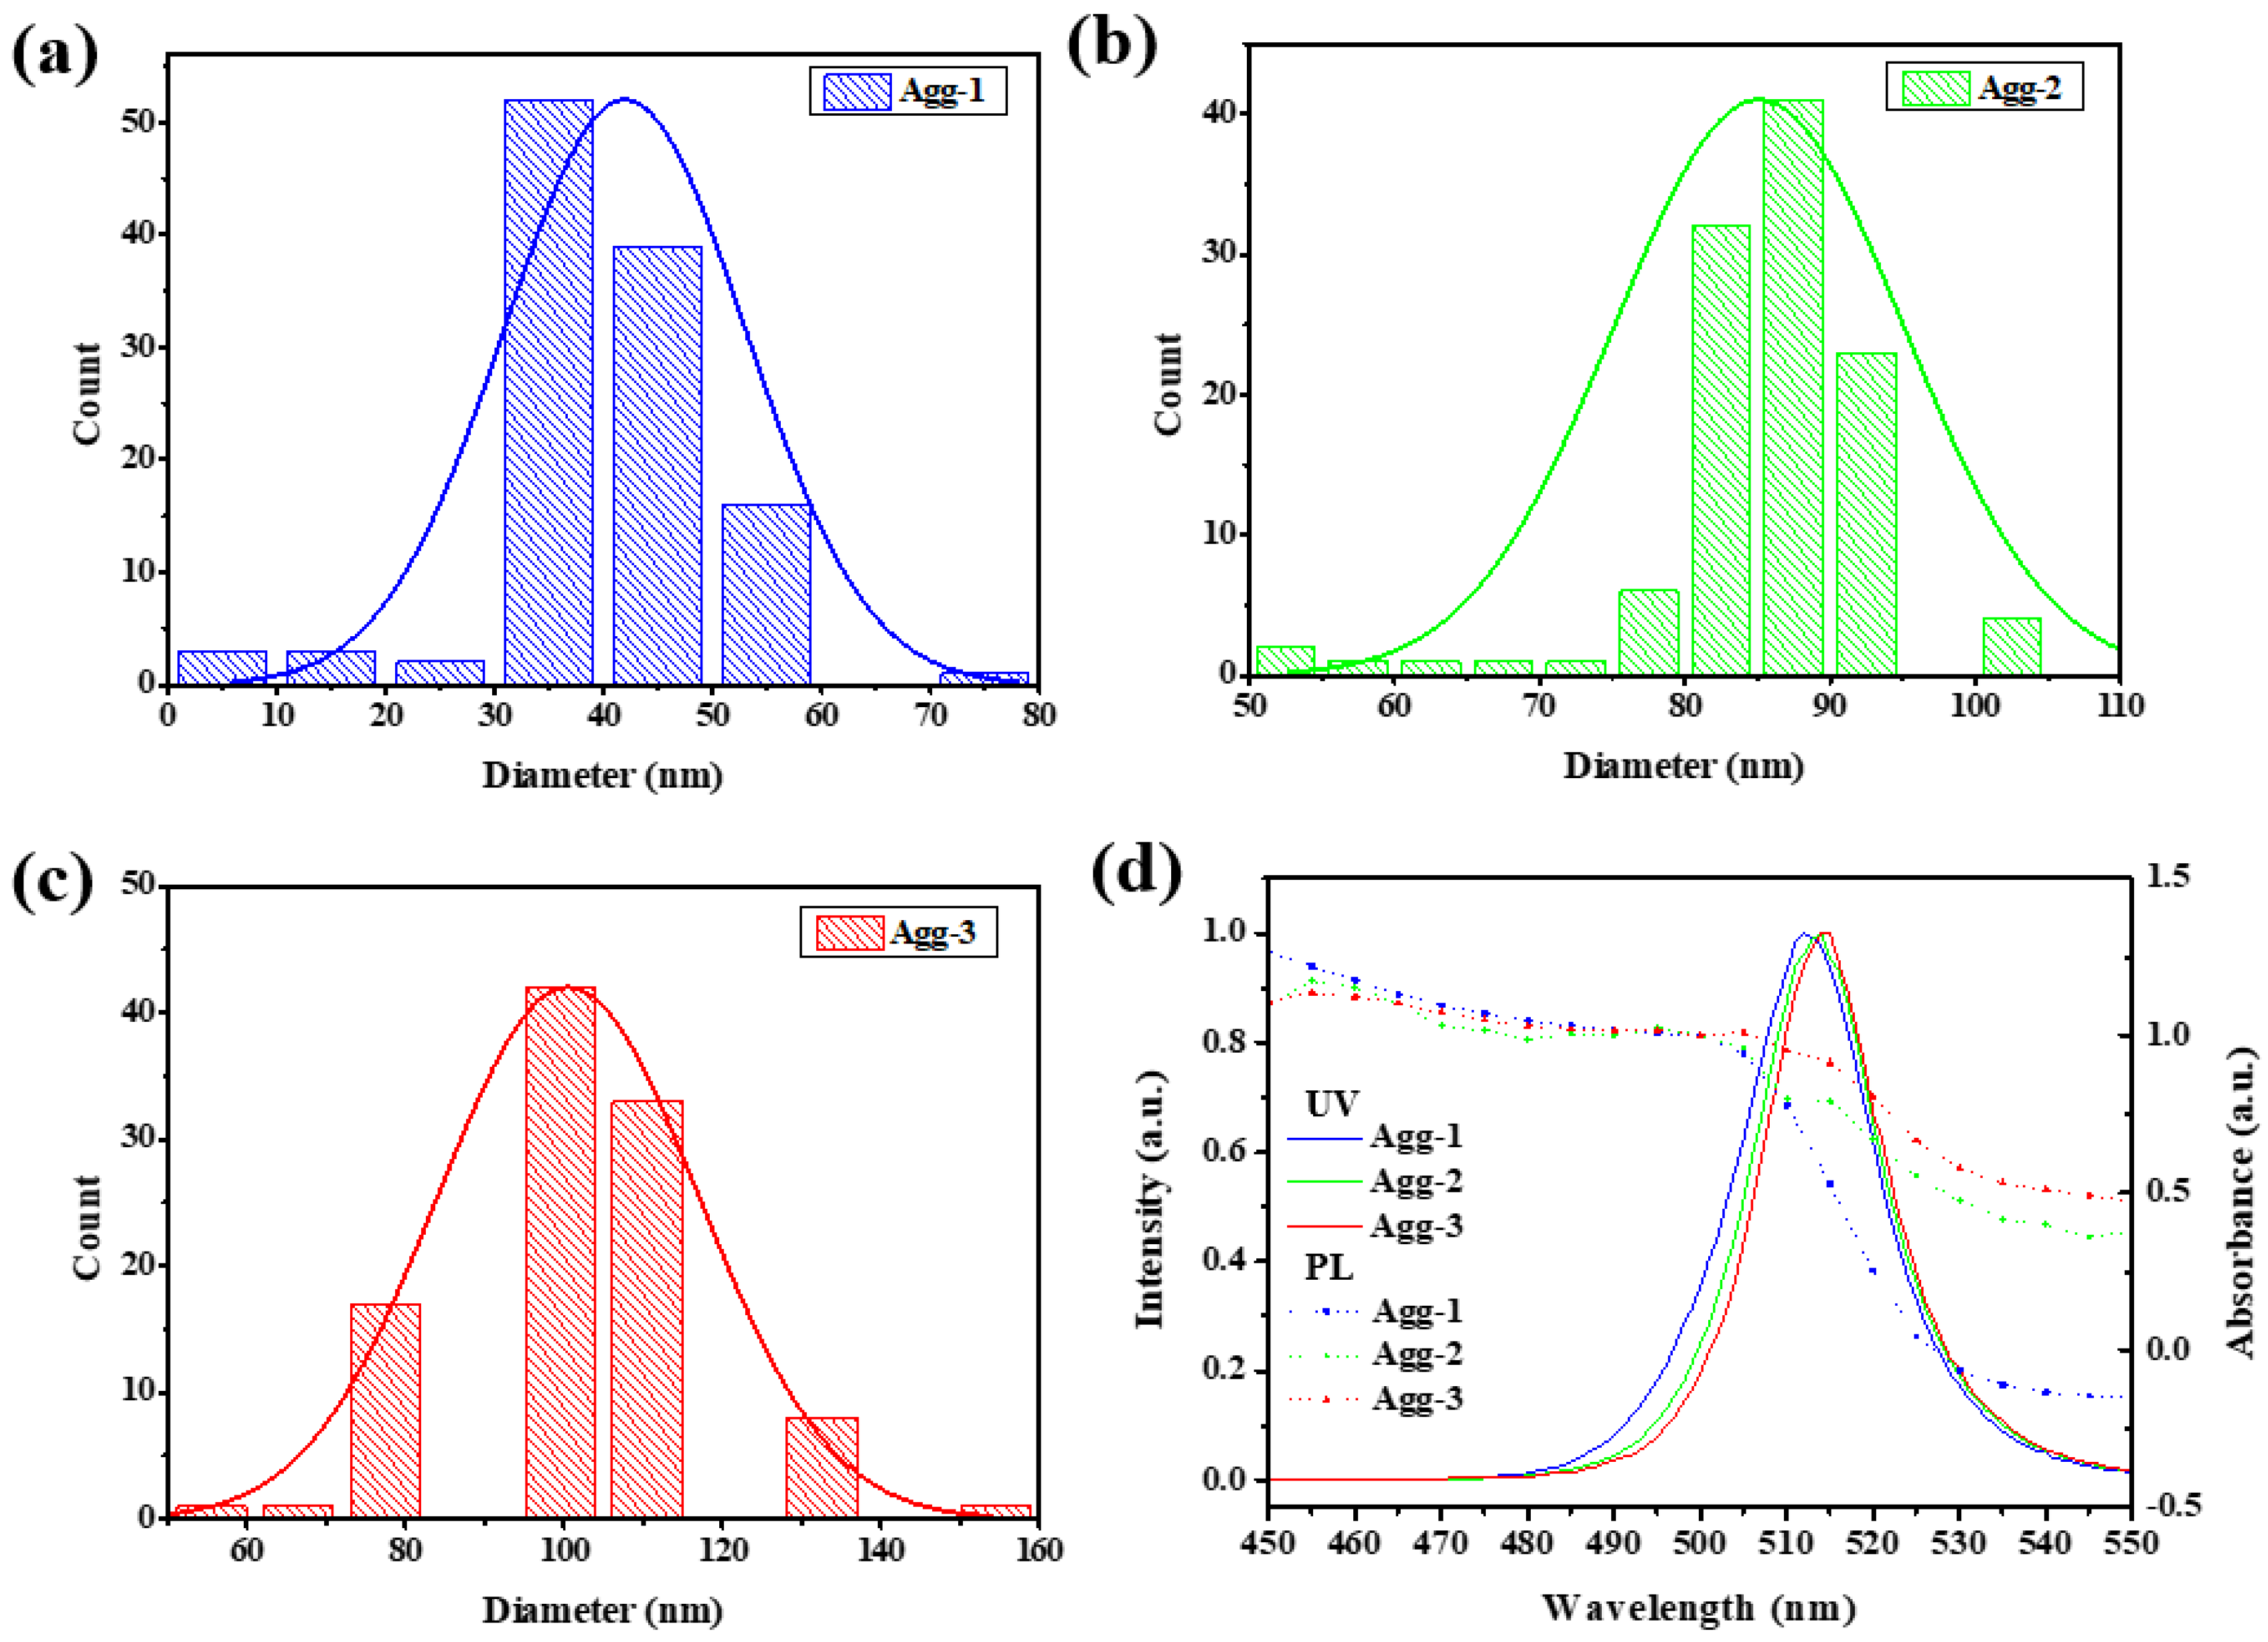
3.2. Effect of Aggregation Size of CPB NCs on Device Response

We applied CPB NCs with three different aggregate (Agg) sizes to study its effect on device response. The particle size of the CPB NCs, determined from TEM images (Figure 4), was approximately 15 nm for all of these aggregates. Figure 5a–c present the particle size distributions of the three different NC solutions. The aggregate sizes in Agg-1, Agg-2, and Agg-3 were approximately 44, 88, and 101 nm, respectively. Figure 5d displays the UV–Vis absorption and PL spectra of these NCs. A shoulder appeared near 500 nm in the spectra of all of the NC Agg solutions, but the band gaps were not significantly different, indicating that the structures of the CPB NCs did not change upon varying their aggregate sizes. The emission peaks of Agg-1, Agg-2, and Agg-3 appeared at 512, 514, and 515 nm, respectively, with full widths at half maximum (FWHMs) of 19.46, 19.12, and 19.39 nm, respectively. A slight red-shift of the emission peak occurred upon increasing the aggregate size. Figure S5 reveals the sensitivities of the gas sensor fabricated from Agg-1 achieved a maximum response of 1.6; in contrast, the sensors prepared from Agg-2 and Agg-3 displayed an extremely low response, mainly because their emission intensities were too low to effectively distinguish the emission peak of the sample from error signals. This behavior implies that a large aggregate size led to a significant decrease in the interfacial contact area, thereby inhibiting interactions between the gas and the NCs and dramatically degreasing the response of the sensors.

3.3. Effect of Substrate on Device Response

Because the interfacial area of the CPB NCs greatly influenced the response, we employed substrates with various surficial morphologies to modify the interfacial areas of the CPB NCs with the goal of enhancing the device response. Accordingly, we deposited the CPB solution onto glass, filter paper, a membrane filter, and an AAO membrane filter to fabricate a range of gas sensor devices. We placed these devices in a chamber, exposed them to various N2/O2 mixing atmospheres, and recorded the changes in fluorescence intensity. For the gas sensor fabricated on the glass substrate, we spin-coated the films at various spin rates to evaluate the effect of film thickness on the device response (Figure 6a). Interestingly, the film thickness had little effect on the response. In general, a thicker film should result in higher response, due to greater fluorescence quenching. Our observation of only slight changes in response with respect to film thickness implies that CPB aggregation occurred in these films. With greater aggregation in thicker films, O2 molecules would have difficulty interacting with the sensing materials, leading to a lower response.
Previous reports have revealed that porous substrates can improve the response of sensors as a result of increases in the permeability of the gas and the reaction area [40]. In an attempt to further improve the response of the CPB sensors, we used filter paper with a pore size of 5–6 µm as a substrate. Unlike the glass substrate, we could not spin-coat CPB films onto the filter paper; therefore, we formed CPB films by drop-coating solutions of CPB at various concentrations onto the filter paper. Figure 6b reveals that the response of the sensors fabricated using filter paper varied with respect to the concentration of the CPB solution. Upon increasing the concentration from 1 to 2 mg/mL, the average response increased from 1.67 to 2.33. Nevertheless, further increases in the solution concentration to 3 and 5 mg/mL caused the average response of the sensor to decrease to 1.95 and 1.65, respectively. The sensitivities of the CPB sensor deposited on the filter paper were much higher than those of the sensor on the glass substrate, consistent with the greater permeability. The strong decease in the emission intensity in the presence of O2 gas indicated that the molecules of O2 directly extracted photogenerated electrons from the conduction band. The high response of the CPB sensors fabricated using filter paper resulted from the increases in the amount of sensing material and the reaction area.
To further investigate the effect of the pore size of the substrate on the response, we used membrane filters with pore sizes of approximately 2 µm and 200 nm (AAO substrate) as sensor substrates. Figure 6c presents the change in response with respect to the CPB NCs concentration; the trend was the same as that for the devices fabricated using filter paper. When the NC concentration was 2 mg/mL, the highest average response reached 2.7; this value was higher than that of the sensors prepared using filter paper. In contrast, the average response of the sensor fabricated on the AAO substrate with a pore size of 200 nm was approximately 2.9 when the NC concentration was 2 mg/mL. The result is consistent with the notion that porous substrates can improve device response. In addition to response, sensor devices should display good response and recovery behavior. Initially, we placed our devices in a 100% N2 atmosphere for 10 min, and then changed the atmosphere to 100% O2. Ideally, the fluorescence intensities of the devices would decrease in the presence of O2 and return to their original values upon changing the atmosphere to 100% N2. Figure 6d presents the response and recovery behavior of all of our devices; Table S1 lists the response and recovery times. The gas sensor fabricated on the glass substrate operated with short response and recovery times, indicating that the gas could react faster with the sensing material because of the flat surface. Because the gas sensors fabricated using the porous substrates contained more sensing materials and featured longer gas diffusion paths, their operation was characterized by longer response and recovery times. Figure S6 reveals that the relative fluorescence intensity of the CPB NCs decreased by 1.1% after 1 h of continuous UV excitation. Thus, this sensor can be considered to have reasonable photostability during its operation. Table S1 summarizes the performance of state-of-the-art oxygen sensor.
Finally, Figure 7 reveals the effect of humidity and temperature on the response of the gas sensors deposited on the glass and filer paper substrates. Figure 7a,b show that these gas sensors exhibit similar responses under different relative humidity atmospheres. This result indicates that our gas sensor has a fairly stable response even in a high humidity environment. Figure 7c illustrates that the response of the glass-based gas sensor does not show an obvious change when the operating temperature is increased from 25 °C to 60 °C. However, the response of the sensors fabricated on the filter paper substrate gradually increased with rising temperature, with the highest response at 50 °C (Figure 7d). The increasing response implies that the porosity of the substrate is affected by the operating temperature.

4. Conclusions

We have synthesized various CPB NCs for use as O2 gas sensors and investigated the effect of the NC shape and aggregate size on the device response. We found that cubic-shaped NCs that have smaller aggregate sizes possessed a higher response. Furthermore, we examined the effects of the pore sizes of four substrates on the response of the sensors. The response of the sensors fabricated using porous substrates was higher than that of those fabricated using nonporous substrates. In addition, the response increased upon decreasing the pore size, mainly due to increases in the diffusivity of the gas and the reaction area. These key influencing factors allowed us to obtain high-efficiency CPB NC gas sensors.

Supplementary Materials

The following supporting information can be downloaded at: https://www.mdpi.com/article/10.3390/s22228853/s1, Figure S1: Transmission electron microscopy images of (a) as-synthesized NCs, (b) Olac 25, (c) Olac 50, (d) Olam 25, and (e) Olam 50; Figure S2: Transmission electron microscopy diffraction patterns of (a) as-synthesized NCs, (b) Olac 25, (c) Olac 50, (d) Olam 25, and (e) Olam 50; Figure S3: Pictures of NC solutions (a,c) and solutions illuminated under UV light (b,d). Sol-1~ 5 are as-synthesized, Olac-25, Olac-50, Olam-25, and Olam-50 solutions, respectively. (a,b) are the fresh solutions, and (c,d) are the solutions after standing for 3 h; Figure S4: Particle size distributions of (a) as-synthesized NCs, (b) Olac-25, (c) Olac-50 and (d) Olam 25; Figure S5: Change in emission intensity of (a) as-synthesized CPB NCs, (b) Olac 25, (c) Olac 50, and (d) Olam 25 samples at different O2 concentrations; Figure S6: TEM images of (a) Agg-1, (b) Agg-2, and (c) Agg-3 samples; Figure S7: Sensitivity of Agg-1 sample at different O2 concentrations; Figure S8: Photostability of CPB NCs fabricated on the AAO membrane filter; Table S1: The response and recovery behaviors of all the devices, and the response and recovery time.

Author Contributions

Conceptualization, Y.-C.H.; methodology, Z.-H.H., M.L. and C.-F.L.; formal analysis, Z.-H.H., M.L. and C.-F.L.; investigation, Z.-H.H., M.L. and C.-F.L.; resource, Y.-C.H. and K.-M.L.; writing—original draft preparation, Z.-H.H. and M.L.; writing—review and editing, Y.-C.H. and K.-M.L.; supervision, Y.-C.H. and K.-M.L.; funding acquisition, Y.-C.H. and K.-M.L. All authors have read and agreed to the published version of the manuscript.

Funding

The authors acknowledge financial support from the Ministry of Science and Technology (Grant Nos. MOST 111-2221-E-131-022, 110-2221-E-131-010, 110-2622-E-131-011, 108-2628-E-182-003-MY3) and Chang Gung Memorial Hospital, Taoyuan City (CMRPD2M0041).

Institutional Review Board Statement

Not applicable.

Informed Consent Statement

Not applicable.

Data Availability Statement

Not applicable.

Conflicts of Interest

The authors declare no conflict of interest.

References

  1. Anukunprasert, T.; Saiwan, C.; Traversa, E. The development of gas sensor for carbon monoxide monitoring using nanostructure of Nb–TiO2. Sci. Technol. Adv. Mater. 2005, 6, 359–363. [Google Scholar] [CrossRef] [Green Version]
  2. Qin, C.; Wang, B.; Wu, N.; Han, C.; Wu, C.; Zhang, X.; Tian, Q.; Shen, S.; Li, P.; Wang, Y. Metal-organic frameworks derived porous Co3O4 dodecahedeons with abundant active Co3+ for ppb-level CO gas sensing. Appl. Surf. Sci. 2020, 506, 144900. [Google Scholar] [CrossRef]
  3. Cui, H.; Feng, Z.; Wang, W.; Peng, X.; Hu, J. Adsorption Behavior of Pd-Doped PtS2 Monolayer Upon SF6 Decomposed Species and the Effect of Applied Electric Field. IEEE Sens. J. 2022, 22, 6764–6771. [Google Scholar] [CrossRef]
  4. Amirjani, A.; Fatmehsari, D.H. Colorimetric detection of ammonia using smartphones based on localized surface plasmon resonance of silver nanoparticles. Talanta 2018, 176, 242–246. [Google Scholar] [CrossRef] [PubMed]
  5. Sayago, I.; Santos, J.P.; Sánchez-Vicente, C. The Effect of Rare Earths on the Response of Photo UV-Activate ZnO Gas Sensors. Sensors 2022, 22, 8150. [Google Scholar] [CrossRef] [PubMed]
  6. Zhang, Y.; Wang, M.; Yu, P.; Liu, Z. Optical Gas-Cell Dynamic Adsorption in a Photoacoustic Spectroscopy-Based SOF2 and SO2F2 Gas Sensor. Sensors 2022, 22, 7949. [Google Scholar] [CrossRef] [PubMed]
  7. Dhanaji, P.B.; Kim, K.-H.; Mahajan, P.G.; Gore, A.H.; Patil, S.R.; Majhi, S.M.; Naik, G.K.; Liang, T.-T.; Ahemad, J.-M.; Yu, Y.-T.; et al. Fluorescent Chemosensor for Quantitation of Multiple Atmospheric Gases. J. Nanomed. Nanotechnol. 2017, 8, 2. [Google Scholar]
  8. Jiang, T.; Du, B.; Zhang, H.; Yu, D.; Sun, L.; Zhao, G.; Yang, C.; Sun, Y.; Yu, M.; Ashfold, M.N.R. High-performance photoluminescence-based oxygen sensing with Pr-modified ZnO nanofibers. Appl. Surf. Sci. 2019, 483, 922–928. [Google Scholar] [CrossRef] [Green Version]
  9. Liu, X.; Cheng, S.; Liu, H.; Hu, S.; Zhang, D.; Ning, H. A survey on gas sensing technology. Sensors 2012, 12, 9635–9665. [Google Scholar] [CrossRef] [Green Version]
  10. Mokoena, T.P.; Swart, H.C.; Hillie, K.T.; Tshabalala, Z.P.; Jozela, M.; Tshilongo, J.; Motaung, D.E. Enhanced propanol gas sensing performance of p-type NiO gas sensor induced by exceptionally large surface area and crystallinity. Appl. Surf. Sci. 2022, 571, 151121. [Google Scholar] [CrossRef]
  11. Feng, S.; Farha, F.; Li, Q.; Wan, Y.; Xu, Y.; Zhang, T.; Ning, H. Review on Smart Gas Sensing Technology. Sensors 2019, 19, 3760. [Google Scholar] [CrossRef] [PubMed]
  12. Spengler, J.D.; Sexton, K. Indoor air pollution: A public health perspective. Science 1983, 221, 9–17. [Google Scholar] [CrossRef] [PubMed]
  13. Xu, Y.; Zhou, X.; Sorensen, O.T. Oxygen sensors based on semiconducting metal oxides: An overview. Sens. Actuators B Chem. 2000, 65, 2–4. [Google Scholar] [CrossRef]
  14. Han, Z.; Wang, J.; Liao, L.; Pan, H.; Shen, S.; Chen, J. Phosphorus doped TiO2 as oxygen sensor with low operating temperature and sensing mechanism. Appl. Surf. Sci. 2013, 273, 349–356. [Google Scholar] [CrossRef]
  15. Baleizao, C.; Nagl, S.; Schaferling, M.; Santos, M.N.B.; Wolfbeis, O.S. Dual Fluorescence Sensor for Trace Oxygen and Temperature with Unmatched Range and Response. Anal. Chem. 2008, 80, 6449–6457. [Google Scholar] [CrossRef]
  16. Tabari, L.; Farmanzadeh, D. Interesting adsorption behavior of C60O fullerene oxide isomers toward O3 and CO molecules: A DFT study. Appl. Surf. Sci. 2019, 479, 569–575. [Google Scholar] [CrossRef]
  17. Achatz, D.E.; Meier, R.J.; Fischer, L.H.; Wolfbeis, O.S. Luminescent sensing of oxygen using a quenchable probe and upconverting nanoparticles. Angew. Chem. Int. Ed. Engl. 2011, 50, 260–263. [Google Scholar] [CrossRef]
  18. Banski, M.; Podhorodecki, A.; Misiewicz, J. NaYF4 nanocrystals with TOPO ligands: Synthesis-dependent structural and luminescent properties. Phys. Chem. Chem. Phys. 2013, 15, 19232–19241. [Google Scholar] [CrossRef]
  19. Epifani, M.; Comini, E.; Díaz, R.; Force, C.; Siciliano, P.; Faglia, G. TiO2 colloidal nanocrystals surface modification by V2O5 species: Investigation by 47,49Ti MAS-NMR and H2, CO and NO2 sensing properties. Appl. Surf. Sci. 2015, 351, 1169–1173. [Google Scholar] [CrossRef]
  20. Lei, L.; Dong, Q.; Gundogdu, K.; So, F. Metal Halide Perovskites for Laser Applications. Adv. Funct. Mater. 2021, 31, 2010144. [Google Scholar] [CrossRef]
  21. Kim, J.Y.; Lee, J.W.; Jung, H.S.; Shin, H.; Park, N.G. High-Efficiency Perovskite Solar Cells. Chem. Rev. 2020, 120, 7867–7918. [Google Scholar] [CrossRef] [PubMed]
  22. Zhang, J.; Li, X.; Wang, L.; Yu, J.; Wageh, S.; Al-Ghamdi, A.A. Enhanced performance of CH3NH3PbI3 perovskite solar cells by excess halide modification. Appl. Surf. Sci. 2021, 564, 150464. [Google Scholar] [CrossRef]
  23. Ashjari, T.; Roghabadi, F.A.; Ahmadi, V. Facile synthesis of durable perovskite quantum dots film with near unity photoluminescence quantum yield for efficient perovskite light emitting diode. Appl. Surf. Sci. 2020, 510, 145513. [Google Scholar] [CrossRef]
  24. Liu, X.K.; Xu, W.; Bai, S.; Jin, Y.; Wang, J.; Friend, R.H.; Gao, F. Metal halide perovskites for light-emitting diodes. Nat. Mater. 2021, 20, 10–21. [Google Scholar] [CrossRef]
  25. Li, C.; Ma, Y.; Xiao, Y.; Shen, L.; Ding, L. Advances in perovskite photodetectors. InfoMat 2020, 2, 1247–1256. [Google Scholar] [CrossRef]
  26. Oh, H.; Kim, H.J.; Kim, S.; Kim, J.A.; Kang, G.; Park, M. Highly flexible and stable perovskite/microbead hybrid photodetectors with improved interfacial light trapping. Appl. Surf. Sci. 2021, 544, 148850. [Google Scholar] [CrossRef]
  27. Maity, A.; Raychaudhuri, A.K.; Ghosh, B. High sensitivity NH3 gas sensor with electrical readout made on paper with perovskite halide as sensor material. Sci. Rep. 2019, 9, 7777. [Google Scholar] [CrossRef] [Green Version]
  28. Chen, X.; Hu, H.; Xia, Z.; Gao, W.; Gou, W.; Qu, Y.; Ma, Y. CsPbBr3 perovskite nanocrystals as highly selective and sensitive spectrochemical probes for gaseous HCl detection. J. Mater. Chem. C 2017, 5, 309–313. [Google Scholar] [CrossRef]
  29. Stoeckel, M.A.; Gobbi, M.; Bonacchi, S.; Liscio, F.; Ferlauto, L.; Orgiu, E.; Samori, P. Reversible, Fast, and Wide-Range Oxygen Sensor Based on Nanostructured Organometal Halide Perovskite. Adv. Mater. 2017, 29, 1702469. [Google Scholar] [CrossRef] [Green Version]
  30. Li, G.; She, C.; Zhang, Y.; Li, H.; Liu, S.; Yue, F.; Jing, C.; Cheng, Y.; Chu, J. A “Turn-on” fluorescence perovskite sensor based on MAPbBr3/mesoporous TiO2 for NH3 and amine vapor detections. Sens. Actuators B Chem. 2021, 327, 128918. [Google Scholar] [CrossRef]
  31. Yan, J.; Ke, X.; Chen, Y.; Zhang, A.; Zhang, B. Effect of modulating the molar ratio of organic to inorganic content on morphology, optical absorption and photoluminescence of perovskite CH3NH3PbBr3 films. Appl. Surf. Sci. 2015, 351, 1191–1196. [Google Scholar] [CrossRef]
  32. Clinckemalie, L.; Valli, D.; Roeffaers, M.B.J.; Hofkens, J.; Pradhan, B.; Debroye, E. Challenges and Opportunities for CsPbBr3 Perovskites in Low- and High-Energy Radiation Detection. ACS Energy Lett. 2021, 6, 1290–1314. [Google Scholar] [CrossRef]
  33. Gong, C.; Wang, X.; Xia, X.; Yang, X.; Wang, L.; Li, F. In-situ guanidinium bromide passivation treatment of CsPbBr3 perovskite quantum dots exhibiting high photoluminescence and environmental stability. Appl. Surf. Sci. 2021, 559, 149986. [Google Scholar] [CrossRef]
  34. Yu, J.; Liu, G.; Chen, C.; Li, Y.; Xu, M.; Wang, T.; Zhao, G.; Zhang, L. Perovskite CsPbBr3 crystals: Growth and applications. J. Mater. Chem. C 2020, 8, 6326–6341. [Google Scholar] [CrossRef]
  35. Wu, Z.; Yang, J.; Sun, X.; Wu, Y.; Wang, L.; Meng, G.; Kuang, D.; Guo, X.; Qu, W.; Du, B.; et al. An excellent impedance-type humidity sensor based on halide perovskite CsPbBr3 nanoparticles for human respiration monitoring. Sens. Actuators B Chem. 2021, 337, 129772. [Google Scholar] [CrossRef]
  36. Kim, J.; Hu, L.; Chen, H.; Guan, X.; Anandan, P.R.; Li, F.; Tang, J.; Lin, C.-H.; Kalantar-Zadeh, K.; Tricoli, A.; et al. P-type Charge Transport and Selective Gas Sensing of All-Inorganic Perovskite Nanocrystals. ACS Mater. Lett. 2020, 2, 1368–1374. [Google Scholar] [CrossRef]
  37. Lu, W.-G.; Chen, C.; Han, D.; Yao, L.; Han, J.; Zhong, H.; Wang, Y. Nonlinear Optical Properties of Colloidal CH3NH3PbBr3 and CsPbBr3Quantum Dots: A Comparison Study Using Z-Scan Technique. Adv. Opt. Mater. 2016, 4, 1732–1737. [Google Scholar] [CrossRef]
  38. Fanizza, E.; Cascella, F.; Altamura, D.; Giannini, C.; Panniello, A.; Triggiani, L.; Panzarea, F.; Depalo, N.; Grisorio, R.; Suranna, G.P.; et al. Post-synthesis phase and shape evolution of CsPbBr3 colloidal nanocrystals: The role of ligands. Nano Res. 2019, 12, 1155–1166. [Google Scholar] [CrossRef]
  39. Liu, C.Y.; Deb, M.; Sadhu, A.S.; Karmakar, R.; Huang, P.T.; Lin, Y.N.; Chu, C.S.; Pal, B.N.; Chang, S.H.; Biring, S. Resolving Cross-Sensitivity Effect in Fluorescence Quenching for Simultaneously Sensing Oxygen and Ammonia Concentrations by an Optical Dual Gas Sensor. Sensors 2021, 21, 6940. [Google Scholar] [CrossRef]
  40. Choi, M.S.; Kim, M.Y.; Mirzaei, A.; Kim, H.-S.; Kim, S.-I.; Baek, S.-H.; Chun, D.W.; Jin, C.; Lee, K.H. Selective, sensitive, and stable NO2 gas sensor based on porous ZnO nanosheets. Appl. Surf. Sci. 2021, 568, 150910. [Google Scholar] [CrossRef]
Figure 1. Schematic for optical gas sensing.
Sensors 22 08853 g001
Figure 2. Transmission electron microscopy images of (a) as-synthesized NCs, (b) Olac 25, (c) Olac 50, (d) Olam 25, and (e) Olam 50.
Sensors 22 08853 g002
Figure 3. (a) UV–Vis absorbance, (b) emission spectra of as-synthesized CPB NCs (olive line), Olac 25 (wine line), Olac 50 (navy line), and Olam 25 (orange line) samples. (c) Response and (d) photostability of as-synthesized CPB NCs (olive line), Olac 25 (wine line), and Olac 50 (navy line) samples.
Sensors 22 08853 g003
Figure 4. TEM images of (a) Agg-1, (b) Agg-2, and (c) Agg-3 samples.
Sensors 22 08853 g004
Figure 5. Particle size distributions of (a) Agg-1 (b) Agg-2, and (c) Agg-3 samples. (d) UV–Vis absorbance and emission spectra of Agg-1 (blue line), Agg-2 (green line), and Agg-3 (red line) samples.
Sensors 22 08853 g005
Figure 6. The different spin speed on the device sensitivity. The sensitivities of the sensors fabricated from (a) glass and (b) filter paper varies with the concentration of CsPbBr3 solutions. (c) The sensitivity of the membrane filters with pore sizes of ~2 µm and 200 nm (Anodic aluminum oxide (AAO) substrate) as the sensor substrates. (d) The response and recovery behaviors of all the devices.
Sensors 22 08853 g006
Figure 7. Responses of the gas sensor at different relative humidity and temperatures. Gas sensors are deposited on the glass (a,c) and filter paper (b,d) substrates.
Sensors 22 08853 g007
Publisher’s Note: MDPI stays neutral with regard to jurisdictional claims in published maps and institutional affiliations.

