Wearable Spectroradiometer for Dosimetry

Abstract
:1. Introduction
2. Materials and Methods
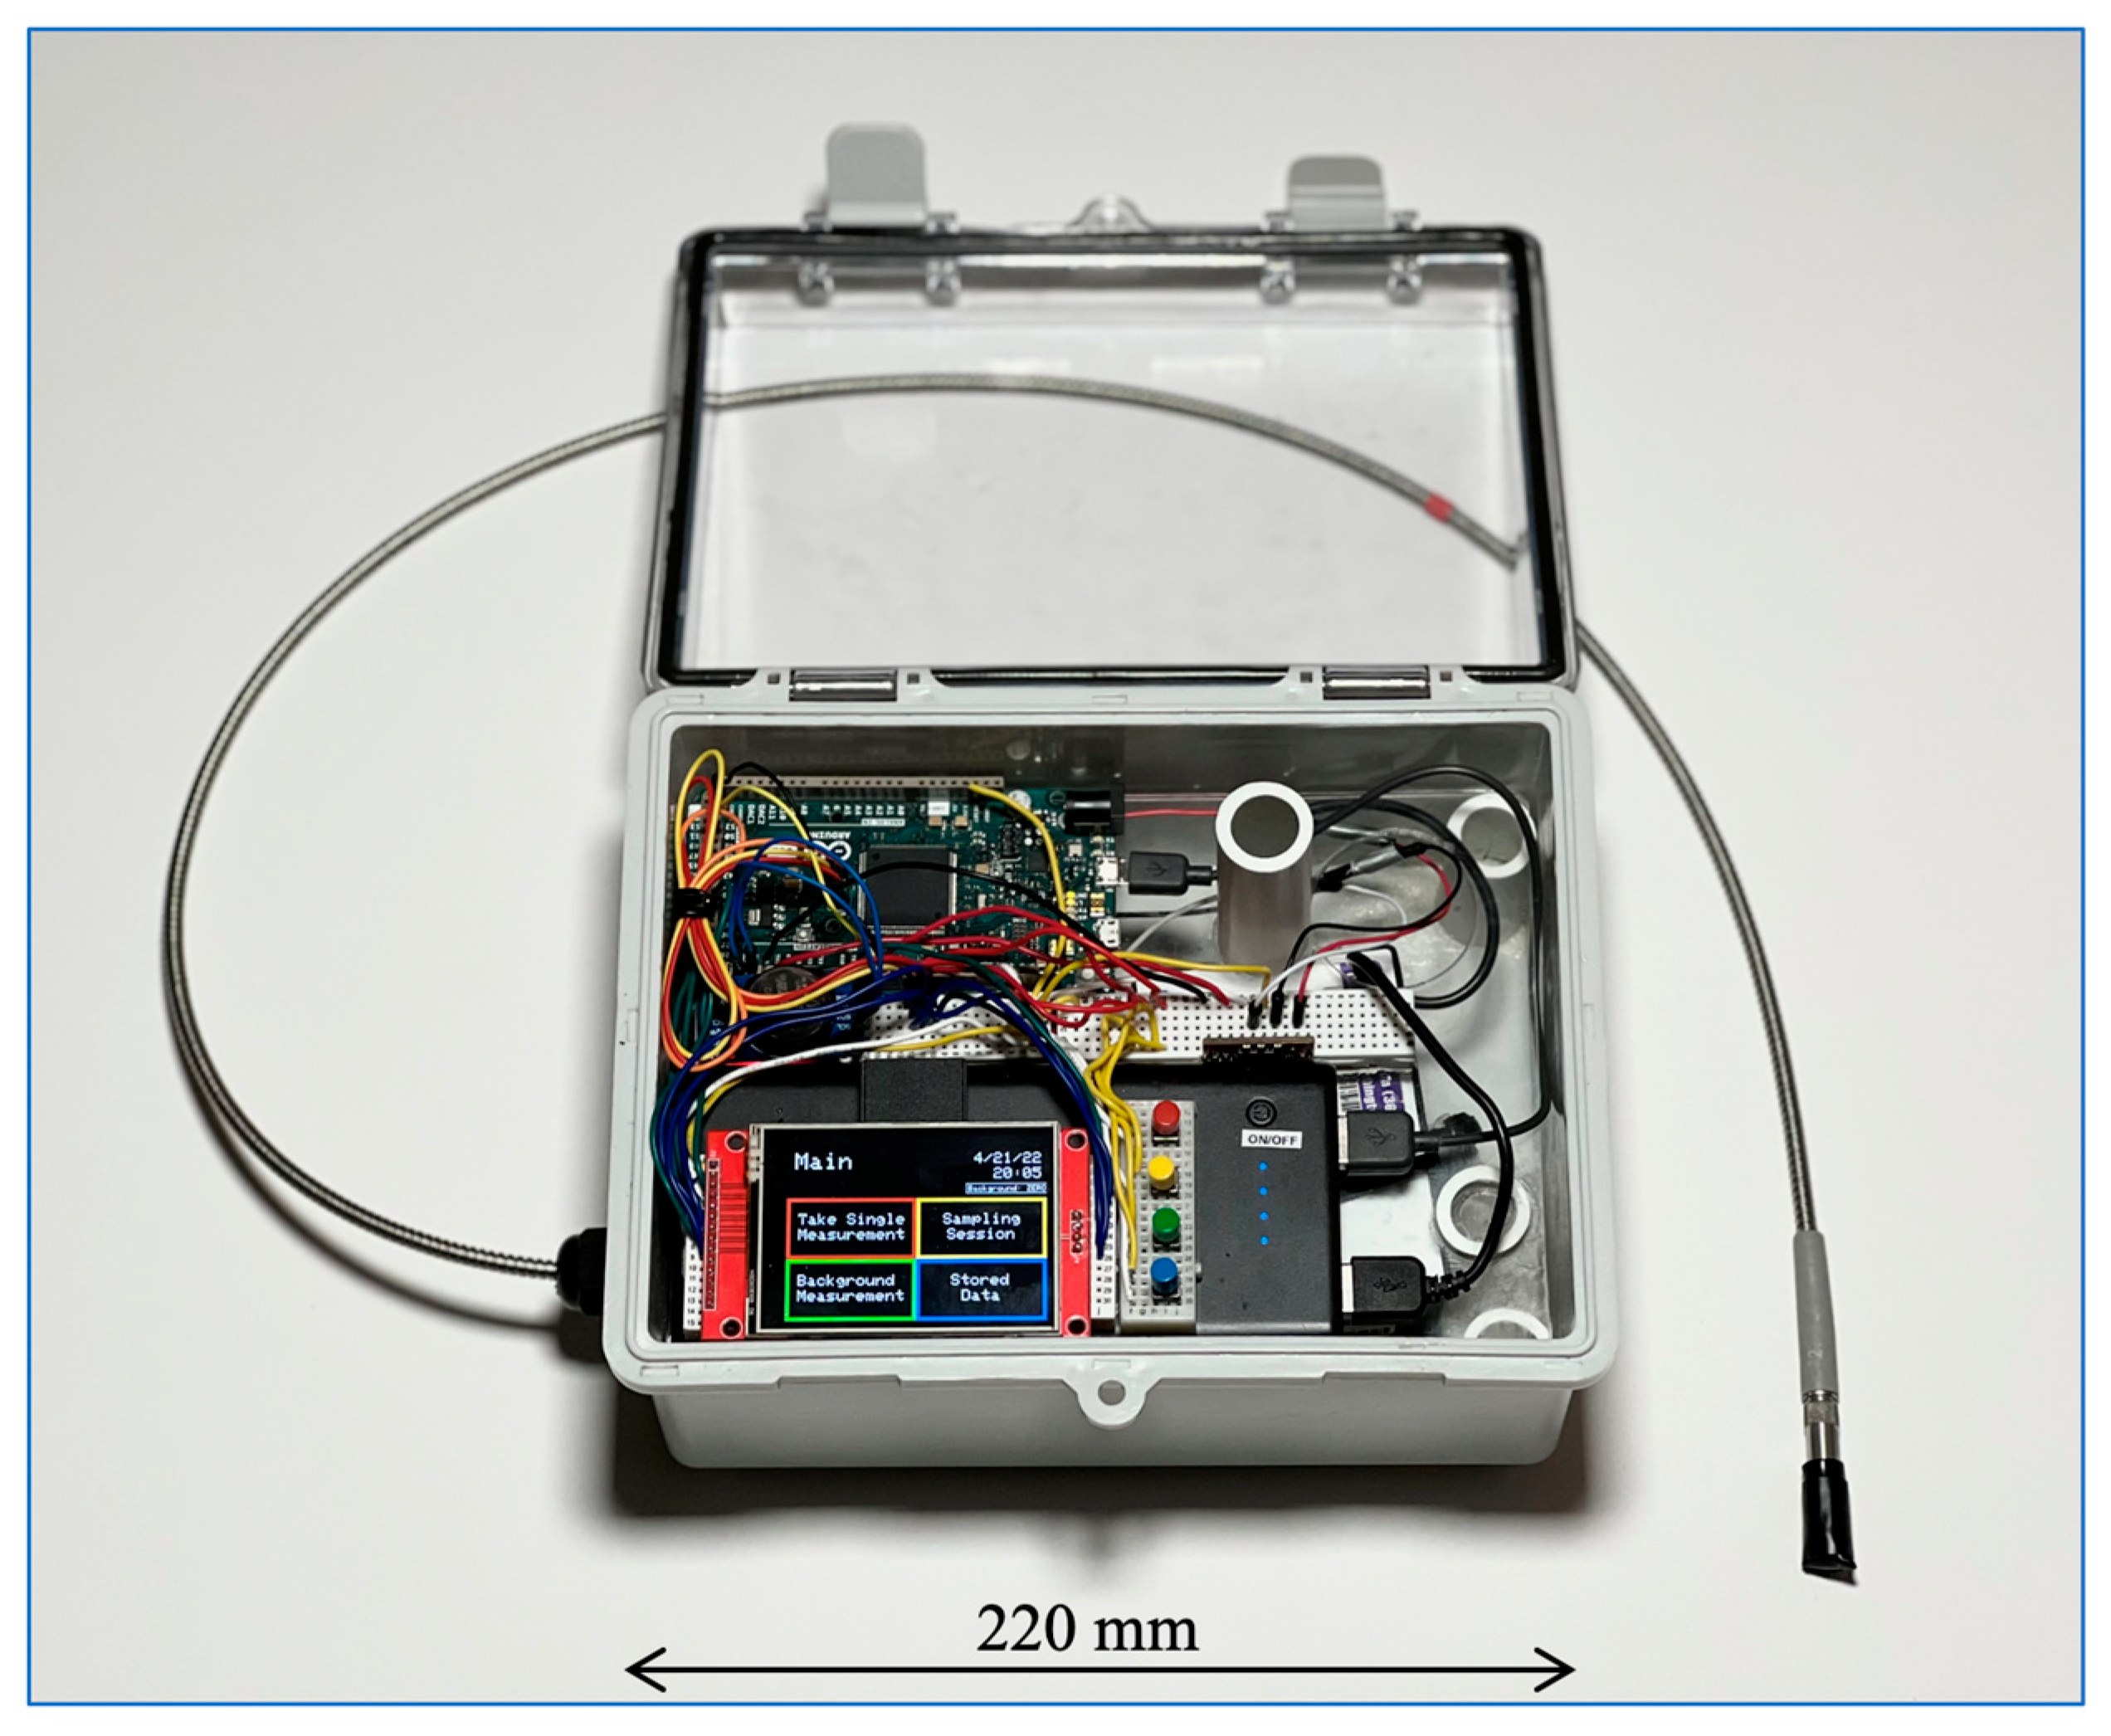
2.1. Platform
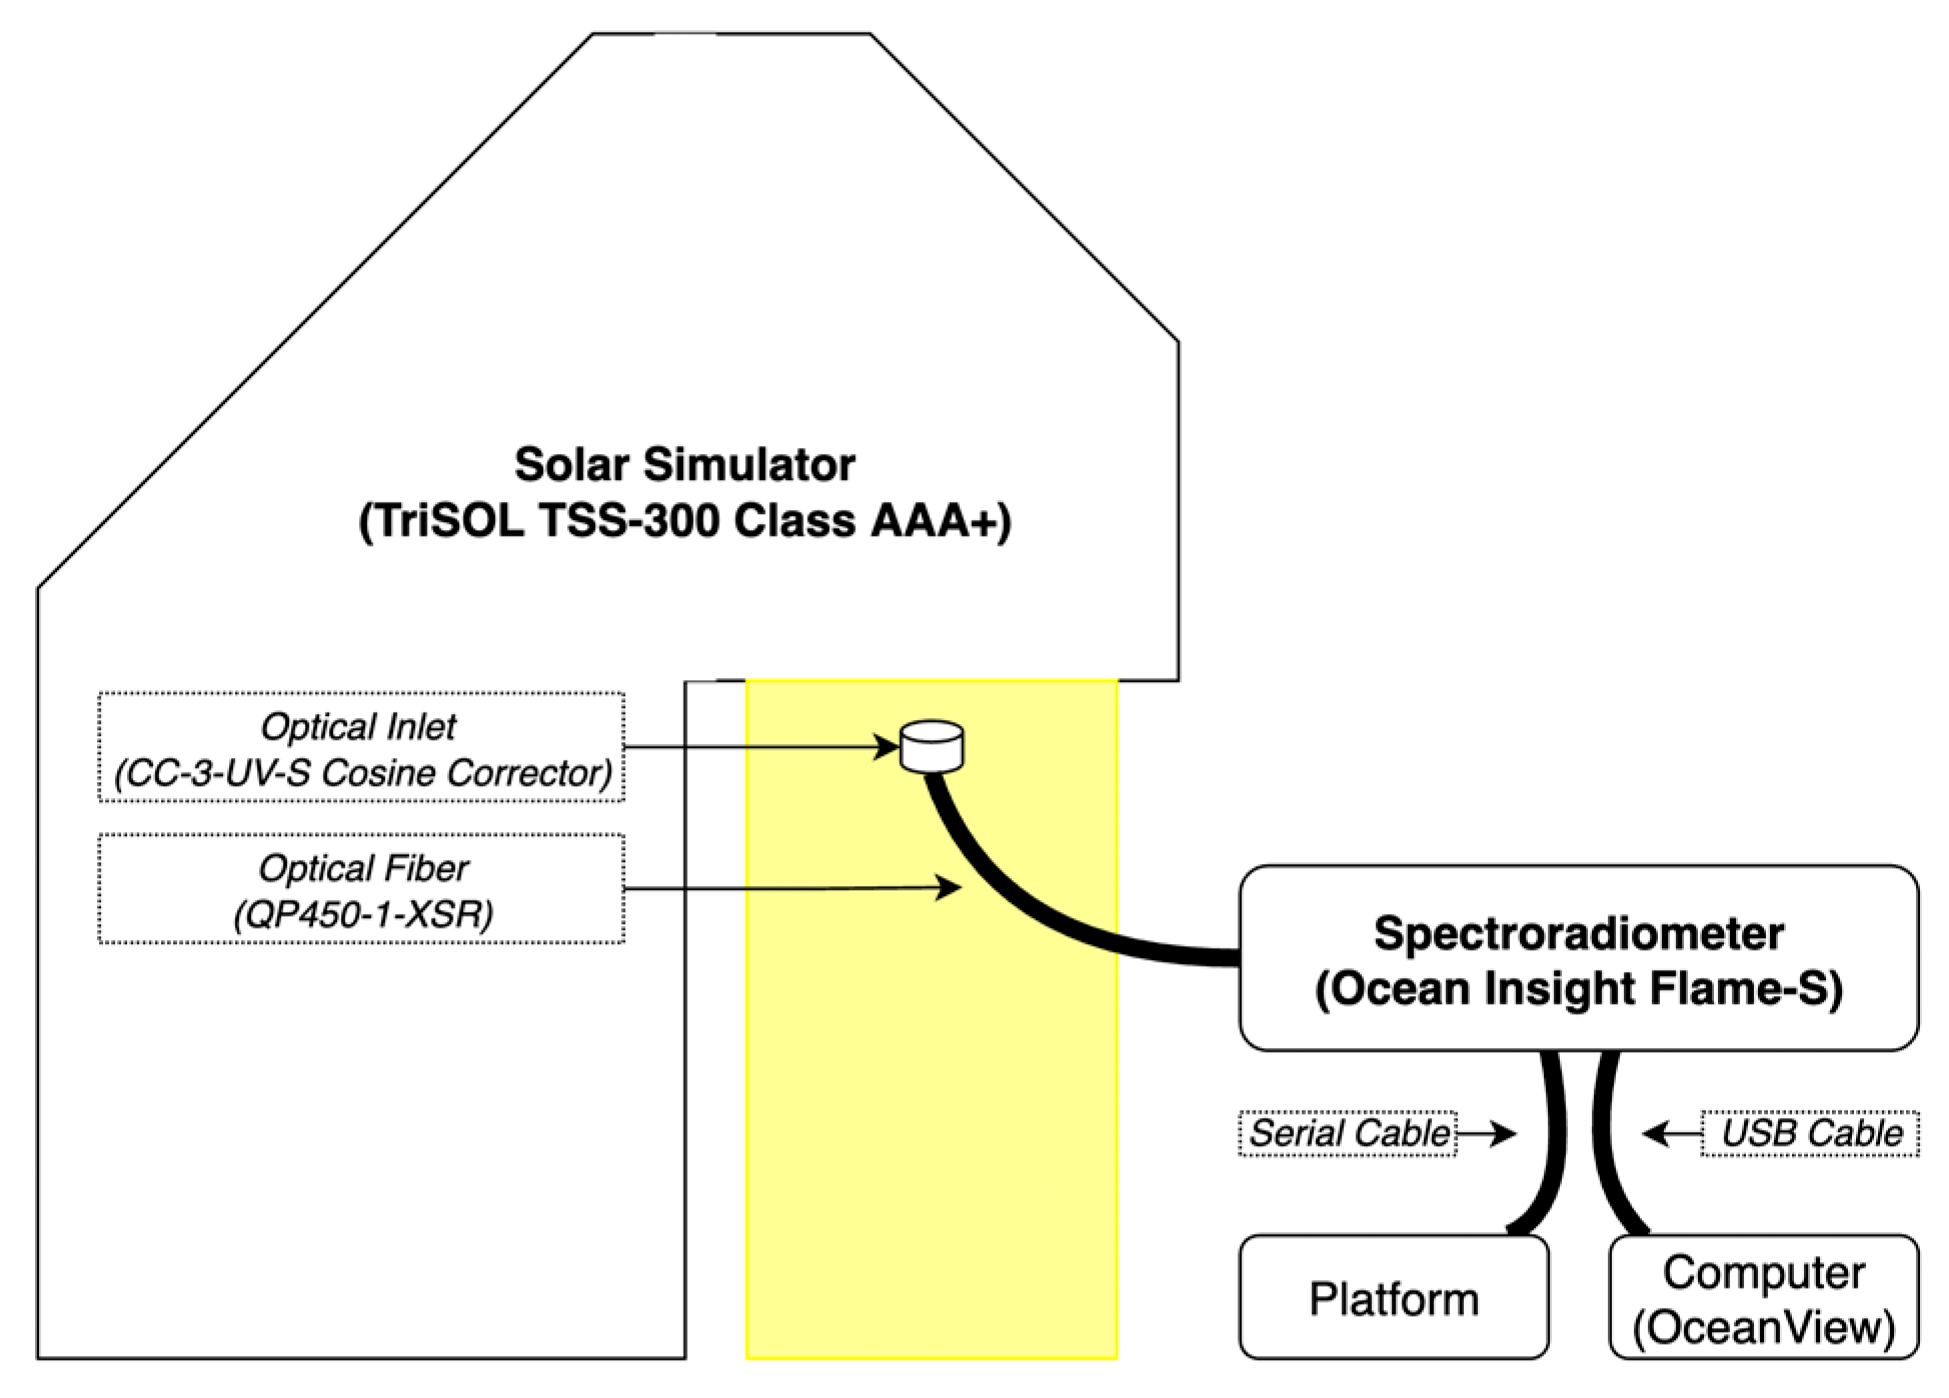
2.2. Test Source
2.3. Optical Bench
2.4. Control Software
2.4.1. Experiment #1: Platform Monitoring Sessions
2.4.2. Data Processing—Experiment #1
2.4.3. Experiment #2: Single Measurements Using Both Control Schemas
2.4.4. Data Processing—Experiment #2
2.5. Analysis
2.5.1. Mann–Whitney U-Tests
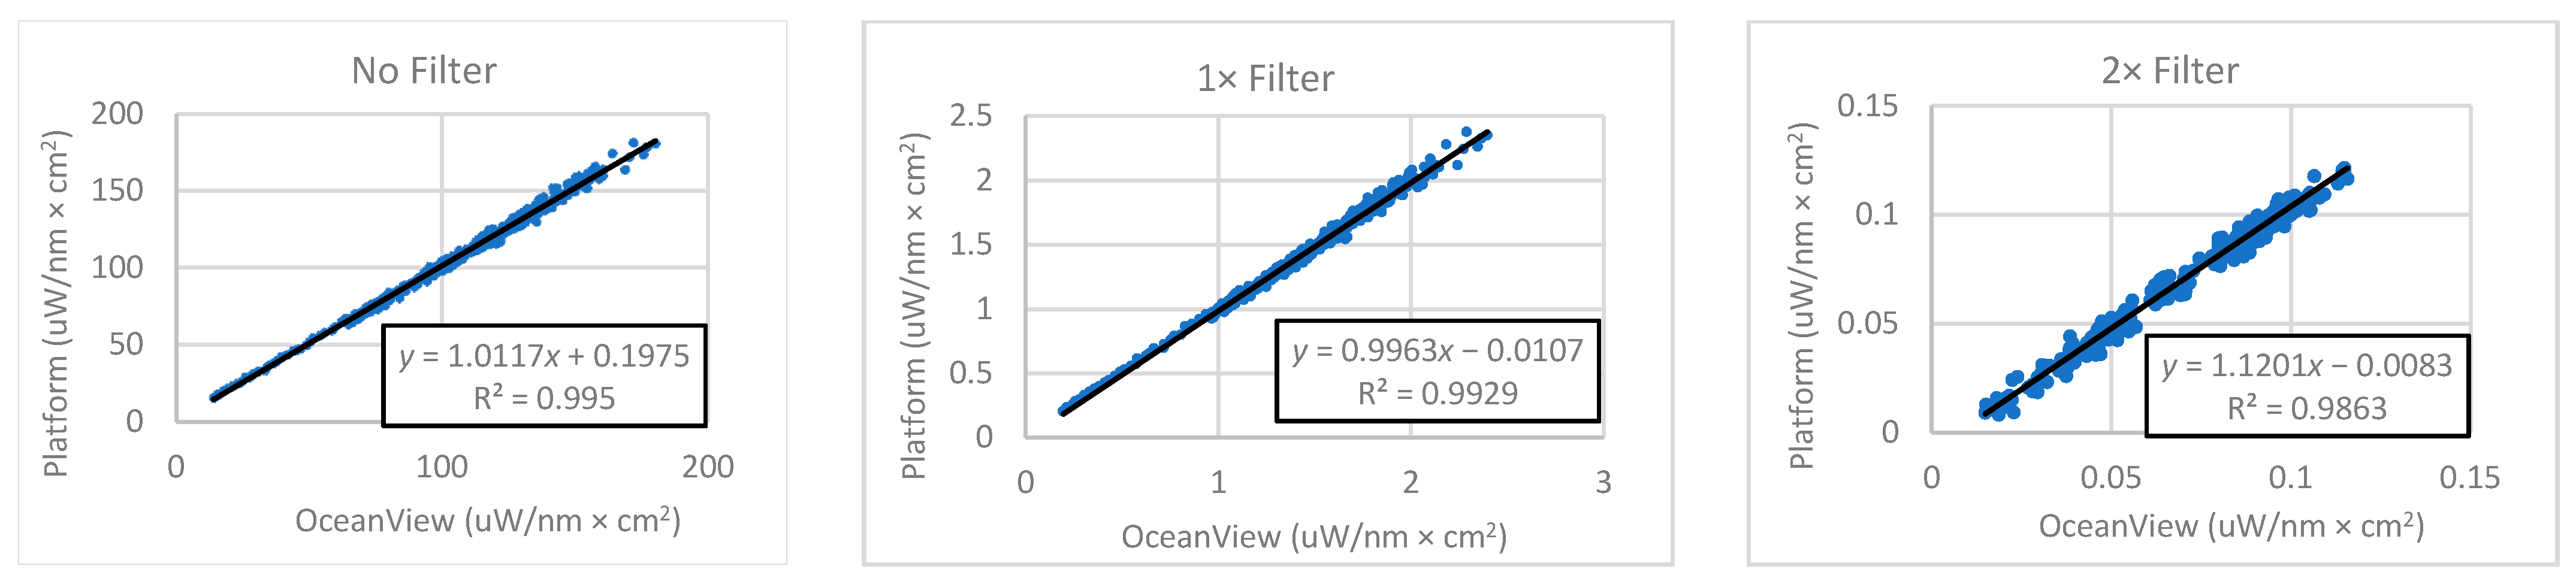
2.5.2. Linear Regressions
3. Results
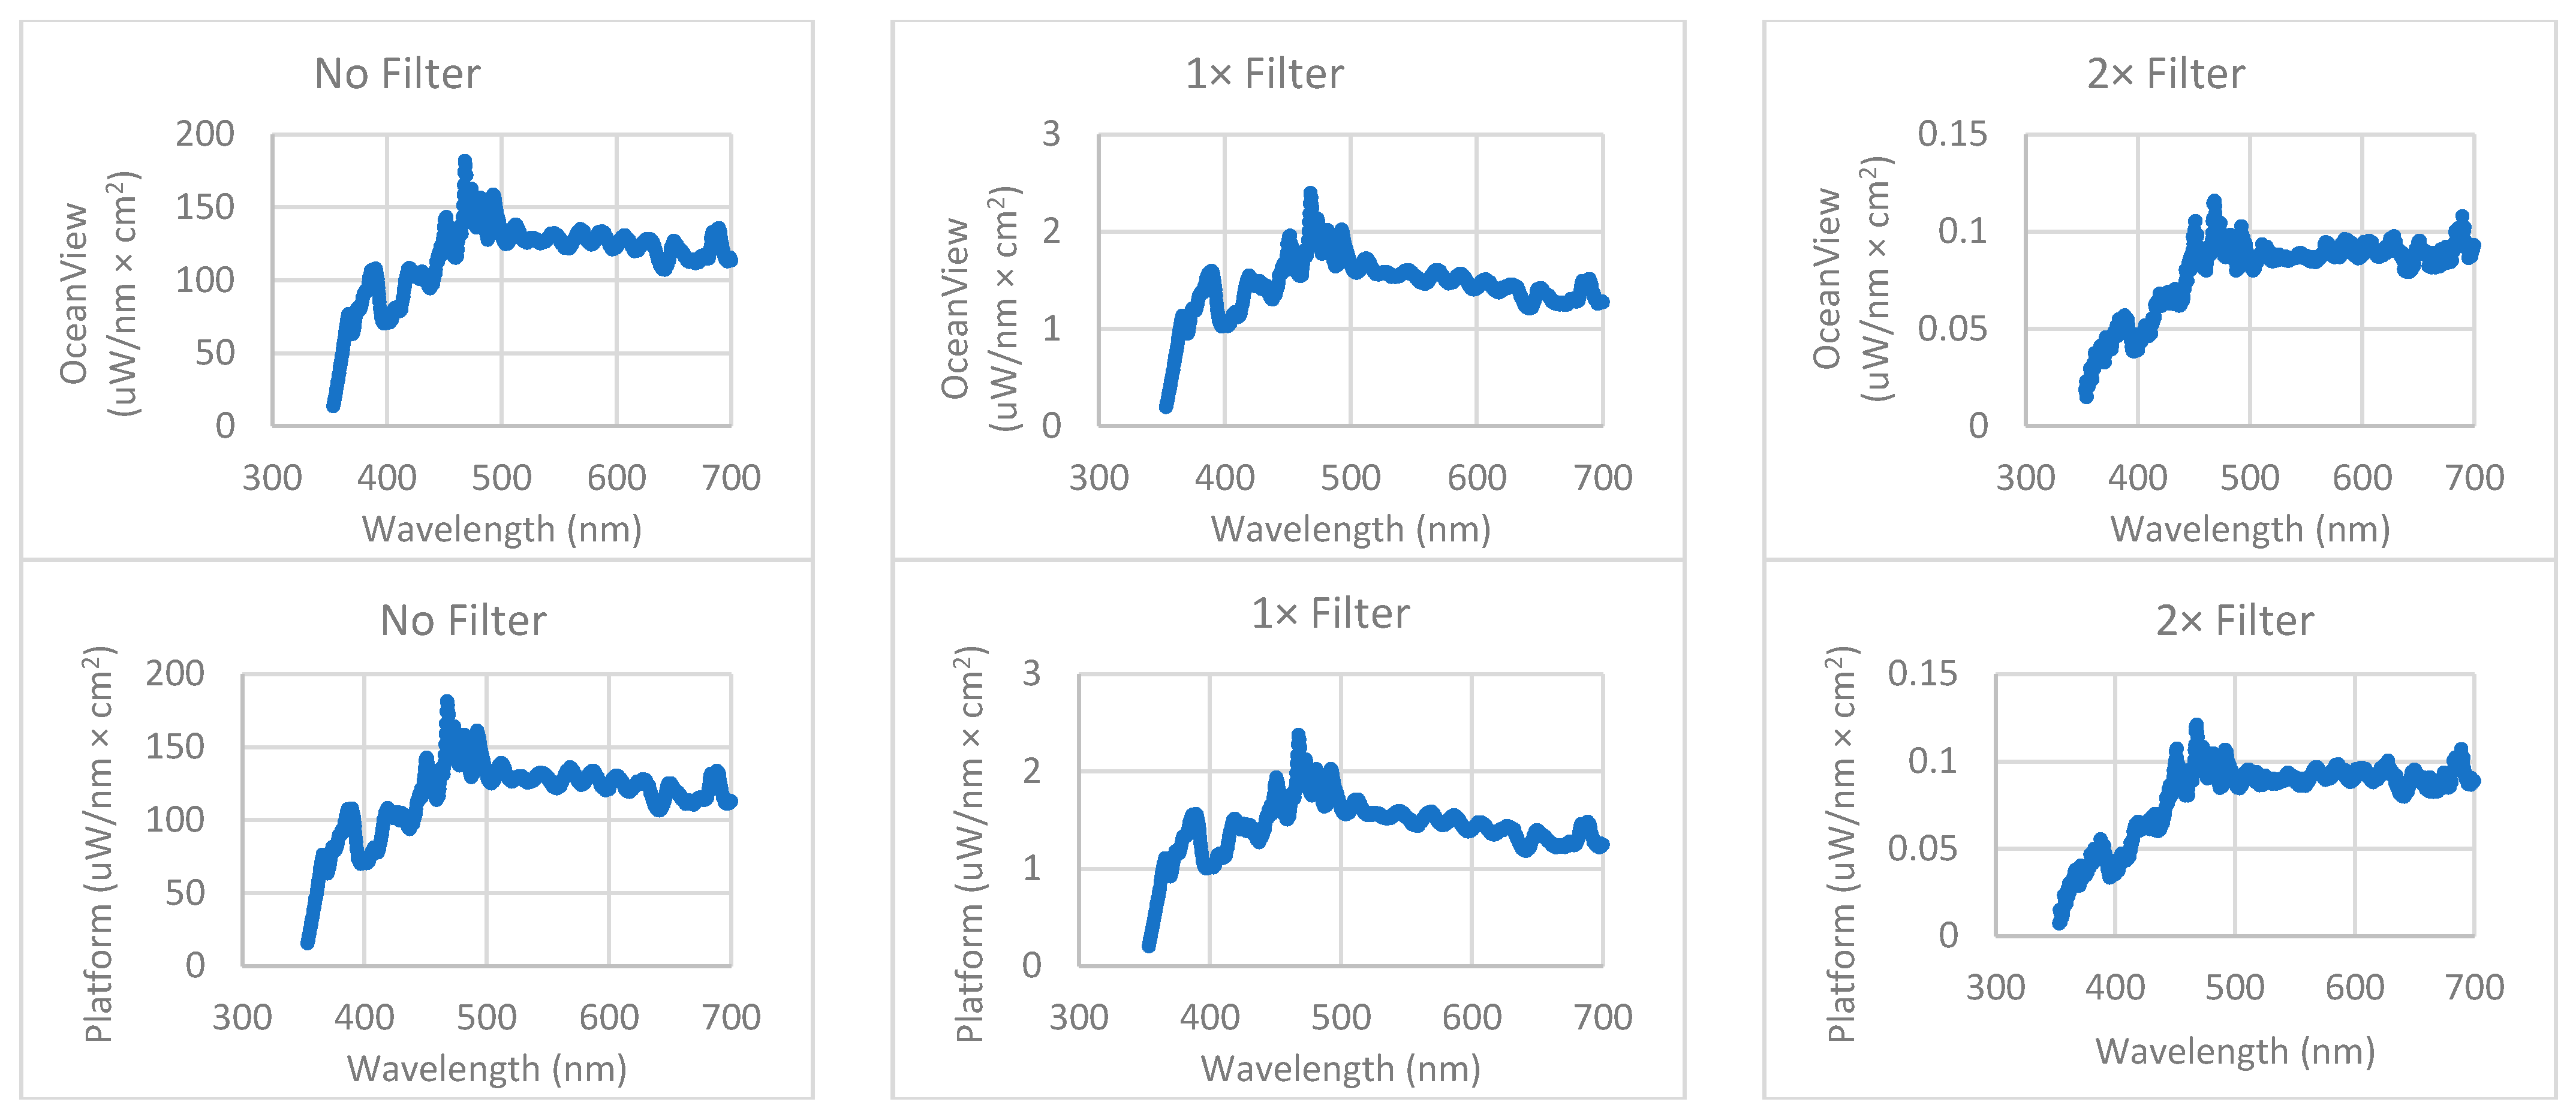
3.1. Experiment #1
3.2. Experiment #2
4. Discussion
Supplementary Materials
Author Contributions
Funding
Informed Consent Statement
Data Availability Statement
Conflicts of Interest
References
- Wallace, C.; Both, A.J. Evaluating Operating Characteristics of Light Sources for Horticultural Applications. Acta Hortic. 2016, 1134, 435–443. [Google Scholar] [CrossRef]
- Hausser, K.W. Influence of Wavelength in Radiation Biology. Strahlentherapie 1928, 28, 25–44. [Google Scholar]
- Coblentz, W.W.; Stair, R.; Hogue, J.M. The Spectral Erythemic Reaction of the Human Skin to Ultra-Violet Radiation. Proc. Natl. Acad. Sci. USA 1931, 17, 401–405. [Google Scholar] [CrossRef] [PubMed] [Green Version]
- Ichihashi, M.; Ueda, M.; Budiyanto, A.; Bito, T.; Oka, M.; Fukunaga, M.; Tsuru, K.; Horikawa, T. UV-Induced Skin Damage. Toxicology 2003, 189, 21–39. [Google Scholar] [CrossRef]
- Surdu, S.; Fitzgerald, E.F.; Bloom, M.S.; Boscoe, F.P.; Carpenter, D.O.; Haase, R.F.; Gurzau, E.; Rudnai, P.; Koppova, K.; Févotte, J.; et al. Occupational Exposure to Ultraviolet Radiation and Risk of Non-Melanoma Skin Cancer in a Multinational European Study. PLoS ONE 2013, 8, e62359. [Google Scholar] [CrossRef] [PubMed] [Green Version]
- IARC. Solar and Ultraviolet Radiation. IARC Monographs on the Evaluation of Carcinogenic Risks to Humans. 2012, Volume 100D, pp. 35–101. Available online: https://monographs.iarc.who.int/wp-content/uploads/2018/06/mono100D-6.pdf (accessed on 31 May 2022).
- Pitts, D.G.; Tredici, T.J. The Effects of Ultraviolet on the Eye. Am. Ind. Hyg. Assoc. J. 1971, 32, 235–246. [Google Scholar] [CrossRef] [PubMed]
- Pitts, D.G.; Cullen, A.P.; Hacker, P.D. Ocular Effects of Ultraviolet Radiation from 295 to 365 Nm. Investig. Ophthalmol. Vis. Sci. 1977, 16, 932–939. [Google Scholar]
- International Commission on Non-Ionizing Radiation Protection. ICNIRP Guidelines on Limits of Exposure to Incoherent Visible and Infrared Radiation. Health Phys. 2013, 105, 74–96. [Google Scholar] [CrossRef] [PubMed]
- Wong, N.A.; Bahmani, H. A Review of the Current State of Research on Artificial Blue Light Safety as It Applies to Digital Devices. Heliyon 2022, 8, e10282. [Google Scholar] [CrossRef] [PubMed]
- Chmielinski, M.; Simpson, C.; Cohen, M.; Isaken, T.; Yost, M.; Ehrlich, T. Measuring Worker Exposures to Bulb Generated Ultraviolet Radiation in the Cannabis Industry. In Proceedings of the AIHA Conference, Philadelphia, PA, USA, 21 May 2018. [Google Scholar]
- Gugg-Helminger, A. CIE 220: 2016-Characterization and Calibration Method of UV Radiometers. IUVA News 2017, 19, 18–23. [Google Scholar]
- CIE. Characterization and Calibration Methods of UV Radiometers; International Commission on Illumination: Vienna, Austria, 2016. [Google Scholar]
- Sun, J.; Lucas, R.M.; Harrison, S.; van der Mei, I.; Armstrong, B.K.; Nowak, M.; Brodie, A.; Kimlin, M.G. The Relationship between Ambient Ultraviolet Radiation (UVR) and Objectively Measured Personal UVR Exposure Dose Is Modified by Season and Latitude. Photochem. Photobiol. Sci. 2014, 13, 1711–1718. [Google Scholar] [CrossRef] [PubMed] [Green Version]
- Ocean Insight Flame Miniature Spectrometer User Manual; Ocean Insight: Orlando, FL, USA, 2015.
- Arduino Arduino Due. Available online: https://docs.arduino.cc/hardware/due (accessed on 31 May 2022).
- TIA/EIA-232; Interface between Data Terminal Equipment and Data Circuit-Terminating Equipment Employing Serial Binary Data Interchange. Telecommunications Industry Association: Arlington, VA, USA, 1997.
- HiLetgo SPI TFT LCD Display Touch Panel ILI9341. Available online: http://www.hiletgo.com/ProductDetail/2157216.html (accessed on 31 May 2022).
- Maxim Integrated DS3231 Specifications Sheet. Available online: https://datasheets.maximintegrated.com/en/ds/DS3231.pdf (accessed on 31 May 2022).
- CONXWAN. CONXWAN 18 W Battery Pack. Available online: https://www.amazon.com/Portable-Charger-26800mAh-Capacity-External/dp/B08729Z2JX (accessed on 29 August 2022).
- Zulkit. Zulkit Junction Box. Available online: https://www.amazon.com/Zulkit-Waterproof-Electrical-Transparent-220x170x110/dp/B07RVN91WB?th=1 (accessed on 31 May 2022).
- WCET. OAI Solar Simulator. Available online: https://www.wcet.washington.edu/tools/oai-solar-sim/ (accessed on 13 July 2022).
- OAI. Trisol Solar Simulator for Class AAA Performance Technical Specifications; OAI: San Jose, CA, USA, 2016. [Google Scholar]
- Chmielinski, M. Source Code for the Arduino Controller of the Ocean Insight Flame-Spectroradiometer. Available online: https://github.com/mxchml/Flame-Spectrocontroller (accessed on 1 August 2022).
- DEOHS. Field Research and Consultation Group. Available online: https://deohs.washington.edu/frcg (accessed on 18 September 2022).
- Ocean Insight Flame-S Radiometric Calibration Report; Ocean Insight: Orlando, FL, USA, 2021.
- Nehir, M.; Frank, C.; Aßmann, S.; Achterberg, E.P. Improving Optical Measurements: Non-Linearity Compensation of Compact Charge-Coupled Device (CCD) Spectrometers. Sensors 2019, 19, 2833. [Google Scholar] [CrossRef] [PubMed]
- Ocean Insight Glossary on Spectroscopy and Technical Terms. Available online: https://www.oceaninsight.com/knowledge-hub/glossary/ (accessed on 8 August 2022).


| Filter | n | Stable Duration (s) | COV (%) | MPPD (%) |
|---|---|---|---|---|
| None | 23 | 164 | 0.7 | 1.23 |
| None | 10 | 85 | 0.8 | 0.95 |
| 1× | 11 | 98 | 0.2 | 0.20 |
| 1× | 12 | 96 | 0.2 | 0.29 |
| 2× | 4 | 100 | 0.1 | 0.11 |
| 2× | 6 | 79 | 0.3 | 0.35 |
| Filter | OceanView | Mann–Whitney | Platform | ||||||||||
|---|---|---|---|---|---|---|---|---|---|---|---|---|---|
| n | Mean TSP (mW/cm2) | SD (mW/cm2) | COV | Mean IT (ms) | SD (ms) | U (p Value) | n | Mean TSP (mW/cm2) | SD (mW/cm2) | COV | Mean IT (ms) | IT SD (ms) | |
| None | 3 | 40.3 | 0.055 | 0.001 | 6.32 | 0 | 3 (0.663) | 3 | 40.3 | 0.102 | 0.002 | 5.3 | 0.58 |
| 1× | 3 | 0.503 | 0.001 | 0.002 | 484 | 0 | 0 (0.081) | 3 | 0.497 | 0.001 | 0.001 | 452 | 2.65 |
| 2× | 3 | 0.028 | <0.001 | 0.014 | 3329 | 0 | 2 (0.383) | 3 | 0.028 | <0.001 | 0.010 | 5000 | 0 |
Publisher’s Note: MDPI stays neutral with regard to jurisdictional claims in published maps and institutional affiliations. |
© 2022 by the authors. Licensee MDPI, Basel, Switzerland. This article is an open access article distributed under the terms and conditions of the Creative Commons Attribution (CC BY) license (https://creativecommons.org/licenses/by/4.0/).
Share and Cite
Chmielinski, M.J.; Cohen, M.A.; Yost, M.G.; Simpson, C.D. Wearable Spectroradiometer for Dosimetry. Sensors 2022, 22, 8829. https://doi.org/10.3390/s22228829
Chmielinski MJ, Cohen MA, Yost MG, Simpson CD. Wearable Spectroradiometer for Dosimetry. Sensors. 2022; 22(22):8829. https://doi.org/10.3390/s22228829
Chicago/Turabian StyleChmielinski, Maximilian J., Martin A. Cohen, Michael G. Yost, and Christopher D. Simpson. 2022. "Wearable Spectroradiometer for Dosimetry" Sensors 22, no. 22: 8829. https://doi.org/10.3390/s22228829
APA StyleChmielinski, M. J., Cohen, M. A., Yost, M. G., & Simpson, C. D. (2022). Wearable Spectroradiometer for Dosimetry. Sensors, 22(22), 8829. https://doi.org/10.3390/s22228829