Article

Lava Mapping Using Sentinel-1 Data after the Occurrence of a Volcanic Eruption—The Case of Cumbre Vieja Eruption on La Palma, Canary Islands, Spain

by
Aggeliki Kyriou
and
Konstantinos G. Nikolakopoulos
*
Department of Geology, University of Patras, 265 04 Patras, Greece
*
Author to whom correspondence should be addressed.
Sensors 2022, 22(22), 8768; https://doi.org/10.3390/s22228768
Submission received: 31 August 2022 / Revised: 10 October 2022 / Accepted: 11 November 2022 / Published: 13 November 2022

Abstract

:
Volcanic eruptions pose a great threat to humans. In this context, volcanic hazard and risk assessment constitute crucial issues with respect to mitigating the effects of volcanic activity and ensuring the health and safety of inhabitants. Lava flows directly affect communities living near active volcanoes. Nowadays, remote sensing advances make it possible to effectively monitor eruptive activity, providing immediate and accurate information concerning lava evolution. The current research focuses on the mapping of the surface deformation and the analysis of lava flow evolution occurred on the island of La Palma, during the recent (2021) eruptive phase of the volcano. Sentinel-1 data covering the island were collected throughout the entire eruptive period, i.e., September 2021 until January 2022. The processing was based on amplitude-based and phase-based detection methods, i.e., Synthetic Aperture Radar interferometry (InSAR) and offset tracking. In particular, ground deformation occurred on the island, while Line-Of-Sight (LOS) displacements were derived from Sentinel-1 interferograms. Moreover, the evolution of lava flow velocity was estimated using Sentinel-1 imagery along with offset tracking technique. The maximum lava flow velocity was calculated to be 2 m/day. It was proved that both approaches can provide rapid and useful information in emergencies, especially in inaccessible areas. Although offset tracking seems a quite promising technique for the mapping of lava flows, it still requires improvement.

1. Introduction

Volcanic eruptions are one of the greatest threats to humans. According to the World Health Organization, millions of people were affected and thousands lost their lives from volcanic activities between 1998 and 2017 [1]. In addition, the spewing of hot/dangerous gases, ash, lava and rocks can cause catastrophic losses to essential services (water, transport, communications, etc.), infrastructure and the environment. There are approximately 1500 active or potentially active volcanoes worldwide, while a significant percentage of the population lives in their vicinity. Therefore, volcanic hazard and risk assessment are crucial issues with respect to mitigating the effects of the volcanic activity and ensuring the health and safety of inhabitants. Lava flows are a serious hazard to communities living close to active volcanoes, as the destruction they cause is commonly large in scale [2,3]. In this context, local communities need immediate and accurate information regarding the spread of newly erupted lava [4].
Advances in remote sensing technology have opened up new opportunities in the monitoring of eruptive activity, offering a vast amount of data with a wide range of temporal and spatial resolution, acquired using different sensors [5,6,7,8,9]. The rapid monitoring and assessment of volcanic hazard over large-scale and/or inaccessible areas are the main advantages of such approaches, contributing to a more comprehensive understanding of ongoing volcanic processes. Synthetic Aperture Radar (SAR) has emerged as a valuable source of information for the monitoring and assessment of volcanic hazard, since this specific type of sensor is able to collect data throughout the day under any atmospheric conditions [10,11,12]. In the first attempts, SAR imagery was processed along with multispectral (Landsat, ASTER, SPOT, etc.) or topographical (Shuttle Radar Topography Mission/ASTER DEM) data, aiming at the mapping, quantification and investigation of the lava flows in terms of structure, thickness, morphology and texture [13,14]. Moreover, coherence-based SAR techniques have proven particularly effective in detecting terrain changes and active flow paths, arising from lava flows, as radar signal is directly affected by the modifications of surface’s scattering properties [15,16].
Interferometric Synthetic Aperture Radar (InSAR) is one of the most effective and widely applied satellite techniques for the precise measurement of the Earth’s deformation. Thus, SAR interferograms created by TerraSAR-X, Envisat, ERS, COSMO-SkyMed and ALOS data have been exploited as operational tools for the detection and analysis of surface deformation, which is related to volcanic activity, as well as for the determination of long-term lava subsidence and behavior [17,18,19]. The launch of the Sentinel-1 constellation dramatically increased the amount of SAR imagery, allowing scientists to take a look at volcanoes’ inner processes and eruption mechanisms [20]. Meanwhile, advanced interferometric techniques such as Persistent Scatterer Interferometry (PSI) and Multi-Temporal InSAR (MT-InSAR) have been developed in order to overcome the limitations (i.e., temporal decorrelation, atmospheric contribution) of the conventional interferometric approaches and to assess volcanic deformation in a more reliable way [21,22]. In this context, the Committee on Earth Observation Satellites (CEOS) undertook a four-year (2013–2017) pilot project for the cost-effective and efficient monitoring of volcanoes around the world, using multi-satellite radar imagery along with interferometric techniques [23]. The most recent studies report the synergistic use of multi-sensor remote sensing data (radar, multispectral, etc.) with the aim of effectively mapping lava flows and achieving real-time assessment of volcanic hazards. These automated approaches are based on hierarchical split-based methods, machine learning algorithms, or convolutional neural networks [24,25,26].
The current research focuses on the mapping of surface deformation and the analysis of the evolution of lava flows occurring on the island of La Palma during the recent eruptive phase of the volcano. To this end, Sentinel-1 data over the island were collected, covering the entire eruptive period, i.e., September 2021 until January 2022. The processing was based on the exploitation of both amplitude and phase information derived from SAR’s backscattering signal. Specifically, Sentinel-1 interferograms were created throughout the investigated period and ground deformation was estimated using Line-Of-Sight (LOS) displacements. Moreover, the offset tracking technique constitutes a powerful approach for the mapping of displacements in both azimuth and slant-range direction. The method applies a cross-correlation algorithm between a SAR reference and secondary images, and it is based on feature similarity of homologous intensity patches. Therefore, feature velocities of the intensity patches are calculated. This technique has been widely used in the investigation of glacier motion [27,28,29], and has recently been used in the identification of terrain changes related to landslide phenomena [30,31]. In volcanic research, offset tracking has been applied in a few studies associated with either the growth of the lava dome or the detection of instabilities on the flanks of a volcano [32,33]. The current study suggests that the offset tracking technique can also be used in the mapping of lava flows as they proceed from the crater to their endpoint. Hence, this is the main contribution of the current research.
In summary, this work proposes an almost near-real-time monitoring approach for the analysis of the surface deformation and lava flow evolution during a volcanic crisis. Ground displacements as well as lava flow velocities are the main processing outcomes, and can be used effectively for the proper design and implementation of holistic risk management plans. Specifically, awareness of lava flow velocity is a crucial parameter for local stakeholders in order to safely evacuate nearby settlements, reducing the potential risk of human casualties. Characteristic examples of how catastrophic a volcanic eruption could be include the Mont Pelee and Krakatau eruptions. More specifically, pyroclastic flow caused by the 1902 eruption of Mont Pelee, in Martinique, Lesser Antilles, destroyed the coastal city of St. Pierre, killing about 30,000 inhabitants. In addition, 36,000 people lost their lives in the Krakatau volcanic eruption in 1883.
In recent years, the evolution of remote sensing technology has contributed to the minimization of human casualties; however, volcanic eruptions still result in extreme damage to the environment and infrastructure. SAR technology offers almost-real-time updates for lava flow direction and velocity that could be used in synergy with relief information to perform the immediate calculation of the distance between the lava and the nearest settlements and provide an accurate estimation of the remaining time available for evacuation.

2. Materials and Methods

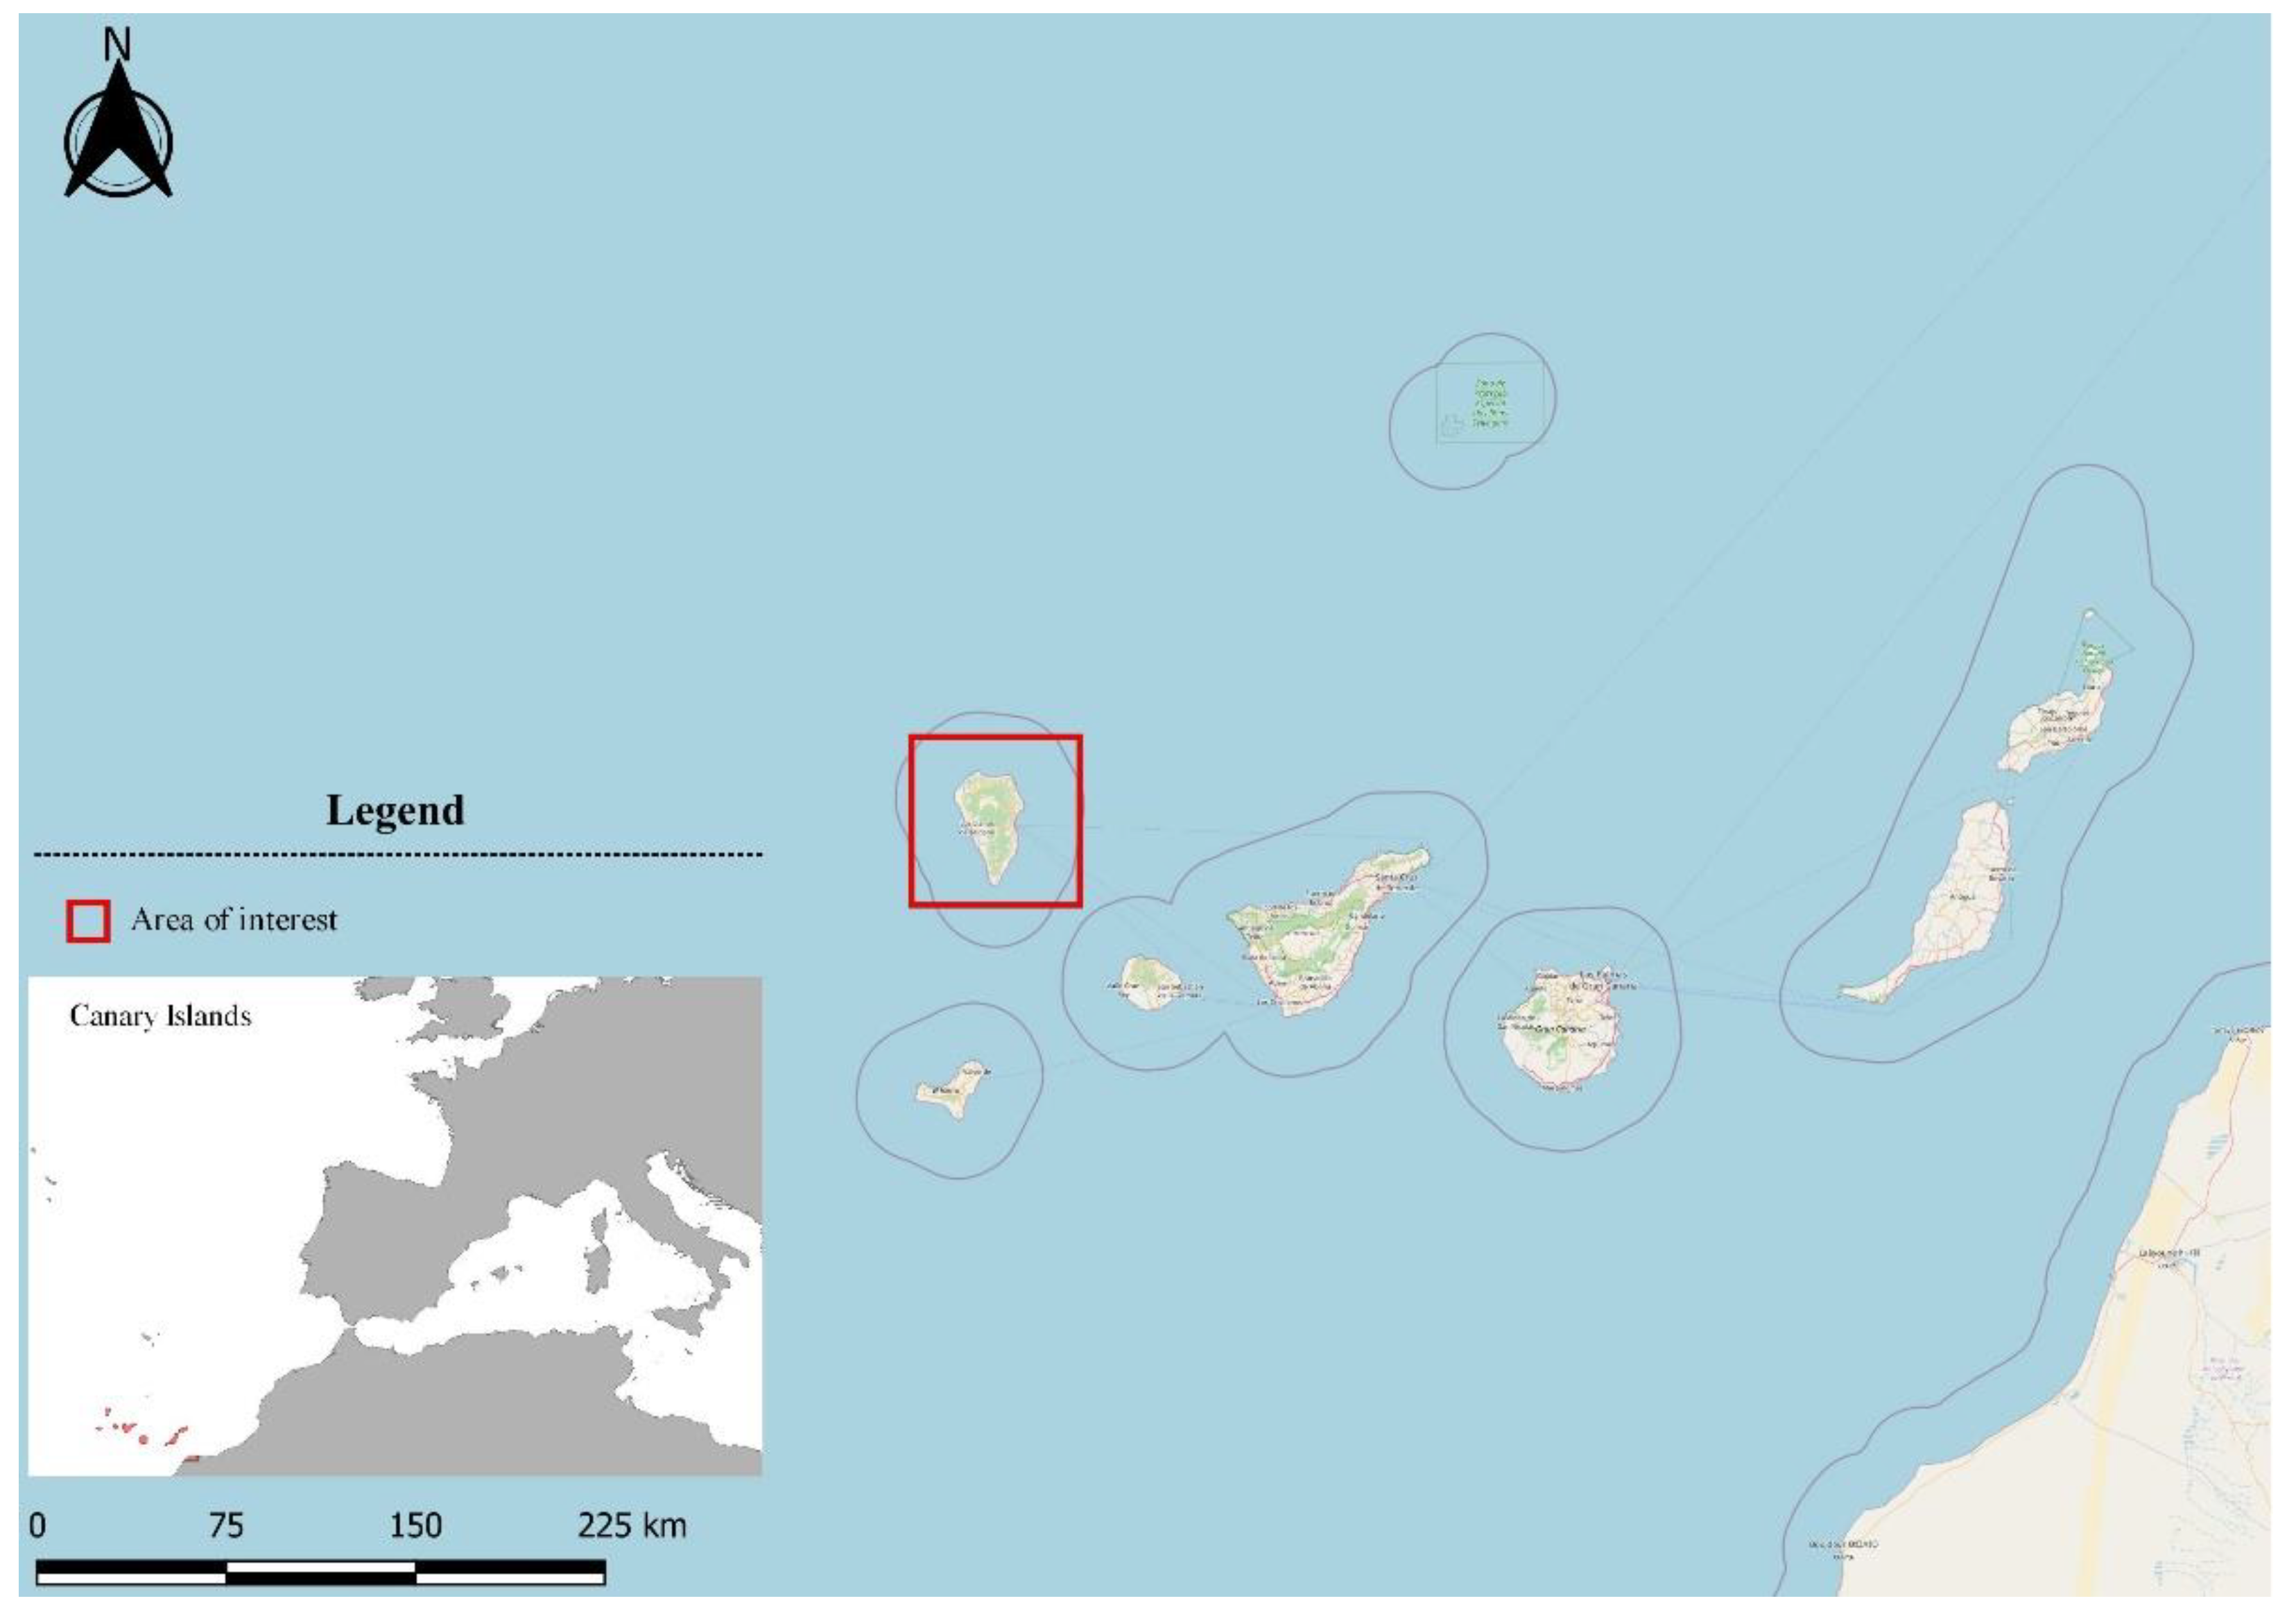
2.1. Area of Interest—La Palma Volcanic Eruption

The Canary Archipelago comprises a chain of seven major volcanic islands (Figure 1), which are located approximately 100 km off the north-west coast of Africa and are emplaced beneath oceanic crust, as evidenced by the identification of gabbro xenoliths with tholeiitic basalt-type composition [34,35,36]. This volcanic province is formed by a mantle plume subducting beneath a slowly moving oceanic lithosphere, evolving from NE to SW [37,38,39,40]. The magmatic activity, within the province started over 20 million years ago, when the eastern islands of Lanzarote and Fuerteventura began to develop. La Palma and Tenerife are currently the youngest and the most volcanically active islands, representing the present-day location of hotspot magmatism [41,42].
La Palma is the northwestern island of the Canary archipelago (Figure 1), covering an area of 708 km2. The very low precipitation and the relief of the island have resulted in the absence of a drainage network. The average annual temperature is close to 20 degrees Celsius, and the maximum altitude reaches 2426 m. The population of La Palma is 87 thousand, and the main economic activities are tourism and agriculture. According to a recent study [43], there are five main land use–land cover classes in the Canary Islands: forests and semi-natural areas, agricultural areas, artificial surfaces, water bodies and wetlands. In recent decades (1990–2018), an increase in artificial surfaces with a corresponding decrease in agricultural areas has been observed.
The geological structure of La Palma was described in detail in [38,42,44], while the precise aging of the formations was described by [45,46]. La Palma’s geological setting can be distinguished into three major units: the oldest one is the Basal Complex (c. 40 to 30 Ma), which consists of a Pliocene seamount sequence and a plutonic complex, which was uplifted and tilted by coeval intrusions [47]; the intermediate volcanic series (17 Ma to 400 ka); and the younger volcanic series (125 ka to present). The latter, named Cumbre Vieja, consists of numerous volcanic cones formed by lava and scoria, and occupies the southern part of the island. It is a broad lava field emplaced during the 1677–1678 eruption. Lava flows also reached the sea in 1585, 1646, 1712, 1949, 1971, and 2021.
On 19 September 2021, an eruption took place at the Cumbre Vieja volcanic ridge, revealing that the area is still active. Volcanic activity lasted from 19 September to 13 December 2021, while the eruption was officially declared to have ended on 25 December 2021—after 12 days without any activity. Therefore, this specific eruption is characterized as the longest and most damaging recorded volcanic eruption on La Palma. During the 85 days of volcanic activity, an area of 10 km2 was covered by lava, 3000 buildings were destroyed, and 7000 people were evacuated. According to the government of the Canary Islands, the total damage was estimated at about EUR 843 million.

2.2. SAR Data

The Sentinel-1 constellation constitutes the first mission of the European Union’s Earth observation program, named Copernicus. The constellation consists of two radar satellites (i.e., Sentinel-1A, Sentinel-1B) orbiting the same polar orbital plane. Sentinel-1A was launched in 2014, while the identical Sentinel-1B was placed into orbit in 2016. Both carry C-band SAR instruments (5.6 cm wavelength), operating at a center frequency of 5.405 GHz and providing data in single or dual polarization. The Sentinel-1 satellites are able to capture Earth images in four different acquisition modes (Stripmap, Interferometric Wide swath, Extra Wide swath, Wave) with spatial resolution varying from 5 to 40 m with coverage up to 400 km. The short revisit time and the free availability of the data are the main advantages of the mission.
The mapping of the ground deformation, caused by the volcanic eruption on La Palma island, was carried out using Sentinel-1’s interferometric wide swath mode imagery. This mode is the most suitable for land applications, allowing the scanning of a swath with a width of 250 km at a moderate spatial resolution (5 × 20 m). The homogeneous image quality over the entire surface of swath is ensured by Terrain Observation with Progressive Scans SAR (TOPSAR) technique, in which the radar’s beam is steered electronically from backward to forward in the azimuth direction for each burst while also steering the beam within the range. In the current study, Sentinel-1 IW Single Look Complex (SLC) and Ground Range Detected (GRD) data, acquired during the ascending and descending pass, were collected over La Palma island (Figure 2), throughout the eruptive phase (Table 1). The SLC products consist of focused and georeferenced SAR data, and include a single look in each dimension while maintaining phase information. In contrast, the GRD products consist of focused SAR data without phase information that have been detected, multilooked and projected on the basis of an ellipsoid model of the Earth.

2.3. Methods Applied

The mapping of the surface deformation caused by the recent volcanic eruption on the island of La Palma was based on the processing of Sentinel-1 imagery via InSAR and offset tracking techniques. A flowchart presenting the main steps of the applied methodology is presented in Figure 3.
InSAR is a valuable technique that has been applied for the investigation of ground deformation emerging from geological, volcanic, tectonic, seismic or anthropogenic processes since 1992, in which year ERS-1 data were successfully used to capture the surface deformation caused by the Landers earthquake in Southern California [48,49,50,51,52]. Since then, the rapid advances in technology and the launch of new SAR satellites have contributed to more accurate measurements of surface deformation, and therefore a more comprehensive understanding of ongoing Earth processes. In this context, Sentinel-1 IW SLC products were obtained in order to map the surface deformation over La Palma. Processing was performed using the Sentinel Application Platform (SNAP) software, following a standard interferometric procedure. More specifically, the collected imagery was imported into the software, and critical interferometric parameters, including perpendicular baseline and coherence, were estimated for each Sentinel-1 interferometric pair (Table 2). The perpendicular baseline constitutes the projection of the interferometric baseline perpendicular to the slant range, while interferometric coherence is a correlation coefficient between the multitemporal SAR images. These two parameters can be used to determine whether interferometric pairs are suitable for further processing, or if they are dominated by phase noise. Subsequently, the data were corrected using accurate orbital information, and then SAR coregistration was applied. The next steps of InSAR processing consisted of the following procedures: interferogram generation, topography removal, interferogram filtering, phase unwrapping, phase to displacement conversion, and terrain correction (Figure 3). It is worth mentioning that the removal of the topographic phase component was carried out using a Shuttle Radar Topography Mission (SRTM) 1 Arc-Second Global DEM [53], while a Goldstein filter was applied as a phase filtering operation [54]. Monthly Sentinel-1 interferograms and the corresponding Line Of Sight (LOS) displacements were extracted as the end products of the procedure.
Despite the wide acceptance of InSAR techniques for post-eruption volcanic assessment [55,56], it was observed that phase-based deformation methods face some limitations in the monitoring of the evolution of the eruption associated with the loss of SAR coherence due to the significant changes in the terrain. The current research examined whether the amplitude-based methods for surface change identification could be a complementary source of information in the middle of volcanic emergencies. Thus, the Sentinel-1 IW GRD products were imported into SNAP, and they were processed using the offset tracking technique in order to estimate lava flow velocities on La Palma (Table 3). Specifically, the processing of the Sentinel-1 IW GRD products using the aforementioned approach consisted of: correction of the SAR imagery with the respective precise orbital data, the removal of thermal noise, radiometric calibration, co-registration, patch cross-correlation optimization (i.e., offset tracking), and terrain correction. The lava flow velocities were the final output of the procedure. The processing parameters of the applied approach were defined as described in [57].

3. Results

3.1. SAR Interferometry

The Sentinel-1 IW SLC products were processed in order to obtain multitemporal (one per month) interferograms (Figure 4 and Figure 5). In particular, the interferometric fringes, detected in the southwestern part of the island a few days before the eruption (19 September 2021) indicate that the area was deforming (Figure 4a and Figure 5a). The specific deformation is related to the upwelling of magma and ground inflation [58]. Meanwhile, dense interferometric fringes were observed in the same location in the ascending and descending interferograms, revealing the deformation caused to the island during the eruptive phase (Figure 4b–f and Figure 5b–f). The Sentinel-1 interferograms derived by processing the descending data were more suitable for deformation analysis, since they included cleaner and sharper interferometric fringes. Conversely, the interferograms created using Sentinel-1 ascending imagery were characterized by phase decorrelation, which is probably associated with the lower coherence values between the SAR acquisitions (Table 2). Moreover, it is obvious that with increasing temporal baseline of the selected interferometric pairs, there is a decrease in the quality of the generated interferograms.
As already mentioned, LOS displacements were estimated by processing the acquired Sentinel-1 data. Figure 6 and Figure 7 depict the LOS displacements obtained by processing the data collected during ascending and descending pass, respectively, during different stages of volcanic activity. Specifically, Figure 6a and Figure 7a display the LOS displacements over the island before the volcanic eruption, while Figure 6b and Figure 7b present the corresponding LOS displacements after the eruption. A relative movement towards the satellite can be observed in blue color in Figure 6a and Figure 7a, suggesting ground inflation prior to the upcoming eruption [58]. Meanwhile, areas moving away from the satellite can be identified in both the ascending and descending data after the volcanic eruption (Figure 6b and Figure 7b). These areas are mapped in red, and are linked to the volcano’s deflation. The multitemporal evolution of the LOS displacements throughout the entire eruption period (i.e., from a few days before the eruption until the end of the eruptive phase) is depicted in Figure 8 and Figure 9, corresponding to ascending or descending imagery, respectively. Repeated episodes of subsidence and uplifts can be observed in both figures, and are closely associated with the various eruptive phases (i.e., inflation–deflation, crystallization and cooling, etc.).

3.2. Offset Tracking

Offset monitoring was used to monitor the evolution of lava flows on the island throughout the entire eruptive phase. This approach was used as a complementary source of information that cannot be extracted using conventional InSAR methods due to limitations related to coherence loss. The extent and velocity of lava flow during the various phases of the eruption, derived by processing the Sentinel-1 GRD ascending and descending products, are depicted in Figure 10 and Figure 11, respectively. High lava velocities (>2 m/day) are displayed in red, while blue corresponds to the lowest velocities. As can be observed in Figure 10a and Figure 11a, lava flow initially developed around the vents and then progressed westward down the slope, toward the coastline (Figure 10b and Figure 11b). The extent of the lava flow continued to expand, forming a lava delta (Figure 10c and Figure 11c), while lava flow velocity decreased dramatically after December (Figure 10d and Figure 11d). Section AA’ was defined (Figure 10a and Figure 11a) with the aim of performing a more detailed analysis of the evolution of lava flow velocity over time. Thus, lava flow velocity profiles were generated, either from ascending or descending Sentinel-1 data, during the various eruptive phases (Figure 12 and Figure 13). The highest lava flow velocities were recorded during the first eruptive phase, and ranged between 6 and 8 m/day (Figure 12a and Figure 13a).

4. Discussion

The immediate and accurate provision of operational information concerning volcanic activity—surface deformation as well as the spread of lava—are a critical and high-priority issue for communities living near volcanoes. In this context, the current study focused on analyzing the surface deformation occurring on the Cumbre Vieja volcanic ridge by means of InSAR and offset tracking. The operational capabilities of SAR (i.e., collection of data independent of weather conditions) have already been demonstrated in more than 500 volcanic monitoring case studies [59,60].
The latest La Palma eruption has been a research topic of interest for several scientists. In particular, recent studies have focused on the near-real-time mapping of active lava flows in subaerial hotspot eruptions using data provided by Fire Information for Resource Management System (FIRMS) [61], as well as in the analysis of the post-eruption topographic changes though the creation of high-resolution Digital Surface Models, obtained by Unmanned Aerial Vehicles [62,63]. Other researchers have attempted to create a numerical model to simulate the propagation of a tsunami that could potentially be caused by a submarine slide of the accumulated lava, placed on the island nearshore [64]. In addition, satellite remote sensing data have been used to identify the spatial extent and intensity of the impact of sulfur emissions in the pine forest of the island [65].
In terms of our research, the interpolation of the multitemporal interferograms, as well as the pre- and post-eruption LOS displacements, revealed that: (a) the island was uplifted before the eruption due to magma influx; and (b) the eruption was followed by a relatively rapid subsidence, arising from the removal of magma and gas. The detection of uplift in InSAR data prior to a potential future eruption has been observed and described in other cases [66,67]. Conversely, it has been demonstrated that the decrease in pressure in the magma reservoir after the eruption is reflected by an increase in subsidence in LOS displacements [67,68]. In fact, the aforementioned observation pattern, consisting of uplift and subsidence, is an important indication that a volcano is entering either an unrest period [69,70] or a post-unrest period [22]. Other researchers have related uplift and subsidence, as depicted in InSAR observations, to the morphology, geometry, and magma composition of the volcano under investigation [71].
As mentioned previously, we attempted to overcome the limitations of InSAR with respect to surface deformation monitoring related to the spread of lava flows by using the offset tracking technique. The results demonstrated that the approach was able to monitor the evolution of lava flows on the island throughout the entire eruptive period. Indeed, offset tracking outcomes are comparable to the lava flow area (Figure 14), derived from Copernicus Emergency Management Service-Mapping [72]. Although offset tracking is typically less accurate (~1/10 of pixel resolution), this approach can make an effective contribution to the measurement of large-scale surface displacements in both azimuth and slant range direction [73]. The main asset of the current study is the proposition of the offset tracking technique as a rapid and functional solution for the mapping of lava flows during a volcano’s eruptive phase. The existence of a variety of SAR satellites (Sentinel-1, Cosmoskymed, TerraSAR-X, ALOS, etc.) guarantees the acquisition of images during a volcanic crisis. Thus, SAR data are the only near-real-time source of information that can be used as an immediate solution for risk reduction and hazard management. In addition, the offset tracking processing time of a few hours (depending on network and computer capacities) makes it possible to achieve near-real-time computation of lava velocity. It is worth mentioning the amplitude-based change detection methods have been exploited to: (a) the monitoring, analysis and quantification of dome growth mechanisms and processes [30,74] and (b) the assessment of instabilities on volcano’s flanks [29]. As the approach proved quite promising, further investigation is required to enhance its robustness. In this context, the integration of higher-precision topographic information (Digital Elevation Models), could potentially yield better accuracy and spatial coverage of the extent of lava flow, thus improving monitoring ability.

5. Conclusions

The current study focused on mapping the ground deformation caused by the recent volcanic activity on the island of La Palma. In this context, Sentinel-1 products were collected and processed using InSAR and offset tracking techniques.
The key points of the research can be summarized as follows:
  • Sentinel-1 interferograms are able to capture ground deformation related to either (a) the upwelling of magma and ground inflation a few days before the eruption, or (b) the eruptive phase.
  • The relative movement towards the satellite indicated ground inflation prior to the upcoming eruption, while post-eruption deflation was accompanied by a relative movement away from the satellite.
  • The multitemporal evolution of LOS displacements throughout the entire eruptive period was linked to the various eruptive phases (i.e., inflation–deflation, crystallization and cooling, etc.).
  • Offset tracking was successfully used to monitor the evolution of lava flows on the island throughout the entire eruptive period.
  • High lava velocities (>2 m/day) were detected.
  • The analysis of the evolution of lava flows contributed to achieving a better understanding of the volcanic processes.

Author Contributions

Conceptualization, K.G.N. and A.K.; methodology, A.K.; software, A.K. writing—original draft preparation, A.K.; writing—review and editing, K.G.N. and A.K.; visualization, A.K. All authors have read and agreed to the published version of the manuscript.

Funding

This research received no external funding.

Institutional Review Board Statement

Not applicable.

Informed Consent Statement

Not applicable.

Data Availability Statement

The data presented in this study are available on request from the corresponding author. The data are not publicly available, due to privacy considerations.

Acknowledgments

The authors would like to acknowledge the European Space Agency (ESA) for the provision of Sentinel-1 data through the Copernicus Open Access Hub (https://scihub.copernicus.eu/) (accessed on 12 November 2022). Moreover, the authors are thankful to the “Copernicus Emergency Management Service”. Directorate Space, Security and Migration, European Commission Joint Research Centre (EC JRC) for the open and free-of-charge data availability (https://emergency.copernicus.eu/) ( accessed on 12 November 2022).

Conflicts of Interest

The authors declare no conflict of interest.

References

  1. World Health Organization. Volcanic Eruptions. Available online: https://www.who.int/health-topics/volcanic-eruptions#tab=tab_1 (accessed on 21 July 2022).
  2. Del Negro, C.; Cappello, A.; Neri, M.; Bilotta, G.; Hérault, A.; Ganci, G. Lava flow hazards at Mount Etna: Constraints imposed by eruptive history and numerical simulations. Sci. Rep. 2013, 3, 3493. [Google Scholar] [CrossRef] [PubMed] [Green Version]
  3. Del Negro, C.; Cappello, A.; Bilotta, G.; Ganci, G.; Hérault, A.; Zago, V. Living at the edge of an active volcano: Risk from lava flows on Mt. Etna. GSA Bull. 2020, 132, 1615–1625. [Google Scholar] [CrossRef]
  4. Jenkins, S.F.; Day, S.J.; Faria, B.V.E.; Fonseca, J.F.B.D. Damage from lava flows: Insights from the 2014–2015 eruption of Fogo, Cape Verde. J. Appl. Volcanol. 2017, 6, 6. [Google Scholar] [CrossRef]
  5. Blackett, M. An Overview of Infrared Remote Sensing of Volcanic Activity. J. Imaging 2017, 3, 13. [Google Scholar] [CrossRef] [Green Version]
  6. Pyle, D.M.; Mather, T.A.; Biggs, J. Remote sensing of volcanoes and volcanic processes: Integrating observation and modelling-introduction. Geol. Soc. Spec. Publ. 2013, 380, 1–13. [Google Scholar] [CrossRef]
  7. Francis, P.W.; Wadge, G.; Mouginis-Mark, P.J. Satellite Monitoring of Volcanoes. In Monitoring and Mitigation of Volcano Hazards; Springer: Berlin/Heidelberg, Germany, 1996. [Google Scholar] [CrossRef]
  8. Duda, K.A.; Ramsey, M.; Wessels, R.; Dehn, J. Optical Satellite Volcano Monitoring: A Multi-Sensor Rapid Response System. In Geoscience and Remote Sensing; IntechOpen: London, UK, 2009. [Google Scholar] [CrossRef] [Green Version]
  9. Kereszturi, G.; Schaefer, L.N.; Schleiffarth, W.K.; Procter, J.; Pullanagari, R.R.; Mead, S.; Kennedy, B. Integrating airborne hyperspectral imagery and LiDAR for volcano mapping and monitoring through image classification. Int. J. Appl. Earth Obs. Geoinf. 2018, 73, 323–339. [Google Scholar] [CrossRef]
  10. Lu, Z.; Fielding, E.; Patrick, M.; Trautwein, C. Lava volume estimated by precision combination of multiple baseline space-borne and airborne interferometric synthetic aperture radar: Application to the 1997 eruption of Okmok Volcano, Alaska. IEEE Trans. Geosci. Remote Sens. 2003, 41, 1428–1436. [Google Scholar]
  11. Rowland, S.K.; Harris, A.J.L.; Wooster, M.J.; Amelung, F.; Garbeil, H.; Wilson, L.; Mouginis-Mark, P.J. Volumetric characteristics of lava flows from interferometric radar and multispectral satellite data: The 1995 Fernandina and 1998 Cerro Azul eruptions in the western Galapagos. Bull. Volcanol. 2003, 65, 311–330. [Google Scholar] [CrossRef]
  12. Pinel, V.; Poland, M.; Hooper, A. Volcanology: Lessons learned from Synthetic Aperture Radar imagery. J. Volcanol. Geotherm. Res. 2014, 289, 81–113. [Google Scholar] [CrossRef]
  13. Lu, Z.; Rykhus, R.; Masterlark, T.; Dean, K.G. Mapping recent lava flows at Westdahl Volcano, Alaska, using radar and optical satellite imagery. Remote Sens. Environ. 2004, 91, 345–353. [Google Scholar] [CrossRef]
  14. Kervyn, M.; Kervyn, F.; Goossens, R.; Rowland, S.K.; Ernst, G.G.J. Mapping volcanic terrain using high-resolution and 3D satellite remote sensing. Geol. Soc. Spec. Publ. 2007, 283, 5–30. [Google Scholar] [CrossRef]
  15. Dietterich, H.R.; Poland, M.P.; Schmidt, D.A.; Cashman, K.V.; Sherrod, D.R.; Espinosa, A.T. Tracking lava flow emplacement on the east rift zone of Klauea, Hawaii, with synthetic aperture radar coherence. Geochem. Geophys. Geosyst. 2012, 13, 1–17. [Google Scholar] [CrossRef]
  16. Boccardo, P.; Gentile, V.; Tonolo, F.G.; Grandoni, D.; Vassileva, M. Multitemporal SAR coherence analysis: Lava flow monitoring case study. In Proceedings of the International Geoscience and Remote Sensing Symposium (IGARSS), Milan, Italy, 26–31 July 2015; pp. 2699–2702. [Google Scholar] [CrossRef]
  17. Ebmeier, S.K.; Biggs, J.; Mather, T.A.; Elliott, J.R.; Wadge, G.; Amelung, F. Measuring large topographic change with InSAR: Lava thicknesses, extrusion rate and subsidence rate at Santiaguito volcano, Guatemala. Earth Planet. Sci. Lett. 2012, 335–336, 216–225. [Google Scholar] [CrossRef] [Green Version]
  18. Richter, N.; Poland, M.P.; Lundgren, P.R. TerraSAR-X interferometry reveals small-scale deformation associated with the summit eruption of Kīlauea Volcano, Hawai’i. Geophys. Res. Lett. 2013, 40, 1279–1283. [Google Scholar] [CrossRef]
  19. Wittmann, W.; Sigmundsson, F.; Dumont, S.; Lavallée, Y. Post-emplacement cooling and contraction of lava flows: InSAR observations and a thermal model for lava fields at Hekla volcano, Iceland. J. Geophys. Res. Solid Earth 2017, 122, 946–965. [Google Scholar] [CrossRef] [Green Version]
  20. González, P.J.; Bagnardi, M.; Hooper, A.J.; Larsen, Y.; Marinkovic, P.; Samsonov, S.V.; Wright, T.J. The 2014–2015 eruption of Fogo volcano: Geodetic modeling of Sentinel-1 TOPS interferometry. Geophys. Res. Lett. 2015, 42, 9239–9246. [Google Scholar] [CrossRef] [Green Version]
  21. Babu, A.; Kumar, S. PSInSAR Processing for Volcanic Ground Deformation Monitoring Over Fogo Island. Proceedings 2019, 24, 6217. [Google Scholar] [CrossRef] [Green Version]
  22. Papageorgiou, E.; Foumelis, M.; Trasatti, E.; Ventura, G.; Raucoules, D.; Mouratidis, A. Multi-Sensor SAR Geodetic Imaging and Modelling of Santorini Volcano Post-Unrest Response. Remote Sens. 2019, 11, 259. [Google Scholar] [CrossRef]
  23. Pritchard, M.E.; Biggs, J.; Wauthier, C.; Sansosti, E.; Arnold, D.W.D.; Delgado, F.; Ebmeier, S.K.; Henderson, S.T.; Stephens, K.; Cooper, C.; et al. Towards coordinated regional multi-satellite InSAR volcano observations: Results from the Latin America pilot project. J. Appl. Volcanol. 2018, 7, 1–28. [Google Scholar] [CrossRef] [Green Version]
  24. Bignami, C.; Chini, M.; Amici, S.; Trasatti, E. Synergic Use of Multi-Sensor Satellite Data for Volcanic Hazards Monitoring: The Fogo (Cape Verde) 2014–2015 Effusive Eruption. Front. Earth Sci. 2020, 8, 22. [Google Scholar] [CrossRef] [Green Version]
  25. Valade, S.; Ley, A.; Massimetti, F.; D’Hondt, O.; Laiolo, M.; Coppola, D.; Loibl, D.; Hellwich, O.; Walter, T.R. Towards Global Volcano Monitoring Using Multisensor Sentinel Missions and Artificial Intelligence: The MOUNTS Monitoring System. Remote Sens. 2019, 11, 1528. [Google Scholar] [CrossRef] [Green Version]
  26. Corradino, C.; Bilotta, G.; Cappello, A.; Fortuna, L.; Del Negro, C. Combining radar and optical satellite imagery with machine learning to map lava flows at mount Etna and Fogo island. Energies 2021, 14, 197. [Google Scholar] [CrossRef]
  27. Riveros, N.; Euillades, L.; Euillades, P.; Moreiras, S.; Balbarani, S. Offset tracking procedure applied to high resolution SAR data on Discussions Viedma Glacier, Patagonian Andes, Argentina. Adv. Geosci. 2013, 35, 7–13. [Google Scholar] [CrossRef] [Green Version]
  28. Sánchez-Gámez, P.; Navarro, F. Glacier surface velocity retrieval using D-InSAR and offset tracking techniques applied to ascending and descending passes of Sentinel-1 data for southern Ellesmere ice caps. Canadian. Arctic. Remote Sens. 2017, 9, 442. [Google Scholar] [CrossRef] [Green Version]
  29. Strozzi, T.; Luckman, A.; Murray, T.; Wegmüller, U.; Werner, C. Glacier motion estimation using SAR offset-tracking procedures. IEEE Trans. Geosci. Remote Sens. 2002, 40, 11. [Google Scholar] [CrossRef] [Green Version]
  30. Kyriou, A.; Nikolakopoulos, K. Assessing the suitability of Sentinel-1 data for landslide mapping. Eur. J. Remote Sens. 2018, 51, 402–411. [Google Scholar] [CrossRef] [Green Version]
  31. Yin, Y.; Liu, X.; Zhao, C.; Tomas, R.; Zhang, Q.; Lu, Z.; Li, B. Multi-dimensional and long-term time series monitoring and early warning of landslide hazard with improved cross-platform SAR offset tracking method. Sci. China Technol. Sci. 2022, 65, 1891–1912. [Google Scholar] [CrossRef]
  32. Schaefer, L.N.; Wang, T.; Escobar-Wolf, R.; Oommen, T.; Lu, Z.; Kim, J.; Lundgren, P.R.; Waite, G.P. Three-dimensional displacements of a large volcano flank movement during the May 2010 eruptions at Pacaya Volcano, Guatemala. Geophys. Res. Lett. 2017, 44, 135–142. [Google Scholar] [CrossRef]
  33. Mania, R.; Walter, T.R.; Belousova, M.; Belousov, A.; Senyukov, S.L. Deformations and Morphology Changes Associated with the 2016–2017 Eruption Sequence at Bezymianny Volcano, Kamchatka. Remote Sens. 2019, 11, 1278. [Google Scholar] [CrossRef] [Green Version]
  34. Hoernle, K. Geochemistry of Jurassic oceanic crust beneath Gran Canaria (Canary Islands); implications for crustal recycling and assimilation. J. Petrol. 1998, 395, 859–880. [Google Scholar] [CrossRef]
  35. Schmincke, H.U.; Klügel, A.; Hansteen, T.H.; Hoernle, K.; van den Bogaard, P. Samples from the Jurassic ocean crust beneath Gran Canaria, La Palma and Lanzarote (Canary Islands). Earth Planet. Sci. Lett. 1998, 163, 343–360. [Google Scholar] [CrossRef]
  36. Neumann, E.R.; Sørensen, V.B.; Simonsen, S.L.; Johnsen, K. Gabbroic xenoliths from La Palma, Tenerife and Lanzarote, Canary Islands: Evidence for reactions between mafic alkaline Canary Islands melts and old oceanic crust. J. Volcanol. Geotherm. Res. 2000, 103, 313–342. [Google Scholar] [CrossRef]
  37. Geldmacher, J.; Hoernle, K.; van den Bogaard, P.; Duggen, S.; Werner, R. New 40Ar/39Ar age and geochemical data from seamounts in the Canary and Madeira volcanic provinces: Support for the mantle plume hypothesis. Earth Planet. Sci. Lett. 2005, 237, 85–101. [Google Scholar] [CrossRef]
  38. Klügel, A.; Galipp, K.; Hoernle, K.; Hauff, F.; Groom, S. Geochemical and Volcanological Evolution of La Palma, Canary Islands. J. Petrol. 2017, 58, 1227–1248. [Google Scholar] [CrossRef] [Green Version]
  39. Morgan, W.J. Hotspot tracks and the early rifting of the Atlantic. Tectonophysics 1983, 94, 123–139. [Google Scholar] [CrossRef]
  40. Holik, J.S.; Rabinowitz, P.D. Effects of Canary hotspot volcanism on structure of oceanic crust off Morocco. J. Geophys. Res. 1991, 96, 12039–12067. [Google Scholar] [CrossRef]
  41. Schmincke, H.U. Geology of the Canary Islands. In Biogeography and Ecology of the Canary Islands; Kunkel, G., Ed.; Junk: Hague, The Netherlands, 1976; pp. 67–184. [Google Scholar]
  42. Carracedo, J.C.; Day, S.J.; Guillou, H.; Gravestock, P. Later stages of volcanic evolution of La Palma, Canary Islands: Rift evolution, giant landslides, and the genesis of the Caldera de Taburiente. Geol. Soc. Am. 1999, 111, 755–768. [Google Scholar] [CrossRef]
  43. Naranjo Gómez, J.M.; Lousada, S.; Garrido Velarde, J.; Castanho, R.A.; Loures, L. Land-Use Changes in the Canary Archipelago Using the CORINE Data: A Retrospective Analysis. Land 2020, 9, 232. [Google Scholar] [CrossRef]
  44. Carracedo, J.C.; Badiola, E.R.; Guillou, H.; de La Nuez, J.; Pe’rez Torrado, F.J. Geology and volcanology of La Palma and El Hierro, Western Canaries. Estud. Geol. 2001, 57, 175–273. [Google Scholar] [CrossRef] [Green Version]
  45. Guillou, H.; Carracedo, J.C.; Day, S. Dating of the upper Pleistocene–Holocene activity of La Palma using the unspiked K–Ar technique. J. Volcanol. Geotherm. Res. 1998, 86, 137–149. [Google Scholar] [CrossRef]
  46. Guillou, H.; Carracedo, J.C.; Duncan, R.A. K–Ar, 40Ar–39Ar ages and magnetostratigraphy of Brunhes and Matuyama lava sequences from La Palma Island. J. Volcanol. Geotherm. Res. 2001, 106, 175–194. [Google Scholar] [CrossRef]
  47. Staudigel, H.; Schmincke, H.U. The Pliocene seamount series of La Palma/Canary Islands. J. Geophys. Res. 1984, 89, 11195–11215. [Google Scholar] [CrossRef]
  48. Gens, R.; Genderen, J.L. Review Article SAR interferometry—Issues, techniques, applications. Int. J. Remote Sens. 1996, 17, 1803–1835. [Google Scholar] [CrossRef]
  49. Zhou, X.; Chang, N.-B.; Li, S. Applications of SAR Interferometry in Earth and Environmental Science Research. Sensors 2009, 9, 1876–1912. [Google Scholar] [CrossRef] [PubMed] [Green Version]
  50. Massonnet, D.; Rossi, M.; Carmona, C.; Adragna, F.; Peltzer, G.; Fiegl, K.; Rabaute, T. The displacement field of the Landers earthquake mapped by radar interferometry. Nature 1993, 364, 138–142. [Google Scholar] [CrossRef]
  51. Meyer, B.; Armijo, R.; de Chabalier, J.B.; Delacourt, C.; Ruegg, J.C.; Acache, J.; Briole, P.; Papanastassiou, D. The 1995 Grevena (northern Greece) earthquake: Fault model constrained with tectonic observations and SAR interferometry. Geophys. Res. Lett. 1996, 23, 2677–2680. [Google Scholar] [CrossRef]
  52. Burgmann, R.; Rosen, P.; Fielding, E. Synthetic Aperture Radar interferometry to measure Earth’s surface topography and its deformation. Ann. Rev. Earth. Planet. Sci. 2000, 28, 169–209. [Google Scholar] [CrossRef]
  53. Farr, T.G.; Kobrick, M. Shuttle radar topography mission produces a wealth of data. Eos Trans. AGU 2000, 81, 583–585. [Google Scholar] [CrossRef]
  54. Goldstein, R.M.; Werner, C.L. Radar Interferogram Phase Filtering for Geophysical Applications. Geophys. Res. Lett. 1998, 25, 4035–4038. [Google Scholar] [CrossRef] [Green Version]
  55. McAlpin, D.; Meyer, F.J. Multi-sensor data fusion for remote sensing of post-eruptive deformation and depositional features at Redoubt Volcano. J. Volcanol. Geotherm. Res. 2013, 259, 414–423. [Google Scholar] [CrossRef]
  56. Whelley, P.; Jay, J.; Calder, E.S.; Pritchard, M.E.; Cassidy, N.J.; Alcaraz, S.; Pavez, A. Post-depositional fracturing and subsidence of pumice flow deposits: Lascar Volcano, Chile. Bull. Volcanol. 2011, 74, 511–531. [Google Scholar] [CrossRef] [PubMed] [Green Version]
  57. Glacier Velocity with Sentinel-1 Using SNAP S-1 Toolbox– Peterman Glacier, Greenland. Available online: https://rus-copernicus.eu/portal/wp-content/uploads/library/education/training/CRYO02_GlacierVelocity_Greenland_Tutorial.pdf (accessed on 1 August 2022).
  58. Narita, S.; Ozawa, T.; Aoki, Y.; Shimada, M.; Furuya, M.; Takada, Y.; Murakami, M. Precursory ground deformation of the 2018 phreatic eruption on Iwo-Yama volcano, revealed by four-dimensional joint analysis of airborne and spaceborne InSAR. Earth Planets Space 2020, 72, 145. [Google Scholar] [CrossRef]
  59. Gatsios, T.; Cigna, F.; Tapete, D.; Sakkas, V.; Pavlou, K.; Parcharidis, I. Copernicus Sentinel-1 MT-InSAR, GNSS and Seismic Monitoring of Deformation Patterns and Trends at the Methana Volcano, Greece. Appl. Sci. 2020, 10, 6445. [Google Scholar] [CrossRef]
  60. Biggs, J.; Ebmeier, S.K.; Aspinall, W.P.; Lu, Z.; Pritchard, M.E.; Sparks, R.S.; Mather, T.A. Global link between deformation and volcanic eruption quantified by satellite imagery. Nat Commun. 2014, 3, 3471. [Google Scholar] [CrossRef] [PubMed] [Green Version]
  61. Vasconez, F.J.; Anzieta, J.C.; Vásconez Müller, A.; Bernard, B.; Ramón, P. A Near Real-Time and Free Tool for the Preliminary Mapping of Active Lava Flows during Volcanic Crises: The Case of Hotspot Subaerial Eruptions. Remote Sens. 2022, 14, 3483. [Google Scholar] [CrossRef]
  62. Román, A.; Tovar-Sánchez, A.; Roque-Atienza, D.; Huertas, I.E.; Caballero, I.; Fraile-Nuez, E.; Navarro, G. Unmanned aerial vehicles (UAVs) as a tool for hazard assessment: The 2021 eruption of Cumbre Vieja volcano, La Palma Island (Spain). Sci. Total Environ. 2022, 843, 157092. [Google Scholar] [CrossRef] [PubMed]
  63. Civico, R.; Ricci, T.; Scarlato, P.; Taddeucci, J.; Andronico, D.; Del Bello, E.; D’Auria, L.; Hernández, P.A.; Pérez, N.M. High-resolution Digital Surface Model of the 2021 eruption deposit of Cumbre Vieja volcano, La Palma, Spain. Sci. Data 2022, 9, 435. [Google Scholar] [CrossRef]
  64. Periáñez, R. Numerical Simulation of the Tsunami Generated by a Potential Submarine Landslide in La Palma (Canary Islands) after the September 2021 Cumbre Vieja Eruption. Geosciences 2021, 11, 497. [Google Scholar] [CrossRef]
  65. Weiser, F.; Baumann, E.; Jentsch, A.; Medina, F.M.; Lu, M.; Nogales, M.; Beierkuhnlein, C. Impact of Volcanic Sulfur Emissions on the Pine Forest of La Palma, Spain. Forests 2022, 13, 299. [Google Scholar] [CrossRef]
  66. Ji, L.; Lu, Z.; Dzurisin, D.; Senyukov, S. Pre-eruption deformation caused by dike intrusion beneath Kizimen volcano, Kamchatka, Russia, observed by InSAR. J. Volcanol. Geotherm. Res. 2013, 256, 87–95. [Google Scholar] [CrossRef]
  67. Chaussard, E.; Amelung, F.; Aoki, Y. Characterization of open and closed volcanic systems in Indonesia and Mexico using InSAR time series. J. Geophys. Res. Solid Earth 2013, 118, 3957–3969. [Google Scholar] [CrossRef]
  68. Parks, M.M.; Biggs, J.; Mather, T.A.; Pyle, D.M.; Amelung, F.; Monsalve, M.L.; Medina, L.N. Co-eruptive subsidence at Galeras identified during an InSAR survey of Colombian volcanoes (2006-2009). J. Volcanol. Geotherm. Res. 2011, 202, 228–240. [Google Scholar] [CrossRef]
  69. Foumelis, M.; Trasatti, E.; Papageorgiou, E.; Stramondo, S.; Parcharidis, I. Monitoring Santorini volcano (Greece) breathing from space. Geophys. J. Int. 2013, 193, 161–170. [Google Scholar] [CrossRef] [Green Version]
  70. Papoutsis, I.; Papanikolaou, X.; Floyd, M.; Ji, K.H.; Kontoes, C.; Paradissis, D.; Zacharis, V. Mapping inflation at Santorini volcano, Greece, using GPS and InSAR. Geophys. Res. Lett. 2013, 40, 267–272. [Google Scholar] [CrossRef]
  71. Biggs, J.; Anthony, E.Y.; Ebinger, C.J. Multiple inflation and deflation events at Kenyan volcanoes, East African Rift. Geology 2009, 37, 979–982. [Google Scholar] [CrossRef]
  72. Copernicus Emergency Management Service-Mapping, EMSR546: Volcano eruption in La Palma, Spain. Available online: https://emergency.copernicus.eu/mapping/list-of-components/EMSR546 (accessed on 1 August 2022).
  73. Michel, R.; Avouac, J.P.; Taboury, J. Measuring ground displacements from SAR amplitude images: Application to the Landers earthquake. Geophys. Res. Lett. 1999, 26, 875–878. [Google Scholar] [CrossRef] [Green Version]
  74. Wang, T.; Poland, M.P.; Lu, Z. Dome growth at Mount Cleveland, Aleutian Arc, quantified by time series TerraSAR-X imagery. Geophys. Res. Lett. 2015, 42, 10614–10621. [Google Scholar] [CrossRef]
Figure 1. Location of La Palma island within the Canary archipelago.
Sensors 22 08768 g001
Figure 2. Sentinel-1 data frames. The red square corresponds to the Sentinel-1 data obtained during the ascending pass, while the white square represents the data frame for Sentinel-1 data collected during the descending pass.
Sensors 22 08768 g002
Figure 3. Flowchart describing the applied methodology.
Sensors 22 08768 g003
Figure 4. Multitemporal Sentinel-1 ascending interferograms. The red square indicates the area displaying the greatest deformation.
Sensors 22 08768 g004
Figure 5. Multitemporal Sentinel-1 descending interferograms. The red square indicates the area displaying the greatest deformation.
Sensors 22 08768 g005
Figure 6. LOS displacement obtained by processing the Sentinel-1 ascending imagery. (a) LOS displacement before the eruption. (b) LOS displacement after the eruption.
Sensors 22 08768 g006
Figure 7. LOS displacement obtained by processing the Sentinel-1 descending imagery. (a) LOS displacement before the eruption. (b) LOS displacement after the eruption.
Sensors 22 08768 g007
Figure 8. Multitemporal LOS displacement over the entire eruptive period, obtained by processing the Sentinel-1 ascending imagery.
Sensors 22 08768 g008
Figure 9. Multitemporal LOS displacement over the entire eruptive period, obtained by processing the Sentinel-1 descending imagery.
Sensors 22 08768 g009
Figure 10. Lava flow evolution, obtained by processing the Sentinel-1 ascending data through offset tracking.
Sensors 22 08768 g010
Figure 11. Lava flow evolution, obtained by processing the Sentinel-1 descending data through offset tracking.
Sensors 22 08768 g011
Figure 12. Lava flow velocity profiles of section AA’ throughout the different eruptive phases, obtained by processing the Sentinel-1 ascending data through offset tracking.
Sensors 22 08768 g012
Figure 13. Lava flow velocity profiles of section AA’ throughout the different eruptive phases, obtained by processing the Sentinel-1 descending data through offset tracking.
Sensors 22 08768 g013
Figure 14. (a) Extent of lava flow, as released by Copernicus Emergency Management Service-Mapping [63]. (b) Lava flow, obtained by processing the Sentinel-1 ascending data through offset tracking.
Sensors 22 08768 g014
Table 1. Sentinel-1 data.
a/a 1Date 2Mode 3Pass 4Track 5
102/09/2021SLCascending60
214/09/2021SLCascending60
320/09/2021SLCascending60
414/10/2021SLCascending60
507/11/2021SLCascending60
601/12/2021SLCascending60
724/01/2022SLCascending60
804/09/2021SLCdescending 169
916/09/2021SLCdescending169
1022/09/2021SLCdescending169
1110/10/2021SLCdescending169
1209/11/2021SLCdescending169
1303/12/2021SLCdescending169
1420/01/2022SLCdescending169
1502/09/2021GRDascending60
1608/10/2021GRDascending60
1707/11/2021GRDascending60
1801/12/2021GRDascending60
1912/01/2022GRDascending60
2004/09/2021GRDdescending169
2110/10/2021GRDdescending169
2209/11/2021GRDdescending169
2303/12/2021GRDdescending169
2408/01/2022GRDdescending169
1 Number of Sentinel-1 acquisitions. 2 Date of Sentinel-1 acquisition. 3 Sentinel-1 product type. 4 Orbital path of the mission. Ascending: the satellite moves northwards across the Earth. Descending: the satellite moves southwards across the Earth. 5 Relative orbit of Sentinel-1 acquisitions.
Table 2. Parameters of Sentinel-1 interferometric pairs (acquisition dates, product type, orbital path, baseline and coherence).
a/aInterferometric PairModePassTrackBaseline (m)Coherence
102/09/202114/09/2021SLCascending60−49.590.95
202/09/202120/09/2021SLCascending6047.900.94
302/09/202114/10/2021SLCascending60−41.530.93
402/09/202107/11/2021SLCascending603.570.94
502/09/202101/12/2021SLCascending6094.970.84
602/09/202124/01/2022SLCascending6022.880.85
704/09/202116/09/2021SLCdescending 1695.850.98
804/09/202122/09/2021SLCdescending169−9.060.98
904/09/202110/10/2021SLCdescending169−36.000.95
1004/09/202109/11/2021SLCdescending16927.080.92
1104/09/202103/12/2021SLCdescending16947.750.88
1204/09/202120/01/2022SLCdescending16928.980.85
Table 3. Parameters of Sentinel-1 pairs, as processed using offset tracking (acquisition dates, product type and orbital path).
a/aOffset Tracking PairsModePassTrack
102/09/202108/10/2021GRDascending60
202/09/202107/11/2021GRDascending60
302/09/202101/12/2021GRDascending60
402/09/202112/01/2022GRDascending60
504/09/202110/10/2021GRDdescending169
604/09/202109/11/2021GRDdescending169
704/09/202103/12/2021GRDdescending169
804/09/202108/01/2022GRDdescending 169
Publisher’s Note: MDPI stays neutral with regard to jurisdictional claims in published maps and institutional affiliations.

