
Implementation of and Experimentation with Ground-Penetrating Radar for Real-Time Automatic Detection of Buried Improvised Explosive Devices

 , , and
Abstract
:1. Introduction
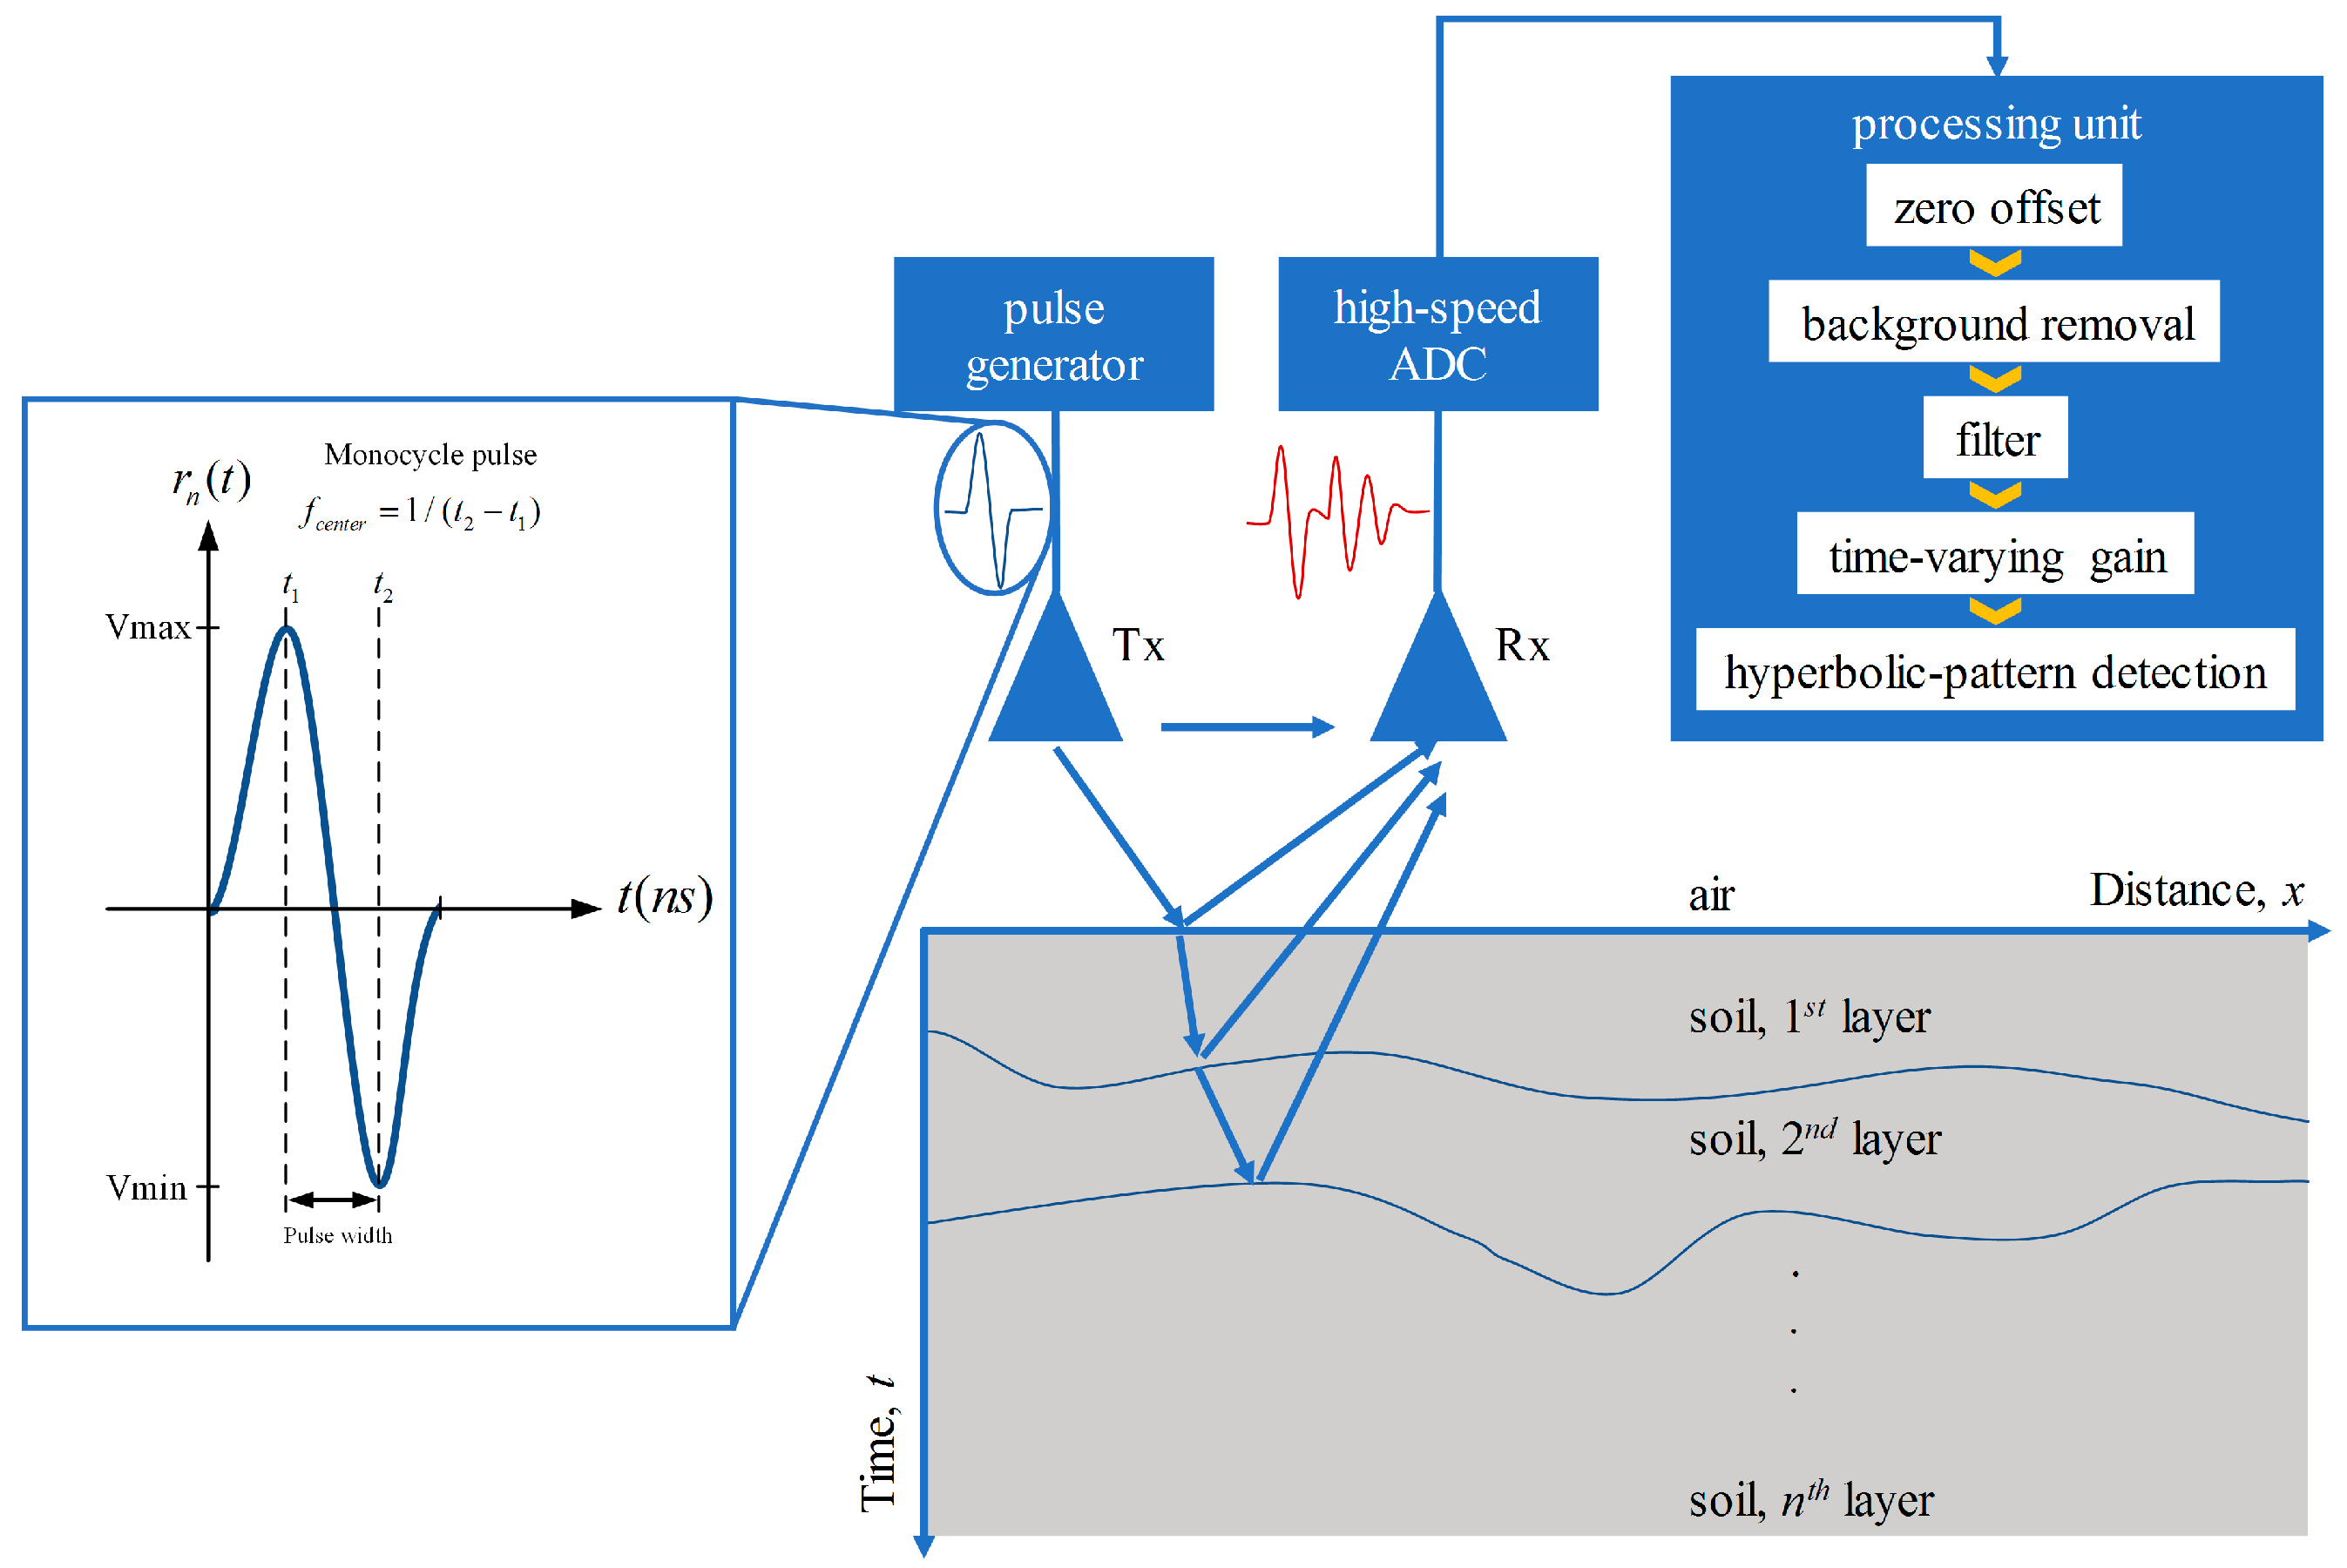
2. Proposed Ground-Penetrating Radar
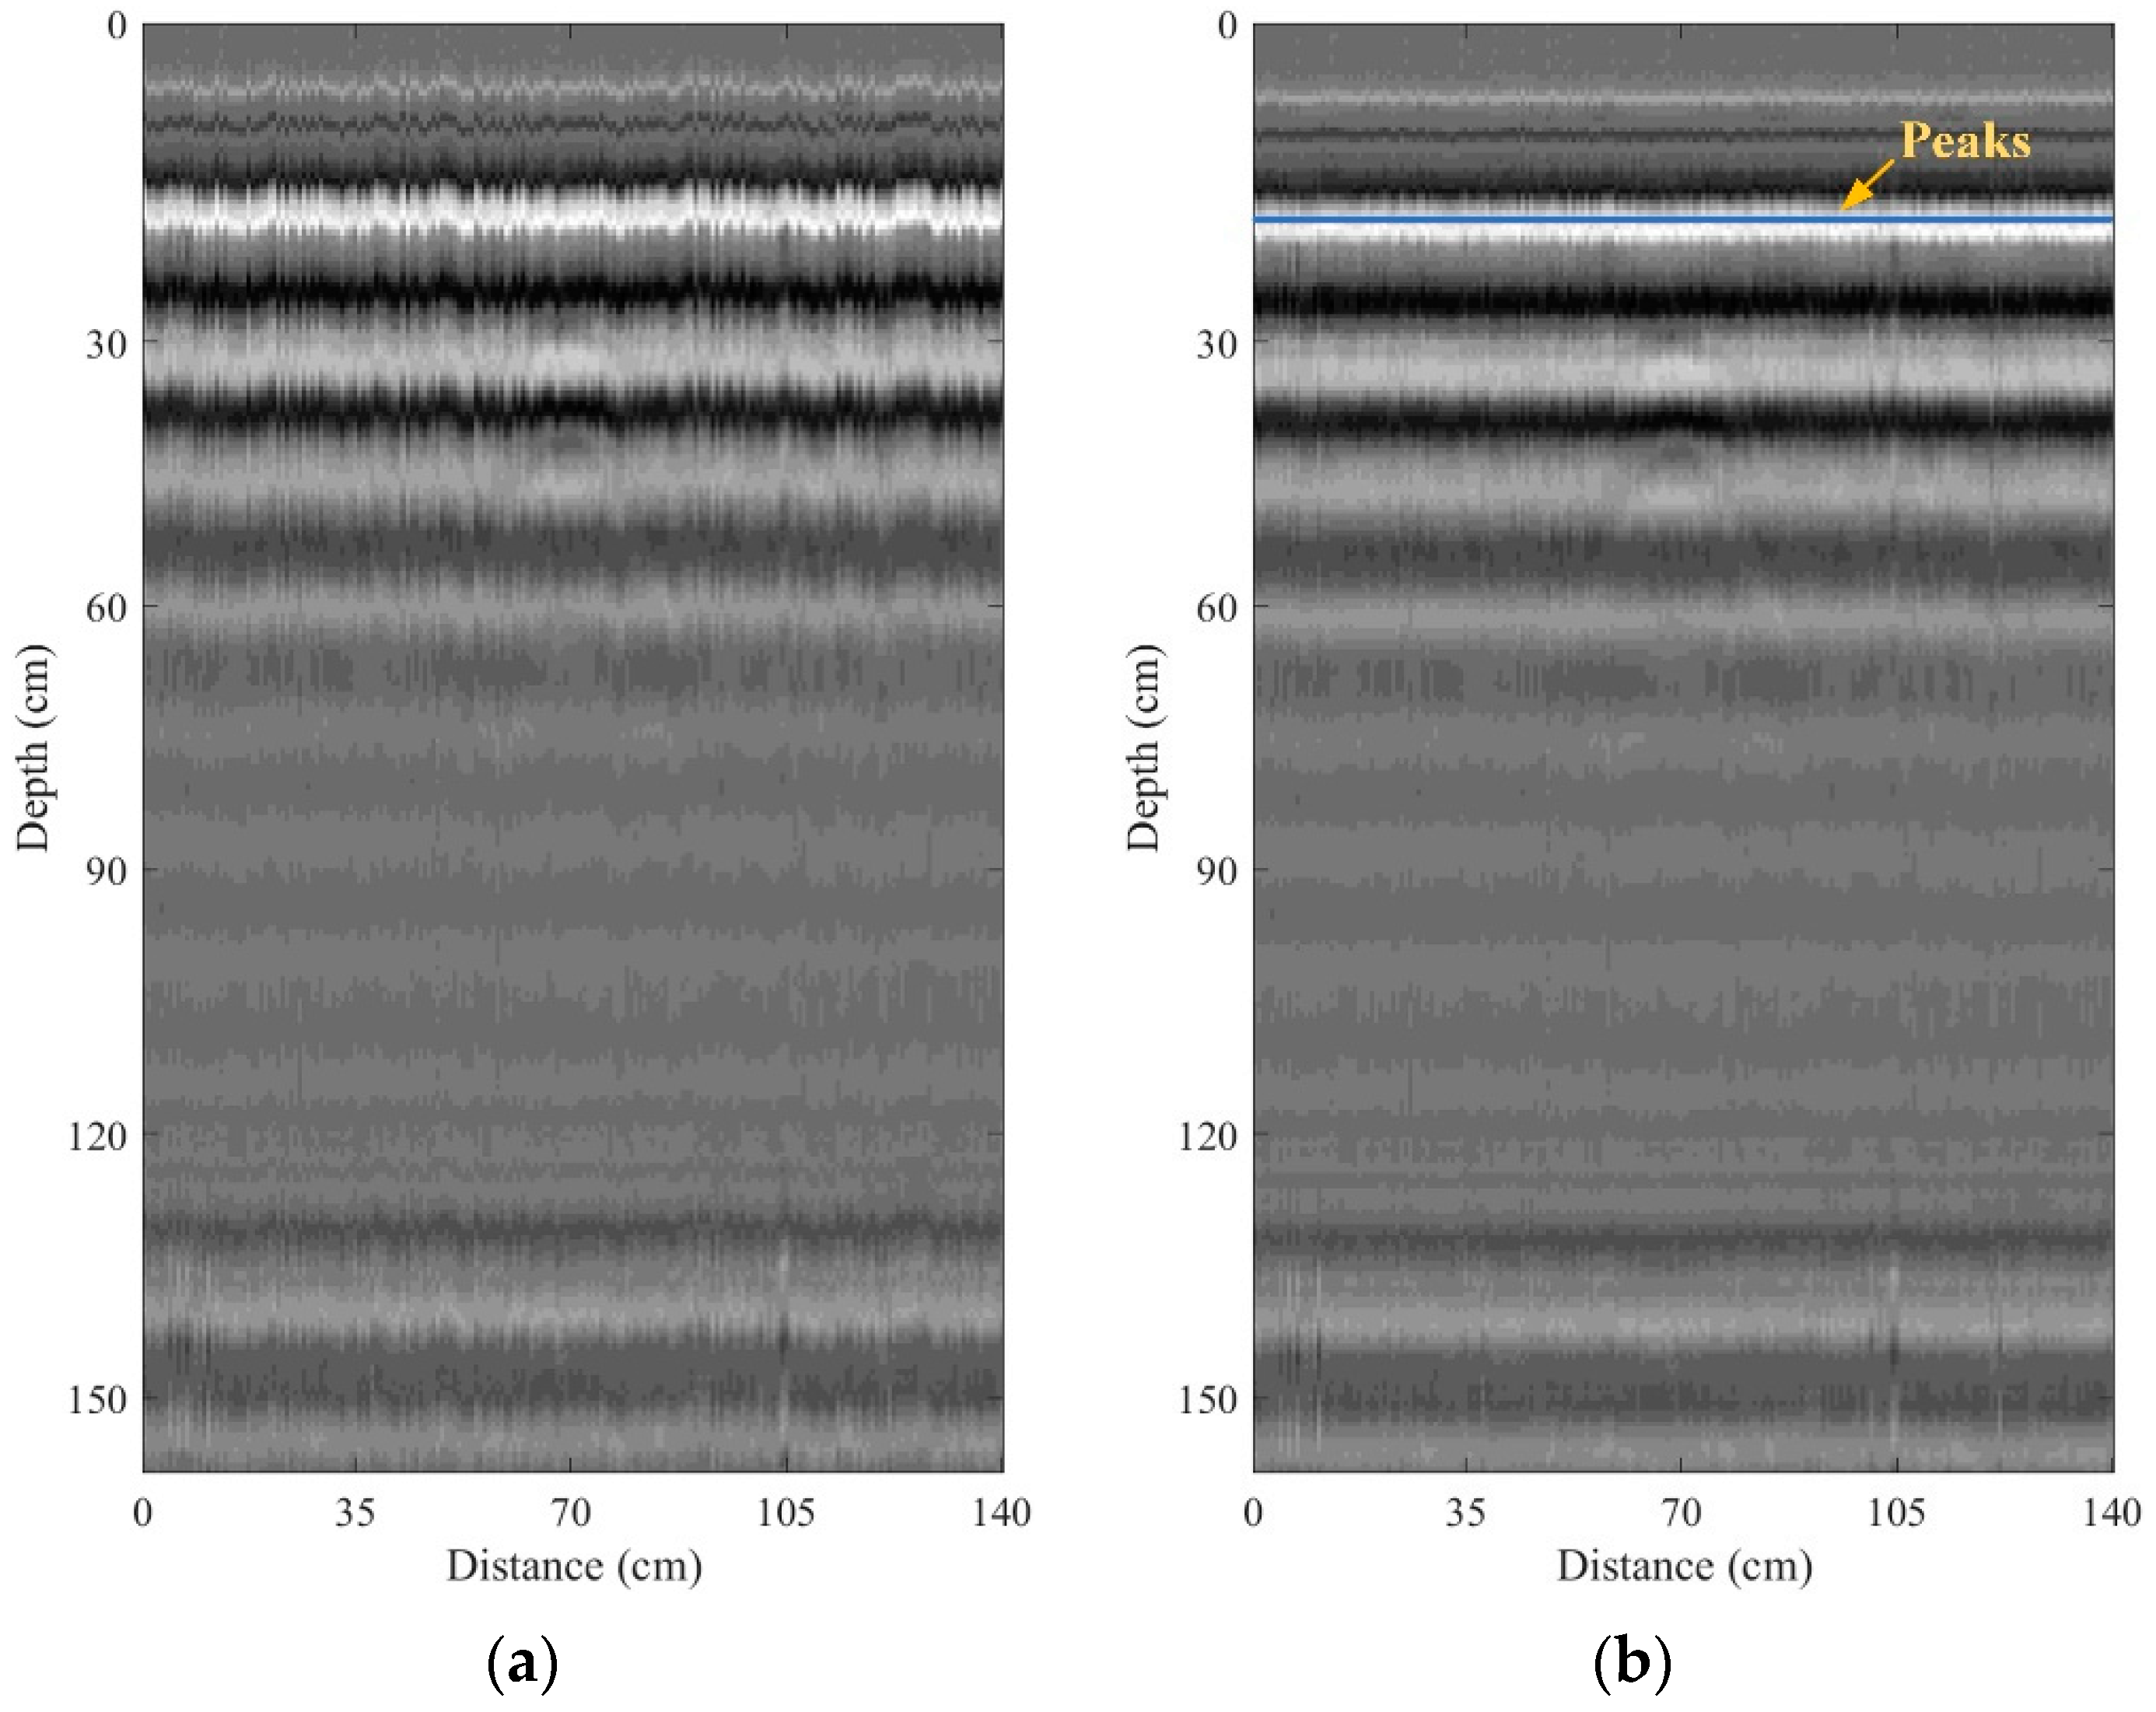
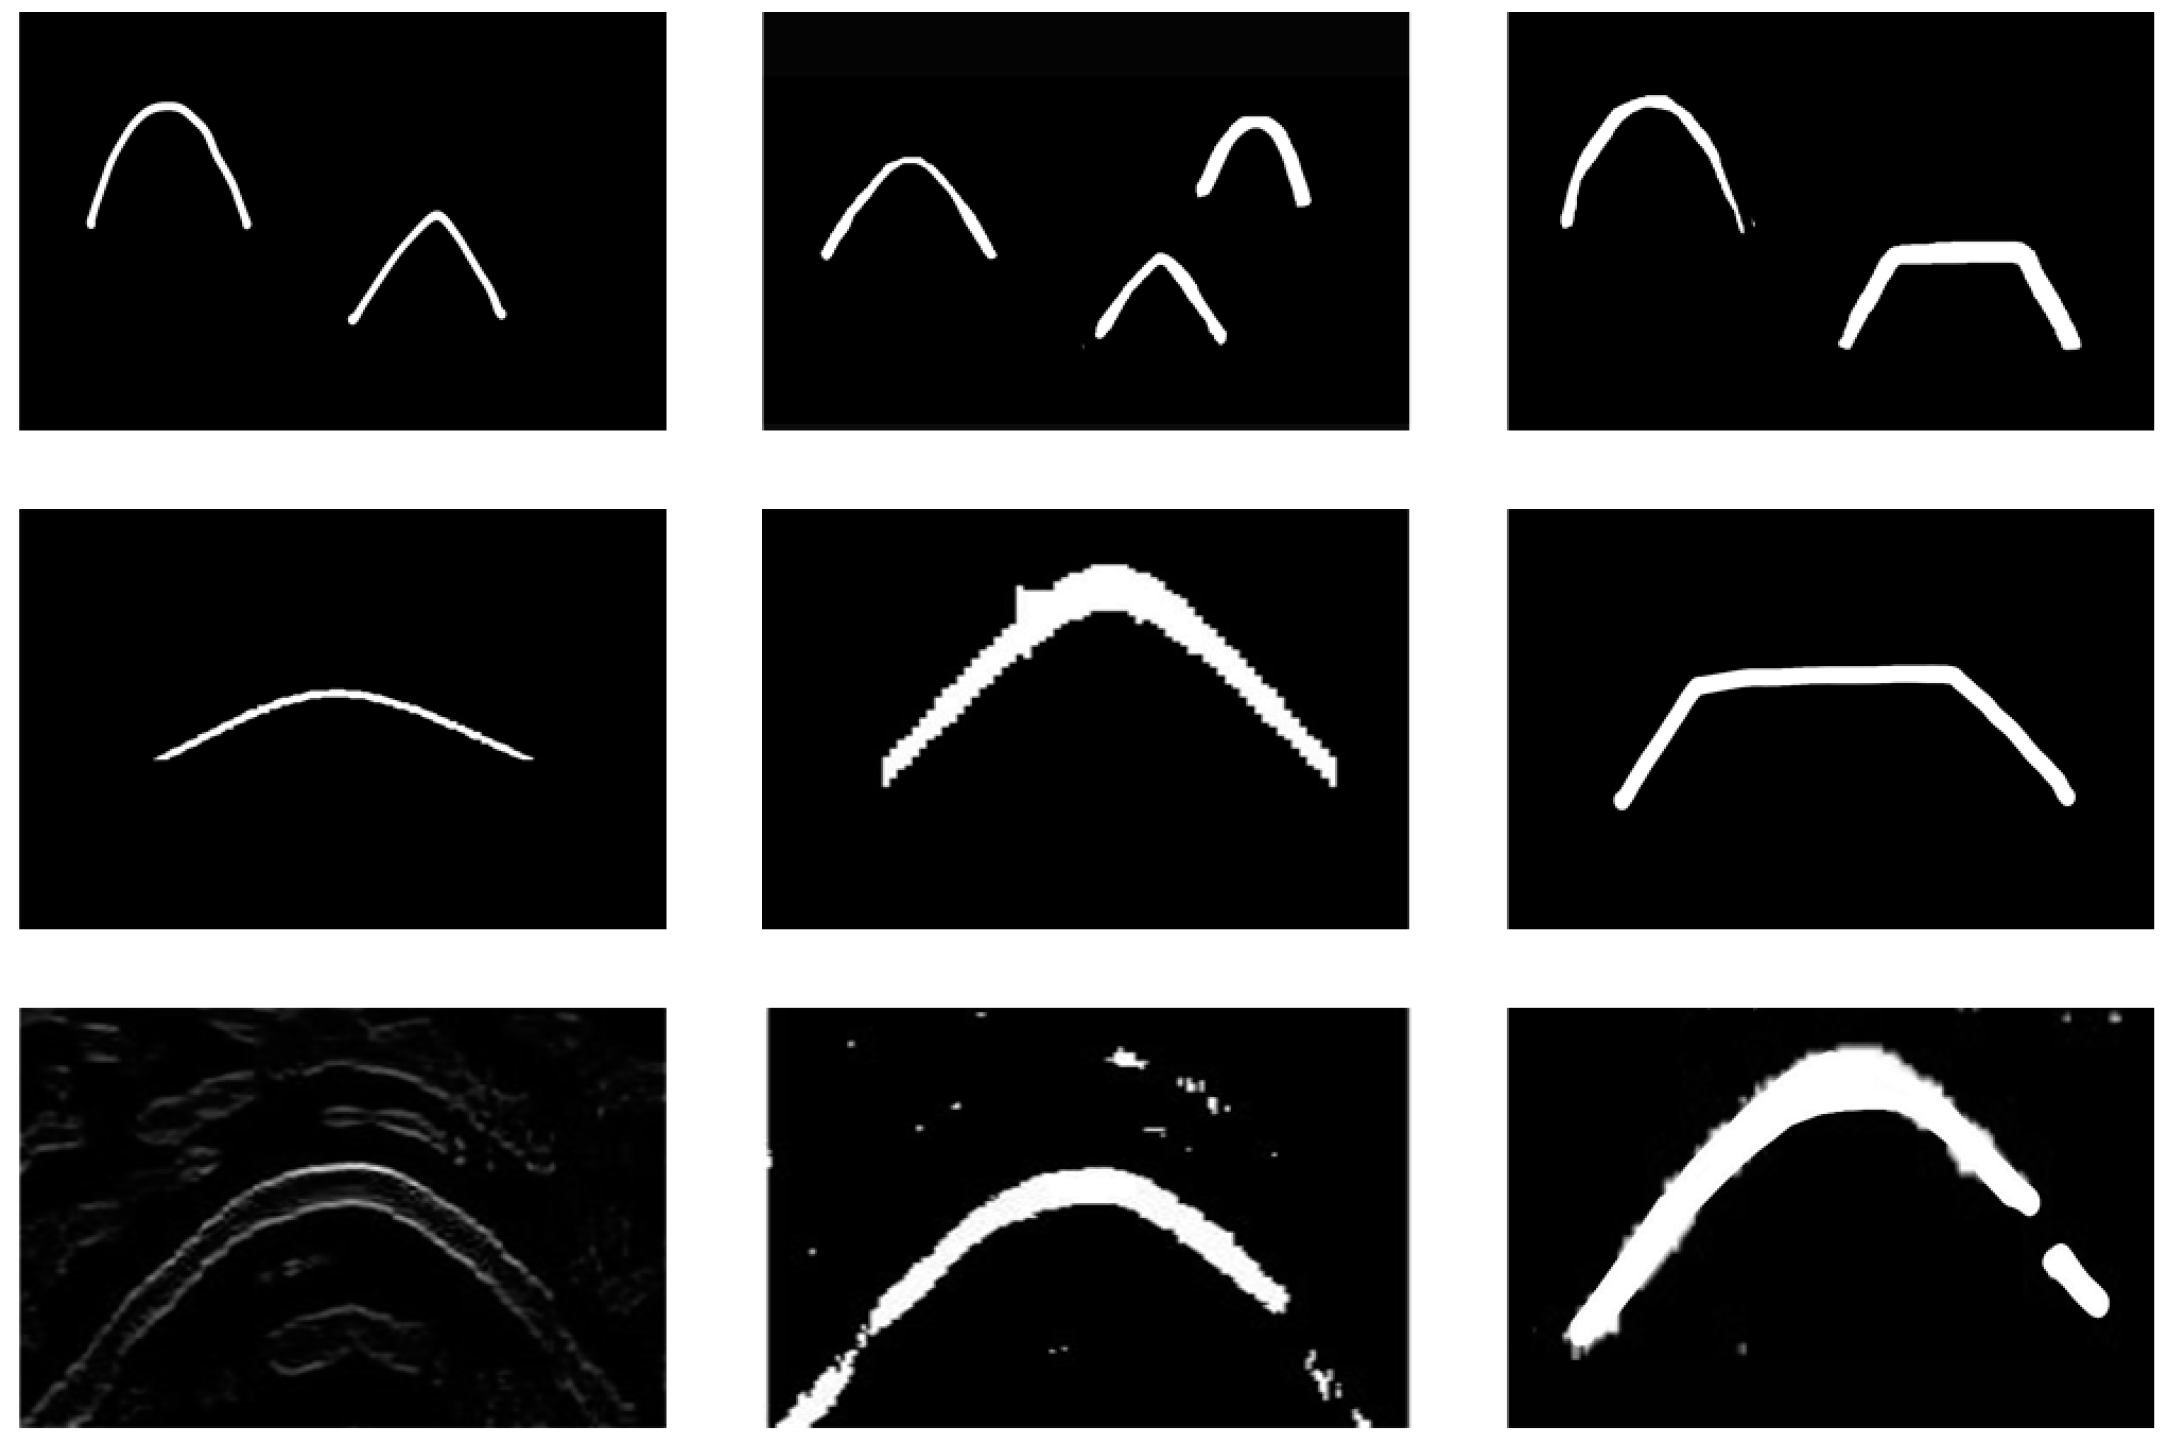
2.1. Pre-Processing
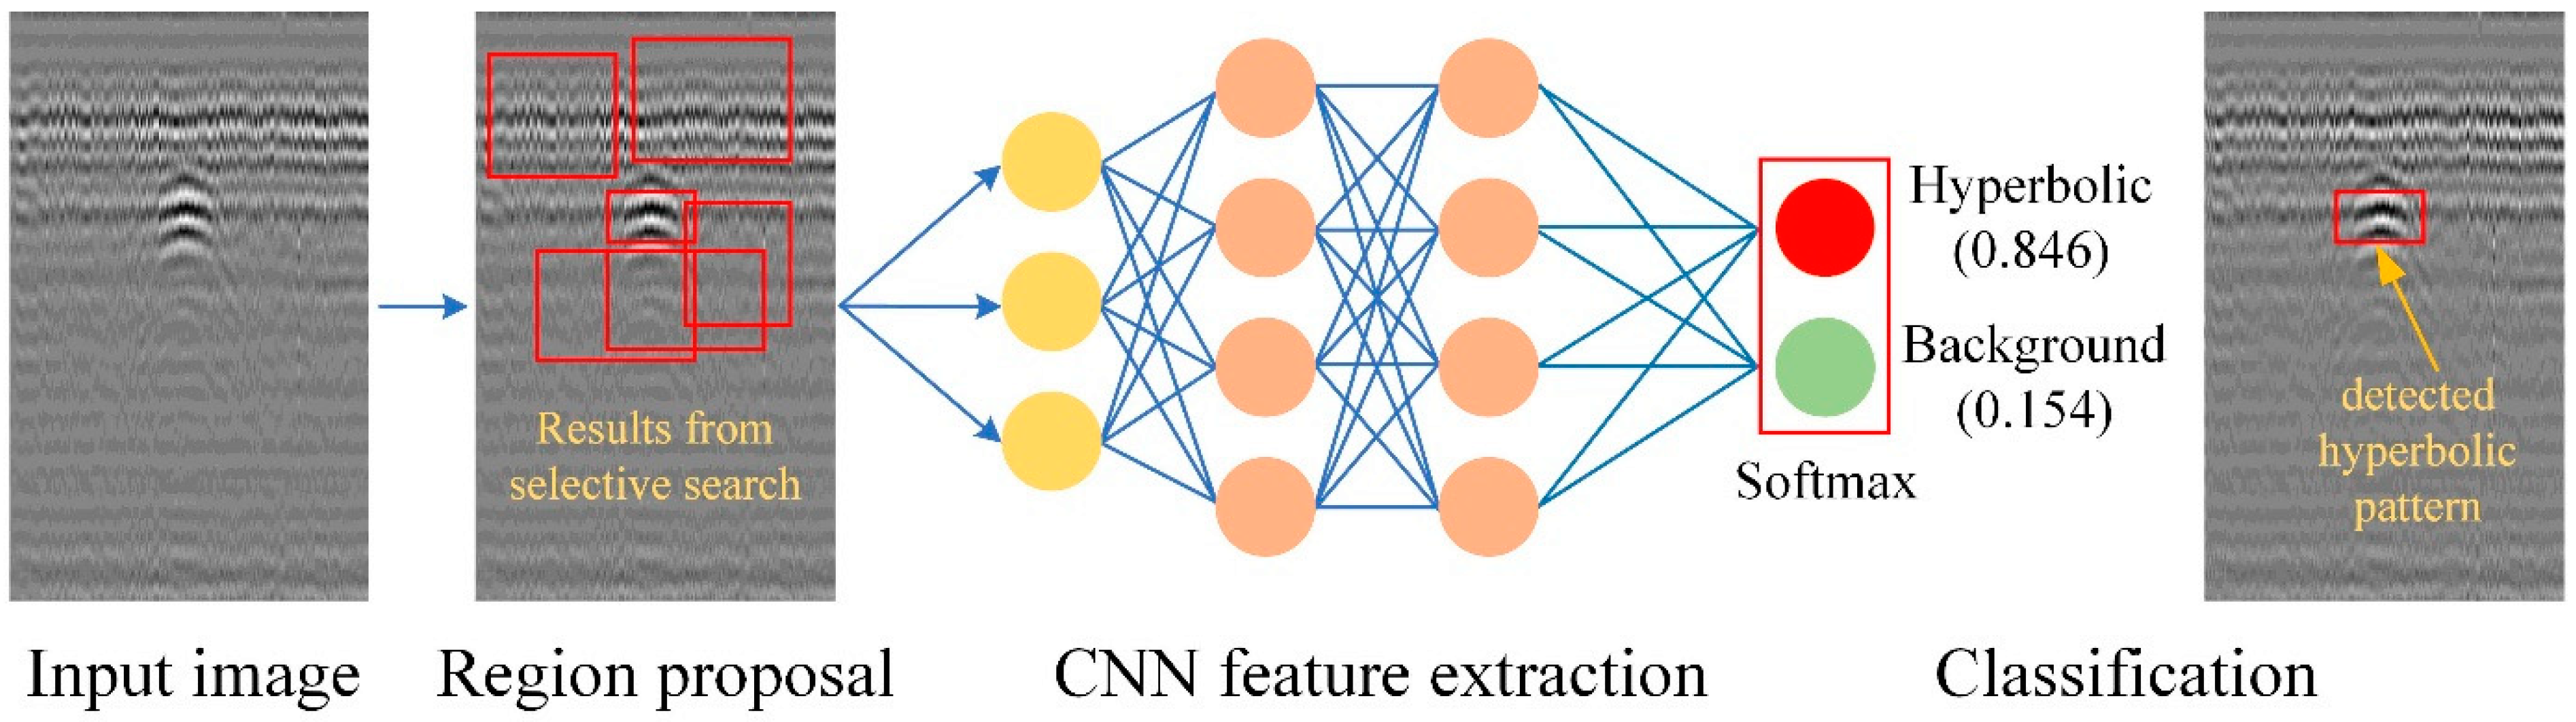
2.2. Automatic Detection Using R-CNN
- Region proposals: The input image is fed to extract the region proposals or regions of interest. A method to search for the object of interest in the whole image is required in order to localize the object within an image.
- Feature extraction: A fixed-length feature is extracted from the region proposed by using a CNN consisting of three main types of layers to build CNN architecture, namely a convolutional layer, a pooling layer, and fully connected layers.
- Region classification: The output of the CNN is the scores or weights generated by the SoftMax layer. The scores or weights indicate the class of the objects and the location of the regions within the image. Nonmaximal suppression (NMS) is then used to eliminate overlapping bounding boxes based on their scores and to find the maximum score from the scores in order to identify the object.
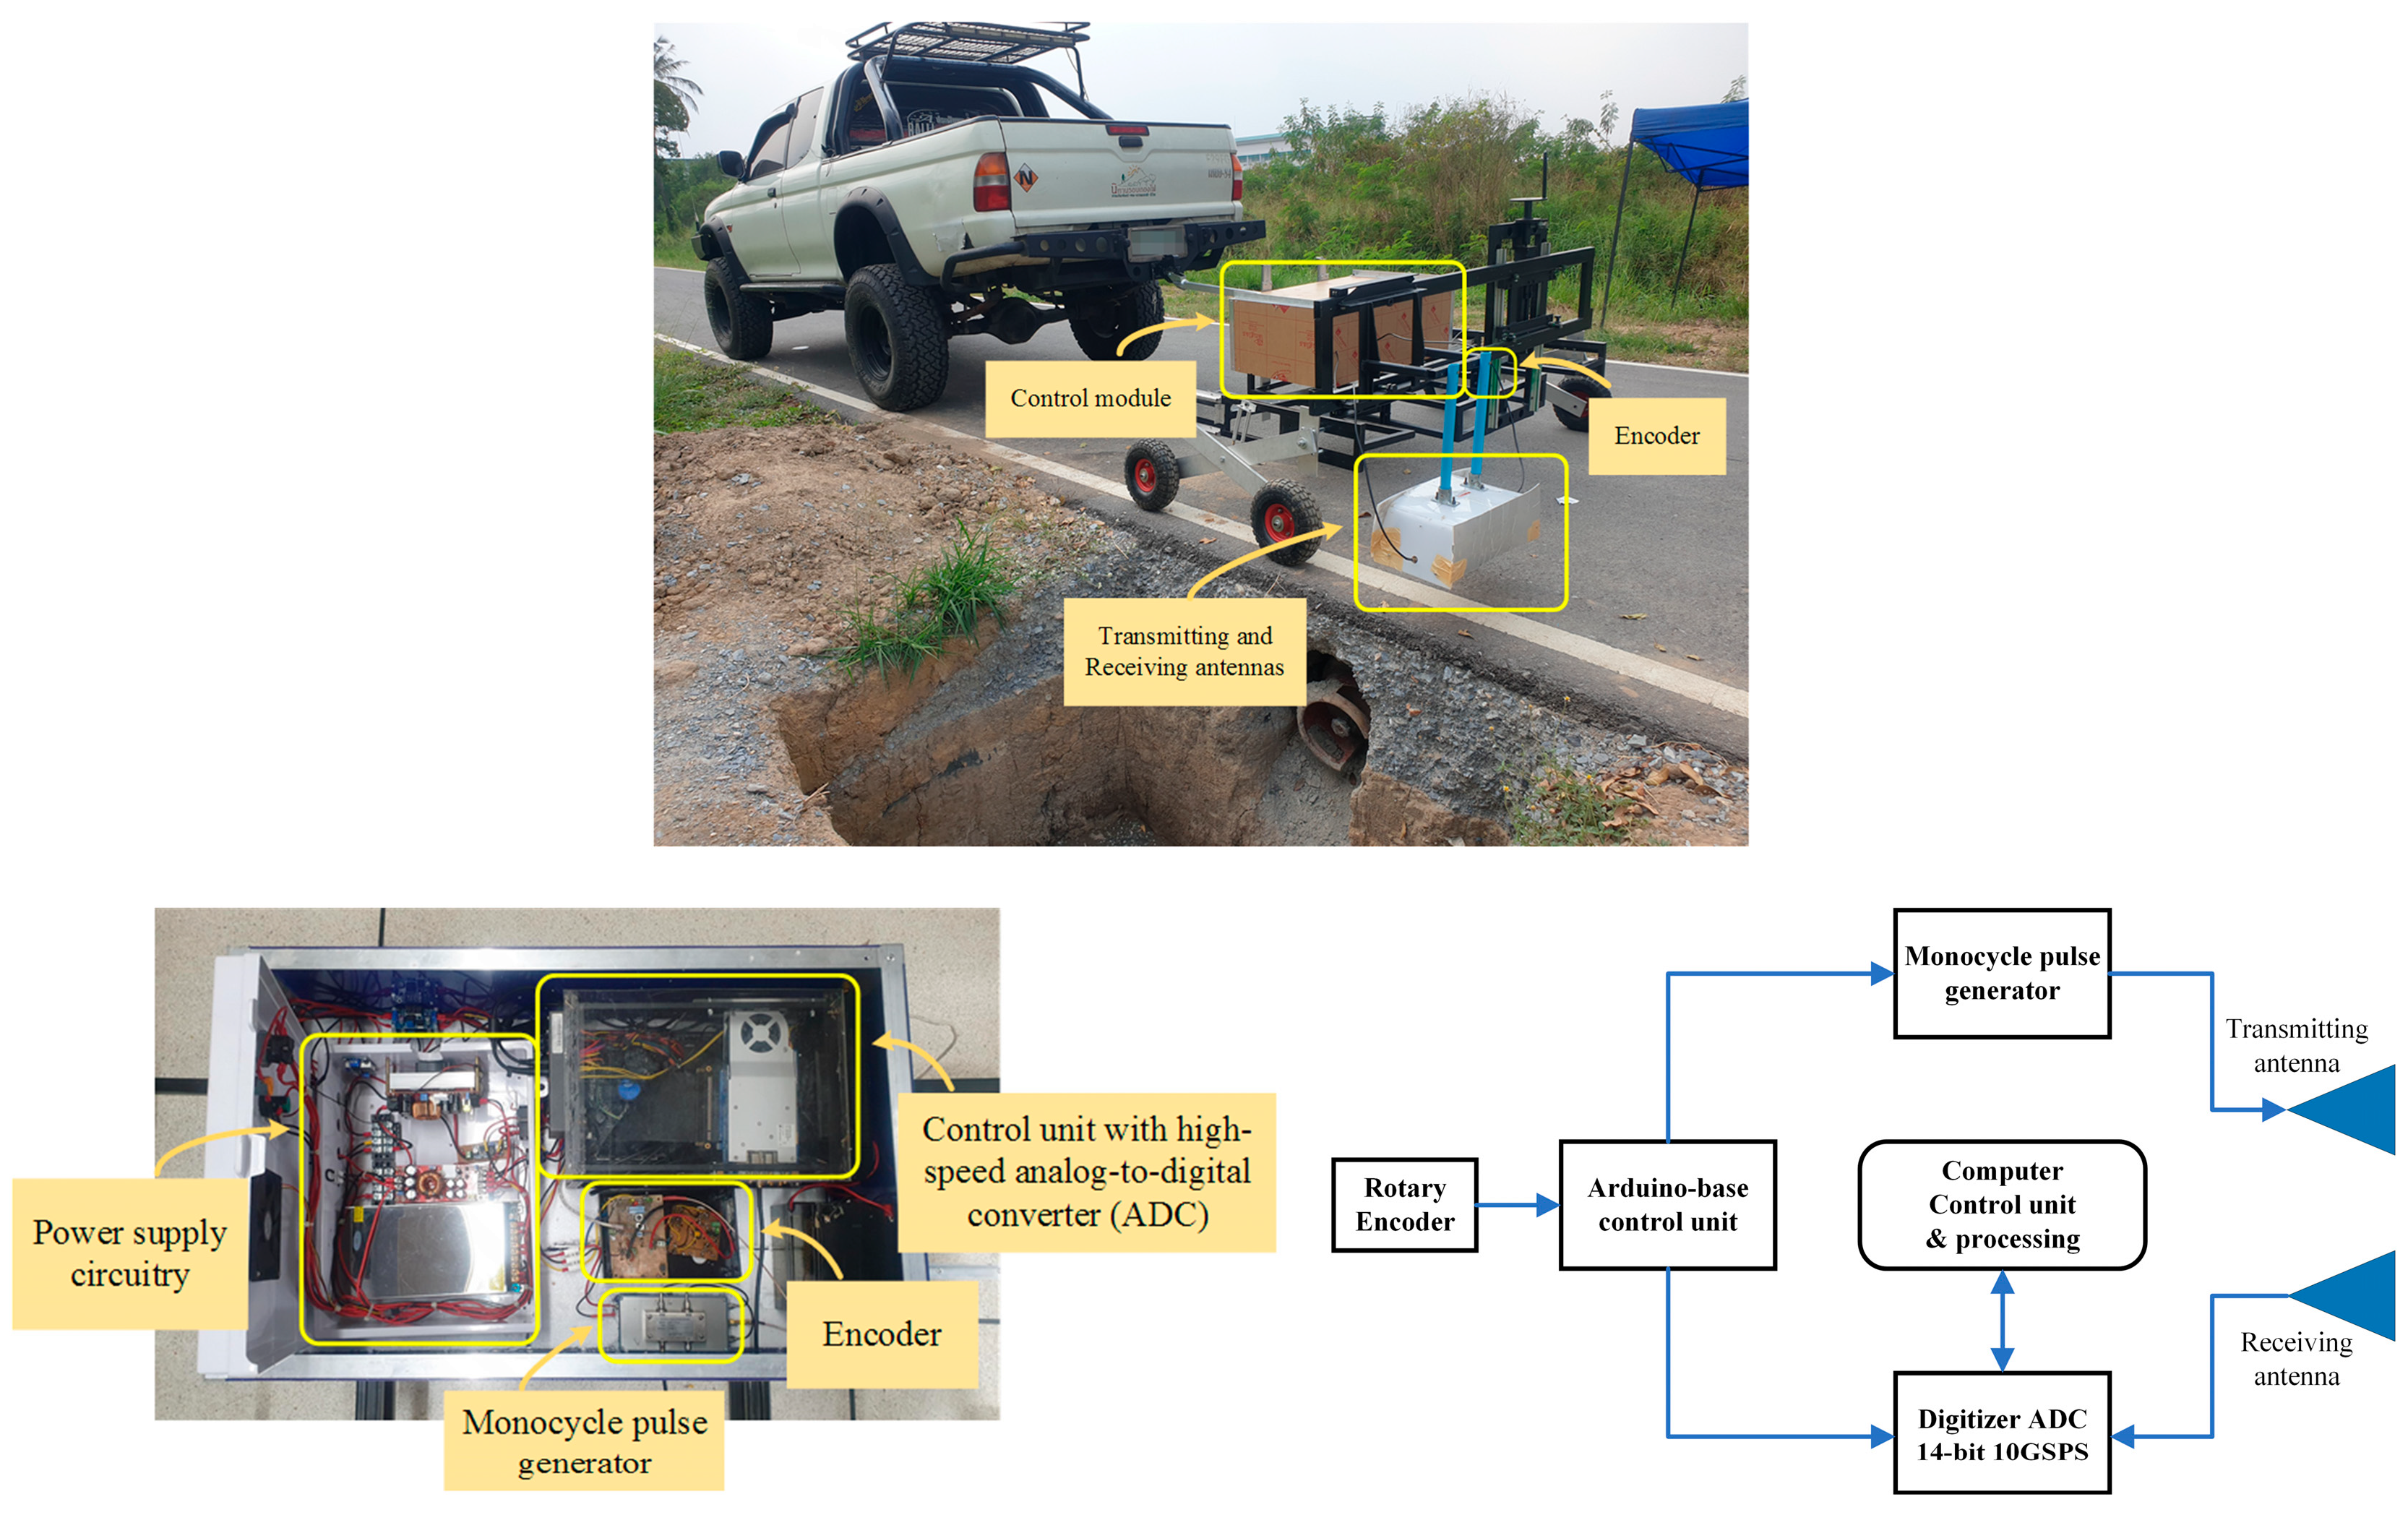
3. Hardware and Software Implementations
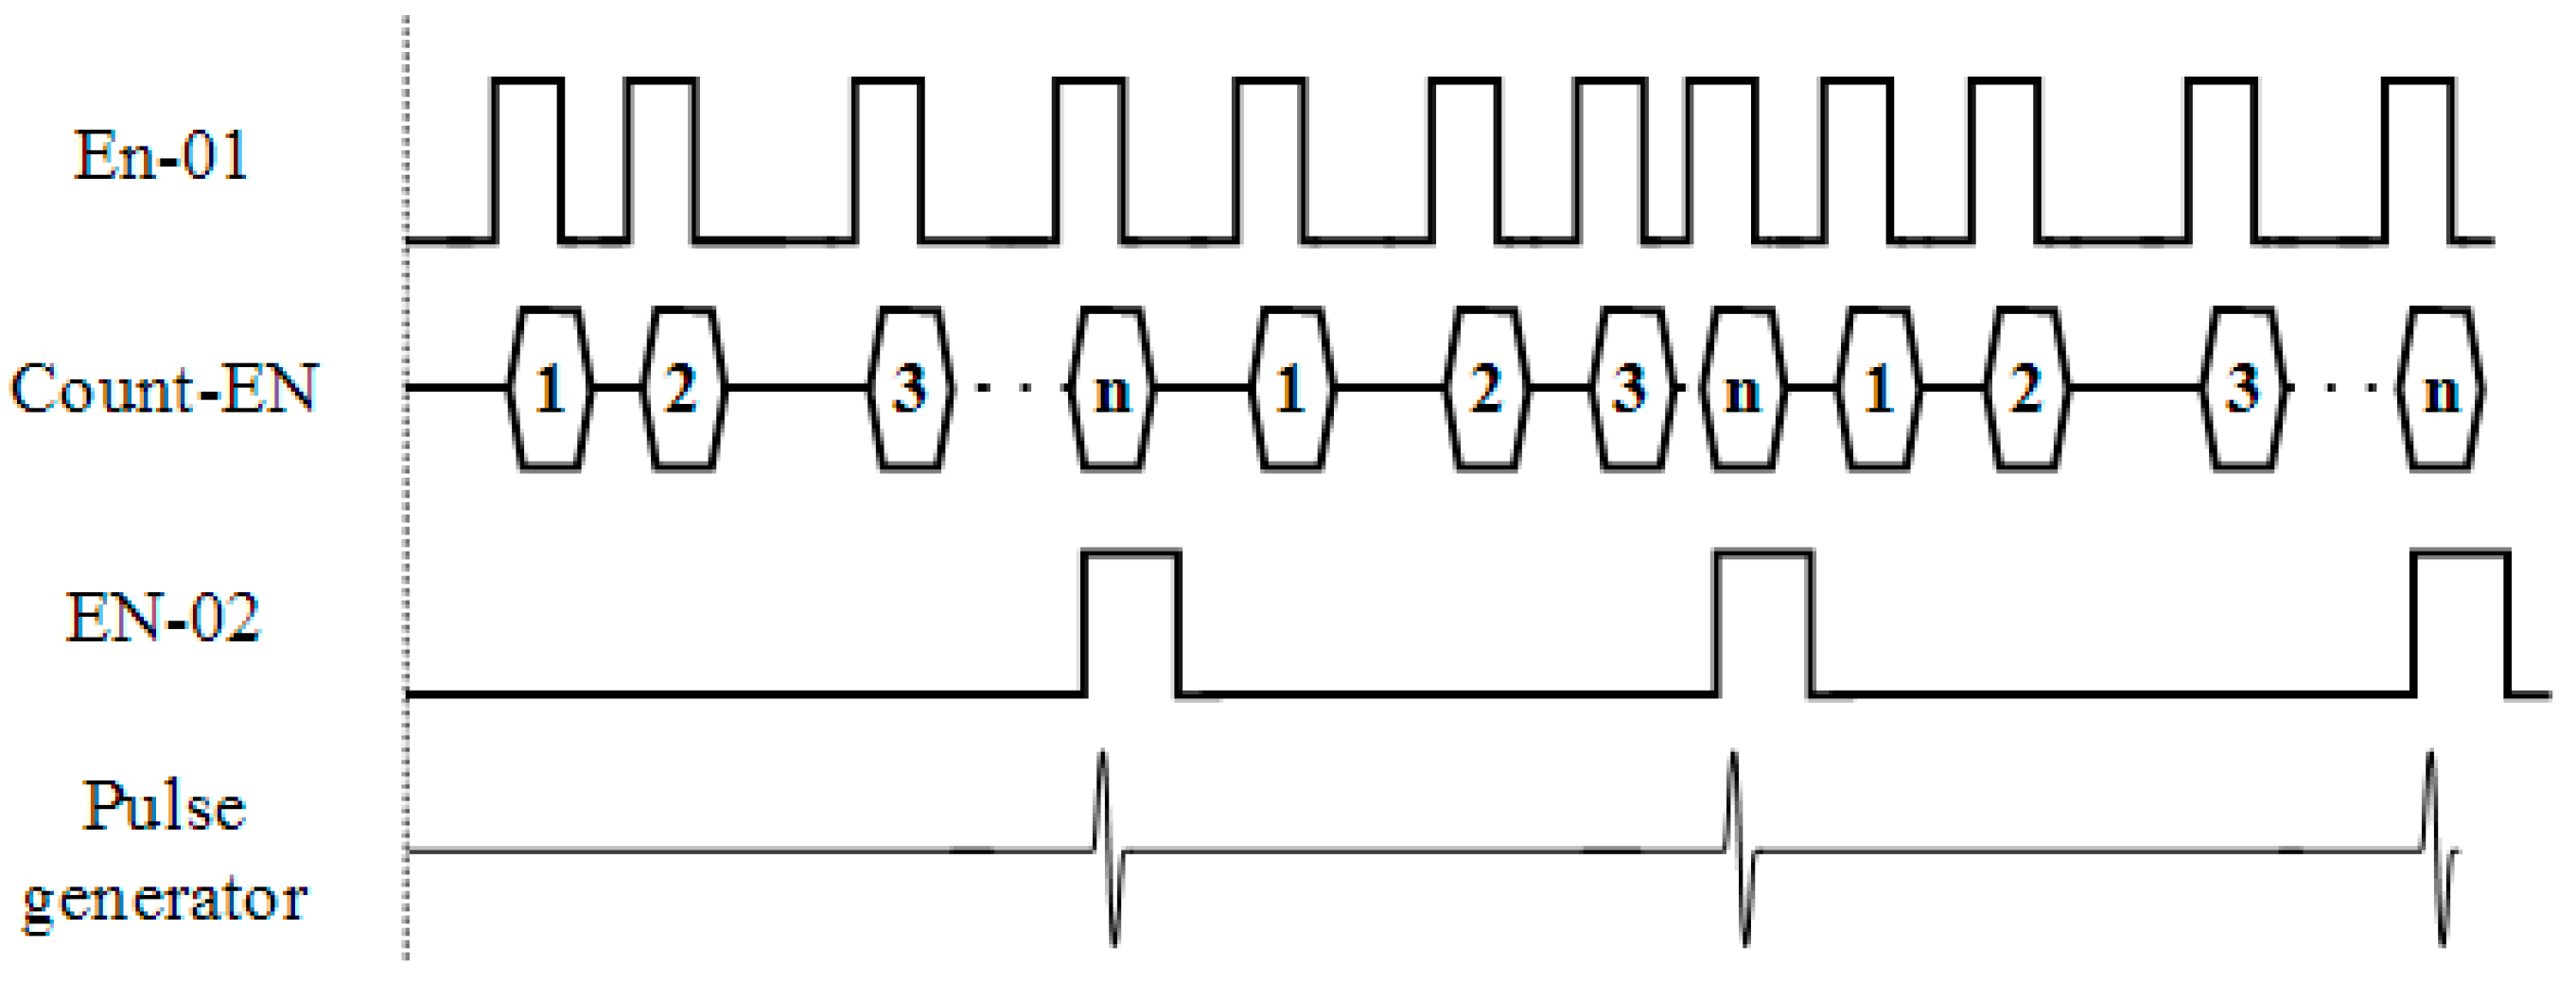
3.1. Hardware Implementations
3.2. Software Implementations
4. Experimental Setup
5. Training Process
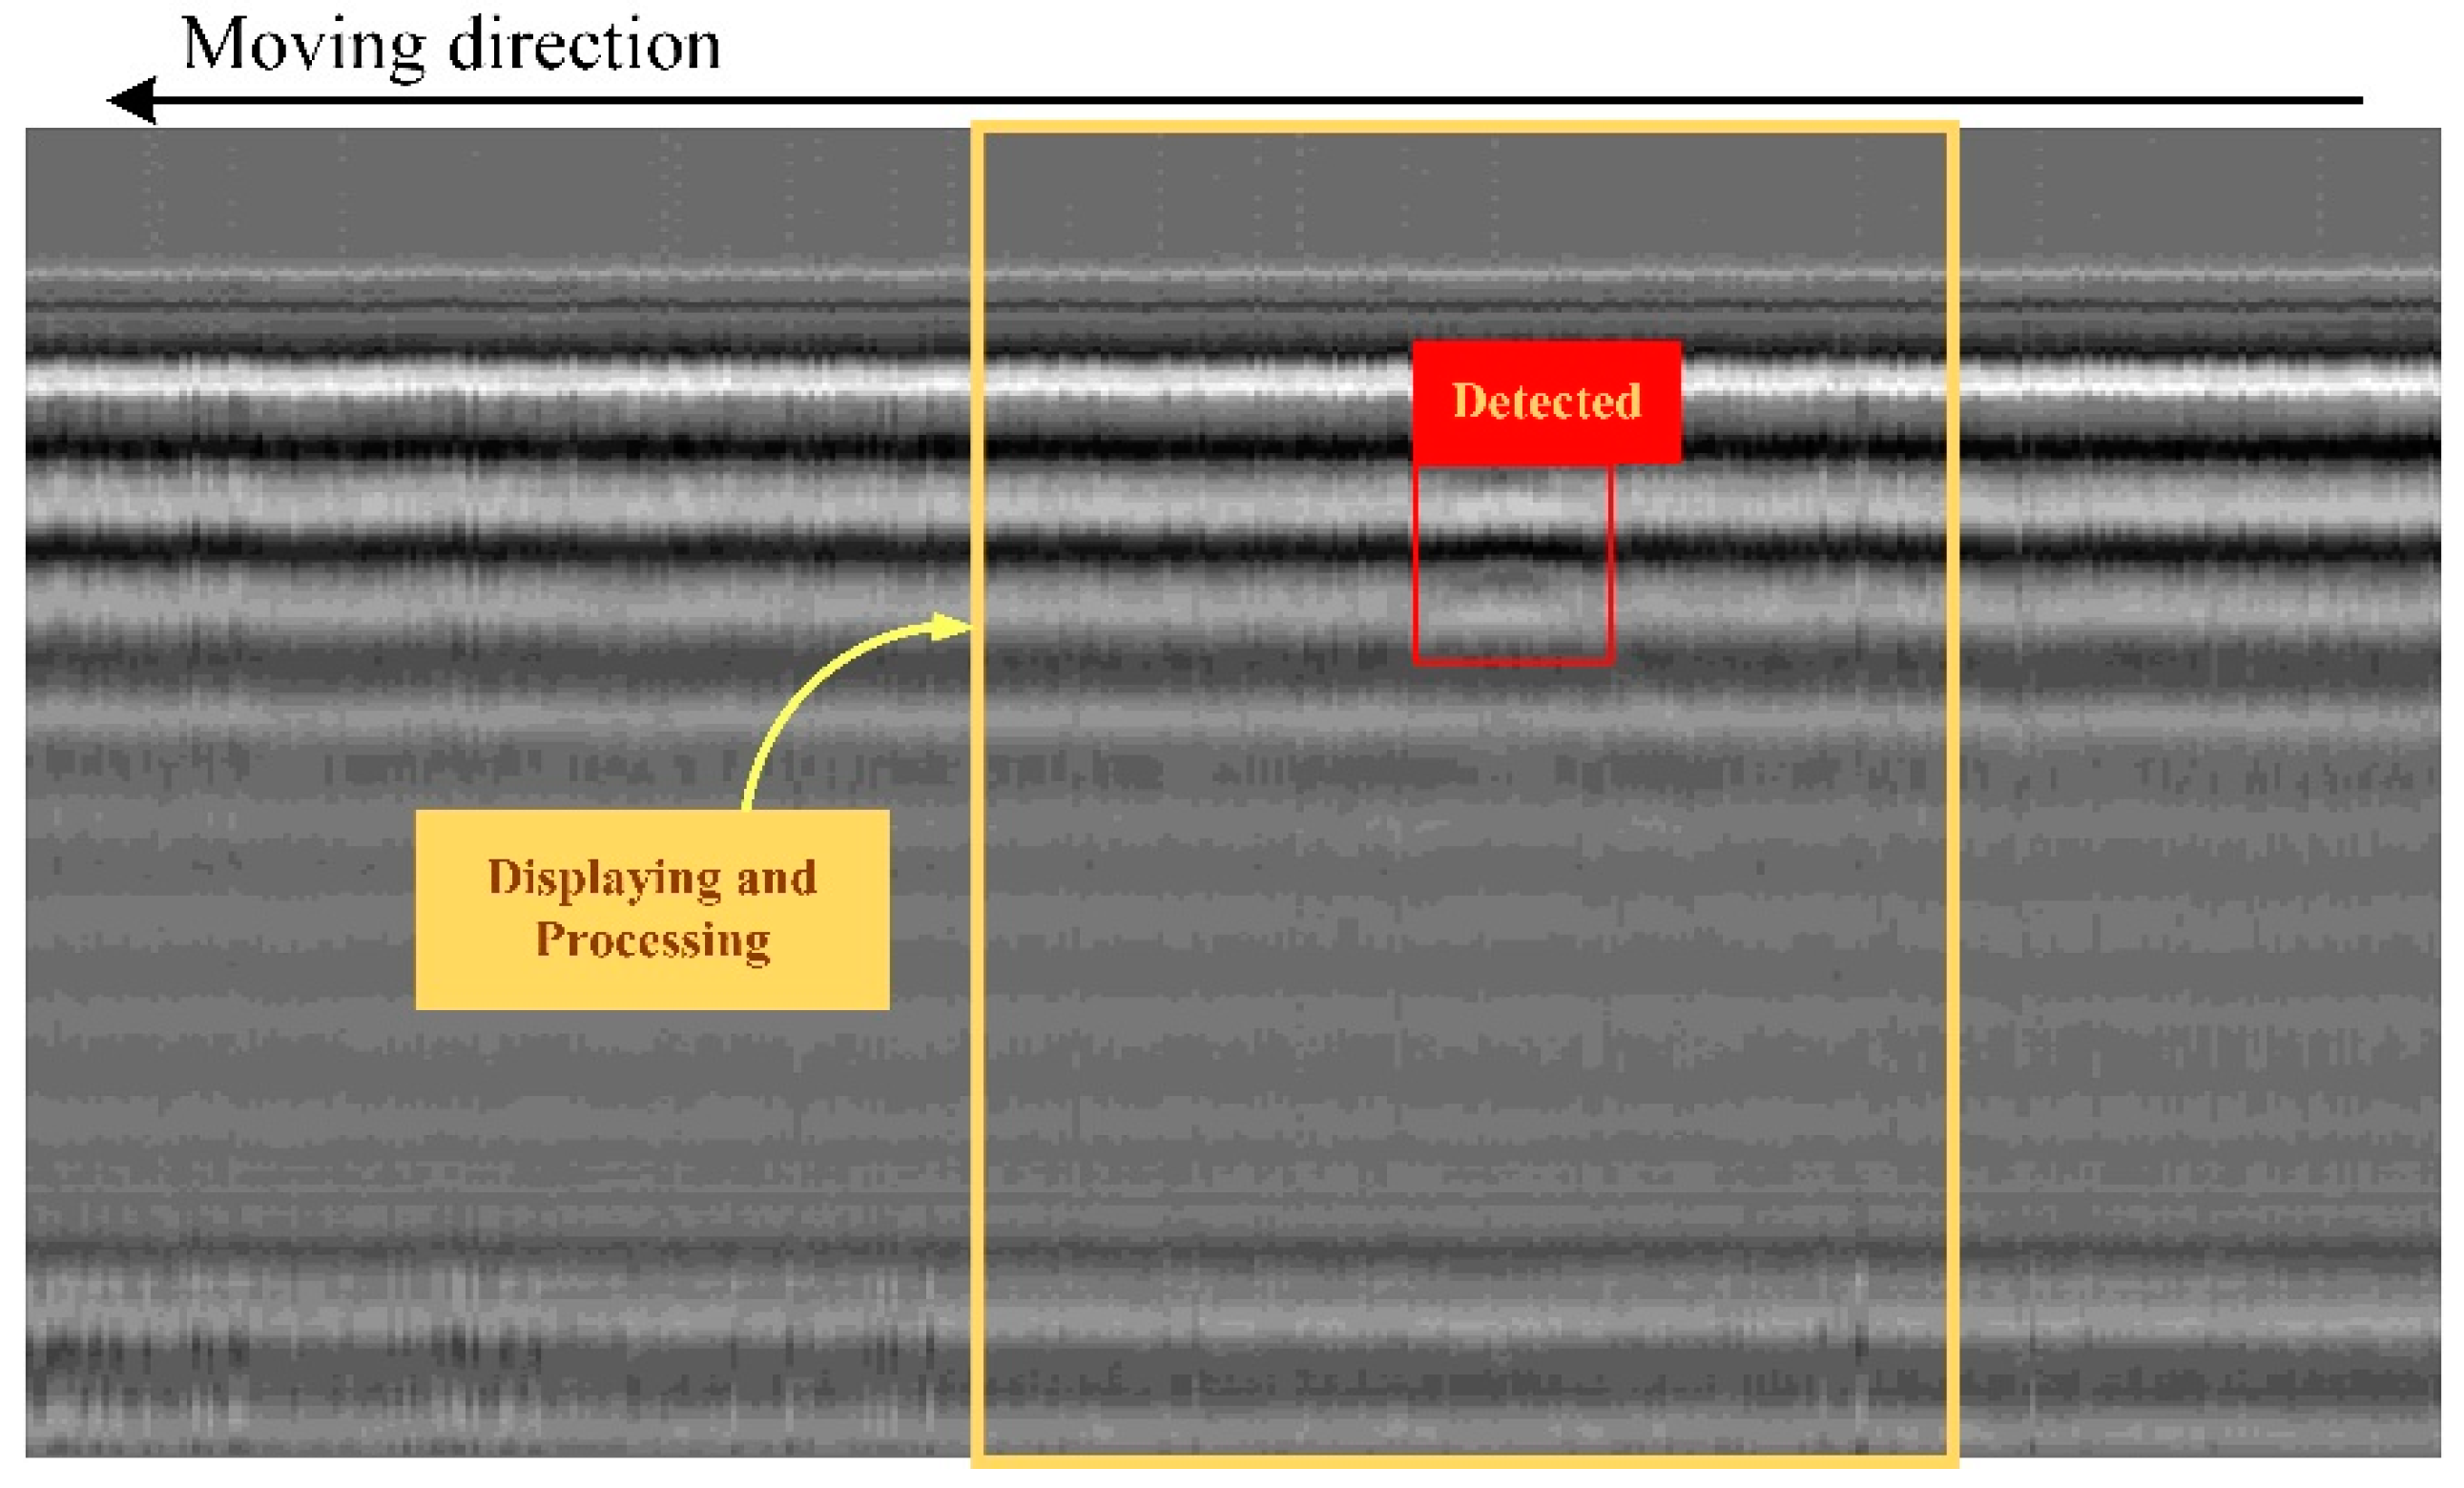
6. Experimental Results
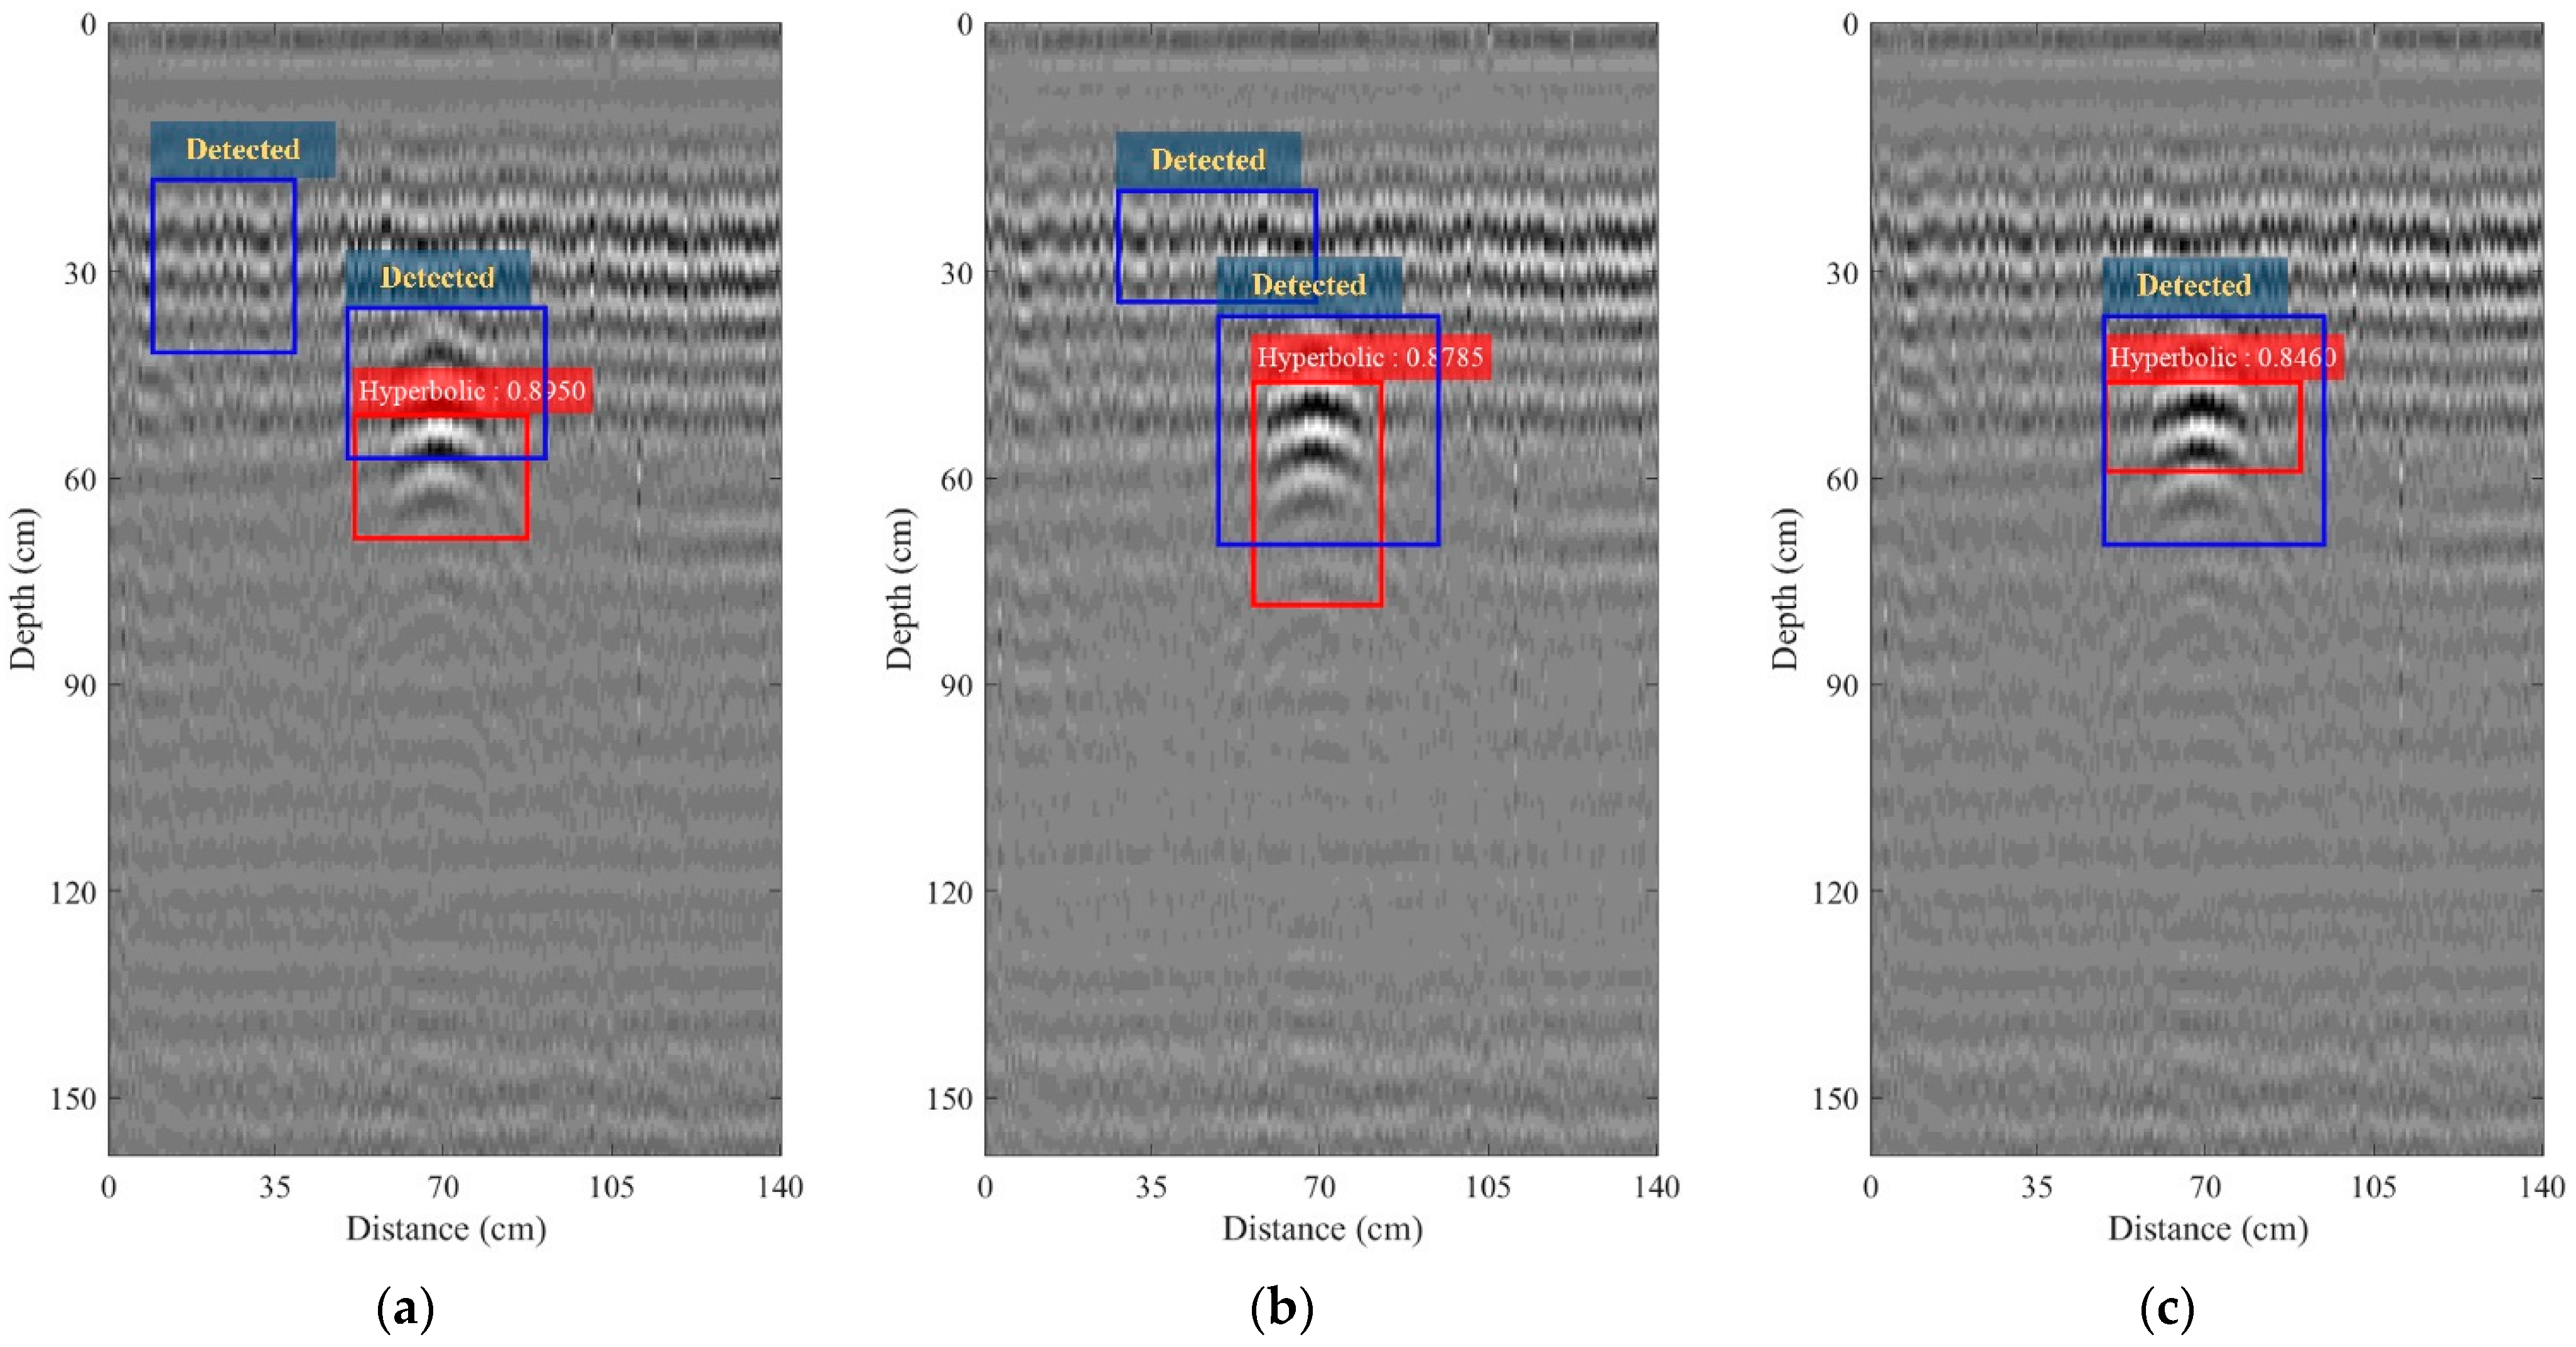
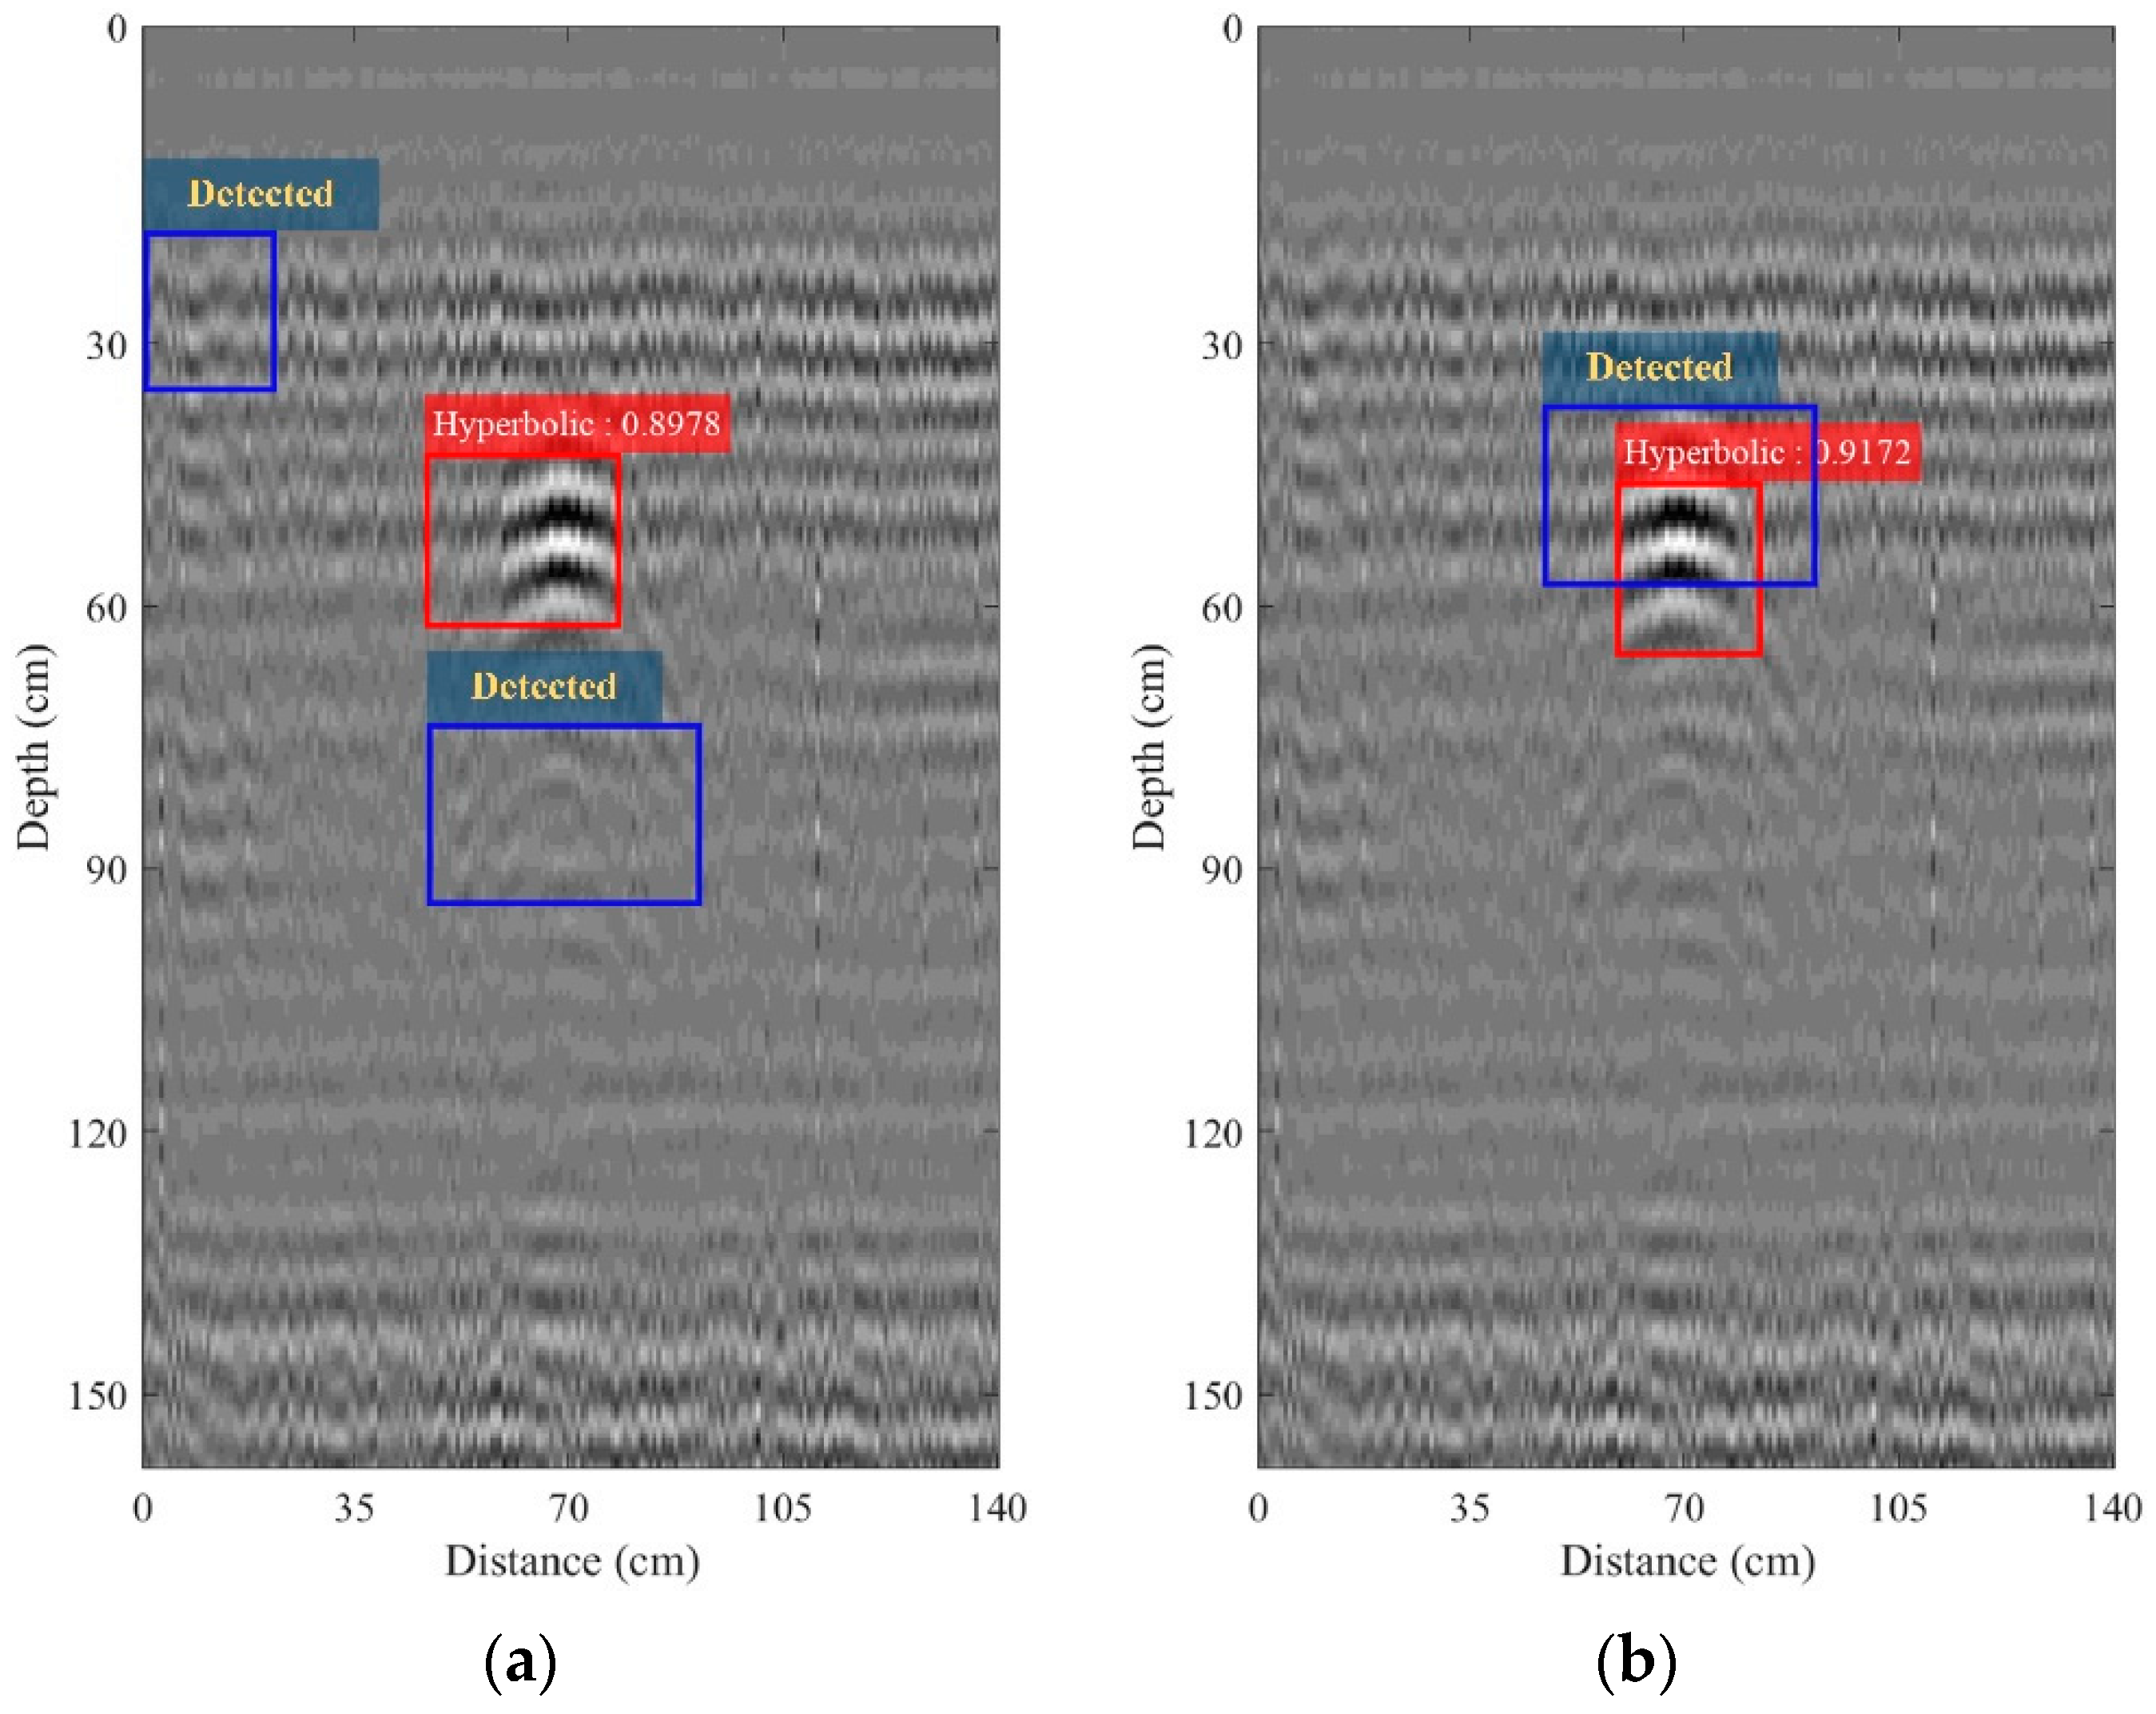
6.1. Road
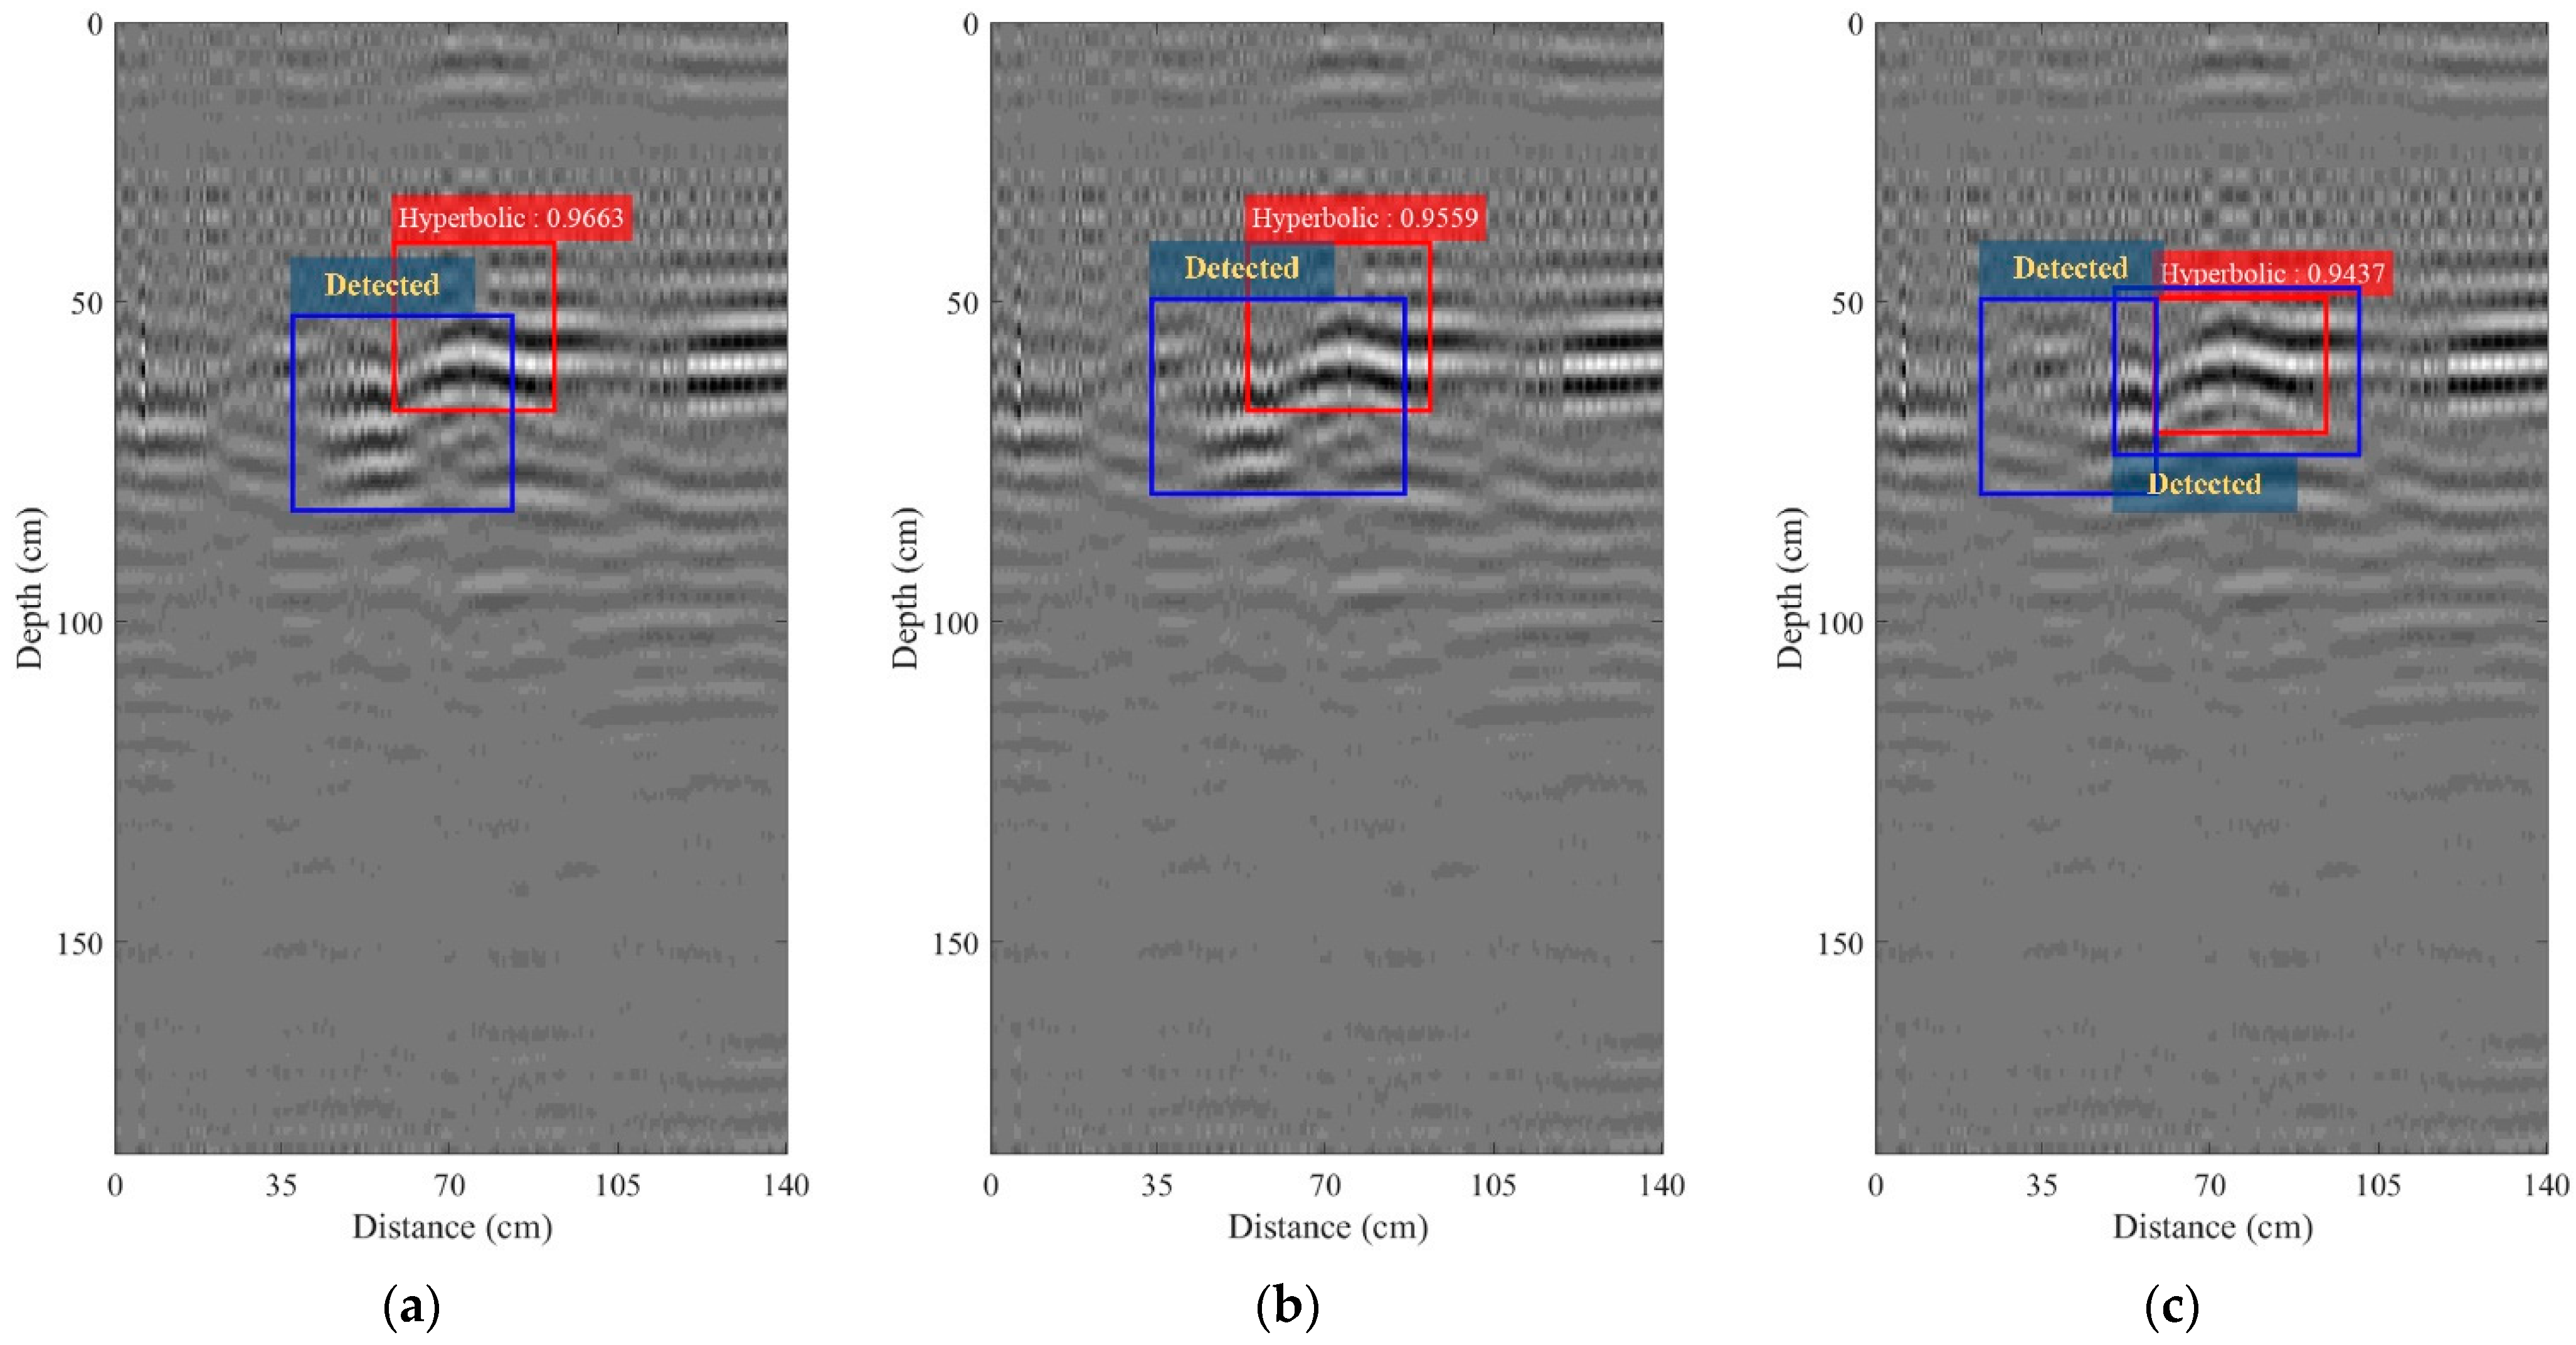
6.2. Railway
7. Conclusions
Author Contributions
Funding
Institutional Review Board Statement
Informed Consent Statement
Data Availability Statement
Conflicts of Interest
References
- Chantasen, N.; Boonpoonga, A.; Burintramart, S.; Athikulwongse, K.; Akkaraekthalin, P. Automatic Detection and Classification of Buried Objects Using Ground-Penetrating Radar for Counter-Improvised Explosive Devices. Radio Sci. 2018, 53, 210–227. [Google Scholar] [CrossRef]
- Boonpoonga, A. Ground Penetrating Radar (GPR) for Counter Improvised-Explosive Devices in Thailand. In Proceedings of the 2015 IEEE Conference on Antenna Measurements & Applications (CAMA), Chiang Mai, Thailand, 30 November–2 December 2015. [Google Scholar]
- González-Huici, M.A.; Catapano, I.; Soldovieri, F. A Comparative Study of GPR Reconstruction Approaches for Landmine Detection. IEEE J. Sel. Top. Appl. Earth Obs. Remote Sens. 2014, 7, 4869–4878. [Google Scholar] [CrossRef]
- Marsh, L.A.; van Verre, W.; Davidson, J.L.; Gao, X.; Podd, F.J.W.; Daniels, D.J.; Peyton, A.J. Combining Electromagnetic Spectroscopy and Ground-Penetrating Radar for the Detection of Anti-Personnel Landmines. Sensors 2019, 19, 3390. [Google Scholar] [CrossRef] [Green Version]
- Takahashi, K.; Igel, J.; Preetz, H.; Sato, M. Influence of Heterogeneous Soils and Clutter on the Performance of Ground-Penetrating Radar for Landmine Detection. IEEE Trans. Geosci. Remote Sens. 2014, 52, 3464–3472. [Google Scholar] [CrossRef]
- Šipoš, D.; Gleich, D. SFCW Radar with an Integrated Static Target Echo Cancellation System. Sensors 2021, 21, 5829. [Google Scholar] [CrossRef]
- Šipoš, D.; Gleich, D. A Lightweight and Low-Power UAV-Borne Ground Penetrating Radar Design for Landmine Detection. Sensors 2020, 20, 2234. [Google Scholar] [CrossRef] [Green Version]
- Bannawat, L.; Boonpoonga, A.; Akkaraekthalin, P. Permittivity estimation of a shallow-layered medium using high-resolution ground-penetrating radar. Int. J. Remote Sens. 2020, 41, 4626–4643. [Google Scholar] [CrossRef]
- Chantasen, N.; Boonpoonga, A.; Athikulwongse, K.; Kaemarungsi, K.; Akkaraekthalin, P. Mapping the Physical and Dielectric Properties of Layered Soil Using Short-Time Matrix Pencil Method-Based Ground-Penetrating Radar. IEEE Access 2020, 8, 105610–105621. [Google Scholar] [CrossRef]
- Ratto, C.R.; Torrione, P.A.; Collins, L.M. Exploiting Ground-Penetrating Radar Phenomenology in a Context-Dependent Framework for Landmine Detection and Discrimination. IEEE Trans. Geosci. Remote Sens. 2011, 49, 1689–1700. [Google Scholar] [CrossRef]
- Gader, P.; Lee, W.-H.; Wilson, J.N. Detecting landmines with ground-penetrating radar using feature-based rules, order statistics, and adaptive whitening. IEEE Trans. Geosci. Remote Sens. 2004, 42, 2522–2534. [Google Scholar] [CrossRef]
- Ng, W.; Chan, T.C.T.; So, H.C.; Ho, K.C. Particle Filtering Based Approach for Landmine Detection Using Ground Penetrating Radar. IEEE Trans. Geosci. Remote Sens. 2008, 46, 3739–3755. [Google Scholar] [CrossRef]
- Zhu, Q.; Collins, L.M. Application of feature extraction methods for landmine detection using the Wichmann/Niitek ground-penetrating radar. IEEE Trans. Geosci. Remote Sens. 2005, 43, 81–85. [Google Scholar]
- Yoldemir, A.B.; Sezgin, M. A Least Squares Approach to Buried Object Detection Using Ground Penetrating Radar. IEEE Sens. J. 2011, 11, 1337–1341. [Google Scholar] [CrossRef]
- Feng, X.; Sato, M.; Liu, C. Subsurface Imaging Using a Handheld GPR MD System. IEEE Geosci. Remote Sens. Lett. 2012, 9, 659–662. [Google Scholar] [CrossRef]
- Feng, X.; Sato, M.; Liu, C. Hand-Held GPR Imaging Using Migration for Irregular Data. IEEE J. Sel. Top. Appl. Earth Obs. Remote Sens. 2011, 4, 799–803. [Google Scholar] [CrossRef]
- Kondo, T.; Kikuta, K.; Sato, M. Ground Surface Reflection Compensation for Hand-Held GPR. IEEE Geosci. Remote Sens. Lett. 2020, 19, 1–5. [Google Scholar] [CrossRef]
- Pasolli, E.; Melgani, F.; Donelli, M. Automatic Analysis of GPR Images: A Pattern-Recognition Approach. IEEE Trans. Geosci. Remote Sens. 2009, 47, 2206–2217. [Google Scholar] [CrossRef]
- Zhang, X.; Han, L.; Robinson, M.; Gallagher, A. A Gans-Based Deep Learning Framework for Automatic Subsurface Object Recognition From Ground Penetrating Radar Data. IEEE Access 2021, 9, 39009–39018. [Google Scholar] [CrossRef]
- Zhou, X.; Chen, H.; Li, J. An Automatic GPR B-Scan Image Interpreting Model. IEEE Trans. Geosci. Remote Sens. 2018, 56, 3398–3412. [Google Scholar] [CrossRef]
- Moalla, M.; Frigui, H.; Karem, A.; Bouzid, A. Application of Convolutional and Recurrent Neural Networks for Buried Threat Detection Using Ground Penetrating Radar Data. IEEE Trans. Geosci. Remote Sens. 2020, 58, 7022–7034. [Google Scholar] [CrossRef]
- Mertens, L.; Persico, R.; Matera, L.; Lambot, S. Automated Detection of Reflection Hyperbolas in Complex GPR Images With No A Priori Knowledge on the Medium. IEEE Trans. Geosci. Remote Sens. 2016, 54, 580–596. [Google Scholar] [CrossRef]
- Li, H.; Li, N.; Wu, R.; Wang, H.; Gui, Z.; Song, D. GPR-RCNN: An Algorithm of Subsurface Defect Detection for Airport Runway Based on GPR. IEEE Robot. Autom. Lett. 2021, 6, 3001–3008. [Google Scholar] [CrossRef]
- Kim, N.; Kim, S.; An, Y.-K.; Lee, J.-J. Triplanar Imaging of 3-D GPR Data for Deep-Learning-Based Underground Object Detection. IEEE J. Sel. Top. Appl. Earth Obs. Remote Sens. 2019, 12, 4446–4456. [Google Scholar] [CrossRef]
- Capineri, L.; Grande, P.; Temple, J.A.G. Advanced image-processing technique for real-time interpretation of ground-penetrating radar images. Int. J. Imaging Syst. Technol. 1998, 9, 51–59. [Google Scholar] [CrossRef]
- Brunzell, H. Detection of shallowly buried objects using impulse radar. IEEE Trans. Geosci. Remote Sens. 1999, 37, 875–886. [Google Scholar] [CrossRef] [Green Version]
- Delbo, S.; Gamba, P.; Roccato, D. A fuzzy shell clustering approach to recognize hyperbolic signatures in subsurface radar images. IEEE Trans. Geosci. Remote Sens. 2000, 38, 1447–1451. [Google Scholar] [CrossRef]
- Gamba, P.; Lossani, S. Neural detection of pipe signatures in ground penetrating radar images. IEEE Trans. Geosci. Remote Sens. 2000, 38, 790–797. [Google Scholar] [CrossRef]
- Al-Nuaimy, W.; Huang, Y.; Nakhkash, M.; Fang, M.T.C.; Nguyen, V.T.; Eriksen, A. Automatic detection of buried utilities and solid objects with GPR using neural networks and pattern recognition. J. Appl. Geophys. 2000, 43, 157–165. [Google Scholar] [CrossRef]
- Girshick, R.; Donahue, J.; Darrell, T.; Malik, J. Region-Based Convolutional Networks for Accurate Object Detection and Segmentation. IEEE Trans. Pattern Anal. Mach. Intell. 2016, 38, 142–158. [Google Scholar] [CrossRef]
- Zhao, M.; Shi, P.; Xu, X.; Xu, X.; Liu, W.; Yang, H. Improving the Accuracy of an R-CNN-Based Crack Identification System Using Different Preprocessing Algorithms. Sensors 2022, 22, 7089. [Google Scholar] [CrossRef]
- Zu, L.; Zhao, Y.; Liu, J.; Su, F.; Zhang, Y.; Liu, P. Detection and Segmentation of Mature Green Tomatoes Based on Mask R-CNN with Automatic Image Acquisition Approach. Sensors 2021, 21, 7842. [Google Scholar] [CrossRef] [PubMed]
- Chifor, R.; Hotoleanu, M.; Marita, T.; Arsenescu, T.; Socaciu, M.A.; Badea, I.C.; Chifor, I. Automatic Segmentation of Periodontal Tissue Ultrasound Images with Artificial Intelligence: A Novel Method for Improving Dataset Quality. Sensors 2022, 22, 7101. [Google Scholar] [CrossRef] [PubMed]
- An, Q.; Wu, S.; Shi, R.; Wang, H.; Yu, J.; Li, Z. Intelligent Detection of Hazardous Goods Vehicles and Determination of Risk Grade Based on Deep Learning. Sensors 2022, 22, 7123. [Google Scholar] [CrossRef] [PubMed]
- Nsaif, A.K.; Ali, S.H.; Jassim, K.N.; Nseaf, A.K.; Sulaiman, R.; Al-Qaraghuli, A.; Wahdan, O.; Nayan, N.A. FRCNN-GNB: Cascade Faster R-CNN With Gabor Filters and Naïve Bayes for Enhanced Eye Detection. IEEE Access 2021, 9, 15708–15719. [Google Scholar] [CrossRef]
- Yang, G.; Ye, S.; Ji, Y.; Zhang, X.; Fang, G. Radiation Enhancement of an Ultrawideband Unidirectional Folded Bowtie Antenna for GPR Applications. IEEE Access 2020, 8, 182218–182228. [Google Scholar] [CrossRef]
- Serhir, M.; Lesselier, D. Wideband Reflector-Backed Folded Bowtie Antenna for Ground Penetrating Radar. IEEE Trans. Antennas Propag. 2018, 66, 1056–1063. [Google Scholar] [CrossRef]
- Yektakhah, B.; Chiu, J.; Alsallum, F.; Sarabandi, K. Low-Profile, Low-Frequency, UWB Antenna for Imaging of Deeply Buried Targets. IEEE Geosci. Remote Sens. Lett. 2020, 17, 1168–1172. [Google Scholar] [CrossRef]
- Guo, L.; Yang, H.; Zhang, Q.; Deng, M. A Compact Antipodal Tapered Slot Antenna With Artificial Material Lens and Reflector for GPR Applications. IEEE Access 2018, 6, 44244–44251. [Google Scholar] [CrossRef]
- Chen, Y.; Joines, W.T.; Xie, Z.; Shi, G.; Liu, Q.H.; Carin, L. Double-Sided Exponentially Tapered GPR Antenna and Its Transmission Line Feed Structure. IEEE Trans. Antennas Propag. 2006, 54, 2615–2623. [Google Scholar] [CrossRef]
- Kosaroglu, S.; Kamacı, Z.; Erdoğan, S.; Bektaş, O.; Büyüksaraç, A. Determination of historical graves by ground penetrating radar method: Sakarya Field Battle (August 23–September 13, 1921, Turkey). Aust. J. Forensic Sci. 2021, 54, 842–860. [Google Scholar] [CrossRef]
- Daniels, D.J. Ground Penetrating Radar, 2nd ed.; The Institution of Electrical Engineers: London, UK, 2004; pp. 247–255. [Google Scholar]
- Zhang, Y.; Huston, D.; Xia, T. Underground object characterization based on neural networks for ground penetrating radar data. Proc. SPIE 2016, 9804, 10–18. [Google Scholar]
- Chomdee, P.; Boonpoonga, A.; Prayote, A. Fast and Efficient Detection of Buried Object for GPR Image. In Proceedings of the 20th Asia-Pacific Conference on Communication (APCC2014), Pattaya, Thailand, 1–3 October 2014. [Google Scholar]
- Rezatofighi, H.; Tsoi, N.; Gwak, J.; Sadeghian, A.; Reid, I.; Savarese, S. Generalized Intersection Over Union: A Metric and a Loss for Bounding Box Regression. In Proceedings of the 2019 IEEE/CVF Conference on Computer Vision and Pattern Recognition (CVPR), Long Beach, CA, USA, 15–20 June 2019. [Google Scholar]


| |S11| (GHz) | Gain (dBi) | Pattern | Mechanism | Size (cm3) | |
|---|---|---|---|---|---|
| [36] | 0.25–0.85 | 4 | Unidirectional | Bowtie Antenna | 18.0 × 28.2 × 15.0 |
| [37] | 0.5–3.0 | 12 | Unidirectional | Bowtie Antenna | 18.0 × 27.0 × 4.3 |
| [38] | 0.14–0.51 | 4.9 | Unidirectional | Tem Horn Antenna | 60.0 × 60.0 × 15.0 |
| [39] | 2.0–7.0 | - | Unidirectional | Tapered Antenna | 28.0 × 0.15 × 43.0 |
| [40] | 5.5–10.5 | - | Unidirectional | Tapered Antenna | 10.1 × 0.15 × 24.8 |
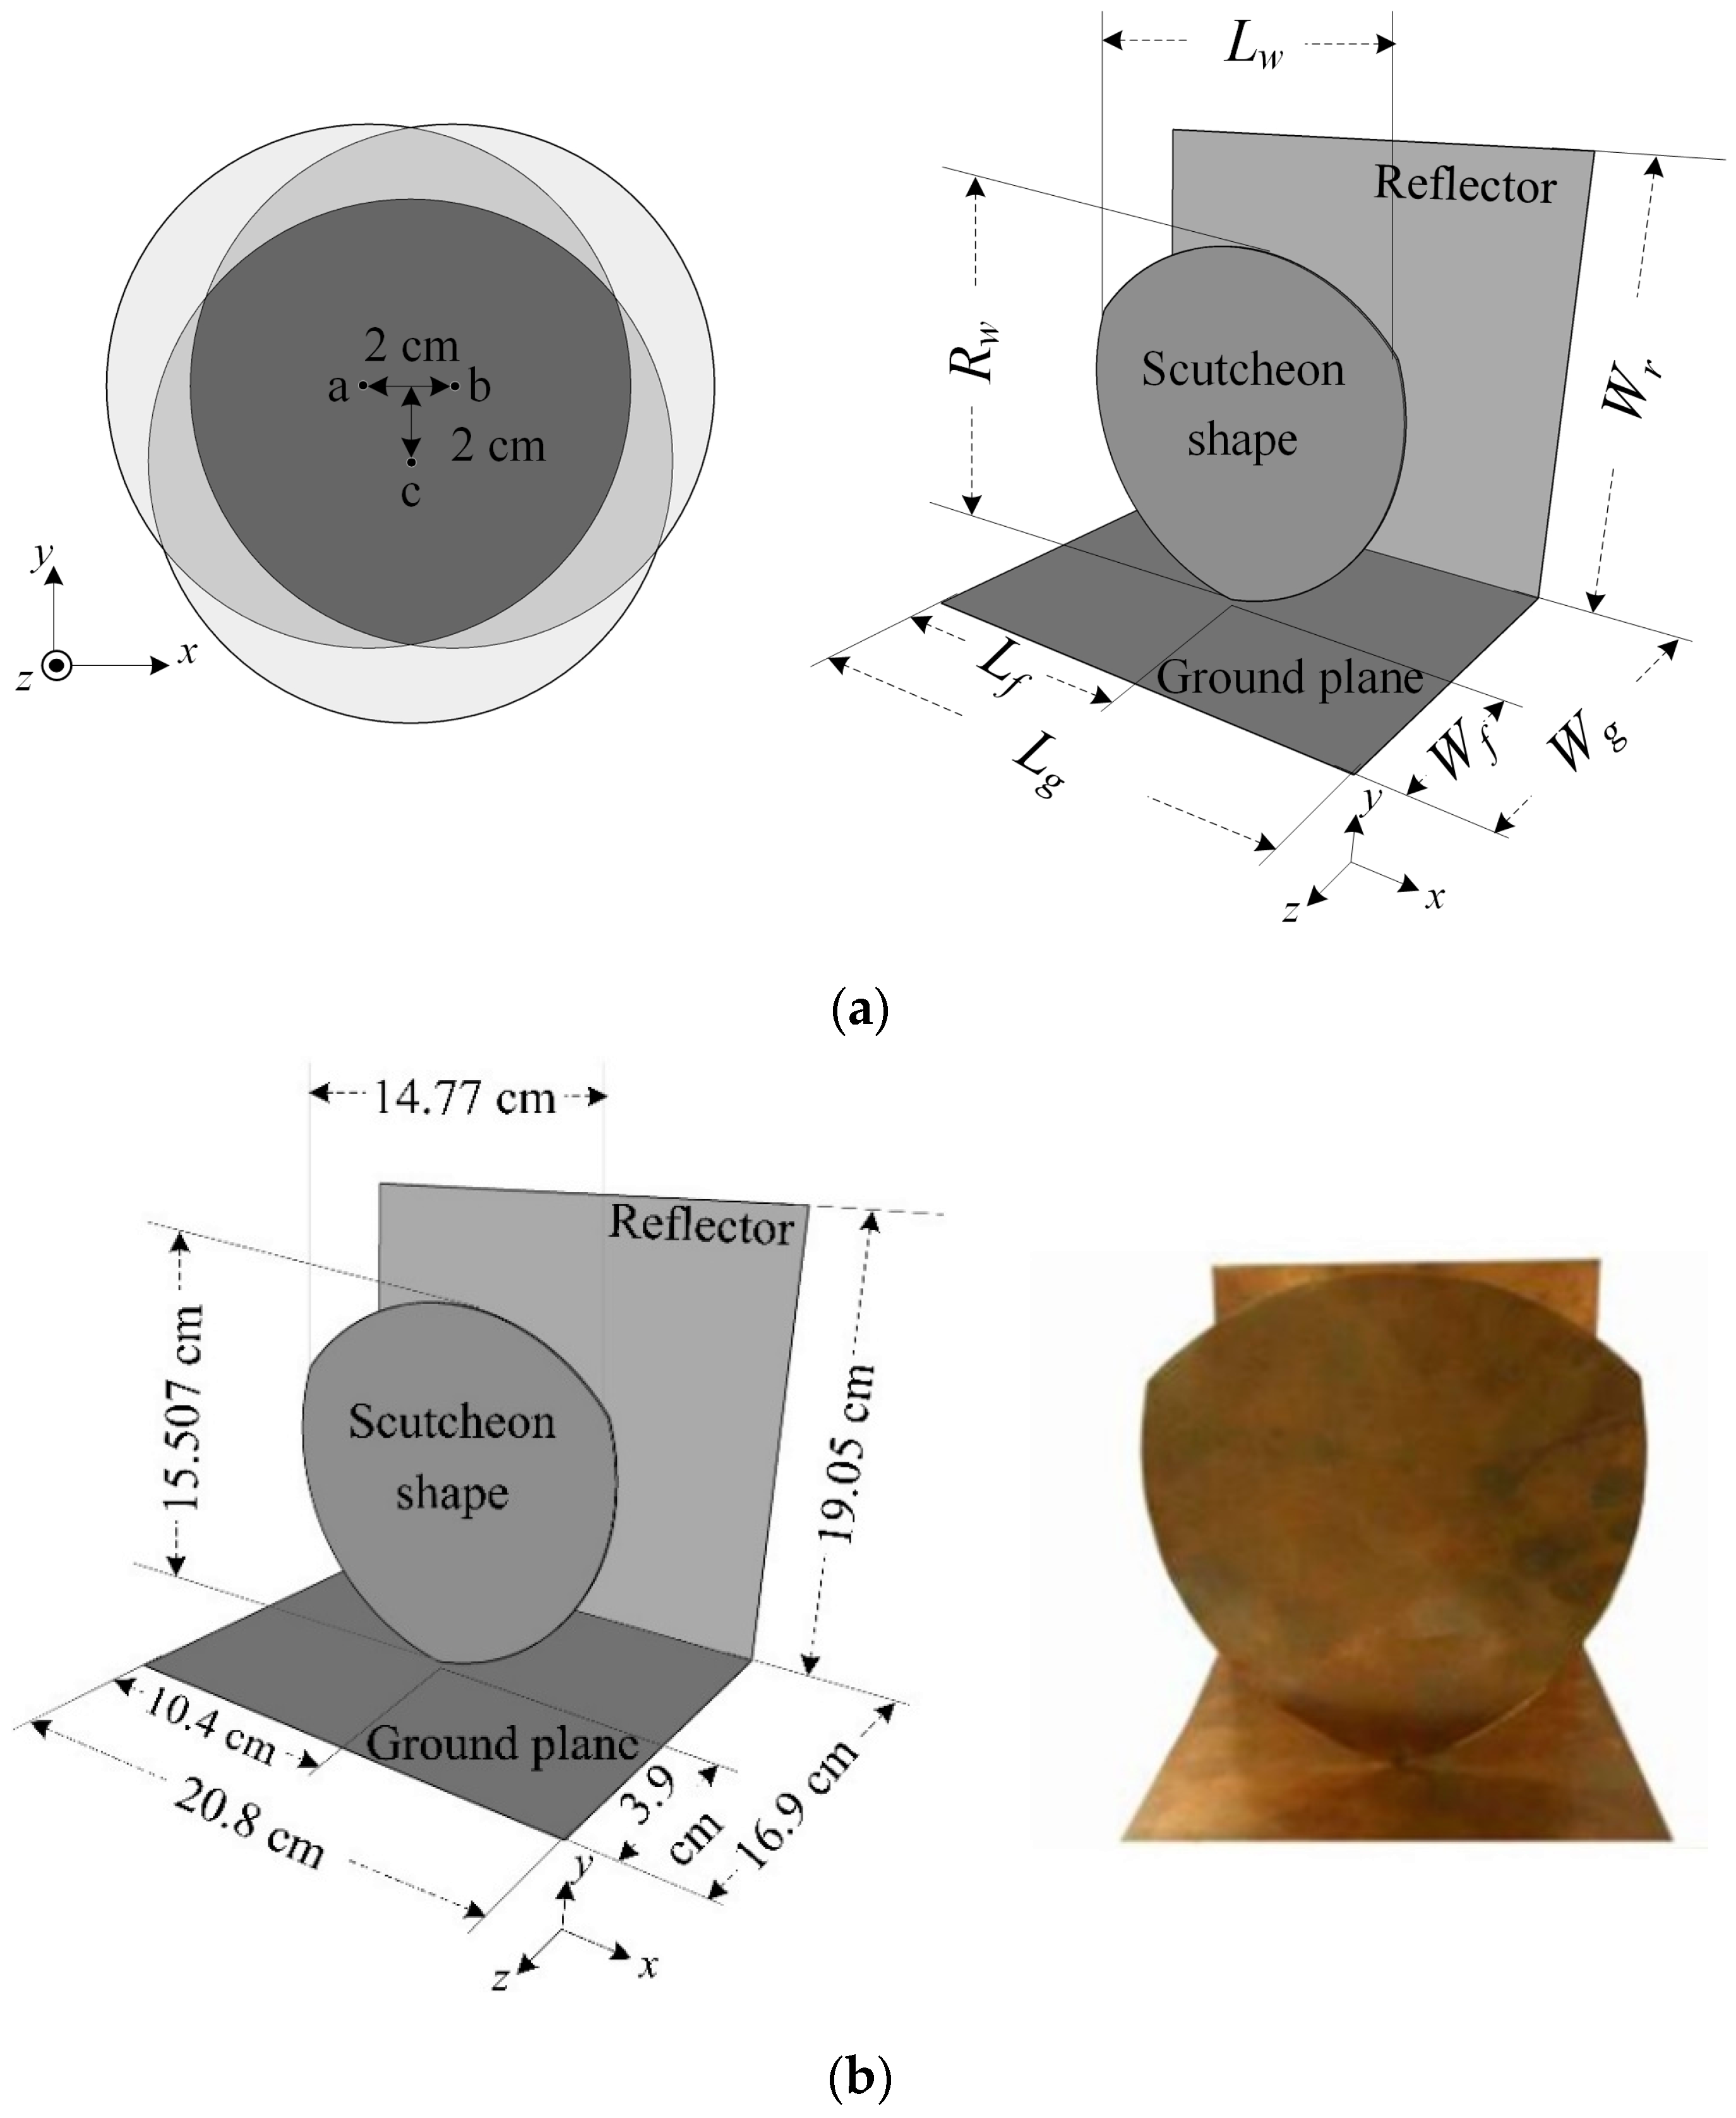
| Proposed antenna | 0.4–3.0 | 4.8 | Unidirectional | Monopole Antenna | 20.8 × 16.9 × 19.05 |
| GPR Type | Classification | Environment | Frequency | Real-Time Detection | |
|---|---|---|---|---|---|
| [12] | Custom | No | Laboratory | Monocycle Pulse | No |
| [19] | Commercial | Yes | Field and GprMax | Step frequency | |
| [24] | Commercial | Yes | Field testing | Step frequency | No |
| [43] | - | Yes | GprMax | Monocycle Pulse | No |
| Proposed | Custom | Yes | Field testing | Monocycle Pulse | Yes |
| Without Any Pre-Processing | Zero Offset and Background Removals | Bandpass Filtering (MHz) | Time-Varying Gain (k) | ||||
|---|---|---|---|---|---|---|---|
| 100 | 150 | 200 | 0.05 | 0.1 | |||
| Pickup truck | 0% | 73.88% | 89.50% | 87.85% | 84.60% | 89.78 | 91.72 |
| Train | 67.75% | 87.66% | 96.63% | 95.59% | 94.37% | 95.22% | 96.68% |
Publisher’s Note: MDPI stays neutral with regard to jurisdictional claims in published maps and institutional affiliations. |
© 2022 by the authors. Licensee MDPI, Basel, Switzerland. This article is an open access article distributed under the terms and conditions of the Creative Commons Attribution (CC BY) license (https://creativecommons.org/licenses/by/4.0/).
Share and Cite
Srimuk, P.; Boonpoonga, A.; Kaemarungsi, K.; Athikulwongse, K.; Dentri, S. Implementation of and Experimentation with Ground-Penetrating Radar for Real-Time Automatic Detection of Buried Improvised Explosive Devices. Sensors 2022, 22, 8710. https://doi.org/10.3390/s22228710
Srimuk P, Boonpoonga A, Kaemarungsi K, Athikulwongse K, Dentri S. Implementation of and Experimentation with Ground-Penetrating Radar for Real-Time Automatic Detection of Buried Improvised Explosive Devices. Sensors. 2022; 22(22):8710. https://doi.org/10.3390/s22228710
Chicago/Turabian StyleSrimuk, Pachara, Akkarat Boonpoonga, Kamol Kaemarungsi, Krit Athikulwongse, and Sitthichai Dentri. 2022. "Implementation of and Experimentation with Ground-Penetrating Radar for Real-Time Automatic Detection of Buried Improvised Explosive Devices" Sensors 22, no. 22: 8710. https://doi.org/10.3390/s22228710
APA StyleSrimuk, P., Boonpoonga, A., Kaemarungsi, K., Athikulwongse, K., & Dentri, S. (2022). Implementation of and Experimentation with Ground-Penetrating Radar for Real-Time Automatic Detection of Buried Improvised Explosive Devices. Sensors, 22(22), 8710. https://doi.org/10.3390/s22228710