Abstract
The spectrum of light captured by a camera can be reconstructed using the interpolation method. The reconstructed spectrum is a linear combination of the reference spectra, where the weighting coefficients are calculated from the signals of the pixel and the reference samples by interpolation. This method is known as the look-up table (LUT) method. It is irradiance-dependent due to the dependence of the reconstructed spectrum shape on the sample irradiance. Since the irradiance can vary in field applications, an irradiance-independent LUT (II-LUT) method is required to recover spectral reflectance. This paper proposes an II-LUT method to interpolate the spectrum in the normalized signal space. Munsell color chips irradiated with D65 were used as samples. Example cameras are a tricolor camera and a quadcolor camera. Results show that the proposed method can achieve the irradiance independent spectrum reconstruction and computation time saving at the expense of the recovered spectral reflectance error. Considering that the irradiance variation will introduce additional errors, the actual mean error using the II-LUT method might be smaller than that of the ID-LUT method. It is also shown that the proposed method outperformed the weighted principal component analysis method in both accuracy and computation speed.
1. Introduction
Spectral reflectance images can be used for color reproduction, medical diagnosis, and agricultural inspection [1,2,3,4,5,6,7,8,9,10]. Direct measurement using an imaging spectrometer is costly [11,12]. As an indirect measurement method, using a camera to estimate spectral reflectance is low cost [13,14,15,16]. Methods for estimating the spectral reflectance from camera signals are critical for improving measurement accuracy and detection speed. The methods can be based on basis spectra [17,18,19,20], Wiener estimation [14,21,22], regression [23,24,25,26,27,28], and interpolation [29,30,31,32,33,34]. The basis-spectrum methods assume that the target spectrum to be reconstructed is a linear combination of the basis spectra derived from training samples. The weighting coefficients for the basis spectra are solved from simultaneous equations describing camera signals. Regression and Wiener estimation methods build a transformation matrix from training samples to the convert the low-dimensional camera signals to the high-dimensional spectral reflectance. The interpolation method uses the neighboring reference spectra in camera signal space to interpolate the target spectrum. Since the basis spectra and transformation matrix are derived from all training samples, the estimation accuracy using the interpolation method can be higher than the other three methods.
For example, the authors of [29,30,31,32,33,34] showed that the interpolation method can be more accurate than two basis-spectrum methods, principal component analysis (PCA) [17,18], and nonnegative matrix transformation [19,20]. The interpolation method can still be more accurate even compared to the enhanced basis-spectrum methods [30,31,32,33,34]. The enhanced methods use the basis spectra that emphasize the relationship between the target and training samples at the expense of computation time [18,20]. Due to the use of a look-up table (LUT) to store the reference spectra, the interpolation method is often called the LUT method [29]. The LUT method is computationally two orders of magnitude faster than the enhanced basis-spectrum methods [31,33].
Using the LUT method, a simplex mesh in signal space is built from reference samples. The simplex enclosing the target sample is located. The reference samples of the simplex vertices are used to interpolate the target sample. If the target sample is outside the convex hull of the reference samples in signal space, it cannot be interpolated and must be extrapolated instead. The target sample is called an outside sample to distinguish it from the samples inside the convex hull [30,31,32,33,34]. The extrapolation problem limits the usability of the LUT method. The authors of [33] proposed the auxiliary reference samples (ARSs) to extrapolate the outside samples. The results showed that the extrapolation error utilizing the ARSs is lower than other extrapolation methods in [31,32].
The spectral reflectance image is reconstructed pixel-by-pixel using the methods in [17,18,19,20,21,22,23,24,25,26,27,29,30,31,32,33,34], i.e., the spectrum of a pixel is reconstructed from the camera signals of the pixel. For example, the authors of [32] showed spectral reflectance images reconstructed using the LUT method. The regression method using a deep-learning neural network can reconstruct spectral reflectance images taking into account the spatial structure of the image [28]. This approach is attractive, although the reconstructed spectra are shown to be less accurate in color [26].
Indirect measurement methods using cameras share common limitations compared to direct measurement methods using imaging spectrometers. (1) Illuminant-dependent training/reference samples are required. An optimal set of training/reference samples for one set of test samples may not be optimal for another. Therefore, field applications require proper selection of the training/reference samples [35]. One of the most suitable applications for indirect methods is the recovery of spectral reflectance in industrial products and artworks, where the spectral properties of the illuminant and pigments are known. (2) The accuracy of the reconstructed spectra is limited by the number of camera channels.
A conventional tricolor camera has three channels available, where the Bayer color filter array (CFA) is used to improve the spatial resolution, as shown in Figure 1a. One unit cell of the Bayer CFA includes one red, two green, and one blue square filters. Since the accuracy of the reconstructed spectrum increases with the number of signal channels, the use of a quadcolor camera and the LUT method to improve the estimation accuracy was investigated [34]. The CFA of the quadcolor camera is compatible with the Bayer CFA, as shown in Figure 1b, and the demosaicing algorithm also can be applied. In Figure 1b, one green filter on the Bayer CFA unit cell is modified as the white square. The quadcolor camera was found to be effective in improving the estimation accuracy, even when the fourth channel did not use a color filter. However, for the quadcolor camera, the computation time using the LUT method is approximately doubled compared to the weighted PCA (wPCA) method, although the mean spectrum reconstruction error is smaller [34]. The wPCA method is an enhanced basis-spectrum method [18]. The LUT method is time-consuming for the quadcolor camera because locating a simplex in 4D signal space is computationally two orders of magnitude slower than locating a simplex in 3D signal space.
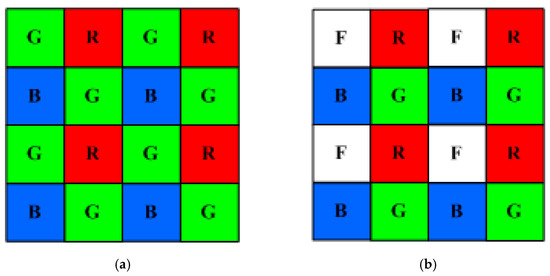
Figure 1.
Schematic diagrams showing (a) Bayer color filter array and (b) modified Bayer color filter array.
A spectrum reconstruction method is irradiance-independent if the irradiance on the target sample is multiplied by a factor, and the spectral power density of the reconstructed spectrum is multiplied by the same factor. Interpolation in the signal space is irradiance-dependent, since the reconstructed spectrum shape depends on the sample irradiance. The irradiance-dependent LUT (ID-LUT) method is suitable for reconstructing the spectrum under the condition that the target sample and the reference samples have the same irradiance [29,30,31,32,33,34]. In field applications, the illuminant brightness may vary over time and the irradiance varies with the distance between the target sample and the illuminant. Therefore, an irradiance-independent LUT (II-LUT) method is needed. Basis-spectrum methods can be irradiance-independent but must equivalently use one signal channel to represent the sample irradiance. Since the number of signal channels is equivalently reduced by one, using an irradiance-independent basis-spectrum method, the error in reconstructing the spectrum shape of the target sample may increase compared to the corresponding irradiance-dependent method.
This paper proposes an II-LUT method for spectrum reconstruction. This method interpolates the spectrum shape and luminance of the target sample in the normalized signal space using the normalized reference spectra. A tricolor and a quadcolor camera were taken as example cameras. Since the normalized signal space is 3D, the computation time of the II-LUT method for the quadcolor camera is slightly longer than that of the ID-LUT method in 3D for the tricolor camera. Reference and test samples prepared using the Munsell color chips were used as examples. The illuminant was D65. It was found that for the considered quadcolor camera, the mean recovered spectral reflectance error of the test samples using the II-LUT method was slightly larger than that of the test samples using the ID-LUT method without considering the irradiance variation. Therefore, using the proposed method has the advantages of irradiance independence and computation time saving, but at the cost of the increase in the mean error. The results were compared to the irradiance-dependent wPCA (ID-wPCA) and irradiance-independent wPCA (II-wPCA) methods.
The organization of this paper is as follows. Section 2.1, Section 2.2, Section 2.3 describe the considered camera spectral sensitivities, color samples, and the assessment metrics for the recovered spectral reflectance, respectively. Section 3.1, Section 3.2, Section 3.3, Section 3.4 describe the ID-wPCA, II-wPCA, ID-LUT, and II-LUT methods, respectively. Section 3.5 briefly introduces the extrapolation method for the ID-LUT and II-LUT methods. Section 4.1 shows the effect of the irradiance variation on the spectrum reconstruction using the ID-LUT and ID-wPCA methods. Section 4.2 shows the numerical results using the II-LUT and II-wPCA methods. A camera color device model (CDM) converts camera signals to tristimulus values. Section 4.3 compares the II-LUT method with the irradiance-independent color device model (II-CDM) [36] to predict the tristimulus values from the camera signals. Section 5 gives the conclusions. For ease of reference, the Abbreviations section lists the abbreviations defined herein in alphabetical order.
2. Materials and Assessment Metrics
2.1. Camera Spectral Sensitivities
In this paper, spectra were sampled from 400–700 nm in step of 10 nm. The spectrum is represented by the vector S = [S(400 nm), S(410 nm), …, S(700 nm) ]T, where S(λ) is the spectral amplitude at wavelength λ; and the subscript T denotes the transpose operation. The number of sampling wavelengths Mw = 31.
The Nikon D5100 and RGBF cameras considered in [34] were taken as the tricolor and quadcolor camera examples, respectively. The red (R), green (G), and blue (B) channels of the RGBF camera were assumed to be the same as the Nikon D5100 camera, their spectral sensitivity vectors are designated as SCamR, SCamG, and SCamB, respectively [37]. The spectral sensitivity vector of the fourth channel of the RGBF camera is designated as SCamF and was assumed to be the product of the spectral sensitivity of a typical silicon sensor [38] and the spectral transmittance of a Baader UV/IR cut filter. The fourth channel is a greenish yellow channel and is designated as the F channel due to being free of color filter.
A color filter can be applied to the fourth channel to modify its spectral sensitivity. However, for simplicity, the RGBF camera without the color filter was considered. Taking the RGBF camera as the quadcolor camera example does not lose the generality of the proposed irradiance independent method.
2.2. Color Samples
The color samples were taken the same as in [33,34]. Samples were prepared using reflectance spectra of matt Munsell color chips measured with a spectroradiometer [39], where 1268 reflectance spectra were used. Illuminant D65 was assumed to be the light source. The same 202 and 1066 color chips in [33,34] were chosen for preparing the reference/training and test samples, respectively. The reference samples for the LUT methods and the training samples for the wPCA methods were the same.
The reflection spectrum vector from a color chip can be calculated as
where SRef and SD65 are the spectral reflectance vector of the color chip and the spectrum vector of the illuminant D65, respectively; and the operator is the element-wise product. The maximum spectral power density of the spectrum SD65 used to prepare reference samples and test samples were assumed to be 1 and SMax, respectively.
where ΔITest is the deviation of the irradiance. The value of ΔITest was set to be zero unless otherwise specified. The color points of light reflected from the 1268 Munsell color chips in the CIELAB color space have been shown in [33]. This paper adopted the CIE 1931 color matching functions.
SMax = 1 + ΔITest,
Under the white balance condition, the spectral sensitivity vector and signal value of a signal channel of the RGBF camera are DCamU = SCamU/(SWhiteSD65)TSCamU and U = SReflectionTDCamU, respectively, for U = R, G, B, and F; and SWhite is the spectral reflectance vector of a white card. The same white card in [28,29] was taken, which is the white side of a Kodak gray card. Figure 2 shows the vectors DCamR, DCamG, DCamB, and DCamF. The vector representing the camera signals is designated as C = [R, G, B]T and [R, G, B, F]T for the D5100 and RGBF cameras, respectively. The color points of reflection spectra from Munsell color chips in the RGB and RGBF signal spaces have been shown in [33,34], respectively.
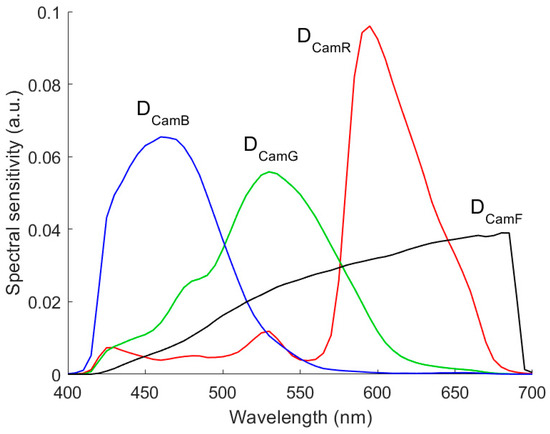
Figure 2.
The spectral sensitivities of red (DCamR), green (DCamG), blue (DCamB), and F (DCamF) channels of the RGBF camera under the white balance condition.
2.3. Assessment Metrics
For a given test signal vector, the methods to reconstruct the reflection light spectrum are shown in Section 3. The spectral reflectance vector SRefRec can be calculated as the reconstructed reflection spectrum vector SRec divided by the D65 spectrum vector SD65 element by element. The same metrics in [33,34] were used to assessment the reconstructed results. They are briefly described below. The root mean square (RMS) error ERef and goodness-of-fit coefficient GFC were used to assess the reconstructed spectral reflectance vector SRefRec, where ERef = (|SRefRec – SRef|2/Mw)1/2, GFC = |SRefRecTSRef|/|SRefRec| |SRef| and |·| stands for the norm operation. CIEDE2000 ΔE00 was used to assess the color difference between SRec and SReflection. The spectral comparison index (SCI), which represents an index of metamerism, was also used to assess the reconstructed results [40], where the parameter k = 1 in the formula for calculating SCI shown in [40].
The values of ERef, ΔE00 and SCI are the smaller the better. The mean μ, standard deviation σ, 50th percentile PC50, 98th percentile PC98, and maximum MAX of the three metrics were calculated. The value of GFC is the larger the better. The mean μ, standard deviation σ, 50th percentile PC50, and minimum MIN of the metric GFC were calculated. If GFC > 0.99, the spectral curve shape is well fitted [32,41]. The ratio of samples with GFC > 0.99 was calculated. This ratio of good fit is designated as RGF99.
3. Methods
The details of the ID-LUT and ID-wPCA methods have been described in [33,34]. The following sections briefly describe them in order to compare them with II-wPCA and II-LUT methods. The ID-LUT and II-LUT methods are described by taking the RGBF camera as an example.
3.1. The ID-wPCA Method
The training samples were used to derive the principal components using the PCA method [42]. The signal vector of the test sample was assumed to be
The first three and four principal components were used as the basis spectra to reconstruct the spectrum for the tricolor and quadcolor cameras, respectively. If the reconstructed spectrum has negative values, the value is set to zero.
The wPCA method is the same as the PCA method shown above, except that the training samples were weighted according to the sample to be reconstructed [18,34]. A training sample was multiplied by a weighting factor ΔEi −γ, where ΔEi is the color difference between the test sample and the i-th training sample in CIELAB color space; and γ is a constant. Basis spectra were derived from the weighted training samples. If γ =0, the wPCA method becomes the PCA method. The value of γ is usually set to 1.0 [18,33]. The value of γ was optimized for the minimum mean ERef of the test samples for individual camera in this paper. The third-order root polynomial regression model (RPRM) was used to convert signal values to tristimulus values to calculate ΔE [36]. This model was trained using the training samples.
3.2. The II-wPCA Method
The II-wPCA method is the same as the ID-wPCA method, except that the signal vector and reconstructed reflection spectrum vector are
Compared to Equations (3) and (4), in Equations (5) and (6), C0 and P0 are multiplied by the coefficient d0; and the upper limit of the summation index is modified from NC to NC –1 so that the coefficients d0 and dk, k = 1, 2, …, NC –1, can be solved from Equation (5).
The reconstruction spectrum can be written as Equation (4), since it was assumed that the irradiance of the training samples and test samples are the same. If the irradiance of the test sample is different from the training samples, the coefficient d0 needs to be used to represent the change in the irradiance.
3.3. The ID-LUT Method
Reference samples were used to generate the simplex mesh. Simplices are triangles and tetrahedra in 2D and 3D signal spaces, respectively. The simplex in 4D signal space is beyond imagination. The number of vertices of a simplex is NC +1. The simplex enclosing the vector C in the signal space was located. The signal vector of the test sample was assumed to be
where Ck is the k-th signal vectors of the reference samples at the vertices of the simplex enclosing the signal vector C in the signal space; the coefficient αk is the barycentric coordinate describing the location of the color point in the simplex and
If the color point of C is inside the simplex, 0 < αk < 1. The coefficients αk, k = 1, 2, …, NC +1, were solved from Equations (7) and (8). The reconstructed reflection spectrum vector is
where Sk is the reference spectrum vector corresponding to the k-th vertex.
If a signal vector is outside the convex hull of the simplex mesh, it cannot be interpolated and must be extrapolated. The convex hull of reference samples cannot be plotted due to its 4D geometry for the RGBF camera. The number of outside samples is 340. These outside samples in the RGB, GBF, BFR, and FRG signal space were shown in [34]. The extrapolation of the outside samples is described in Section 3.5.
For the case that the irradiance is increased by a factor of κ, the signal vector C in Equation (7) becomes κC. However, due to the constraint Equation (8), the reconstructed spectrum SRec in Equation (9) does not become κSRec. In addition, since the location of the test sample in the signal space varies with the factor κ, the simplex enclosing C may vary accordingly. Therefore, this interpolation method is irradiance-dependent.
3.4. The II-LUT Method
The II-LUT method is similar to the ID-LUT method. The test sample was interpolated in the normalized signal space, where a signal component is normalized to the sum of all signal components. For example, the normalized signals for the RGBF camera are
r = R/(R + G + B + F),
g = G/(R + G + B + F),
b = B/(R + G + B + F),
The normalized signal vector is defined as c = [r, g, b]T. Normalized reference samples were used to generate the simplex mesh. The simplex is a tetrahedron for the RGBF camera because the dimension of the normalized signal vector is one less than the signal vector.
The simplex enclosing the vector c in the normalized signal space was located. The number of vertices of the simplex is NC. The normalized signal vector of the test sample was assumed to be
where ck is the k-th signal vector of the normalized reference samples at the vertices of the simplex enclosing the signal vector c in the normalized signal space; the coefficient βk is the barycentric coordinate describing the location of the color point in the simplex and
If the color point of c is inside the simplex, 0 < βk < 1. The coefficients βk, k = 1, 2, …, NC, were solved from Equations (13) and (14).
The normalized reconstructed reflection spectrum vector is
where Nk is the normalized reference spectrum vector corresponding to the k-th vertex and
where Sk is the k-th reference spectrum Sk for k = 1, 2, …, NC; and DCamT = DCamR + DCamG + DCamB + DCamF. Note that SkTDCamT = Rk + Gk + Bk + Fk, where Rk, Gk, Bk, and Fk are the signal values of the k-th vertex. The same normalization factor was used for the signal values and spectra. The reconstructed spectrum is
where uy = [(400 nm),(410 nm), …,(700 nm)]T is the vector representing the color matching function ; Y is the interpolated Y stimulus value, calculated as
and Yk is the Y stimulus value of the k-th vertex.
Nk = Sk/SkTDCamT,
SRec = YNRec/NRecTuy ,
ηk = (R+G+B+F)/ (Rk+Gk+Bk+Fk),
For the case where the irradiance is multiplied by a factor, the corresponding color coordinate vector c remains unchanged, and the spectral shape of test sample NRec in Equation (15) also remains unchanged. Therefore, this interpolation method is irradiance-independent.
Substituting Equations (15), (16) and (18) into Equation (17), the reconstruction spectrum can be written as
In summary, there are five steps to interpolate the test sample using the II-LUT method, where the flow chart is shown in Figure 3.
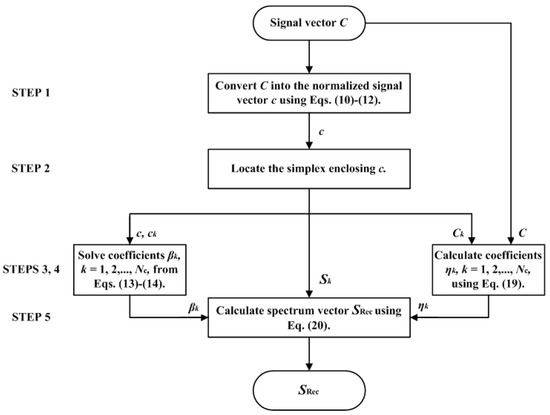
Figure 3.
Flow chart to interpolate the test sample using the II-LUT method.
- STEP 1: Convert the signal vector C of the test sample into the normalized signal vector c.
- STEP 2: Locate the simplex enclosing the vector c in the normalized signal space.
- STEP 3: Solve the coefficients βk, k = 1, 2, …, NC, from Equations (13) and (14).
- STEP 4: Calculate the coefficients ηk, k = 1, 2, …, NC, according to Equation (19).
- STEP 5: Calculate the reconstruction spectrum SRec according to Equation (20).
From either Equation (13) or Equation (20), the following equation can be derived
where C and Ck are the signal vectors corresponding to c and ck, respectively. It seems that Equations (21) and (20) are similar to Equations (7) and (9), respectively, but the vertices are chosen in a different way, the number of reference spectra is reduced by one, and the reference spectra are weighted differently.
Figure 4a shows the color points of the reference samples, inside samples and outside samples in the rgb normalized signal space for the RGBF camera with red, green, and blue dots, respectively. Figure 4b is the same as Figure 4a except for viewing angle. The convex hull of the reference samples is shown in Figure 5a,b, where the viewing angles are the same as those in Figure 4a,b, respectively. As can be seen from Figure 4a,b, most of the reference and test samples lie almost in a plane. Therefore, the shape of some tetrahedra generated from the reference samples is “thin”. The solutions to the coefficients in Equations (13) and (14) are unique. Since the coefficients are the barycentric coordinates describing the location of a point in the tetrahedron, each coefficient varies between 0 and 1 even for a “thin” tetrahedron.
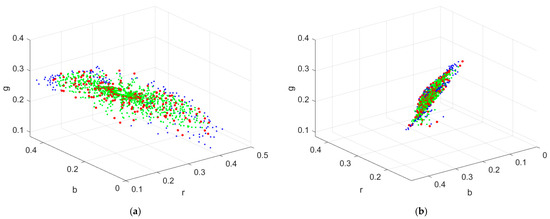
Figure 4.
(a) Color points of the reference samples, inside samples, and outside samples in the rgb normalized signal space with red, green, and blue dots, respectively, where the camera is the RGBF camera. (b) The same as (a) except for viewing angle.
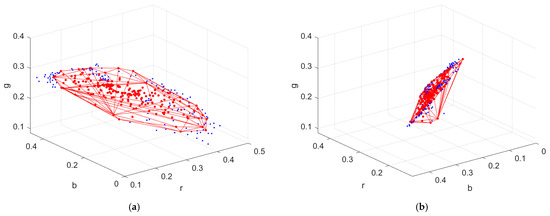
Figure 5.
(a) The convex hull of the reference samples in the rgb normalized signal space for the RGBF camera. Reference and outside samples are shown with red and blue dots, respectively. (b) The same as (a) except for viewing angle.
If a signal vector is outside the convex hull of the tetrahedral mesh, it cannot be interpolated and must be extrapolated. The number of outside samples for the RGBF camera is 131, which are shown with blue dots in Figure 5a,b. The method to extrapolate outside samples is described in Section 3.5. Since the samples were projected from the 4D signal space to the 3D signal space, the number of outside samples was reduced from 340 using the ID-LUT method to 131 using the II-LUT method.
3.5. Extrapolation
The outside samples of the ID-LUT and II-LUT methods were extrapolated using the reference samples and ARSs. ARSs are measured using appropriately selected color filters and color chips so that they are highly saturated. The color filters are called the ARS filters. The extrapolation process is the same as the interpolation method shown in Section 3.3 and Section 3.4 but using the expanded reference samples including the ARSs. The same cyan, magenta, yellow, red, green, and blue ARS filters and reference color chips as in [34] were adopted to extrapolate the cases using the D5100 and RGBF cameras. All outside samples can be extrapolated using the ID-LUT and II-LUT methods utilizing the reference samples and ARSs.
The convex hull of the ARSs in RGBF signal space cannot be plotted due to its 4D geometry. The number of the ARSs in the convex hull is 126. The color points of these ARSs in the RGB, GBF, BFR, and FRG signal space were shown in [34]. Figure 6a,b show the convex hull of the ARSs in the RGB normalized signal space at different viewing angles. The black sample is not used as an ARS for extrapolation using the II-LUT method. The number of the ARSs in the convex hull is 30. The convex hull of the reference samples in the RGB normalized signal space is also shown in red in Figure 6a,b for comparison. We can see that the convex hull of the ARSs is expanded compared to the convex hull of the reference samples.
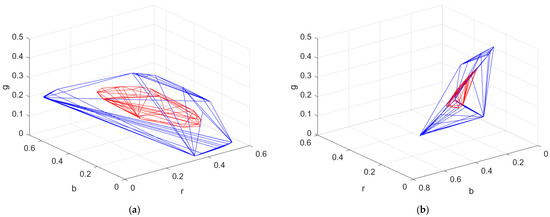
Figure 6.
(a) The convex hull of the ARSs in the rgb normalized signal space for the RGBF camera. The convex hull of the reference samples is shown in red for comparison. (b) The same as (a) except for viewing angle.
4. Results and Discussion
4.1. Irradiance Dependent Spectrum Reconstruction
To show the effect of the irradiance variation on the spectrum reconstruction using the RGBF camera and the ID-LUT method, Figure 7a shows the target spectra of test samples SReflection and the reconstructed spectra SRec for the cases with the irradiance deviation ΔITest = −0.3, −0.15, 0, 0.15, 0.3. In Figure 7a, the color chip used for preparing the test sample is 5Y 8.5/8 in Munsell annotation; outside samples are indicated with “*”. Figure 7b is the same as Figure 7a, except that the color chip is 10P 7/8. The test samples in Figure 7a,b are inside sample and outside sample, respectively, when ΔITest = 0. As the ΔITest value changes, an inside sample may become an outside sample, and vice versa. From Figure 7a,b , it can be seen that the amplitude of the reconstructed spectra SRec increases with the irradiance deviation ΔITest, but the spectrum shape changes with the irradiance deviation ΔITest. The effect of the irradiance variation on the spectrum reconstruction can be clearly seen from Figure 7a,b.
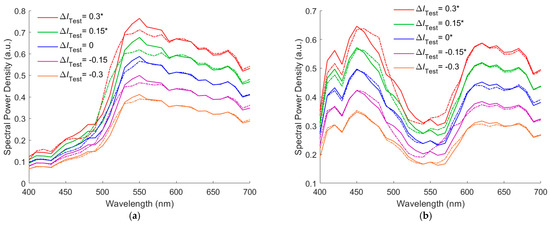
Figure 7.
(a) Target spectrum SReflection (solid line) and the reconstructed spectra SRec (dashed line) for the cases with the irradiance deviation ΔITest = −0.3, −0.15, 0, 0.15, and 0.3, where the RGBF camera and the ID-LUT method are used. The test sample is prepared using the 5Y 8.5/8 color chip. (b) The same as (a) except that the color chip is 10P 7/8. Outside sample are indicated with “*” in the legend.
Figure 8a,b show the recovered spectral reflectance SRefRec for the cases shown in Figure 7a,b, respectively, where the illuminant spectrum vector of the correct amplitude was used to calculate the SRefRec from the SRec. Outside samples are indicated with “*” in the figures. In Figure 8a, the RMS error ERef = 0.0165, 0.0237, 0.0175, 0.0350, and 0.0301 for the cases of ΔITest = −0.3, −0.15, 0, 0.15, 0.3, respectively. In Figure 8b, ERef = 0.0171, 0.0282, 0.0108, 0.0141, and 0.0229 for the cases of ΔITest = −0.3, −0.15, 0, 0.15, 0.3, respectively.
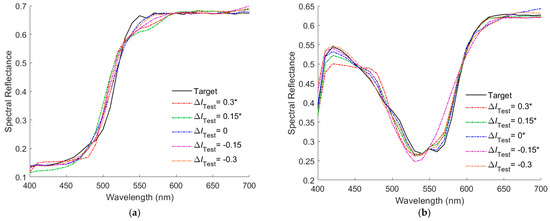
Figure 8.
(a,b) showing the target reflectance spectra and the recovered reflectance spectra for the cases in Figure 7a,b, respectively. Outside samples are indicated with “*” in the legend.
Figure 9a,b show the ERef value versus the ΔITest value for the test samples prepared with the color chips 5Y 8.5/8 and 10P 7/8, respectively. The two color chips were used in Figure 8a,b. For the case in Figure 9a, when ΔITest > 0.058, the test sample became the outside sample. For the case in Figure 9b, when ΔITest < −0.154, the test sample became the inside sample. Figure 9a,b show the zigzag variation of the ERef value. Around a turn point in the figure, different simplices in RGBF signal space were used for interpolation/extrapolation. The green circles in Figure 9a,b represent the change of the located simplex as the ΔITest value increases. Figure 9a,b also show the cases using the ID-wPCA method with the optimized γ = 1.2. Using the ID-wPCA method, the ERef value varies continuously with the ΔITest value.
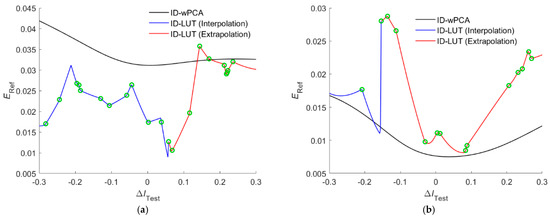
Figure 9.
RMS error ERefRec value versus the ΔITest value using the ID-LUT and ID-wPCA methods. The camera is the RGBF camera. The test samples are prepared using the (a) 5Y 8.5/8 and (b) 10P 7/8 color chips. Green circles show the change of the located simplex as the ΔITest value increases.
The ID-LUT method can be used to accurately recover spectral reflectance without irradiance deviation (ΔITest =0). However, due to its irradiance dependence, the ID-LUT method may not be suitable for field applications where the irradiance of the test sample differs from that of the reference sample, as shown above.
4.2. Irradiance Independent Spectrum Reconstruction
Section 4.2.1 and Section 4.2.2 show the results using the RGBF camera and the II-LUT method. Section 4.2.3 shows the results using the RGBF camera and the II-wPCA method. Section 4.2.4 shows the results for the D5100 camera using the II-LUT and II-wPCA methods. The deviation ΔITest = 0 was assumed, since the ΔITest value does not affect the spectral shape reconstructed using the II-LUT and II-wPCA methods. If the examples shown in Figure 7a,b are reconstructed using the II-LUT method; the reconstructed spectra are identical except for the amplitude. Although the spectral shape of the recovered reflectance is also independent of the ΔITest value, its amplitude depends on the amplitude of the illuminant spectrum vector. The issue of measuring/estimating the amplitude of the illuminant spectrum vector is beyond the scope of this paper. Irradiance on 2D objects can be easily measured/estimated, but not on 3D objects. However, at least the relative spectral reflectance can be reconstructed using the II-LUT method, which can be useful if properly calibrated. In this section, the recovered spectral reflectance was calculated using the illuminant spectrum vector of the correct amplitude.
Spectrum reconstruction using the ID-LUT and ID-wPCA methods for the RGBF and D5100 cameras have been considered in [34], where the issue of irradiance deviation was not considered, i.e., ΔITest = 0 was assumed. The spectrum reconstruction results using the ID-LUT and ID-wPCA method shown in [34] are given below for comparison. However, for the results shown, the reconstruction error using the ID-LUT and ID-wPCA method may increase in practice due to the irradiance deviation, as shown in Section 4.1.
4.2.1. Using the RGBF Camera and the II-LUT Method: Examples of Reconstructed Spectra
Figure 10a–d show the normalized reconstructed spectra NRec of the light reflected from the 5Y 8.5/8, 10P 7/8, 2.5R 4/12, 2.5G 7/6, 10BG 4/8, and 5PB 4/12 color chips, respectively, using the RGBF camera and the II-LUT method. In Figure 10a–d, the normalized target spectrum NReflection and neighboring reference spectra are also shown, where NReflection = SReflection / (R + G + B + F) according to the same normalization definition in Equation (16) and the reflection spectrum SReflection is defined in Equation (1). The color chips 5Y 8.5/8 and 10P 7/8 are the same as those used in Figure 8a,b, respectively. The cases in Figure 10a,b are interpolation examples. The cases in Figure 10c–f are extrapolation examples. For the cases in Figure 10c–f, the number of referenced ARSs is 1, 1, 1, and 2, respectively. The normalized ARS neighborhood is indicated with “*” in the figures. Except for the case in Figure 10f, the spectra were reconstructed well. For the cases shown in Figure 10a–f, Table 1 shows the values of the coefficient βk defined in Equation (13), where the maximum βk value is shown in bold and the βk value corresponding to the normalized ARS neighborhood is indicated with “*”. For the cases in Figure 10c–f, the main contribution to the normalized reconstructed spectra NRec comes from the normalized reference sample. However, for the cases in Figure 10c,f, the contribution of the normalized ARS neighborhood to the NRec is not negligible because of its larger βk value as shown in Table 1.
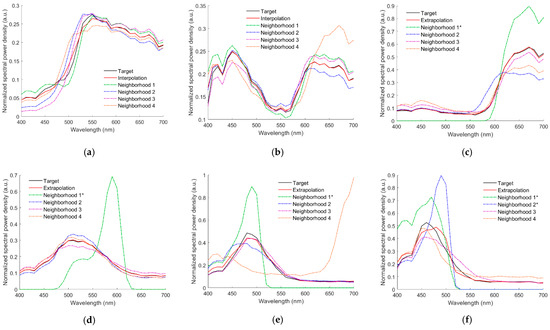
Figure 10.
Normalized target spectrum NReflection, reconstructed spectra NRec, and neighboring reference spectra using the RGBF camera and II-LUT method. Munsell annotations of the color chips are (a) 5Y 8.5/8, (b) 10P 7/8, (c) 2.5R 4/12, (d) 2.5G 7/6, (e) 10BG 4/8, and (f) 5PB 4/12, respectively. Normalized ARS neighborhood is indicated with “*” in the legend.

Table 1.
Munsell annotation of color chip and the βk value in Equation (13) for the cases shown in Figure 10a–f. The maximum βk value is shown in bold. The βk value corresponding to the normalized ARS neighborhood is indicated with “*”.
The recovered spectral reflectance SRefRec for the cases in Figure 10a–f are shown in Figure 11a–f, respectively, which also show the cases using the ID-LUT method for comparison. Table 2 shows the ERef and ΔE00 values for the cases shown in Figure 11a–f. For the cases shown, the spectral reflectance can be better recovered using the ID-LUT method except for the cases in Figure 11c,f. However, the reconstruction error using the ID-LUT method may increase due to the irradiance deviation. Figure 9a,b show the error increase for the cases shown in Figure 11a,b, respectively.
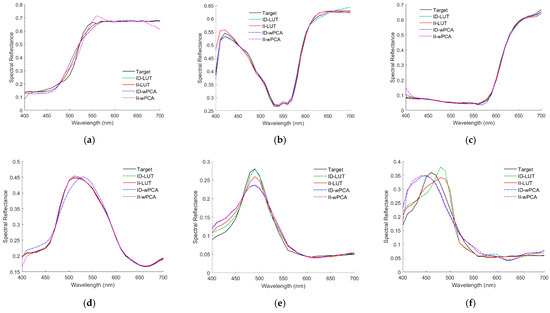
Figure 11.
(a–f) showing the target spectra SRef and recovered reflectance spectra SRefRec for the cases in Figure 10a,b, respectively. The spectrum reconstruction methods are shown in figures.

Table 2.
The ERef and ΔE00 values for the cases shown in Figure 11a–f. The best values are shown in bold.
4.2.2. Using the RGBF Camera and the II-LUT Method: Assessment Metric Statistics
Table 3 shows the assessment metric statistics for the test samples using the ID-LUT and II-LUT methods with the RGBF camera. The number of outside samples is 340 and 131 for the ID-LUT and II-LUT methods, respectively. The reduction in the number of outside samples using the II-LUT method is due to the projection of color samples from 4D RGBF space to 3D rgb space. It can be seen from Table 3 that the mean ERef values using the ID-LUT method for all samples, inside samples, and outside samples were 0.0089, 0.0077, and 0.0115, respectively; the mean ERef values using the II-LUT method for all samples, inside samples, and outside samples were 0.0093, 0.0089, and 0.0119, respectively. The mean error of the outside samples was larger than that of the inside samples. Compared to the ID-LUT method, the mean ERef values using the II-LUT method for all samples, inside samples, and outside samples were increased by 4.2%, 16.2%, and 2.8%, respectively. Note that when using the II-LUT method, 340 − 131 = 209 outside samples in RGBF space became inside samples in rgb space. Therefore, the error increase ratio was higher for the inside samples.

Table 3.
Assessment metric statistics for the test samples using the ID-LUT and II-LUT methods, where the camera is the RGBF camera.
The increase in the mean ERef of the test samples was slight. The mean GFC values of test samples using the ID-LUT and II-LUT methods were almost the same. Surprisingly, the mean ΔE00 and SCI values of test samples using the II-LUT were reduced compared to the ID-LUT method. The improvement in the mean ΔE00 and SCI values using the II-LUT method is due to the smaller color difference error of the inside samples.
Figure 12a–d show the ERef, GFC, ΔE00, and SCI histograms for the test samples, respectively, where the ID-LUT and II-LUT methods were used. It can be seen from the figures that for bins with small ERef, ΔE00, and SCI values, the number of counts using the II-LUT method was higher than that using the ID-LUT method. For bins with large ERef, ΔE00, and SCI values, the number of counts using the II-LUT method was also higher than that using the ID-LUT method. On average, the performance using the ID-LUT method and II-LUT method was about the same.
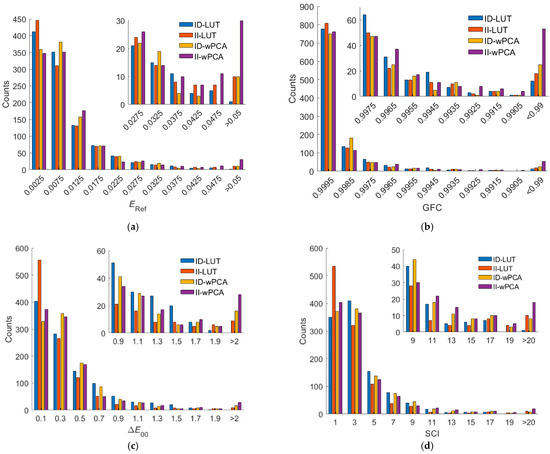
Figure 12.
(a) ERef, (b) GFC, (c) ΔE00, and (d) SCI histograms for the 1066 test samples. The camera is the RGBF camera. The spectrum reconstruction methods are shown in figures. The insets show enlarged parts.
4.2.3. Using the RGBF Camera and the II-wPCA Method
For the RGBF camera, the spectral reflectance SRefRec recovered from the light reflected from the color chips in Figure 10a–f using the ID-wPCA and II-wPCA methods are also shown in Figure 11a–f, respectively. The optimized γ = 1.2 and 1.4 for the ID-wPCA and II-wPCA methods, respectively. Table 2 also shows the ERef and ΔE00 values for the cases using the ID-wPCA and II-wPCA methods. For the cases shown, the spectral reflectance can be recovered better using the II-LUT method compared to the II-wPCA method, except for the case in Figure 11b. From Table 2, it can be seen that in the cases of Figure 11a,b,d, the spectral reflectance can be better recovered using the II-wPCA method compared to the ID-wPCA method, although the basis spectra is one less. However, the performance assessment of the method should refer to the statistical results.
Table 4 shows the assessment metric statistics for the test samples using the ID-wPCA and II-wPCA methods with the RGBF camera. The inside and outside samples using the wPCA methods are the same as the corresponding LUT methods, although the wPCA methods can be used to reconstruct all test samples. Since the number of basis spectra is one less, the mean ERec of the test samples using the II-wPCA method is larger than the ID-wPCA method. It can be seen from Table 4 that the mean ERef values using the ID-wPCA method for all samples, inside samples, and outside samples were 0.0095, 0.0080, and 0.0127, respectively; the mean ERef values using the II-wPCA method for all samples, inside samples and outside samples were 0.0129, 0.0119, and 0.020, respectively. The mean error of the outside samples is larger than the inside samples due to extrapolation [33,34]. Compared to the ID-wPCA method, the mean ERef values using the II-wPCA method for all samples, inside samples and outside samples were increased by 36.2%, 49.3%, and 58.1%, respectively.

Table 4.
Assessment metric statistics for the test samples using the ID-wPCA and II-wPCA methods, where the camera is RGBF camera.
As can be seen from Table 4, the ratio of good fit RGF99 for the outside samples decreased from 0.9382 using the ID-wPCA method to 0.855 using the II-wPCA method. Using the II-wPCA method, 14.5% of the outside samples had GFC values less than 0.99. The maximum ERef, ΔE00 and SCI values were significantly increased using the II-wPCA method compared to the ID-wPCA method. Figure 12a–d also show the assessment metric histograms using the ID-wPCA and II-wPCA methods with the RGBF camera. The results show that the performance using the II-wPCA was severely degraded compared to the ID-wPCA method. However, the spectrum reconstruction error using the ID-wPCA method may increase due to the irradiance deviation, as shown for the examples in Figure 9a,b.
As can be seen from Table 3 and Table 4, for all assessment metric statistics, the II-LUT method outperformed the II-wPCA method. Compared to the II-wPCA method, the mean ERef values of test samples using the II-LUT method was reduced by 28.0%. The PC98 and MAX values of ERef using the II-LUT method were significantly smaller than those using the II-wPCA method. The ratio of good fit RGF99 for the outside samples using the II-LUT method remained high.
4.2.4. Using the D5100 Camera
Table 5 shows the assessment metric statistics for the test samples using the ID-LUT and II-LUT methods with the D5100 camera. The II-LUT method for the RGB camera is the same as for the RGBF camera shown in Section 3.4, except that the dimension of signal space is reduced from 3 to 2 and the normalized signals are r = R/(R+G+B) and g = G/(R+G+B). The number of outside samples is 202 and 63 for the ID-LUT and II-LUT methods, respectively.

Table 5.
Assessment metric statistics for the test samples using the ID-LUT and II-LUT methods, where the camera is the D5100 camera.
It can be seen from Table 5 that the mean ERef values using the ID-LUT method for all samples, inside samples, and outside samples were 0.0131, 0.0120, and 0.0180, respectively; the mean ERef values using the II-LUT method for all samples, inside samples, and outside samples were 0.0179, 0.0170, and 0.0314, respectively. Compared to the ID-LUT method, the mean ERef values using the II-LUT method for all samples, inside samples, and outside samples were increased by 36.3%, 42.2%, and 74.6%, respectively. The ratio of good fit RGF99 for the outside samples decreased from 0.9208 using the ID-LUT method to 0.8413 using the II-LUT method. Using the II-LUT method, 15.87% of the outside samples had GFC values less than 0.99. As shown in Section 4.2.2, the mean spectrum reconstruction error using the ID-LUT and II-LUT methods was about the same for the RGBF camera. Compared to the ID-LUT method for the D5100 camera, the mean spectrum reconstruction error using II-LUT was significantly increased. For the case with the D5100 camera and the II-LUT method, the use of two normalized signals was not sufficient to reconstruct the spectra well. Using the II-LUT method, the mean ERef with the D5100 camera was approximately double that with the RGBF camera.
Table 6 shows the assessment metric statistics for the test samples using the ID-wPCA and II-wPCA methods with the D5100 camera. The optimized γ = 1.7 and 1.6 for the ID-wPCA and II-wPCA methods, respectively. The inside and outside samples using the wPCA methods are the same as the corresponding LUT methods. As expected, the mean ERec value of the test samples using the II-wPCA method was larger than that using the ID-wPCA method.

Table 6.
Assessment metric statistics for the test samples using the ID-wPCA and II-wPCA methods, where the camera is the D5100 camera.
It can be seen from Table 6 that the mean ERef values using the ID-wPCA method for all samples, inside samples, and outside samples were 0.0121, 0.0110, and 0.0169, respectively; the mean ERef values using the II-wPCA method for all samples, inside samples, and outside samples were 0.0186, 0.0164, and 0.0527, respectively. Compared to the ID-wPCA method, the mean ERef values using the II-wPCA method for all samples, inside samples, and outside samples were increased by 53.76%, 49.95%, and 212.2%, respectively. The ratio of good fit RGF99 for the outside samples decreased from 0.8713 using the ID-wPCA method to 0.6349 using the II-wPCA method. Using the II-wPCA method, 36.51% of the outside samples had GFC values less than 0.99. Compared to the ID-wPCA method, the maximum ERef, ΔE00 and SCI values were significantly increased using the II-wPCA method. For the case with the D5100 camera and the II-wPCA method, the use of two basis spectra was not sufficient to reconstruct the spectra well.
Figure 13a–d show the assessment metric histograms using the ID-LUT, II-LUT, ID-wPCA, and II-wPCA methods with the D5100 camera. For bins with large ERef, ΔE00, and SCI values, the number of counts using the irradiance independent method (II-LUT or II-wPCA method) method is much higher than that using the irradiance dependent method (ID-LUT or ID-wPCA method). The results show that the performance using the irradiance independent method was severely degraded compared to the irradiance dependent method.
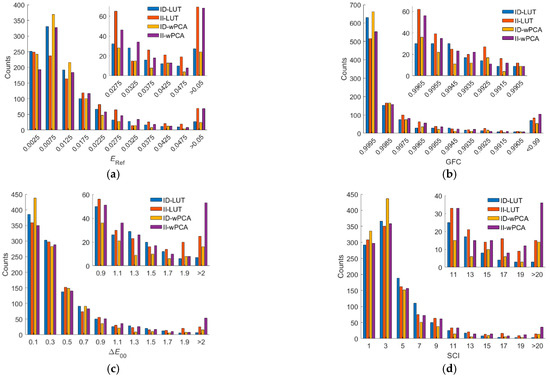
Figure 13.
(a) ERef, (b) GFC, (c) ΔE00, and (d) SCI histograms for the 1066 test samples. The camera is the D5100 camera. The corresponding spectrum reconstruction methods are shown in figures. The insets show enlarged parts.
4.2.5. Computation Time Comparison
All programs in this paper were implemented in MATLAB (version R2021a, MathWorks). The MATLAB functions “delaunay” and “pointLocation” were used to generate the simplex mesh and locate the simplex in 2D or 3D space, respectively [33]. The MATLAB functions “delaunayn” and “tsearchn” were used to generate the simplex mesh and locate the simplex in 4D space, respectively, because the MATLAB functions “delaunay” and “pointLocation” do not support dimensions greater than 3 [34]. On the Windows 10 platform, the computation time required to reconstruct the spectral reflectance vector SRefRec from the signal vector C using the D5100 camera and the ID-LUT method is taken as the reference unit time.
Using the D5100 camera, the ratio of the computation time required to use the ID-LUT method, the II-LUT method, the ID-wPCA method, and the II-wPCA method was 1: 1.33: 51.6: 51.4. Using the II-LUT method takes a longer time than the ID-LUT method. In [33], the ratio of the computation time required to use the ID-LUT method and the ID-wPCA method was 1: 80.2. Due to the improvement of the program code of the wPCA method, the computation speed using the wPCA method in this work is faster than our previous work in [33].
Using the RGBF camera, the ratio of the computation time required to use the ID-LUT method, the II-LUT method, the ID-wPCA method, and the II-wPCA method was 108.9: 1.52: 53.7: 53.3. The computation speed using the II-LUT method was 108.9/1.52 = 71.6 times faster than the ID-LUT method. The computation speed using the II-LUT method was 53.3/1.52 = 35.1 times faster than the II-wPCA method.
4.3. Irradiance Independent Color Device Model (II-CDM)
In the wPCA methods, RPRM was used to convert the camera signals to the tristimulus values for calculating the weighting factors. RPRM is a popular II-CDM in which the converted tristimulus values increase linearly with irradiance [36]. The ΔE00 statistics presented in Table 3, Table 4, Table 5 and Table 6 show the performance of predicting the tristimulus values for the test samples using the II-LUT and II-wPCA methods. The II-LUT and II-wPCA methods can also be used as II-CDMs, although they require more computation time compared to RPRM. The II-wPCA method is not suitable as II-CDM because the computation is time-consuming and the PC98 and MAX values of ΔE00 are large, as shown in Table 4 and Table 6. However, it is interesting to compare the ΔE00 statistics using the II-LUT method and RPRM.
Since the reconstructed spectrum using the II-LUT method can be written as Equation (20), the tristimulus vector T = [X, Y, Z]T of the test sample can be written as
where Tk is tristimulus vector of the k-th reference sample. Equation (18) is the stimulus Y component of Equation (22). The II-LUT method can be modified to II-CDM by Equation (22), called II-LUT-CDM, as shown below. The procedure to convert the camera signals to the tristimulus values is the same as the five-step procedure of the II-LUT method shown in Section 3.4 except for the STEP 5. STEP 5 of II-LUT-CDM uses Equation (22) to calculates the tristimulus values. Using II-LUT-CDM, Table 3 and Table 5 show the ΔE00 statistics for the RGBF and D5100 cameras, respectively; Figure 12c and Figure 13c show the ΔE00 histograms for the RGBF and D5100 cameras, respectively.
Table 7 shows the ΔE00 statistics for test samples using the third-order RPRM. In Table 7, the cases using the D5100 and RGBF cameras are shown, where the RGB and RGBF signal values were used as variables for regression, respectively. For both cases, the optimized root polynomial order is 3. The mean ΔE00 value using the RGBF camera is smaller than the mean using the D5100 camera. Using RPRM, Figure 14a,b show the ΔE00 histograms for the RGBF and D5100 cameras, respectively, where the results using II-LUT-CDM are also shown for comparison.

Table 7.
Color difference ΔE00 statistics for the test samples using the third-order RPRM, where the cases with the D5100 and RGBF cameras are shown.
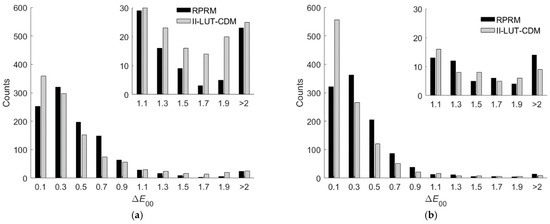
Figure 14.
The ΔE00 histograms for the 1066 test samples using the (a) D5100 camera and (b) RGBF camera. The corresponding camera device models are shown in figures. The insets show enlarged parts.
As can be seen from the ΔE00 statistics shown in Table 3, Table 5, and Table 7, the prediction accuracy was improved using the RGBF camera compared to the D5100 camera. For the D5100 camera, the prediction accuracy using II-LUT-CDM was slightly better than RPRM. For the RGBF camera, the prediction accuracy using II-LUT-CDM was significantly better than RPRM. For the “ΔE00 = 0.1” bins shown in Figure 14a,b, the number of counts using II-LUT-CDM is larger than that using RPRM. For the “ΔE00 > 2” bin shown in Figure 14b, the number of counts using II-LUT-CDM is smaller than that using RPRM.
Note from Table 7 that using RPRM, the PC98 and MAX values of ΔE00 for the outside samples are very large. The test sample is called an outside sample because it cannot be enclosed using the training samples in the signal space, as shown in [33,34]. Therefore, using RPRM to predict the tristimulus values of the outside samples is extrapolation. Extrapolation using polynomial regression is notoriously unreliable, as is the root polynomial regression. It was found that if the ARSs were included in the training samples of RPRM, the prediction accuracy was not better.
4.4. Reconstruction of Spectral Reflectance Images
The II-LUT method was used to reconstruct spectral reflectance images using the RGBF camera. Test images were prepared using multispectral images from the open-source CAVE dataset representing the spectral reflectance of the materials in the scene [43]. Image values for the CAVE dataset are 16-bit unsigned integers computed from multispectral images measured with a tunable filter. The value of a pixel varies with the actual irradiance on the pixel. Since the CAVE dataset does not provide pixel irradiance, test images were prepared assuming a maximum spectral reflectance of 0.9 and uniform illumination using the illuminant D65. The value of 0.9 is approximately the maximum spectral reflectance of the Munsell color chips. The reference/training samples were the same as in the previous sections.
Figure 15a–f show six test images cropped from the CAVE sample images to remove the background, which are (a) “watercolors”, (b) “oil painting”, (c) “egyptian statue”, (d) “flowers”, (e) “cloth”, and (f) “face”. The cropped image resolutions of Figure 15a–f are (a) 483 × 375, (b) 369 × 483, (c) 204 × 439, (d) 483 × 381, (e) 449 × 511, and (f) 218 × 300. Nearly black pixels were removed from the test images due to the low signal-to-noise ratio (SNR) at the time of measurement and the low spectral reflectance accuracy in the CAVE dataset. Most of the removed pixels are black backgrounds and shadows.
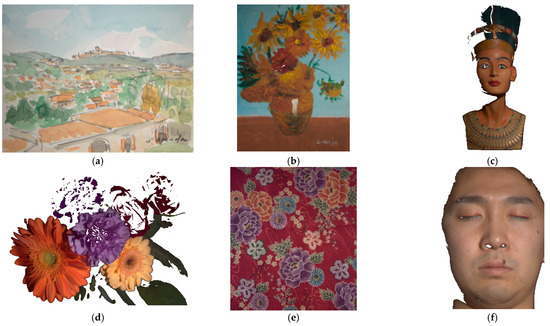
Figure 15.
Test images: (a) “watercolors”, (b) “oil painting”, (c) “egyptian statue”, (d) “flowers”, (e) “cloth”, and (f) “face”. Nearly black pixels were removed. The white dots near the center of (b) indicate red-yellow pixels that cannot be extrapolated using the II-LUT method.
Table 8 shows the assessment metric statistics for the spectral reflectance images reconstructed from the test images in Figure 15a–f using the II-LUT method and RGBF camera, where the number of image pixels considered are shown. A total of 66 red-yellow pixels near the center of Figure 15b (“oil painting”) cannot be extrapolated due to high saturation, which are shown in white dots and were not included in the statistics in Table 8. These 66 pixels could be extrapolated utilizing the appropriate additional ARSs. Table 9 is the same as Table 8 except that the II-wPCA method was used. Since the reference/training samples were not prepared to meet the characteristics of the materials in the scene, the assessment metric statistics shown in Table 8 and Table 9 are worse than those shown in Table 3 and Table 4, respectively.

Table 8.
Assessment metric statistics for the test images in Figure 15a–f using the II-LUT method and RGBF camera.

Table 9.
Assessment metric statistics for the test images in Figure 15a–f, using the II-wPCA method and RGBF camera.
Compared with the mean ERef value of 0.0093 in Table 3, using the II-LUT method, the mean ERef values for the “watercolors”, “oil painting”, “egyptian statue”, “flowers”, “cloth” and “face” images are 1.99, 1.65, 0.97, 2.02, 2.55, and 2.63 times, respectively. The 202 Munsell color chips used to prepare the reference/training samples lack spectral reflectance samples for skin. Note that some pixels on the forehead, nose, and cheeks have reflected glare as shown in Figure 15f. The spectral reflectance recovery of such pixels is poor.
The mean ERef values for the “oil painting”, “egyptian statue”, “flowers”, and “cloth” images using the II-wPCA method are roughly the same as using the II-LUT method. The mean ERef value for the “watercolors” image using the II-wPCA is significantly larger than using the II-LUT method. The mean ERef value for the “face” image using the II-wPCA is significantly smaller than using the II-LUT method. Note that the maximum values of the ERef, ΔE00, and SCI metrics are significantly large when using the II-wPCA method, as shown in Table 4 and Table 9. For the II-wPCA method, the value of the coefficient dk solved from Equation (5) can be very large, while for the II-LUT method, the value of the coefficient βk solved from Equations (13) and (14) is restricted to be between 0 and 1.
In Table 8 and Table 9, better mean metric values using the II-LUT method compared to the II-wPCA method are shown in bold and vice versa. Using the II-LUT method compared to the II-wPCA method, the mean ERef values for the “watercolors” and “cloth” images are smaller; the mean GFC, ΔE00, and SCI values for the “watercolors”, “flowers”, and “cloth” images are better.
The metric map of the test images is used to show the spatial distribution of the assessment metric values. Using the II-LUT method and RGBF camera, Figure 16a–f show the ERef maps for the test images in Figure 15a–f, respectively. Pixel ERef values greater than 0.05 are set to 0.05. Figure 17a–f are the same as Figure 16a–f, respectively, except that the II-wPCA method was used. For the ERef maps of the “watercolors” and “cloth” images, using the II-LUT method is significantly better than using the II-wPCA method. For the ERef map of the “face” image, using the II-LUT method is worse than using the II-wPCA method.
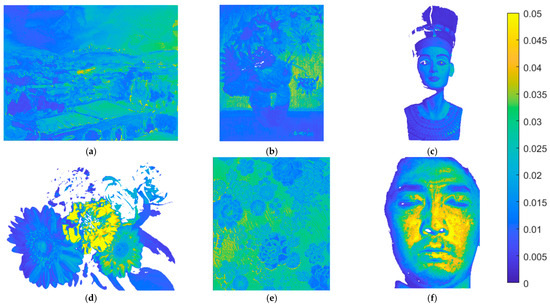
Figure 16.
(a–f) showing the ERef maps for the test images in Figure 15a–f, respectively, using the II-LUT method and RGBF camera. Pixel ERef values greater than 0.05 are set to 0.05.
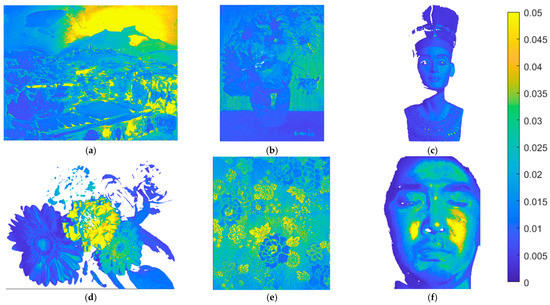
Figure 17.
(a–f) showing the ERef maps for the test images in Figure 15a–f, respectively, using the II-wPCA method and RGBF camera. Pixel ERef values greater than 0.05 are set to 0.05.
Using the II-LUT method and RGBF camera, Figure 18a–f show the ΔE00 maps for the test images in Figure 15a–f, respectively. Pixel ΔE00 values greater than 5.0 are set to 5.0. Figure 19a–f are the same as Figure 18a–f, respectively, except that the II-wPCA method was used. For the ΔE00 maps of the “watercolors” and “cloth” images, using the II-LUT method is significantly better than using the II-wPCA method. For the ΔE00 map of the “face” image, using the II-LUT method is worse than using the II-wPCA method.
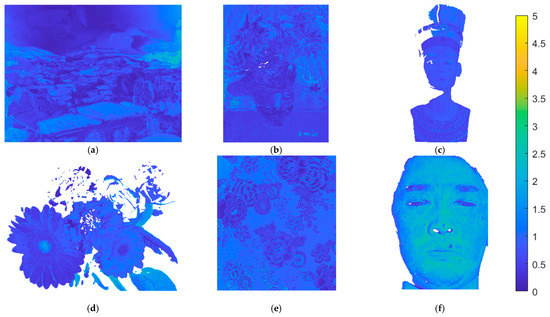
Figure 18.
(a–f) showing the ΔE00 maps for the test images in Figure 15a–f, respectively, using the II-LUT method and RGBF camera. Pixel ΔE00 values greater than 5.0 are set to 5.0.
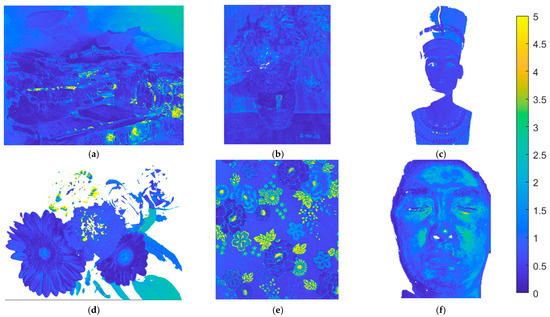
Figure 19.
(a–f) showing the ΔE00 maps for the test images in Figure 15a–f, respectively, using the II-wPCA method and RGBF camera. Pixel ΔE00 values greater than 5.0 are set to 5.0.
The above results show that, as expected, the selection of reference/training samples is crucial for the spectrum reconstruction using the II-LUT and II-wPCA methods. The selection of the 202 reference samples was not optimized for the test images. However, the mean spectrum reconstruction error using the II-LUT method was low or moderate for most image pixels, except for the “face” image and the purple flower for the “flowers” image. Using the II-LUT method avoids the large error situation of using the II-wPCA method.
Several examples of recovering spectral reflectance from the test images are shown below. Figure 20a is the original image (“flowers”) of Figure 15d without removing nearly black pixels. The white circle in the upper left corner is on the black background. Figure 21a shows the spectral reflectance of the pixel in the center of the white circle. From the spectral reflectance, the black background appears to be a dark purple. However, it will be shown that this spectral reflectance is an error, possibly due to the low SNR as previously described. The centers of other seven white circles in Figure 20a are taken as example pixels. Figure 20b–f show enlarged images of deep purple, red, orange, purple, and yellow flowers, respectively. Enlarged images of the leaf examples at the lower right of Figure 20a are shown in Figure 22a,d.


Figure 20.
(a) Original image of Figure 15d. (b–f) showing enlarged images on the deep purple, red, orange, purple and yellow flowers in (a), respectively. The center of the white circle was an example pixel showing the recovered spectral reflectance, except for the white circle in the upper left corner.
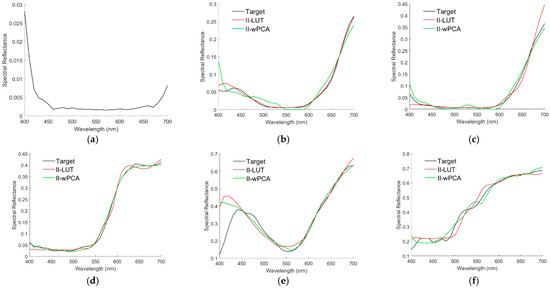
Figure 21.
(a–f) showing the target spectral reflectance of the pixel at the center of the white circle in Figure 20a–f, respectively. (b–f) also show the recovered spectral reflectance using the II-LUT and II-wPCA methods.


Figure 21b–f show the target spectral reflectance and recovered spectral reflectance using the II-LUT and II-wPCA methods in the center of the white circles in Figure 20b–f, respectively. The recovered spectral reflectance agrees with the target well, except for the purple example at short wavelengths in Figure 21e. The assessment metric values for these examples are shown in Table 10, where GFC values greater than 0.99 are shown in bold. Using the II-LUT method, GFC > 0.99 for all examples except the case in Figure 21e. Using the II-wPCA method, GFC > 0.99 for all examples except those in Figure 21b,e.

Table 10.
Assessment metric values for the cases in Figure 21b–f. GFC values greater than 0.99 are shown in bold.
Using the II-LUT and II-wPCA methods, Figure 23a,d show the target spectral reflectance and recovered spectral reflectance at the center of the white circles in Figure 22a,d, respectively. Note that the values of target spectral reflectance might be smaller than the actual value because the image values of the CAVE dataset are not calibrated according to the actual irradiance as previously described. Spectral reflectance was not well recovered in both short and long wavelength regions. The spectral reflectance in the 400–460 nm region in Figure 23a,d is almost the same as that of the black background in Figure 21a. Furthermore, the spectral reflectance at 400 nm should be much smaller than that at 550 nm due to the chlorophyll absorption [44]. Therefore, the target spectral reflectance in the short wavelength region in Figure 23a,d is an error. The sharp rise in spectral reflectance near 700 nm is due to the high reflection of leaves in the near IR [44]. This spectral reflectance characteristic is not included in the 202 reference Munsell color chips.
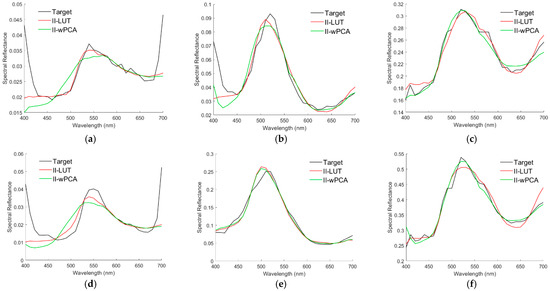
Figure 23.
(a–f) showing the target spectral reflectance of the pixel at the center of the white circle in Figure 22a–f, respectively, where the recovered spectral reflectance using the II-LUT and II-wPCA methods are shown.
It is interesting to compare the spectral reflectance of the leaves in the “flowers”, “oil painting”, and “watercolors” images. Figure 23b,c,e,f show the target spectral reflectance for the center pixel of the white circle in Figure 22b,c,e,f, respectively, where the spectral reflectance recovered using the II-LUT and II-wPCA methods are shown. The recovered spectral reflectance agrees with the target well, except for the short wavelength region in Figure 23b. The spectral reflectance in Figure 23b is less than 0.1. The shape of the spectral reflectance in the 400–460 nm region in Figure 23b is almost the same as that in Figure 21a. This case further validates that the spectral reflectance in the short wavelength region in Figure 21a and Figure 23 a,b,d is erroneous. The spectral reflectance in Figure 23e is larger, and there is no erroneous spectral reflectance in the short wavelength region. Since the pixels corresponding to Figure 21a and Figure 23a,d are from the same test image, black compensation is performed using the image values of the case in Figure 21a to eliminate the erroneous spectral reflectance. The image value of the case in Figure 21a is subtracted from the image values of the cases in Figure 23a,d. Figure 24a,b are the Figure 23a,d, respectively, except for the black compensation.
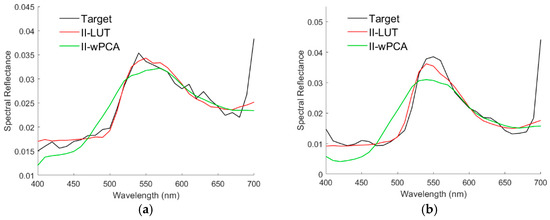
The assessment metric values of the examples in Figure 23a–f are shown in Table 11, where the values for the black-compensated cases in Figure 24a,b are also shown. GFC values greater than 0.99 are shown in bold. Using the II-LUT and II-wPCA methods, GFC > 0.99 for the cases in Figure 23c,e,f and Figure 24a. Note that the peak spectral reflectance of leaves is at about 550 nm [44]. Table 12 shows the peak spectral reflectance wavelength for leaves in the “flowers”, “oil painting, “watercolors” images, which also shows the peak wavelengths of the spectral reflectance recovered using the II-LUT and II-wPCA methods. The wavelength resolution of the CAVE image data is 10 nm. As can be seen from Table 12, except for the oil painting leaf in Figure 23e, the error of the predicted peak wavelength using the II-LUT method is less than 10 nm. Except for the real leaf in Figure 23a and Figure 24a and the oil painting leaf in Figure 23e, the error of the predicted peak wavelength using the II-wPCA method is also less than 10 nm. This result might help identify whether the leaves are real or fake from the camera signals.


Table 12.
Peak spectral reflectance wavelengths of leaves in the “flowers”, “oil painting, “watercolors” images, where the corresponding figures are indicated. Values for the black-compensated cases in Figure 24a,b are also shown, where the data column is denoted by “*”. Wavelengths are in unit of nm. Using the II-LUT and II-wPCA methods, predicted peak wavelengths with errors greater than 10 nm are shown in bold.
As the results shown in Figure 21b–f and Figure 24a,b, since spectral reflectance can be recovered well using the 202 reference Munsell color chips, a more accurate spectral reflectance recovery can be achieved using another set of reference samples suitable for vegetation. The use of the II-LUT method and multicolor cameras to evaluate vegetation properties is promising.
5. Conclusions
The reconstruction of the spectrum from camera signals was numerically investigated. Conventional LUT method interpolates the spectrum in the signal space. This is an irradiance-dependent LUT (ID-LUT) method because the shape of the reconstructed spectrum shape depends on the sample irradiance. An irradiance-independent LUT (II-LUT) method was proposed, which interpolates the shape and luminance of the reconstructed spectrum in the normalized signal space. The application of this method to recover the surface spectral reflectance using a camera was numerically investigated. The Nikon D5100 and RGBF cameras were taken as the tricolor and quadcolor camera examples, respectively. Munsell color chips were taken as reflective surface examples, where 202 and 1066 color chips were used to prepare reference and test samples, respectively, under D65 illuminant. The results are summarized below.
- 1.
- RGBF Camera:
For the RGBF camera, reconstructing the spectra of test samples using the II-LUT method uses one less reference sample than the ID-LUT method. If the irradiance of the test and reference samples is the same, the mean reconstruction error using the II-LUT method was larger than that of the ID-LUT method. Compared to the ID-LUT method, the mean spectrum reconstruction error of the test samples using the II-LUT method was increased by 4.2%. Considering that the irradiance variation will introduce additional error, the mean spectrum reconstruction error using the II-LUT method could be smaller than the ID-LUT method in practice. Therefore, it is better to use the II-LUT method, which can not only reduce the spectrum reconstruction error, but also achieve irradiance independence. In addition to the advantage of irradiance independence, the computation speed using the II-LUT method is much faster than the ID-LUT method. For the case of using the RGBF camera, the ID-LUT and II-LUT methods interpolate the spectrum in 4D signal space and 3D normalized signal space, respectively. To interpolate the considered examples, locating a tetrahedron in 3D space is computationally two orders of magnitude faster than locating a simplex in 4D space.
- 2.
- D5100 Camera:
For the D5100 camera, the mean spectrum reconstruction error of test samples using the II-LUT method was increased by 36.3% compared to the ID-LUT method. The increase in mean error is significant because the number of reference samples used to reconstruct the spectrum of the test sample is only 3, which was not enough to reconstruct the spectra well. For the case of using the RGBF camera, the number of reference samples used to reconstruct the spectrum of the test sample is 4, and the reconstruction error was significantly reduced. Using the II-LUT method, the mean spectrum reconstruction error of the test samples reconstructed with the RGBF camera was 48.01% lower than that of the D5100 camera.
- 3.
- Comparison of the II-LUT and II-wPCA methods:
Compared to the irradiance independent wPCA (II-wPCA) method, the mean spectrum reconstruction errors using the II-LUT method were reduced by 3.84% and 28.0% with the D5100 and RGBF cameras, respectively. Using the II-wPCA method, the spectrum reconstruction error may further increase due to the estimation errors of the camera spectral sensitivities in field applications [45,46]. Another disadvantage of using the II-wPCA method is the much slower calculation speed compared to the II-LUT method, since the basis spectra need to be derived for each test sample.
- 4.
- Irradiance independent color device model (II-CDM):
The II-LUT method can be easily modified to an irradiance-independent color device model (II-CDM). Conventional II-CDM is based on root polynomial regression. The II-CDM based on the II-LUT method was found to be more accurate than the root polynomial regression-based II-CDM for the examples considered but required the measurement of auxiliary reference samples. The application of the II-LUT method in II-CDM requires further study.
- 5.
- Reconstruction of spectral reflectance images
The selection of reference/training samples is crucial for the spectrum reconstruction. Although the reference samples were not selected for the considered test images, the mean spectrum reconstruction error using the II-LUT method was low or moderate for most image pixels, except for some special cases. Reflected glare should be avoided when capturing images to recover spectral reflectance.
Using the conventional tricolor camera and the ID-LUT method for spectrum reconstruction has the advantages of no need to measure/estimate camera spectral sensitivity functions, fast detection speed, high spatial resolution, and low cost. Using the conventional tricolor camera and the II-LUT method has the additional advantage of irradiance independence, but the spectrum reconstruction error increases significantly. The spectrum reconstruction error can be effectively reduced using the quadcolor camera, where its color filter array is compatible with the conventional tricolor camera in demosaicing. For the examples considered, using the RGBF camera and the II-LUT method has the additional advantages of irradiance independence and fast computation speed, while the spectrum reconstruction error was slightly increased compared to using the ID-LUT method.
Although the spectral sensitivities of the two example cameras are based on the D5100 camera except for the F channel of the RGBF camera, the proposed II-LUT method can generally be applied to the cameras with other spectral sensitivity characteristics. Further studies are required to implement the proposed method for field application. One possible implementation of the quadcolor camera is to use the dual cameras built into commercially available smartphones, one of which is a conventional tricolor camera and the other a monochrome camera, such as the Huawei P9 smartphone. The monochrome camera is usually used to enhance image resolution and reduce noise. With the dual cameras, we have the RGB signals from the tricolor camera and the F signal from the monochrome camera, but care must be taken with the pixel alignment of the two cameras.
Author Contributions
Conceptualization, Y.-C.W. and S.W.; Data collection, Y.-C.W.; Methodology, Y.-C.W. and S.W.; Software, Y.-C.W.; Data analysis, Y.-C.W.; Supervision, L.H. and S.C. Writing—original draft, Y.-C.W. and S.W.; Writing—review and editing, L.H. and S.C. All authors have read and agreed to the published version of the manuscript.
Funding
This research received no external funding.
Institutional Review Board Statement
Not applicable.
Informed Consent Statement
Not applicable.
Data Availability Statement
1. Spectral sensitivities of the Nikon D5100 camera are available: http://spectralestimation.wordpress.com/data/. 2. Spectral reflectance of matt Munsell color chips are available: https://sites.uef.fi/spectral/munsell-colors-matt-spectrofotometer-measured/. 3. Spectral transmittance of the UV/IR cut filter is available: https://agenaastro.com/downloads/manuals/baader-uvir-cut-filter-stat-sheet.pdf. 4. CAVE multispectral dataset is available: https://www1.cs.columbia.edu/CAVE/databases/multispectral/. All are accessed on 21 October 2022.
Conflicts of Interest
The authors declare no conflict of interest.
Abbreviations
| Abbreviation | Definition |
| ARS | Auxiliary Reference Sample |
| CDM | Color Device Model |
| CFA | Color Filter Array |
| CMF | Color-Matching Function |
| GFC | Goodness-of-Fit Coefficient |
| ID-LUT | Irradiance-Dependent Look-Up Table |
| ID-wPCA | Irradiance-Dependent Weighted Principal Component Analysis |
| II-CDM | Irradiance-Independent Color Device Model |
| II-LUT | Irradiance-Independent Look-Up Table |
| II-LUT-CDM | Irradiance-Independent Look-Up Table Color Device Model |
| II-wPCA | Irradiance-Independent weighted Principal Component Analysis |
| LUT | Look-Up Table |
| MAX | Maximum |
| MIN | Minimum |
| PC50 | 50th Percentile |
| PC98 | 98th Percentile |
| PCA | Principal Component Analysis |
| RGB | Red, Green, and Blue |
| RGBF | Red, Green, Blue, and Free |
| RGF99 | Ratio of Good Fit (the ratio of samples with GFC > 0.99) |
| RMS | Root Mean Square |
| RPRM | Root Polynomial Regression Model |
| SCI | Spectral Comparison Index |
| SNR | Signal-to-Noise Ratio |
| wPCA | Weighted Principal Component Analysis |
References
- Picollo, M.; Cucci, C.; Casini, A.; Stefani, L. Hyper-spectral imaging technique in the cultural heritage field: New possible scenarios. Sensors 2020, 20, 2843. [Google Scholar] [CrossRef] [PubMed]
- Grillini, F.; Thomas, J.B.; George, S. Mixing Models in Close-Range Spectral Imaging for Pigment Mapping in Cultural Heritage. In Proceedings of the International Colour Association (AIC) Conference, Online, 26–27 November 2020; pp. 338–342. [Google Scholar]
- Candeo, A.; Ardini1, B.; Ghirardello, M.; Valentini, G.; Clivet, L.; Maury, C.; Calligaro, T.; Manzoni, C.; Comelli, D. Performances of a portable Fourier transform hyperspectral imaging camera for rapid investigation of paintings. Eur. Phys. J. Plus 2022, 137, 409. [Google Scholar] [CrossRef]
- Chen, Z.; Wang, J.; Wang, T.; Song, Z.; Li, Y.; Huang, Y.; Wang, L.; Jin, J. Automated in-field leaf-level hyperspectral imaging of corn plants using a Cartesian robotic platform. Comput. Electron. Agric. 2021, 183, 105996. [Google Scholar] [CrossRef]
- Hu, N.; Li, W.; Du, C.; Zhang, Z.; Gao, Y.; Sun, Z.; Yang, L.; Yu, K.; Zhang, Y.; Wang, Z. Predicting micronutrients of wheat using hyperspectral imaging. Food Chem. 2021, 343, 128473. [Google Scholar] [CrossRef] [PubMed]
- Chatelain, P.; Delmaire, G.; Alboody, A.; Puigt, M.; Roussel, G. Semi-automatic spectral image stitching for a compact hybrid linescan hyperspectral camera towards near field remote monitoring of potato crop leaves. Sensors 2021, 21, 7616. [Google Scholar] [CrossRef] [PubMed]
- Gomes, V.; Mendes-Ferreira, A.; Melo-Pinto, P. Application of hyperspectral imaging and deep learning for robust prediction of sugar and pH levels in wine grape berries. Sensors 2021, 21, 3459. [Google Scholar] [CrossRef]
- Weksler, S.; Rozenstein, O.; Haish, N.; Moshelion, M.; Wallach, R.; Ben-Dor, E. Detection of potassium deficiency and momentary transpiration rate estimation at early growth stages using proximal hyperspectral imaging and extreme gradient boosting. Sensors 2021, 21, 958. [Google Scholar] [CrossRef]
- Ma, C.; Yu, M.; Chen, F.; Lin, H. An efficient and portable LED multispectral imaging system and its application to human tongue detection. Appl. Sci. 2022, 12, 3552. [Google Scholar] [CrossRef]
- Ortega, S.; Halicek, M.; Fabelo, H.; Callico, G.M.; Fei, B. Hyperspectral and multispectral imaging in digital and computational pathology: A systematic review. Biomed. Opt. Express. 2020, 11, 3195–3233. [Google Scholar] [CrossRef]
- Schaepman, M.E. Imaging Spectrometers. In The SAGE Handbook of Remote Sensing; Warner, T.A., Nellis, M.D., Foody, G.M., Eds.; Sage Publications: Los Angeles, CA, USA, 2009; pp. 166–178. [Google Scholar]
- Cai, F.; Lu, W.; Shi, W.; He, S. A mobile device-based imaging spectrometer for environmental monitoring by attaching a lightweight small module to a commercial digital camera. Sci. Rep. 2017, 7, 15602. [Google Scholar] [CrossRef]
- Valero, E.M.; Nieves, J.L.; Nascimento, S.M.C.; Amano, K.; Foster, D.H. Recovering spectral data from natural scenes with an RGB digital camera and colored Filters. Color Res. Appl. 2007, 32, 352–360. [Google Scholar] [CrossRef]
- Tominaga, S.; Nishi, S.; Ohtera, R.; Sakai, H. Improved method for spectral reflectance estimation and application to mobile phone cameras. J. Opt. Soc. Am. A 2022, 39, 494–508. [Google Scholar] [CrossRef] [PubMed]
- Liang, J.; Wan, X. Optimized method for spectral reflectance reconstruction from camera responses. Opt. Express 2017, 25, 28273–28287. [Google Scholar] [CrossRef]
- He, Q.; Wang, R. Hyperspectral imaging enabled by an unmodified smartphone for analyzing skin morphological features and monitoring hemodynamics. Biomed. Opt. Express 2020, 11, 895–909. [Google Scholar] [CrossRef] [PubMed]
- Tzeng, D.Y.; Berns, R.S. A review of principal component analysis and its applications to color technology. Color Res. Appl. 2005, 30, 84–98. [Google Scholar] [CrossRef]
- Agahian, F.; Amirshahi, S.A.; Amirshahi, S.H. Reconstruction of reflectance spectra using weighted principal component analysis. Color Res. Appl. 2008, 33, 360–371. [Google Scholar] [CrossRef]
- Hamza, A.B.; Brady, D.J. Reconstruction of reflectance spectra using robust nonnegative matrix factorization. IEEE Trans. Signal Process. 2006, 54, 3637–3642. [Google Scholar] [CrossRef]
- Amirshahi, S.H.; Amirhahi, S.A. Adaptive non-negative bases for reconstruction of spectral data from colorimetric information. Opt. Rev. 2010, 17, 562–569. [Google Scholar] [CrossRef]
- Yoo, J.H.; Kim, D.C.; Ha, H.G.; Ha, Y.H. Adaptive spectral reflectance reconstruction method based on Wiener estimation using a similar training set. J. Imaging Sci. Technol. 2016, 60, 020503. [Google Scholar] [CrossRef]
- Nahavandi, A.M. Noise segmentation for improving performance of Wiener filter method in spectral reflectance estimation. Color Res. Appl. 2018, 43, 341–348. [Google Scholar] [CrossRef]
- Heikkinen, V.; Camara, C.; Hirvonen, T.; Penttinen, N. Spectral imaging using consumer-level devices and kernel-based regression. J. Opt. Soc. Am. A 2016, 33, 1095–1110. [Google Scholar] [CrossRef] [PubMed]
- Heikkinen, V. Spectral reflectance estimation using Gaussian processes and combination kernels. IEEE Trans. Image Process. 2018, 27, 3358–3373. [Google Scholar] [CrossRef] [PubMed]
- Wang, L.; Wan, X.; Xia, G.; Liang, J. Sequential adaptive estimation for spectral reflectance based on camera responses. Opt. Express 2020, 28, 25830–25842. [Google Scholar] [CrossRef]
- Lin, Y.-T.; Finlayson, G.D. On the Optimization of Regression-Based Spectral Reconstruction. Sensors 2021, 21, 5586. [Google Scholar] [CrossRef] [PubMed]
- Liu, Z.; Xiao, K.; Pointer, M.R.; Liu, Q.; Li, C.; He, R.; Xie, X. Spectral reconstruction using an iteratively reweighted regulated model from two illumination camera responses. Sensors 2021, 21, 7911. [Google Scholar] [CrossRef]
- Zhang, J.; Su, R.; Fu, Q.; Ren, W.; Heide, F.; Nie, Y. A survey on computational spectral reconstruction methods from RGB to hyperspectral imaging. Sci. Rep. 2022, 12, 11905. [Google Scholar] [CrossRef]
- Abed, F.M.; Amirshahi, S.H.; Abed, M.R.M. Reconstruction of reflectance data using an interpolation technique. J. Opt. Soc. Am. A 2009, 26, 613–624. [Google Scholar] [CrossRef]
- Kim, B.G.; Han, J.; Park, S. Spectral reflectivity recovery from the tristimulus values using a hybrid method. J. Opt. Soc. Am. A 2012, 29, 2612–2621. [Google Scholar] [CrossRef]
- Kim, B.G.; Werner, J.S.; Siminovitch, M.; Papamichael, K.; Han, J.; Park, S. Spectral reflectivity recovery from tristimulus values using 3D extrapolation with 3D interpolation. J. Opt. Soc. Korea 2014, 18, 507–516. [Google Scholar] [CrossRef][Green Version]
- Chou, T.-R.; Hsieh, C.-H.; Chen, E. Recovering spectral reflectance based on natural neighbor interpolation with model-based metameric spectra of extreme points. Color Res. Appl. 2019, 44, 508–525. [Google Scholar] [CrossRef]
- Wen, Y.-C.; Wen, S.; Hsu, L.; Chi, S. Auxiliary Reference Samples for Extrapolating Spectral Reflectance from Camera RGB Signals. Sensors 2022, 22, 4923. [Google Scholar] [CrossRef] [PubMed]
- Wen, Y.-C.; Wen, S.; Hsu, L.; Chi, S. Spectral reflectance recovery from the quadcolor camera signals using the interpolation and weighted principal component analysis methods. Sensors 2022, 22, 6228. [Google Scholar] [CrossRef] [PubMed]
- Liang, J.; Zhu, Q.; Liu, Q.; Xiao, K. Optimal selection of representative samples for efficient digital camera-based spectra recovery. Color Res. Appl. 2022, 47, 107–120. [Google Scholar] [CrossRef]
- Finlayson, G.D.; Mackiewicz, M.; Hurlbert, A. Color correction using root-polynomial regression. IEEE Trans. Image Process. 2015, 24, 1460–1470. [Google Scholar] [CrossRef]
- Darrodi, M.M.; Finlayson, G.; Goodman, T.; Mackiewicz, M. Reference data set for camera spectral sensitivity estimation. J. Opt. Soc. Am. A 2015, 32, 381–391. [Google Scholar] [CrossRef]
- Mangold, K.; Shaw, J.A.; Vollmer, M. The physics of near-infrared photography. Eur. J. Phys. 2013, 34, S51–S71. [Google Scholar] [CrossRef]
- Kohonen, O.; Parkkinen, J.; Jaaskelainen, T. Databases for spectral color science. Color Res. Appl. 2006, 31, 381–390. [Google Scholar] [CrossRef]
- Viggiano, J.A.S. A perception-referenced method for comparison of radiance ratio spectra and its application as an index of metamerism. Proc. SPIE 2002, 4421, 701–704. [Google Scholar]
- Mansouri, A.; Sliwa, T.; Hardeberg, J.Y.; Voisin, Y. An adaptive-PCA algorithm for reflectance estimation from color images. In Proceedings of the 19th International Conference on Pattern Recognition, Tampa, FL, USA, 8–11 December 2008. [Google Scholar]
- Leon, S. Linear Algebra with Applications, 10th ed.; Pearson: Harlow, UK, 2020. [Google Scholar]
- Yasuma, F.; Mitsunaga, T.; Iso, D.; Nayar, S.K. Generalized assorted pixel camera: Post capture control of resolution, dynamic range, and spectrum. IEEE Trans. Image Process. 2010, 19, 2241–2253. [Google Scholar] [CrossRef]
- Jacquemoud, S.; Ustin, S. Leaf Optical Properties; Cambridge University Press: Cambridge, UK, 2019. [Google Scholar]
- Finlayson, G.; Darrodi, M.M.; Mackiewicz, M. Rank-based camera spectral sensitivity estimation. J. Opt. Soc. Am. A 2016, 33, 589–599. [Google Scholar] [CrossRef]
- Ji, Y.; Kwak, Y.; Park, S.M.; Kim, Y.L. Compressive recovery of smartphone RGB spectral sensitivity functions. Opt. Express 2021, 29, 11947–11961. [Google Scholar] [CrossRef] [PubMed]
Publisher’s Note: MDPI stays neutral with regard to jurisdictional claims in published maps and institutional affiliations. |
© 2022 by the authors. Licensee MDPI, Basel, Switzerland. This article is an open access article distributed under the terms and conditions of the Creative Commons Attribution (CC BY) license (https://creativecommons.org/licenses/by/4.0/).