Ultrasonic Monitoring of the Water Content in Concentrated Water–Petroleum Emulsions Using the Slope of the Phase Spectrum


Abstract
:1. Introduction
2. Experimental Methods
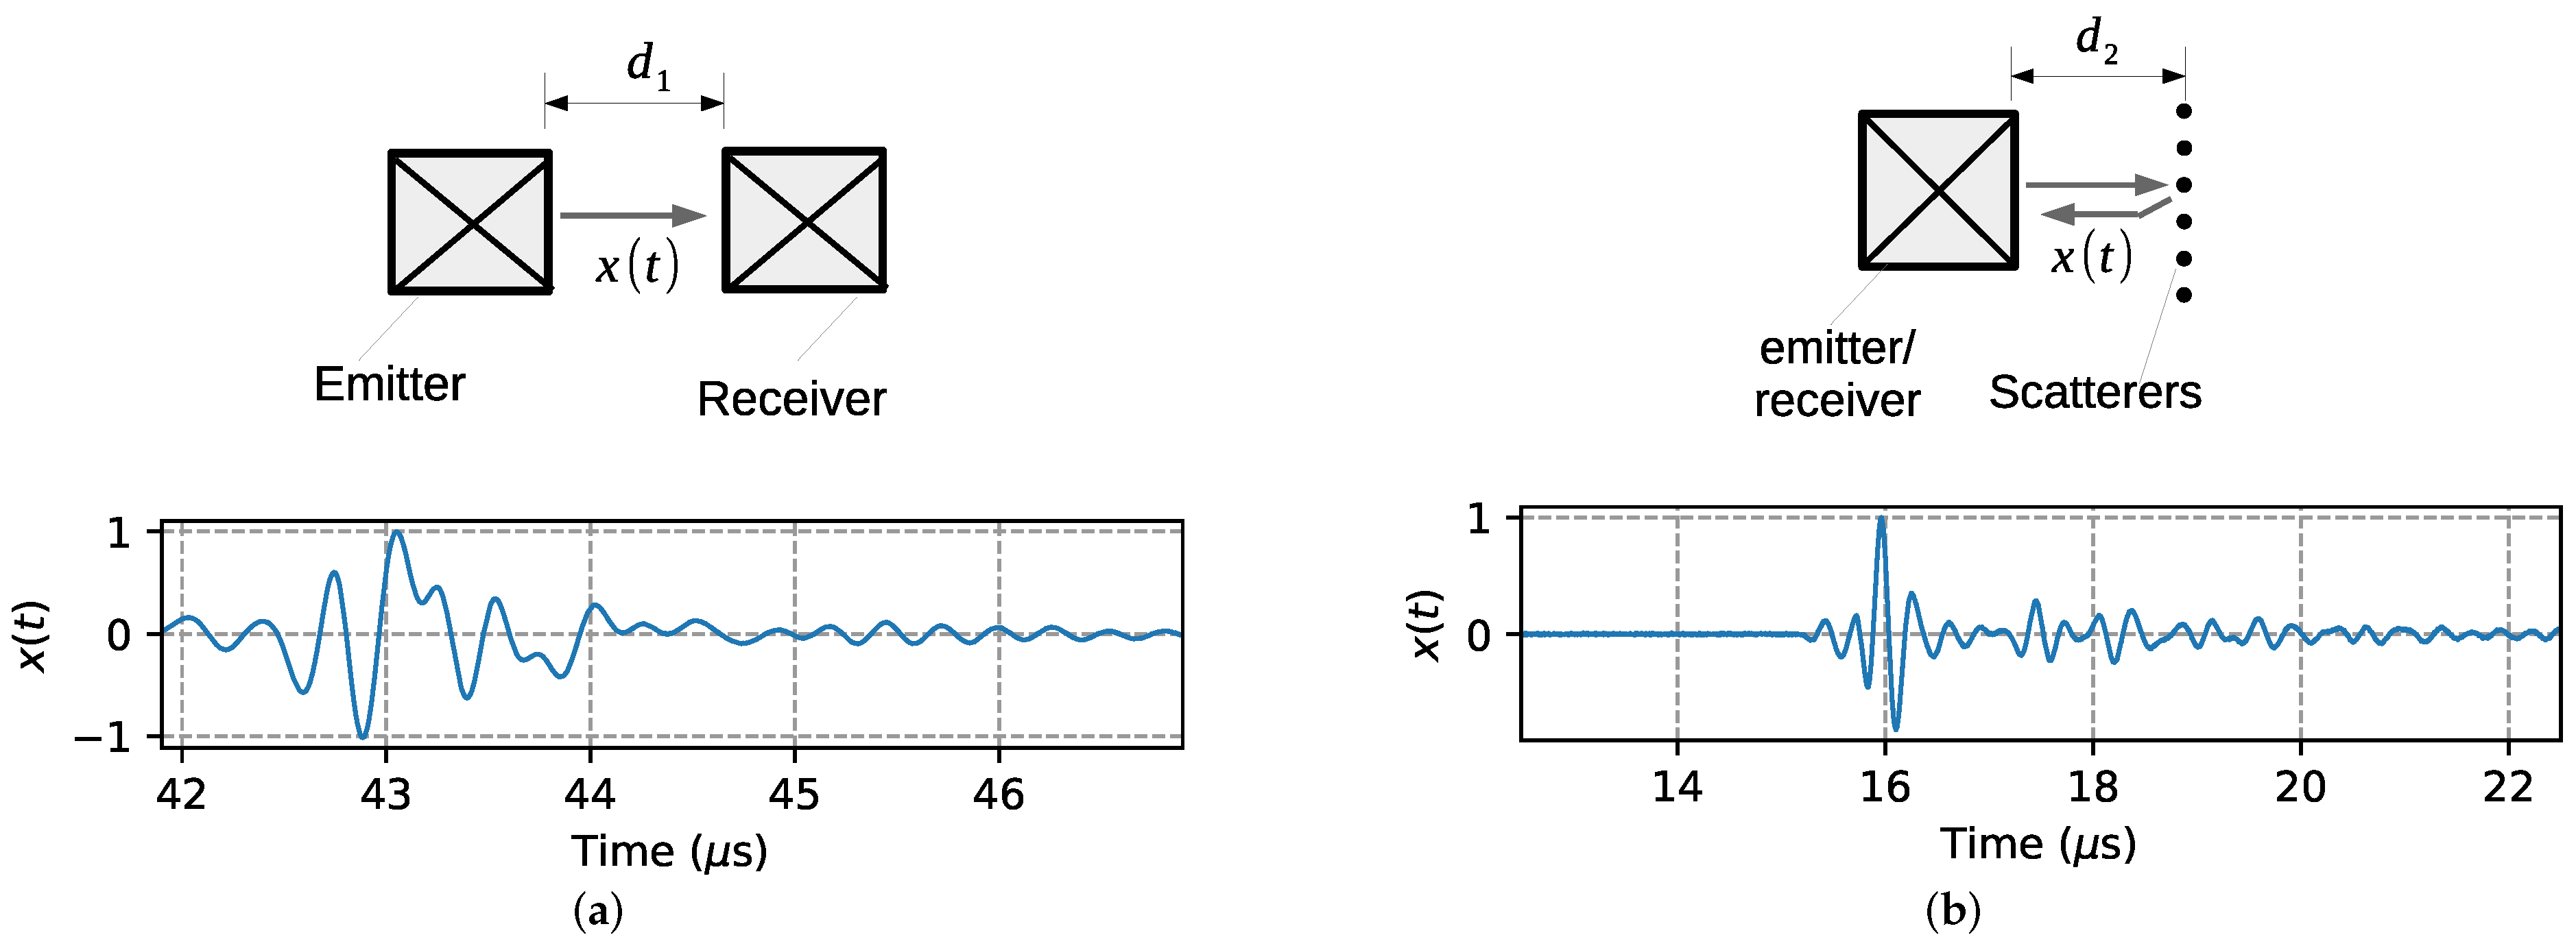
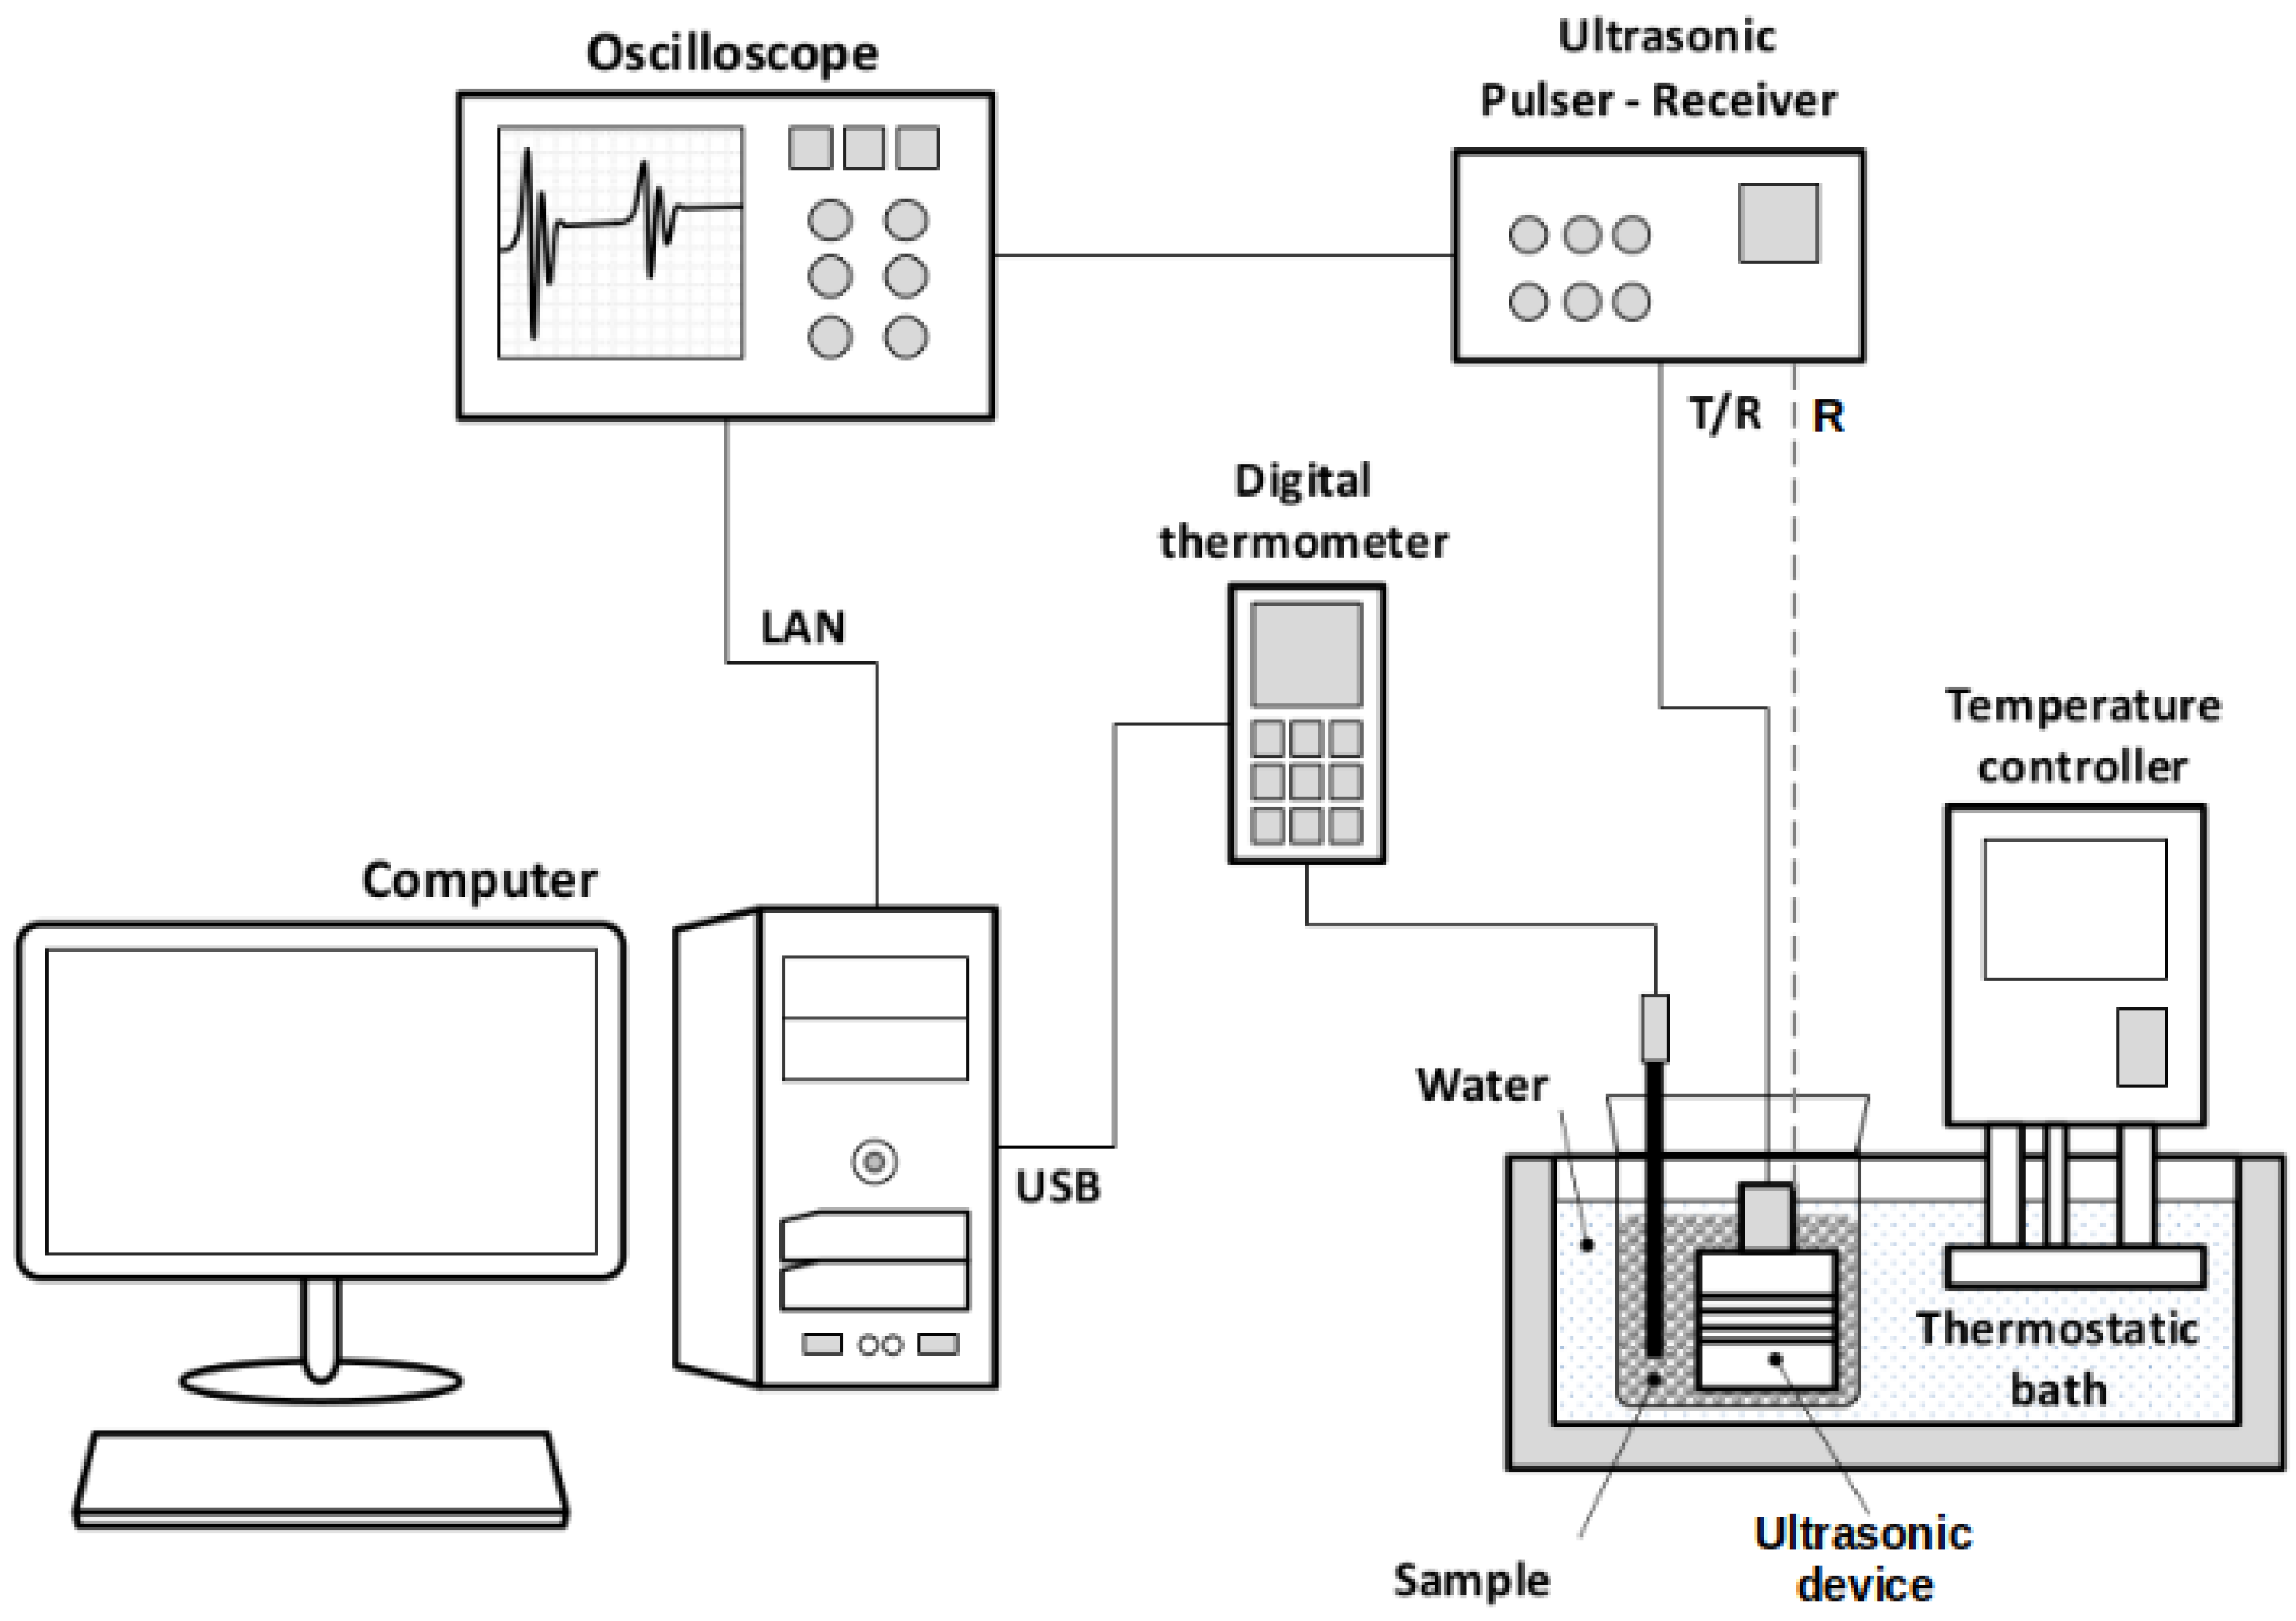
2.1. Ultrasonic Configuration
2.2. Signal Processing
2.3. Data Fitting
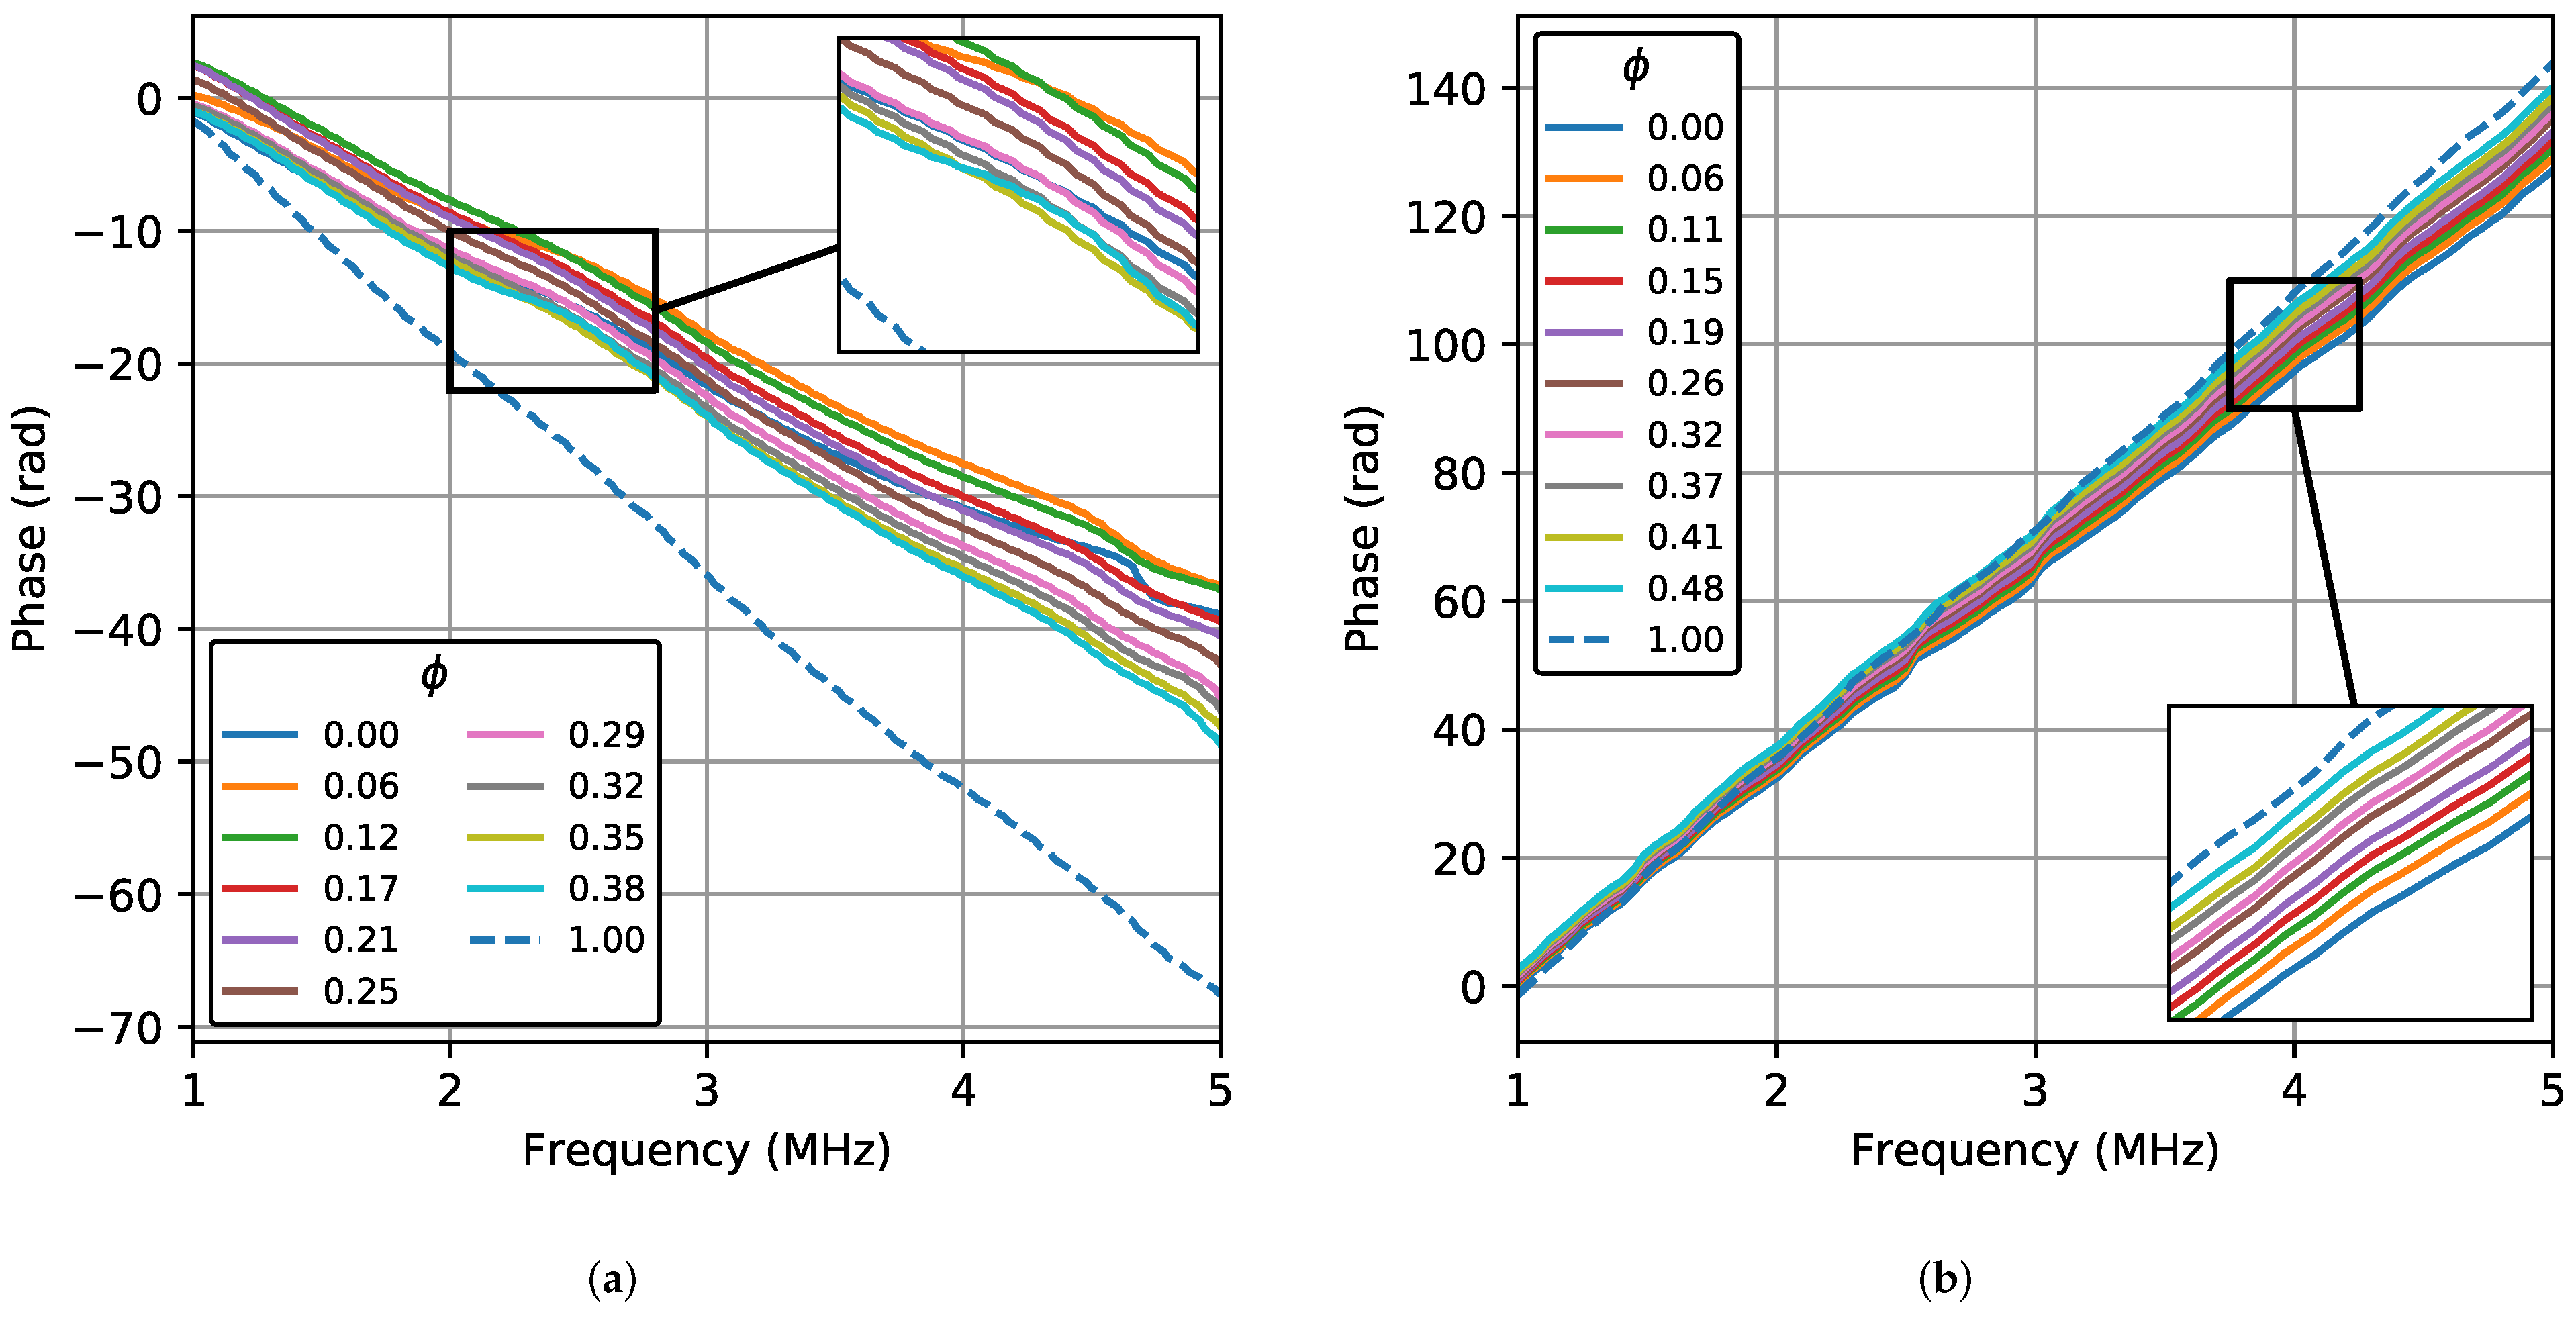
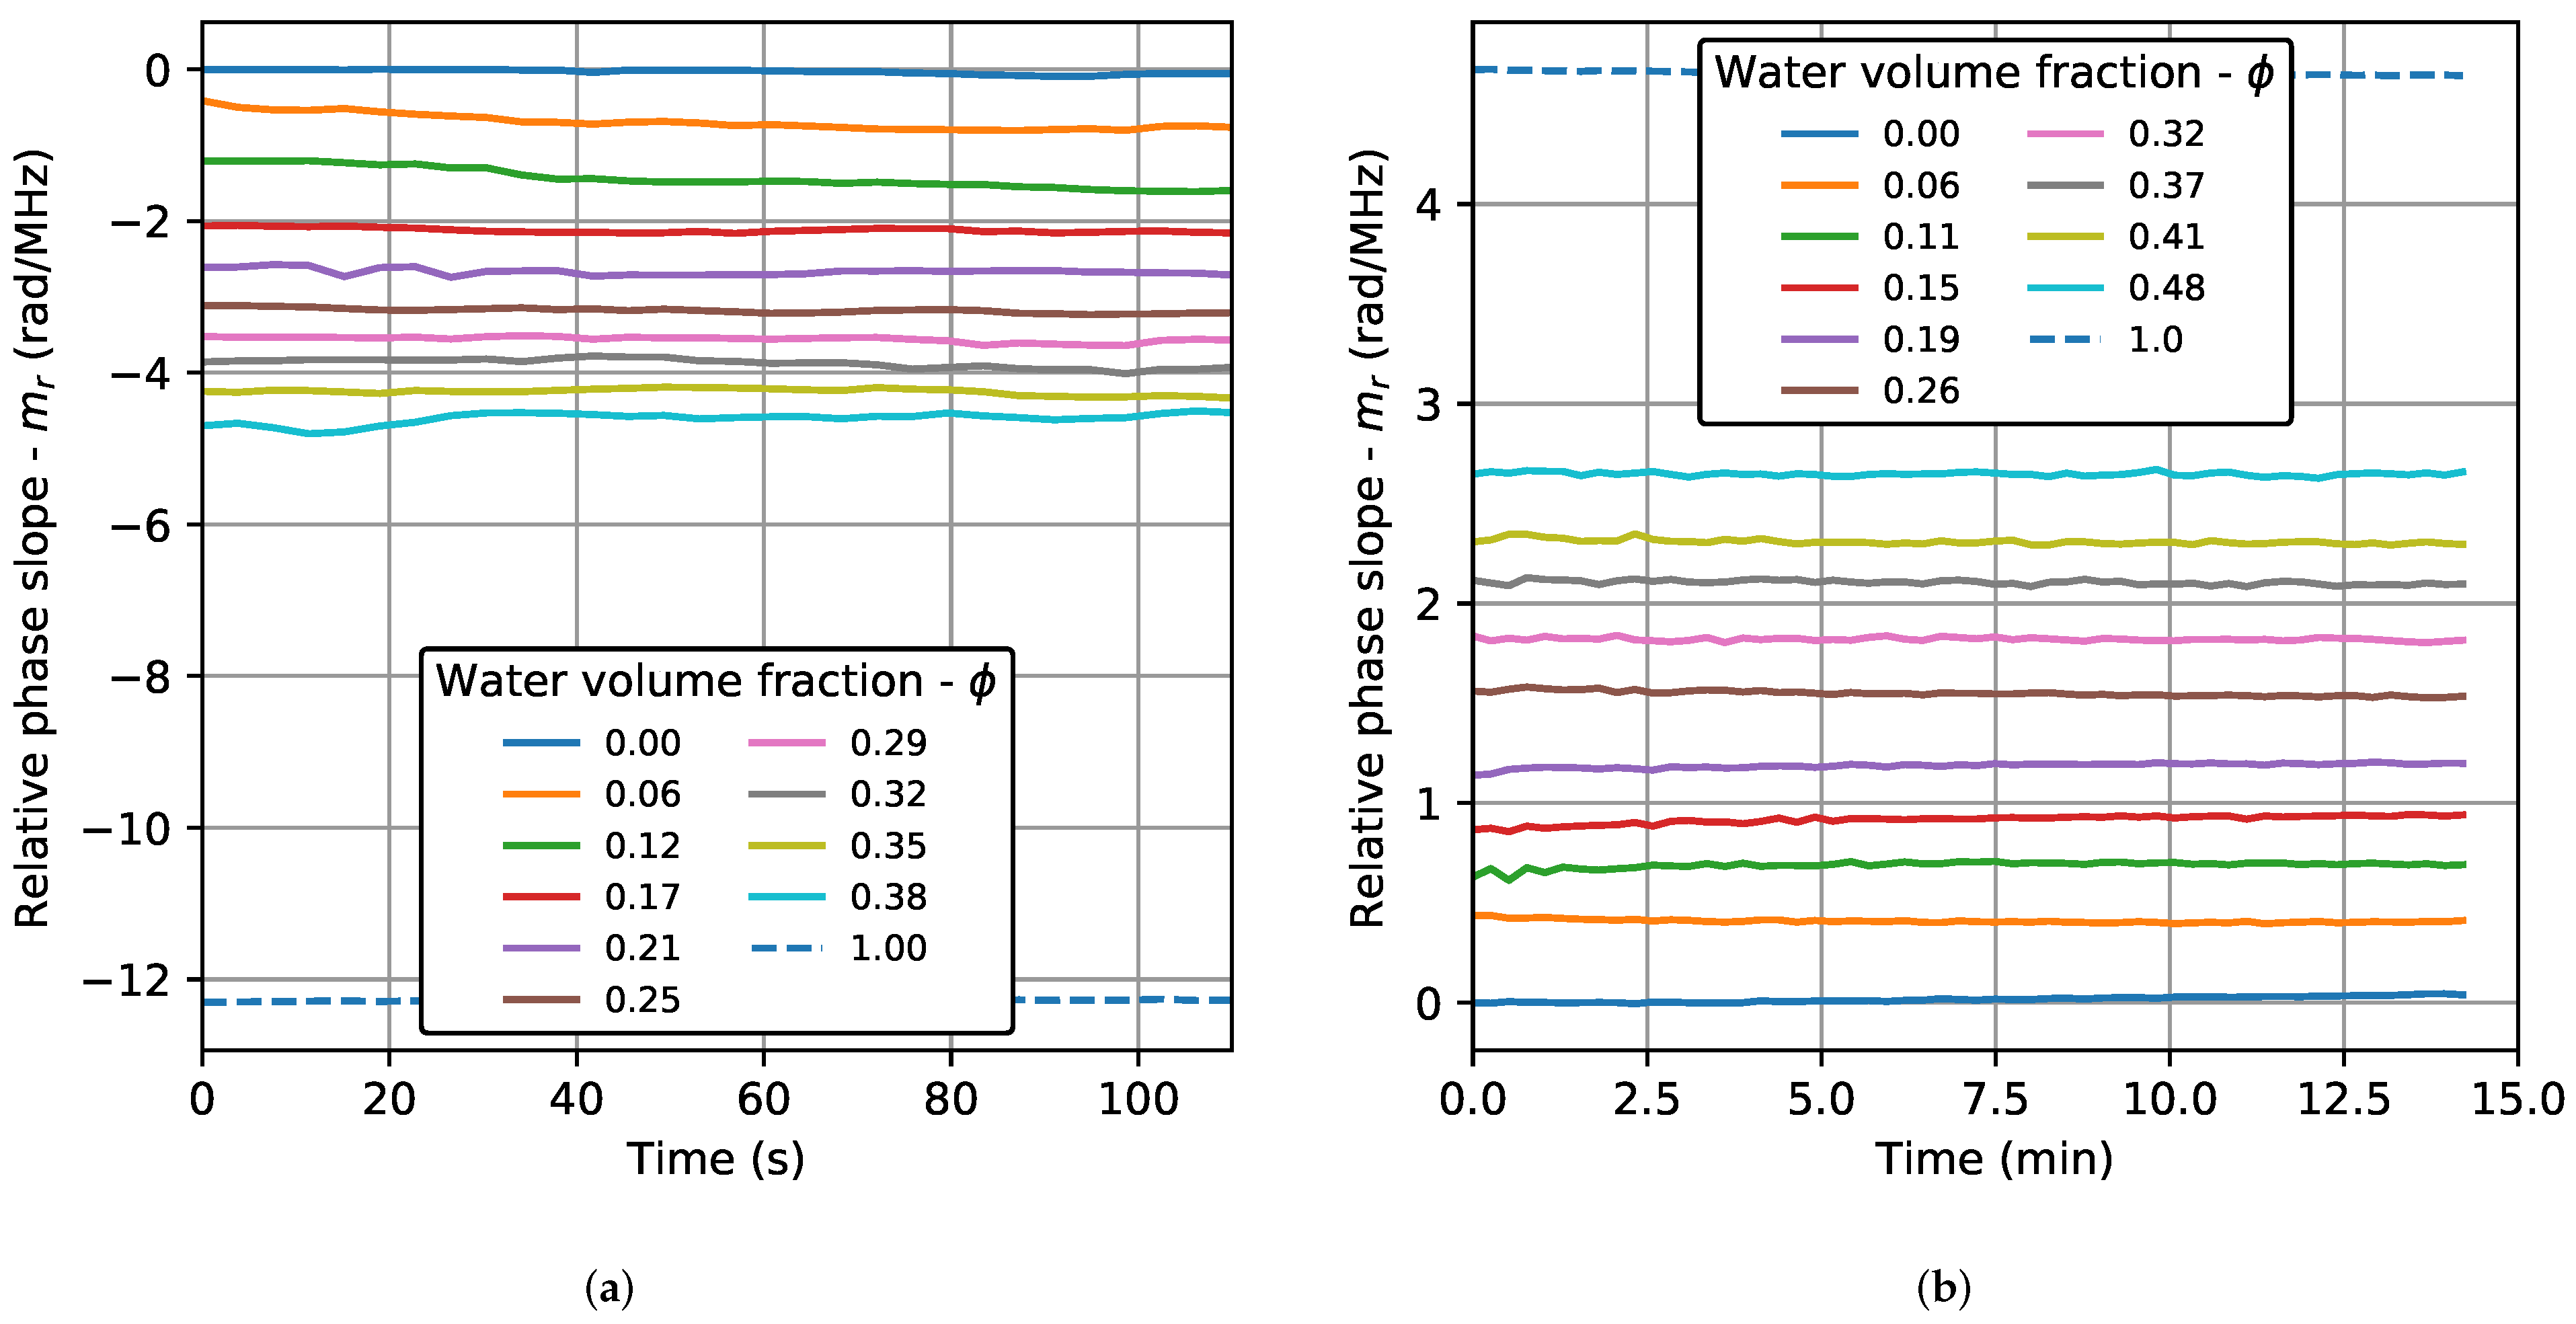
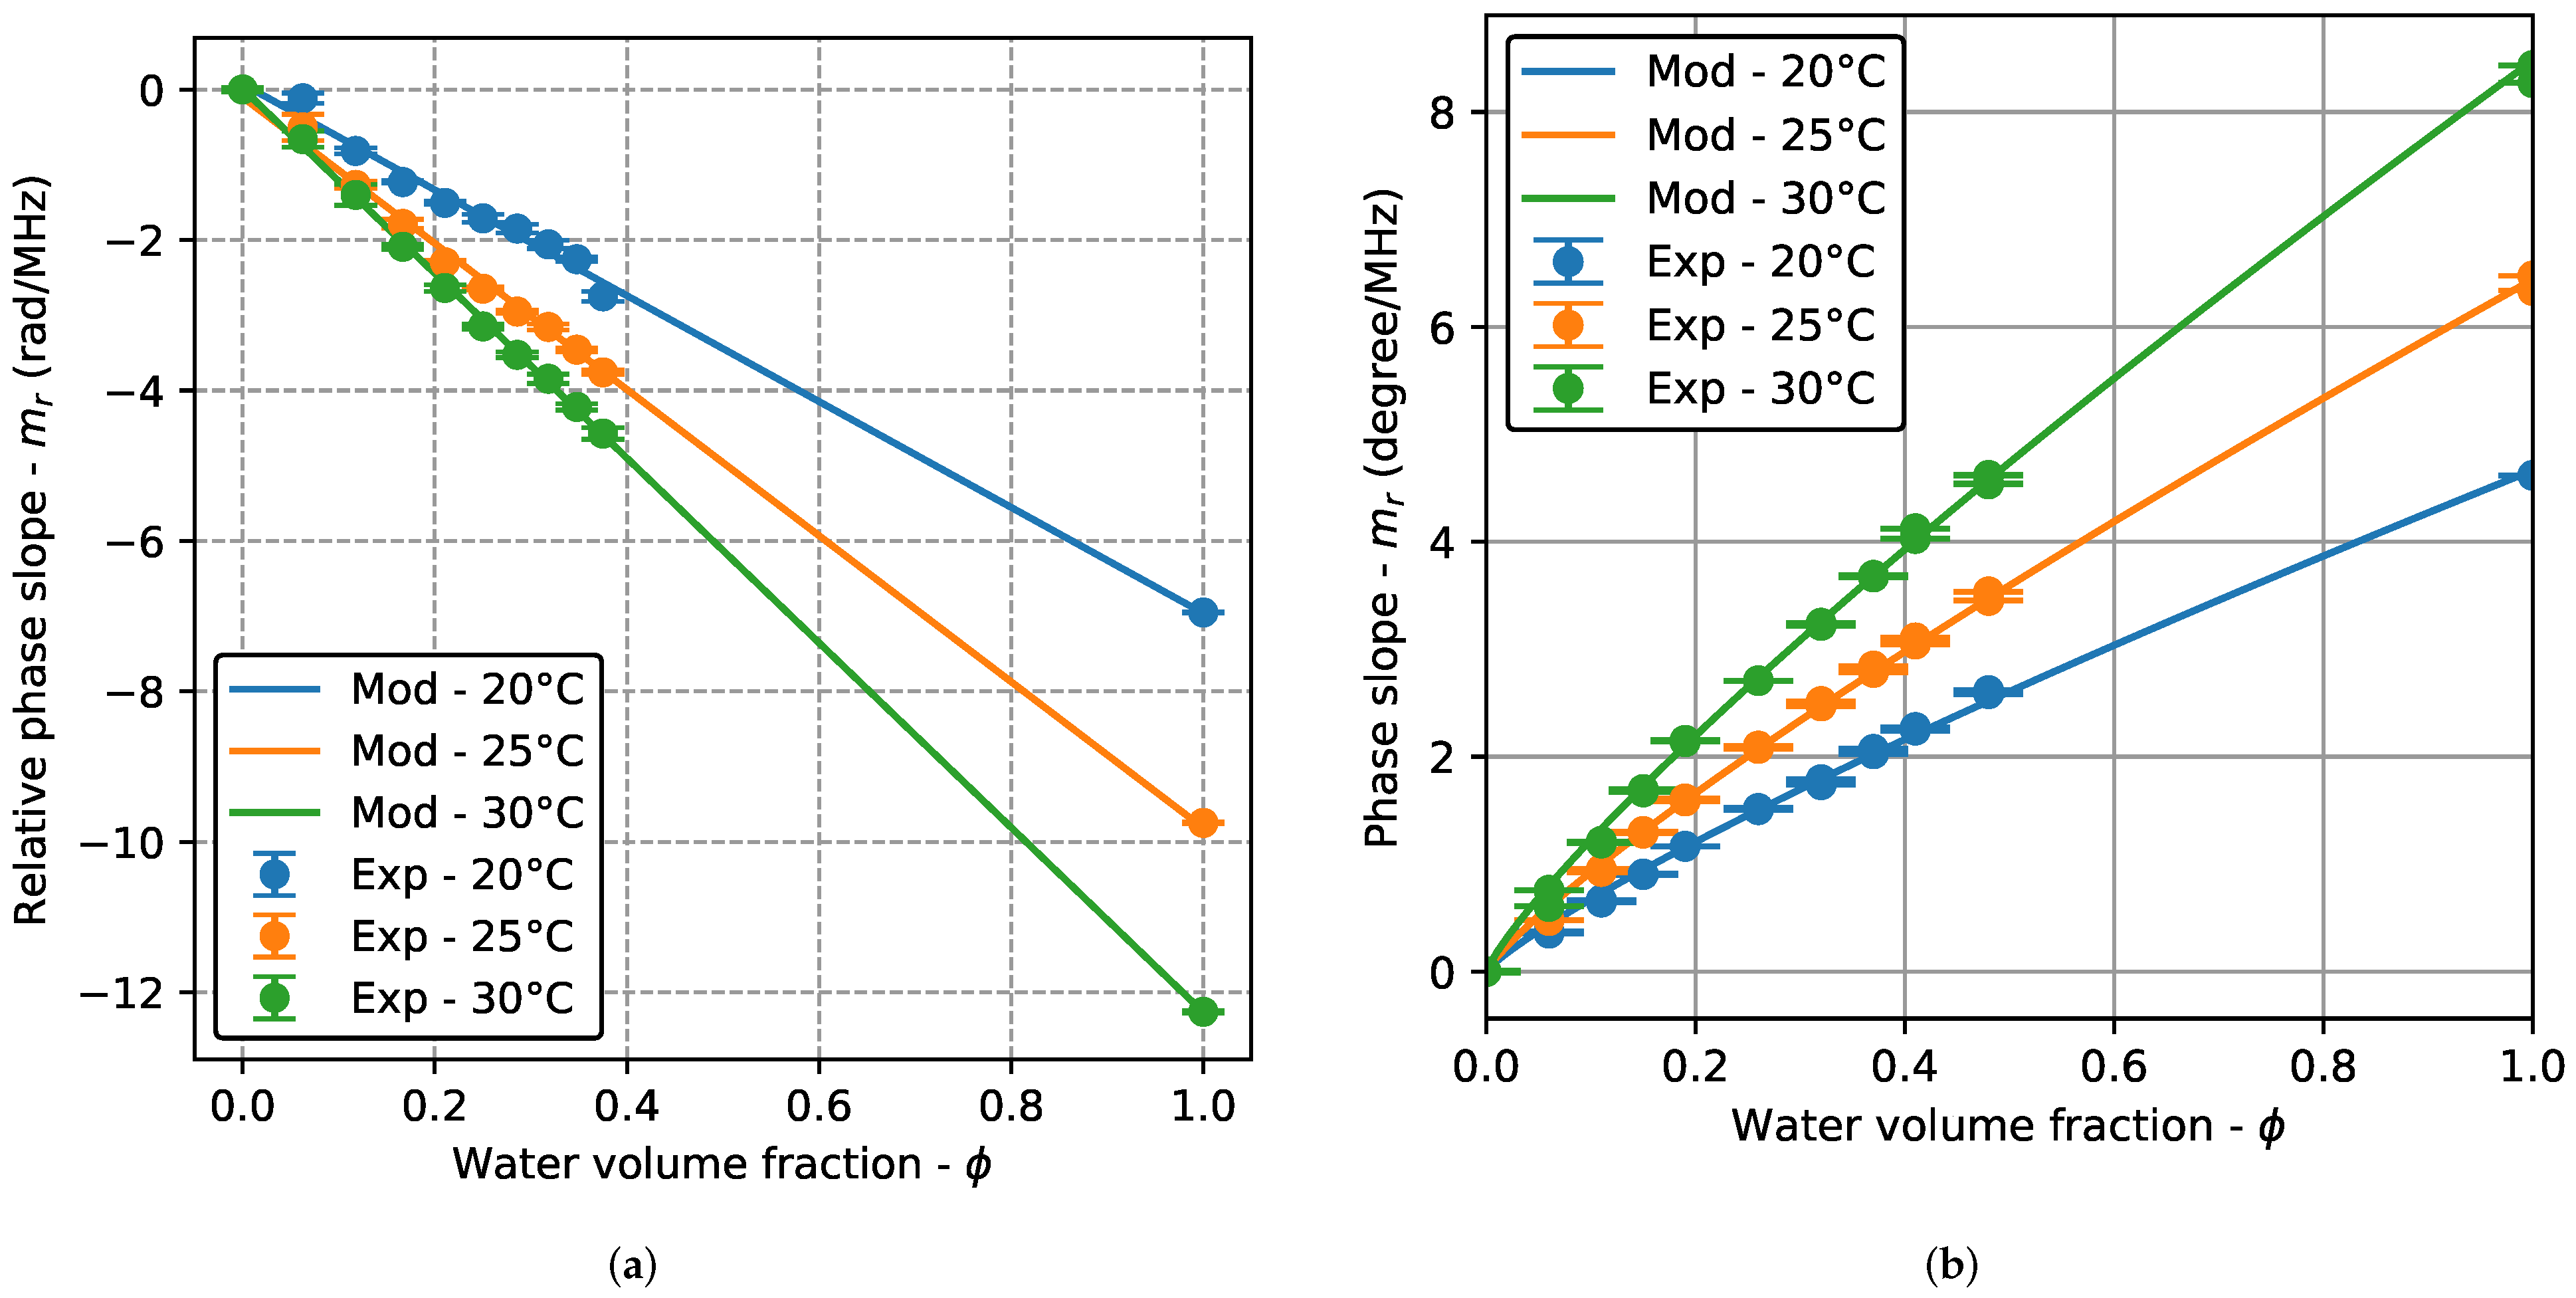
3. Results
4. Conclusions
Author Contributions
Funding
Institutional Review Board Statement
Informed Consent Statement
Conflicts of Interest
Appendix A. Non-Linear Regression and Measurement Error

| Temperature | a | p |
|---|---|---|
| TRD | ||
| 20 °C | −6.9622 | 1.0227 |
| 25 °C | −9.7375 | 0.9814 |
| 30 °C | −12.2532 | 1.0001 |
| BSD | ||
| 20 °C | 0.0954 | 0.8445 |
| 0.0993 | 0.8363 | |
| 25 °C | 0.1279 | 0.8527 |
| 0.1387 | 0.8368 | |
| 30 °C | 0.1775 | 0.8395 |
| 0.1770 | 0.8362 | |
| 20 °C | 25 °C | 30 °C | ||||
|---|---|---|---|---|---|---|
| TRD | ||||||
| 0.0625 | 70.4041 | 26.4452 | 13.8292 | |||
| 0.1176 | 4.6524 | 1.9950 | 2.7766 | |||
| 0.1667 | 10.2659 | 2.8685 | 2.3575 | |||
| 0.2105 | 6.3868 | 5.7392 | 2.2519 | |||
| 0.2500 | 1.5024 | 3.1947 | 2.7868 | |||
| 0.2857 | 4.2620 | 1.1445 | 0.7446 | |||
| 0.3182 | 4.5298 | 2.6452 | 1.3889 | |||
| 0.3478 | 4.4829 | 2.0681 | 1.0110 | |||
| 0.3750 | 7.4999 | 0.9280 | 0.4948 | |||
| 1.0000 | 0.1632 | 0.0982 | 0.0247 | |||
| BSD | ||||||
| 0.0600 | 20.2329 | 19.1616 | 21.1338 | 26.6978 | 6.1881 | 27.4079 |
| 0.1100 | 12.3778 | 11.4234 | 6.6847 | 7.9421 | 10.3712 | 10.7466 |
| 0.1500 | 3.9190 | 6.5761 | 1.5081 | 2.8876 | 2.0349 | 2.2837 |
| 0.1900 | 1.8640 | 0.1621 | 2.4705 | 1.3688 | 2.0694 | 4.3459 |
| 0.2600 | 1.8753 | 0.5787 | 2.3939 | 0.5221 | 1.2479 | 0.3442 |
| 0.3200 | 2.7644 | 0.9325 | 0.8057 | 1.6980 | 0.5353 | 0.3600 |
| 0.3700 | 0.7847 | 2.0431 | 0.1885 | 2.0249 | 0.2879 | 1.5062 |
| 0.4100 | 2.7916 | 3.0380 | 0.5728 | 2.3719 | 3.3208 | 2.3886 |
| 0.4800 | 3.7018 | 4.1368 | 0.5338 | 2.1370 | 1.0392 | 0.8134 |
| 1.0000 | 1.0947 | 1.3451 | 0.2340 | 1.0841 | 0.6192 | 0.7981 |
References
- Umar, A.A.; Saaid, I.B.M.; Sulaimon, A.A.; Pilus, R.B.M. A review of petroleum emulsions and recent progress on water-in-crude oil emulsions stabilized by natural surfactants and solids. J. Pet. Sci. Eng. 2018, 165, 673–690. [Google Scholar] [CrossRef]
- Sadatshojaie, A.; Wood, D.A.; Jokar, S.M.; Rahimpour, M.R. Applying ultrasonic fields to separate water contained in medium-gravity crude oil emulsions and determining crude oil adhesion coefficients. Ultrason. Sonochem. 2021, 70, 105303. [Google Scholar] [CrossRef] [PubMed]
- Goddeeris, C.; Cuppo, F.; Reynaers, H.; Bouwman, W.; Van den Mooter, G. Light scattering measurements on microemulsions: Estimation of droplet sizes. Int. J. Pharm. 2006, 312, 187–195. [Google Scholar] [CrossRef] [PubMed]
- Alvarez, G.; Jestin, J.; Argillier, J.F.; Langevin, D. Small-Angle Neutron Scattering Study of Crude Oil Emulsions: Structure of the Oil-Water Interfaces. Langmuir 2009, 25, 3985–3990. [Google Scholar] [CrossRef] [PubMed]
- Stokes, D.J.; Thiel, B.L.; Donald, A.M. Direct Observation of Water-Oil Emulsion Systems in the Liquid State by Environmental Scanning Electron Microscopy. Langmuir 1998, 14, 4402–4408. [Google Scholar] [CrossRef]
- D’Avila, M.A.; Shapley, N.C.; Walton, J.H.; Phillips, R.J.; Dungan, S.R.; Powell, R.L. Mixing of concentrated oil-in-water emulsions measured by nuclear magnetic resonance imaging. Phys. Fluids 2003, 15, 2499–2511. [Google Scholar] [CrossRef]
- Heindel, T.J. A Review of X-Ray Flow Visualization With Applications to Multiphase Flows. J. Fluids Eng. 2011, 133, 074001. [Google Scholar] [CrossRef]
- Åbro, E.; Johansen, G. Improved void fraction determination by means of multibeam gamma-ray attenuation measurements. Flow Meas. Instrum. 1999, 10, 99–108. [Google Scholar] [CrossRef]
- Zhang, D.C.; Hu, Z.Q.; Su, Y.B.; Hai, B.; Zhu, X.L.; Zhu, J.F.; Ma, X. Simple method for liquid analysis by laser-induced breakdown spectroscopy (LIBS). Opt. Express 2018, 26, 18794–18802. [Google Scholar] [CrossRef]
- Harhira, A.; Haddad, J.E.; Sabsabi, M.; Blouin, A. Evaluation of LIBS technique for rapid determination of total clays in oil sands ores. In Proceedings of the OSA Optical Sensors and Sensing Congress 2021 (AIS, FTS, HISE, SENSORS, ES), Washington, DC, USA, 19–23 July 2021; Optica Publishing Group: Washington, DC, USA, 2021; p. AM5D.5. [Google Scholar] [CrossRef]
- García-Golding, F.; Giallorenzo, M.; Moreno, N.; Chang, V. Sensor for determining the water content of oil-in-water emulsion by specific admittance measurement. Sens. Actuators A Phys. 1995, 47, 337–341. [Google Scholar] [CrossRef]
- Jaworski, A.J.; Dyakowski, T. Measurements of oil–water separation dynamics in primary separation systems using distributed capacitance sensors. Flow Meas. Instrum. 2005, 16, 113–127. [Google Scholar] [CrossRef]
- Leighton, T.G. What is ultrasound? Prog. Biophys. Mol. Biol. 2007, 93, 3–83. [Google Scholar] [CrossRef]
- Pinfield, V.J. Advances in ultrasonic monitoring of oil-in-water emulsions. Food Hydrocoll. 2014, 42, 48–55. [Google Scholar] [CrossRef]
- Su, M.; Cai, X.; Xue, M.; Dong, L.; Xu, F. Particle sizing in dense two-phase droplet systems by ultrasonic attenuation and velocity spectra. Sci. China Ser. E Technol. Sci. 2009, 52, 1502–1510. [Google Scholar] [CrossRef]
- Shah, A.; Fishwick, R.; Wood, J.; Leeke, G.; Rigby, S.; Greaves, M. A review of novel techniques for heavy oil and bitumen extraction and upgrading. Energy Environ. Sci. 2010, 3, 700–714. [Google Scholar] [CrossRef]
- Durán, A.L.; Franco, E.E.; Reyna, C.A.B.; Pérez, N.; Tsuzuki, M.S.G.; Buiochi, F. Water Content Monitoring in Water-in-Crude-Oil Emulsions Using an Ultrasonic Multiple-Backscattering Sensor. Sensors 2021, 21, 5088. [Google Scholar] [CrossRef]
- Liang, M.; Xinglian, C.; Lingjiang, Z.; Kemin, D. Measurement of water content of petroleum by high accuracy interval measuring chip. In Proceedings of the IEEE 2012 Fourth International Conference on Computational and Information Sciences, Chongqing, China, 17–19 August 2012. [Google Scholar] [CrossRef]
- Zhai, L.S.; Jin, N.D.; Gao, Z.K.; Wang, Z.Y.; Li, D.M. The ultrasonic measurement of high water volume fraction in dispersed oil-in-water flows. Chem. Eng. Sci. 2013, 94, 271–283. [Google Scholar] [CrossRef]
- Reyna, C.A.B.; Franco, E.E.; Durán, A.L.; Pereira, L.O.V.; Tsuzuki, M.S.G.; Buiochi, F. Water Content Monitoring in Water-in-Oil Emulsions Using a Piezoceramic Sensor. Machines 2021, 9, 335. [Google Scholar] [CrossRef]
- Haldren, H.A.; Perey, D.F.; Yost, W.T.; Cramer, K.E.; Gupta, M.C. A digital, constant-frequency pulsed phase-locked-loop instrument for real-time, absolute ultrasonic phase measurements. Rev. Sci. Instrum. 2018, 89, 054902. [Google Scholar] [CrossRef]
- Reyna, C.A.B.; Durán, A.L.; Pereira, L.O.V.; Tsuzuki, M.S.G.; Franco, E.E.; Buiochi, F. Development of an adjustable measuring cell for ultrasonic characterization of water-in-crude oil emulsions. In Proceedings of the 2021 IEEE UFFC Latin America Ultrasonics Symposium (LAUS), Gainesville, FL, USA, 4–5 October 2021; pp. 1–4. [Google Scholar] [CrossRef]
- Hull, D.R.; Kautz, H.E.; Vary, A. Ultrasonic Velocity Measurement Using Phase-Slope and Cross-Correlation Methods; NASA Technical Memorandum 83794; NASA—Lewis Research Center: Cleveland, OH, USA, 1984. [Google Scholar]
- Wormley, S.J.; Forouraghi, K.; Li, Y.; Thompson, R.B.; Papadakis, E.P. Application of a fourier transform-phase-slope technique to the design of an instrument for the ultrasonic measurement of texture and stress. In Review of Progress in Quantitative Nondestructive Evaluation; Springer: Boston, MA, USA, 1990; pp. 951–958. [Google Scholar] [CrossRef]
- Mukhopadhyay, A.; Chatterjee, D.; Mondal, C.; Punnose, S.; Gopinath, K. Characterization of microstructural changes due to prolonged thermal exposure of directionally solidified Ni-base super alloy CM 247LC using ultrasonic. Ultrasonics 2018, 90, 42–51. [Google Scholar] [CrossRef]
- Haldren, H.A.; Perey, D.F.; Yost, W.T.; Cramer, K.E.; Gupta, M.C. Swept-frequency ultrasonic phase evaluation of adhesive bonding in tri-layer structures. J. Acoust. Soc. Am. 2019, 145, 1609–1618. [Google Scholar] [CrossRef] [PubMed]
- Wilcox, P.; Lowe, M.; Cawley, P. The effect of dispersion on long-range inspection using ultrasonic guided waves. NDT & E Int. 2001, 34, 1–9. [Google Scholar] [CrossRef]
- Fariñas, M.D.; Sancho-Knapik, D.; Peguero-Pina, J.J.; Gil-Pelegrín, E.; Gómez Álvarez-Arenas, T.E. Contact-less, non-resonant and high-frequency ultrasonic technique: Towards a universal tool for plant leaf study. Comput. Electron. Agric. 2022, 199, 107160. [Google Scholar] [CrossRef]
- Gómez Álvarez Arenas, T.; Gil-Pelegrin, E.; Ealo Cuello, J.; Fariñas, M.D.; Sancho-Knapik, D.; Collazos Burbano, D.A.; Peguero-Pina, J.J. Ultrasonic Sensing of Plant Water Needs for Agriculture. Sensors 2016, 16, 1089. [Google Scholar] [CrossRef] [PubMed]
- Amioka, N.; Takaya, Y.; Nakamura, K.; Kondo, M.; Akazawa, K.; Ohno, Y.; Ichikawa, K.; Nakayama, R.; Saito, Y.; Akagi, S.; et al. Impact of shear wave dispersion slope analysis for assessing the severity of myocarditis. Sci. Rep. 2022, 12, 8776. [Google Scholar] [CrossRef]
- Durán, A.L.; Franco, E.E.; Pérez, N.; Tsuzuki, M.S.G.; Buiochi, F. Ultrasonic multiple-backscattering sensor for monitoring of water-in-crude oil emulsions: Temperature effect. In Proceedings of the 2021 IEEE UFFC Latin America Ultrasonics Symposium (LAUS), Gainesville, FL, USA, 4–5 October 2021; pp. 1–4. [Google Scholar] [CrossRef]
- Oppenheim, A.V.; Willsky, A.S. Signals and Systems, 2nd ed.; Pearson: Upper Saddle River, NJ, USA, 1996. [Google Scholar]
- Goertzel, G. An Algorithm for the Evaluation of Finite Trigonometric Series. Am. Math. Mon. 1958, 65, 34. [Google Scholar] [CrossRef]
- Hart, A. A review of technologies for transporting heavy crude oil and bitumen via pipelines. J. Pet. Explor. Prod. Technol. 2014, 4, 327–336. [Google Scholar] [CrossRef]
- Ashrafizadeh, S.; Kamran, M. Emulsification of heavy crude oil in water for pipeline transportation. J. Pet. Sci. Eng. 2010, 71, 205–211. [Google Scholar] [CrossRef]
Publisher’s Note: MDPI stays neutral with regard to jurisdictional claims in published maps and institutional affiliations. |
© 2022 by the authors. Licensee MDPI, Basel, Switzerland. This article is an open access article distributed under the terms and conditions of the Creative Commons Attribution (CC BY) license (https://creativecommons.org/licenses/by/4.0/).
Share and Cite
Franco, E.E.; Reyna, C.A.B.; Durán, A.L.; Buiochi, F. Ultrasonic Monitoring of the Water Content in Concentrated Water–Petroleum Emulsions Using the Slope of the Phase Spectrum. Sensors 2022, 22, 7236. https://doi.org/10.3390/s22197236
Franco EE, Reyna CAB, Durán AL, Buiochi F. Ultrasonic Monitoring of the Water Content in Concentrated Water–Petroleum Emulsions Using the Slope of the Phase Spectrum. Sensors. 2022; 22(19):7236. https://doi.org/10.3390/s22197236
Chicago/Turabian StyleFranco, Ediguer E., Carlos A. B. Reyna, Alberto L. Durán, and Flávio Buiochi. 2022. "Ultrasonic Monitoring of the Water Content in Concentrated Water–Petroleum Emulsions Using the Slope of the Phase Spectrum" Sensors 22, no. 19: 7236. https://doi.org/10.3390/s22197236
APA StyleFranco, E. E., Reyna, C. A. B., Durán, A. L., & Buiochi, F. (2022). Ultrasonic Monitoring of the Water Content in Concentrated Water–Petroleum Emulsions Using the Slope of the Phase Spectrum. Sensors, 22(19), 7236. https://doi.org/10.3390/s22197236