

Review of Ethanol Intoxication Sensing Technologies and Techniques


Abstract
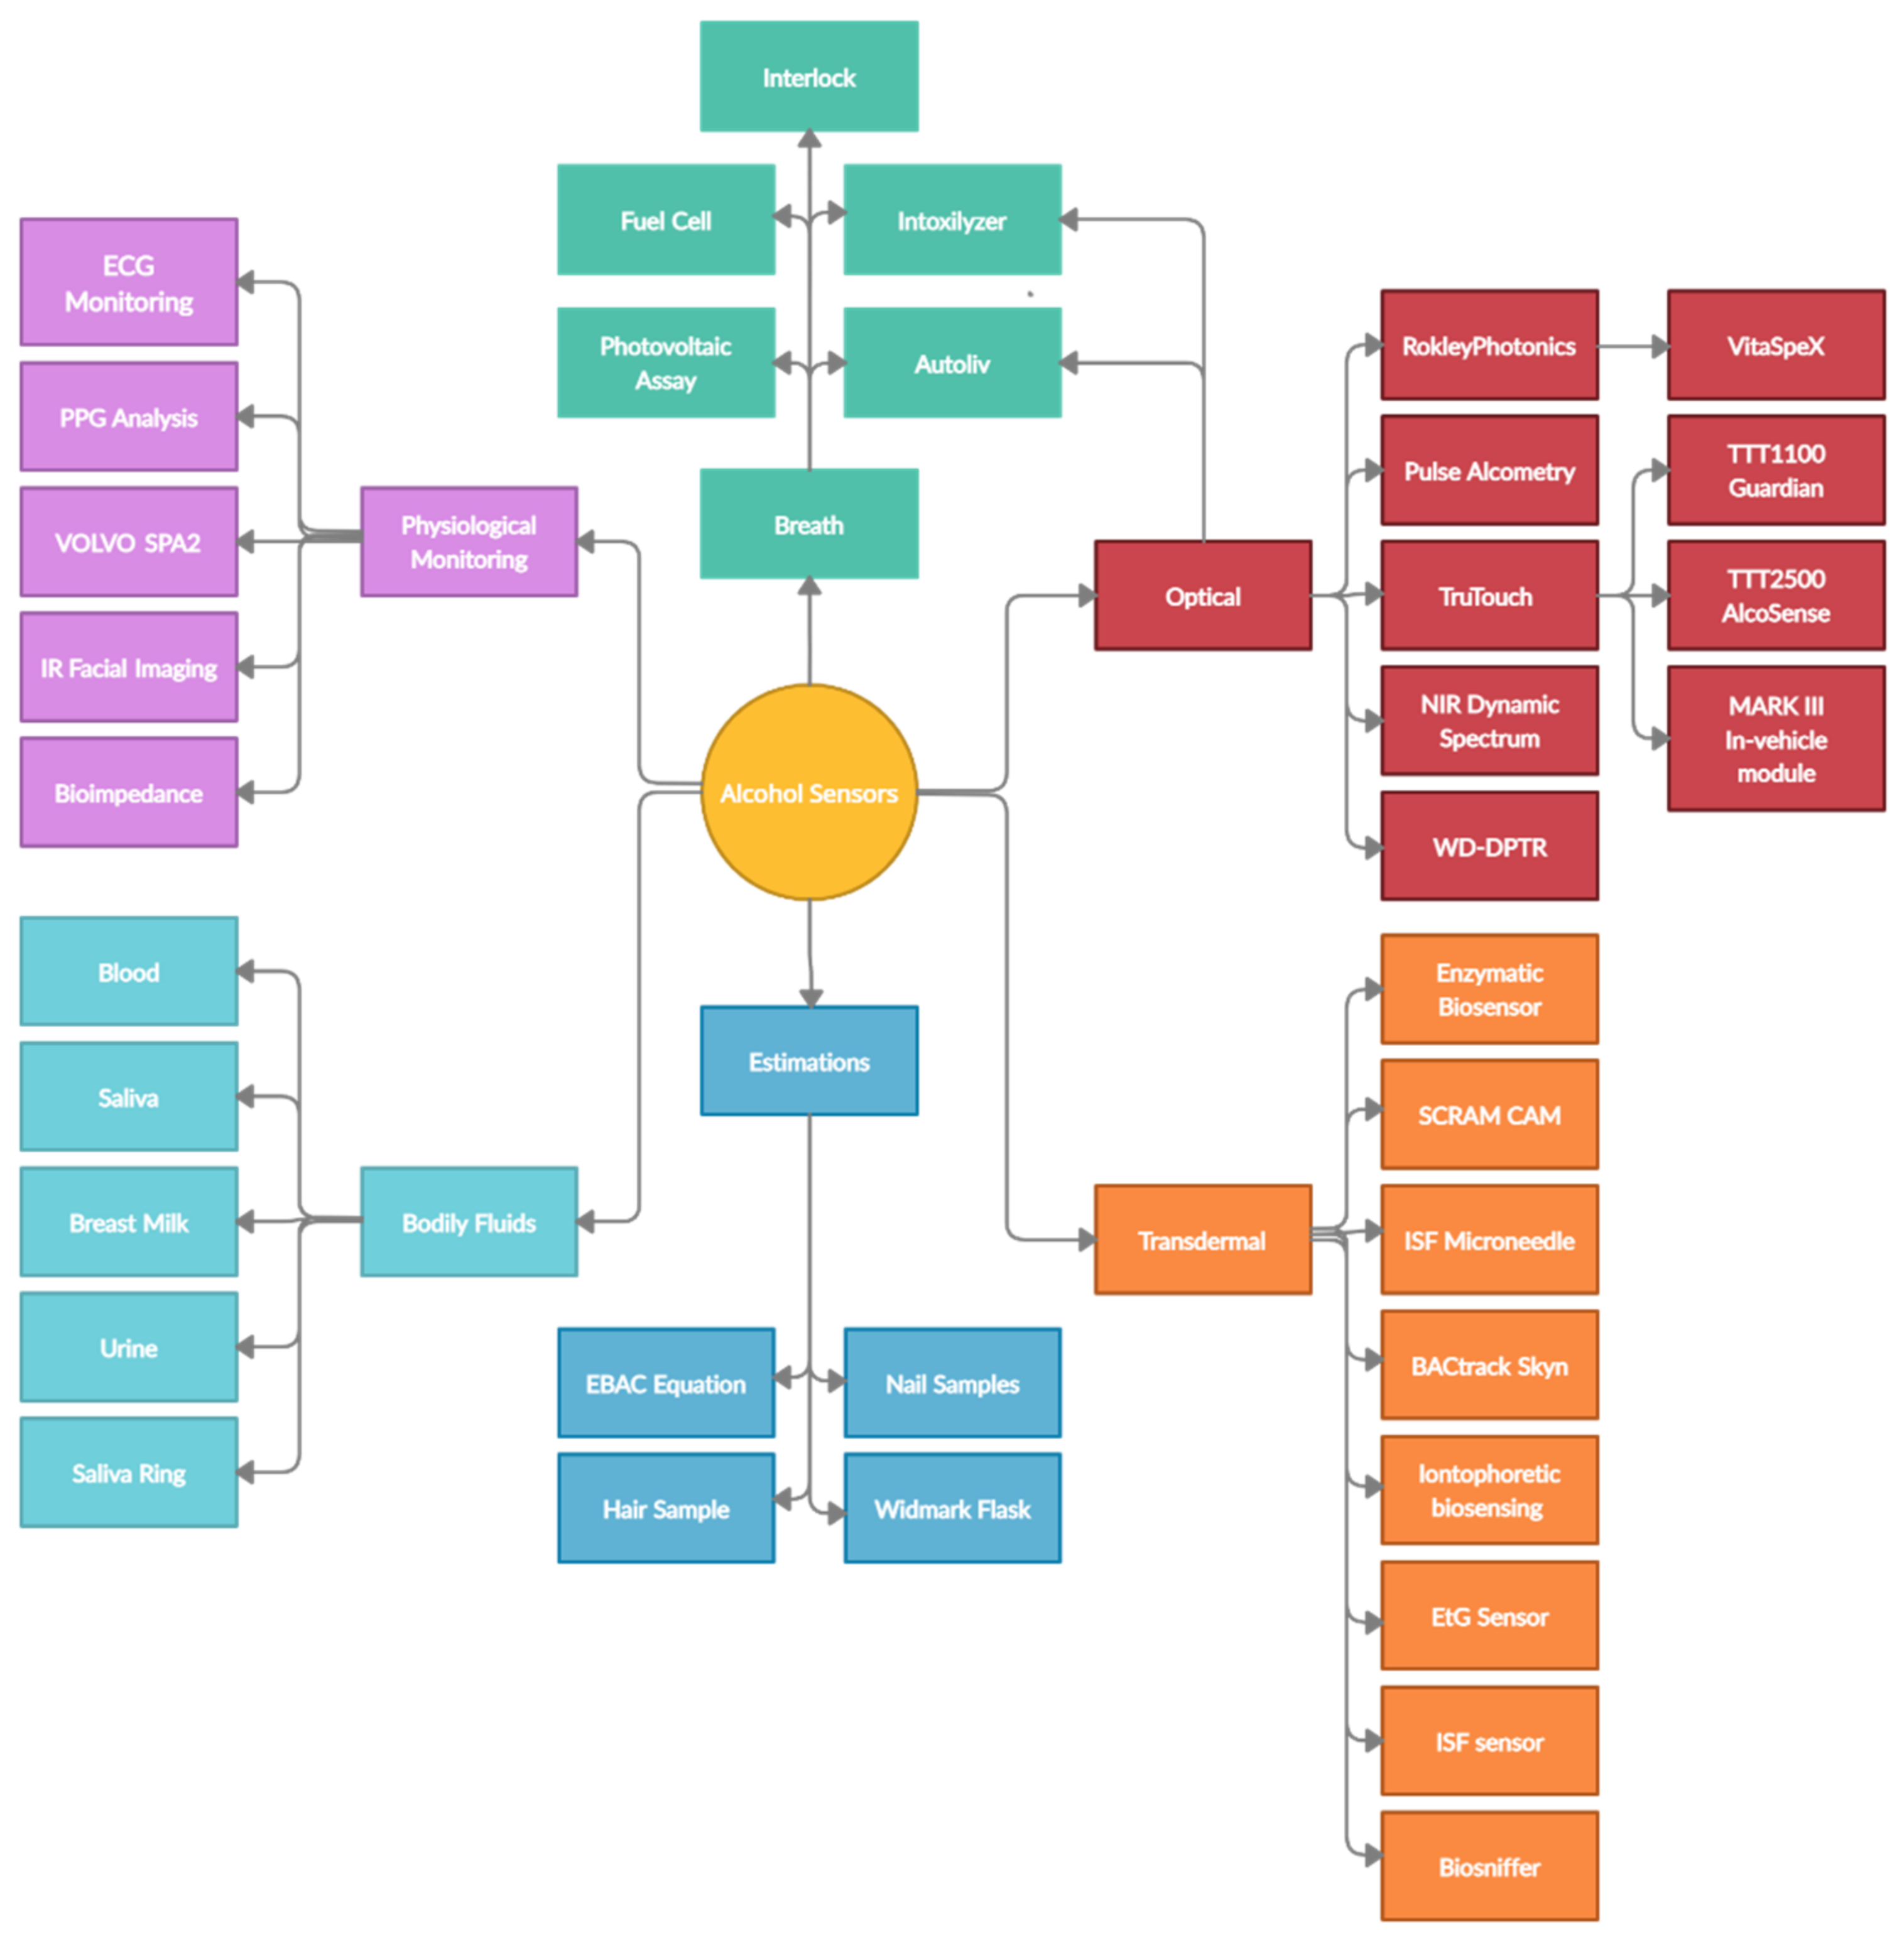
1. Introduction
2. Toxicology of Intoxication
3. Technologies and Devices
3.1. Early Estimates of BAC
3.1.1. Advantages
- The Widmark equation is a very useful tool for estimation of blood alcohol levels in the absence of testing equipment.
- The estimations consider the sex and the elimination rate of ethanol, accounting for some of the most important factors in ethanol metabolism.
- The Widmark flask is the first proven method of measuring ethanol levels in the blood.
3.1.2. Disadvantages
- The Widmark flask requires blood samples, making it an invasive procedure.
- The Widmark equation is not completely representative of true intoxication levels.
- The Widmark equation requires use of tables and knowledge of time consumption.
3.2. Breath Alcohol Devices
3.2.1. Advantages
- Proven to be effective in law enforcement, prevention of DUI
- Nonintrusive procedure
- Results generated within seconds of the reading
- Passive measurements of an enclosed space possible
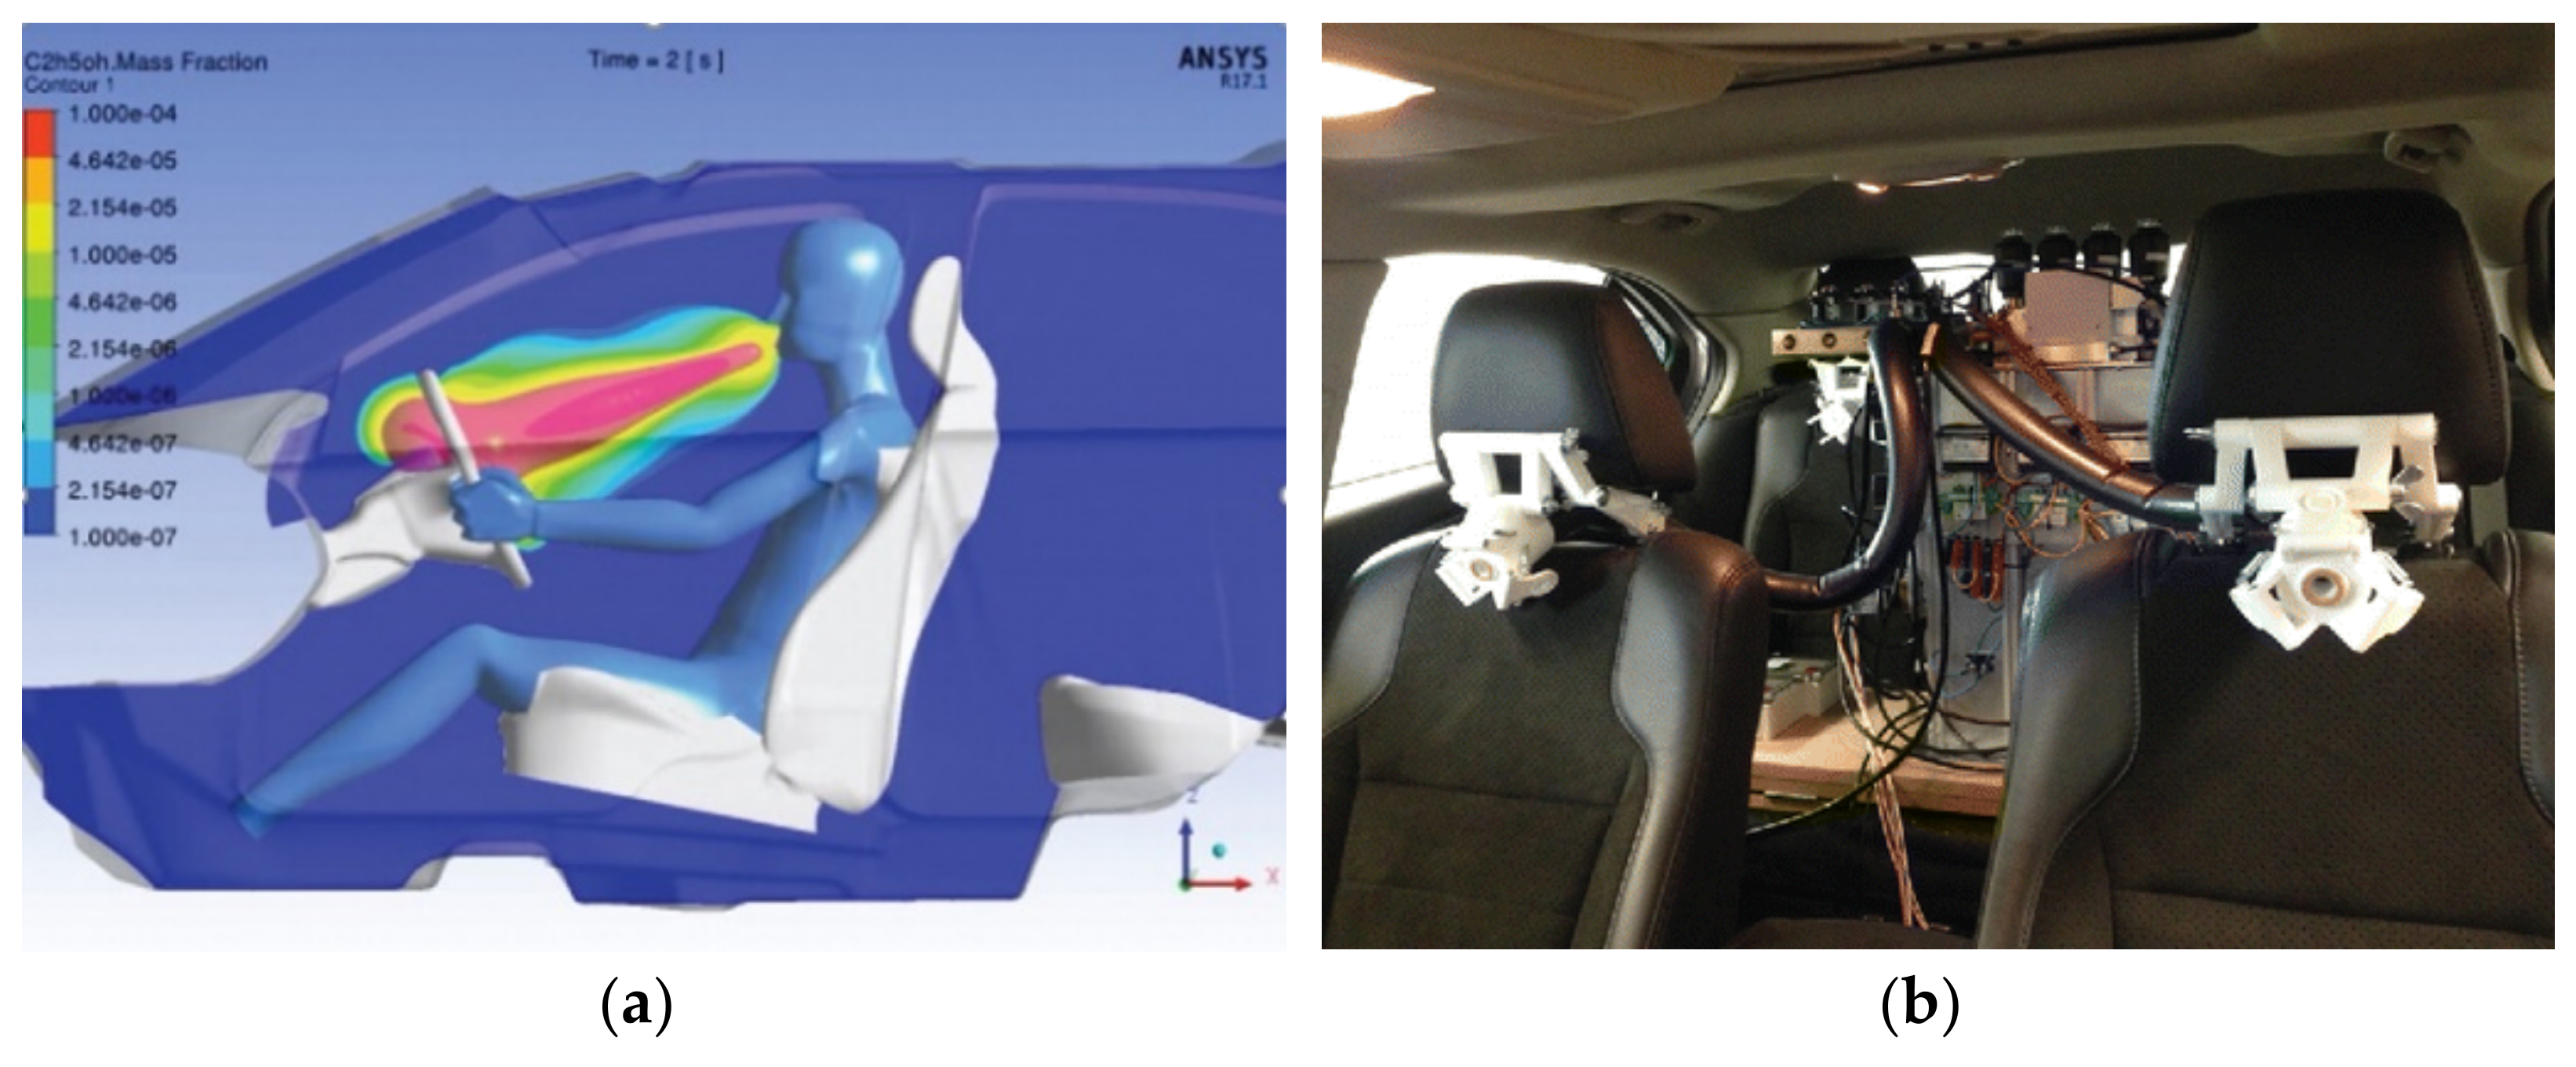
- Possibility to incorporate BrAC into vehicles, for example, the Interlock system
- Portable, small form factor, light, battery powered.
3.2.2. Disadvantages
- A large selection of devices available in retail outlets, many of varying quality
- Well-performing breathalyzers are very expensive and require laboratory calibration.
- BrAC devices apply an outdated conversion ratio of 2100:1, which has been proven to vary between sex and lung size.
- In cases of more accurate BrAC devices, such as the Intoxilyzer. the form factor is increased and requires a permanent allocation.
- Testing requires replaceable parts.
3.3. Bodily Fluid Testing
3.3.1. Advantages
- Blood headspace GC is the most accurate method of measuring ethanol levels in the blood—Gold standard
- Small sample volume required for testing
- Storage of samples allows for delayed analysis without compromising the sample quality
- Sample kits for urine, saliva, and breast milk are readily available in retail outlets at an affordable price
- Urine and breast-milk tests yield representative results in a short time (1.5–2 h)
- The patient needs to be conscious to collect the samples.
3.3.2. Disadvantages
- Blood testing is an invasive procedure, risking infection
- Very expensive equipment, specifically the GC
- The accuracy of saliva and breast-milk samples is questionable in terms of real-time ethanol levels
- Alcohol detected in urine samples represents the average exposure to ethanol during the time of urine collection in the bladder.
3.4. Intoxication Estimation Algorithms
3.4.1. Advantages
- Behavior analysis allows for classification of intoxicated actions or tick, independently of a sensing element
- Noninvasive method of measurement
- Possibility of incorporating into wearable devices equipped with PPG sensors
- Possibility of incorporating these systems into vehicles.
3.4.2. Disadvantages
- Many of the methods only serve as estimates tracking another quantity changing with intoxication, the impact of intoxication on individual is not considered
- A room for error from false positives originating from general behavior
- Skin impedance shows low correlation results, with only strong correlation being impossible to incorporate into everyday life.
3.5. Transdermal Sensors
3.5.1. Advantages
- Small form factors, and portable for most of the devices
- Noninvasive method, sensing ethanol in the sweat
- Monitoring the patients over long periods of time, establishing intoxication profiles
- Large potential for personal monitoring and intoxication studies applications
- Incorporated with wireless communications.
3.5.2. Disadvantages
- Most of the devices available are experimental and conceptual devices, except SCRAM bracelet
- Cannot isolate the value of BAC at a specific point in time, average over time only
- Delay between absorption in the blood and release of ethanol in the sweat
- Must be worn continuously/over long periods of time to establish readings
- Enzymatic based sensors require cartridge replacement.
3.6. Optical Spectroscopy
3.6.1. Advantages
- Complete noninvasive blood alcohol measurement
- No requirement for regular component replacement
- Very fast acquisition time
- Potential for simultaneous analysis of other analytes
- NIR radiation is unaffected by skin pigmentation
- Wearable device implementations.
3.6.2. Disadvantages
- Mostly large devices, with high power requirements
- Very expensive to develop/purchase, specifically for TT2500
- Highly susceptible to error due to difference in skin thickness (path length)
- Reflectance spectroscopy is significantly less accurate than transmittance spectroscopy, hence wearable implementations are difficult.
4. Discussion
Future Prospects of Intoxication Sensing Technology
5. Conclusions
Author Contributions
Funding
Institutional Review Board Statement
Informed Consent Statement
Data Availability Statement
Conflicts of Interest
References
- Tavolacci, M.-P.; Berthon, Q.; Cerasuolo, D.; Dechelotte, P.; Ladner, J.; Baguet, A. Does binge drinking between the age of 18 and 25 years predict alcohol dependence in adulthood? A retrospective case–control study in France. BMJ Open 2019, 9, e026375. [Google Scholar] [CrossRef]
- Connor, J. Alcohol consumption as a cause of cancer. Addiction 2017, 112, 222–228. [Google Scholar] [CrossRef]
- Murphy, A. Reported Road Casualties in Great Britain: 2019 Annual Report; HM Department for Transport: London, UK, 2020. Available online: https://www.gov.uk/government/ (accessed on 13 March 2022).
- Heatley, M.K.; Crane, J. The blood alcohol concentration at post-mortem in 175 fatal cases of alcohol intoxication. Med. Sci. Law 1990, 30, 101–105. [Google Scholar] [CrossRef] [PubMed]
- Rehm, J. The risks associated with alcohol use and alcoholism. Alcohol. Res. Health 2011, 34, 135–143. [Google Scholar] [PubMed]
- Evans, I.; Heron, J.; Murray, J.; Hickman, M.; Hammerton, G. The Influence of Alcohol Consumption on Fighting, Shoplifting and Vandalism in Young Adults. Int. J. Environ. Res. Public Health 2021, 18, 3509. [Google Scholar] [CrossRef]
- The Costs of Alcohol to Society. Institute of Alcohol Studies. 2020. Available online: www.ias.org.uk|@InstAlcStud (accessed on 13 March 2022).
- Thavorncharoensap, M.; Teerawattananon, Y.; Yothasamut, J.; Lertpitakpong, C.; Chaikledkaew, U. The economic impact of alcohol consumption: A systematic review. Subst. Abus. Treat. Prev. Policy 2009, 4, 20. [Google Scholar] [CrossRef]
- Borges, G.; Bagge, C.; Cherpitel, C.J.; Conner, K.; Orozco, R.; Rossow, I. A meta-analysis of acute use of alcohol and the risk of suicide attempt. Psychol. Med. 2017, 47, 949–957. [Google Scholar] [CrossRef] [PubMed]
- Olsen, R.W.; Liang, J. Role of GABAA receptors in alcohol use disorders suggested by chronic intermittent ethanol (CIE) rodent model. Mol. Brain 2017, 10, 45. [Google Scholar] [CrossRef] [PubMed]
- Chapp, A.D.; Mermelstein, P.G.; Thomas, M.J. The ethanol metabolite acetic acid activates mouse nucleus accumbens shell medium spiny neurons. J. Neurophysiol. 2021, 125, 620–627. [Google Scholar] [CrossRef]
- National Statistics. Adult Substance Misuse Treatment Statistics 2020 to 2021: Report; HM Office for Health Improvement & Disparities, Department of Health and Social Care: London, UK, 2021.
- Widmark, E. Eine Mikromethode zur Bestimmung von Athylalkohol im Blut. Biochem. Z. 1922, 131, 473–484. [Google Scholar]
- Borkenstein, R.F.; Smith, H.W. The Breathalyzer and its Applications. Med. Sci. Law 1961, 2, 13–22. [Google Scholar] [CrossRef]
- Dilley, J.; Nicholson, E.R.; Fischer, S.M.; Zimmer, R.; Froehlich, J.C. Alcohol Drinking and Blood Alcohol Concentration Revisited. Alcohol. Clin. Exp. Res. 2017, 42, 260–269. [Google Scholar] [CrossRef]
- Vonghia, L.; Leggio, L.; Ferrulli, A.; Bertini, M.; Gasbarrini, G.; Addolorato, G. Acute alcohol intoxication. Eur. J. Intern. Med. 2008, 19, 561–567. [Google Scholar] [CrossRef] [PubMed]
- Abrahao, K.P.; Salinas, A.G.; Lovinger, D.M. Alcohol and the Brain: Neuronal Molecular Targets, Synapses, and Circuits. Neuron 2017, 96, 1223–1238. [Google Scholar] [CrossRef]
- Thomasson, H.R. Gender Differences in Alcohol Metabolism Physiological Responses to Ethanol. In Recent Developments in Alcoholism; Springer: Berlin/Heidelberg, Germany, 2002; pp. 163–179. [Google Scholar]
- Cederbaum, A.I. Alcohol Metabolism. Clin. Liver Dis. 2012, 16, 667–685. [Google Scholar] [CrossRef]
- McGuire, L.C.; Cruickshank, A.M.; Munro, P.T. Alcoholic ketoacidosis. Emerg. Med. J. 2006, 23, 417–420. [Google Scholar] [CrossRef] [PubMed]
- Sasaki, S.; Yoshioka, E.; Saijo, Y.; Kita, T.; Okada, E.; Tamakoshi, A.; Kishi, R. Relation between alcohol consumption and arterial stiffness: A cross-sectional study of middle-aged Japanese women and men. Alcohol 2013, 47, 643–649. [Google Scholar] [CrossRef] [PubMed]
- Chartier, K.G.; Karriker-Jaffe, K.J.; Cummings, C.R.; Kendler, K.S. Review: Environmental influences on alcohol use: Informing research on the joint effects of genes and the environment in diverse U.S. populations. Am. J. Addict. 2017, 26, 446–460. [Google Scholar] [CrossRef]
- Edenberg, H.J.; Foroud, T. Genetics and alcoholism. Nat. Rev. Gastroenterol. Hepatol. 2013, 10, 487–494. [Google Scholar] [CrossRef]
- Bayard, M.; McIntyre, J.; Hill, K.R.; Woodside, J., Jr. Alcohol Withdrawal Syndrome. Am. Fam. Physician 2004, 69, 1443–1450. Available online: www.aafp.org/afp (accessed on 8 August 2022).
- Witkiewitz, K.; Litten, R.Z.; Leggio, L. Advances in the science and treatment of alcohol use disorder. Sci. Adv. 2019, 5, eaax4043. [Google Scholar] [CrossRef]
- Huebner, R.B.; Kantor, L.W. Advances in Alcoholism Treatment. Alcohol Res. Health 2011, 33, 295–299. [Google Scholar]
- Piano, M.R.; Mazzuco, A.; Kang, M.; Phillips, S.A. Cardiovascular Consequences of Binge Drinking: An Integrative Review with Implications for Advocacy, Policy, and Research. Alcohol. Clin. Exp. Res. 2017, 41, 487–496. [Google Scholar] [CrossRef] [PubMed]
- Iakunchykova, O.; Averina, M.; Kudryavtsev, A.; Wilsgaard, T.; Soloviev, A.; Schirmer, H.; Cook, S.; Leon, D.A. Evidence for a Direct Harmful Effect of Alcohol on Myocardial Health: A Large Cross-Sectional Study of Consumption Patterns and Cardiovascular Disease Risk Biomarkers From Northwest Russia, 2015 to 2017. J. Am. Heart Assoc. 2020, 9, e014491. [Google Scholar] [CrossRef]
- Michalopoulos, G.K.; Bhushan, B. Liver regeneration: Biological and pathological mechanisms and implications. Nat. Rev. Gastroenterol. Hepatol. 2021, 18, 40–55. [Google Scholar] [CrossRef] [PubMed]
- Donohue, T.M.; Kharbanda, K.K.; Osna, N.A. Alcoholic Liver Disease: Pathogenesis and Current Management. Alcohol. Res. Curr. Rev. 2017, 38, 147–161. [Google Scholar]
- Loconte, N.K.; Brewster, A.M.; Kaur, J.S.; Merrill, J.K.; Alberg, A.J. Alcohol and cancer: A statement of the American Society of Clinical Oncology. J. Clin. Oncol. 2017, 36, 83–93. [Google Scholar] [CrossRef]
- Rumgay, H.; Shield, K.; Charvat, H.; Ferrari, P.; Sornpaisarn, B.; Obot, I.; Islami, F.; Lemmens, V.E.P.P.; Rehm, J.; Soerjomataram, I. Global burden of cancer in 2020 attributable to alcohol consumption: A population-based study. Lancet Oncol. 2021, 22, 1071–1080. [Google Scholar] [CrossRef]
- Widmark, E.; Tandberg, J. Uber die Bedingungen fiir die Akkumulation indifferenter narkotika. Theoretische Berechnungen. Biochem. Z. 1924, 147, 358–389. [Google Scholar]
- Baraona, E.; Abittan, C.S.; Dohmen, K.; Moretti, M.; Pozzato, G.; Chayes, Z.W.; Schaefer, C.; Lieber, C.S. Gender differences in pharmacokinetics of alcohol. Alcohol. Clin. Exp. Res. 2001, 24, 502–507. [Google Scholar] [CrossRef]
- Andréasson, R.; Jones, A.W. The life and work of Erik M. P. Widmark. Am. J. Forensic Med. Pathol. 1996, 17, 177–190. [Google Scholar] [CrossRef] [PubMed]
- Gullberg, R.G. Estimating the uncertainty associated with Widmark’s equation as commonly applied in forensic toxicology. Forensic Sci. Int. 2007, 172, 33–39. [Google Scholar] [CrossRef] [PubMed]
- Baldwin Arthur, D. Anstie’s Alcohol Limit. Am. J. Public Health 1977, 67, 679–681. [Google Scholar]
- Bogen, E. The Diagnosis of Drunkenness—A Quantitative Study of Acute Alcohol Intoxication. Calif. West. Med. 1927, 26, 778. [Google Scholar]
- Borkenstein, R.F. Breath Sampling, Storing and Processing Apparatus and Method. U.S. Patent 3,522,009, 28 July 1970. [Google Scholar]
- Wright, B.M.; Jones, T.P.; Jones, A.W. Breath Alcohol Analysis and the Blood: Breath Ratio. Med. Sci. Law 1975, 15, 205–210. [Google Scholar] [CrossRef] [PubMed]
- Simpson, G. Do Breath Tests Really Underestimate Blood Alcohol Concentration? J. Anal. Toxicol. 1989, 13, 120–123. [Google Scholar] [CrossRef]
- Hlastala, M.P.; Anderson, J. The Impact of Breathing Pattern and Lung Size on the Alcohol Breath Test. Ann. Biomed. Eng. 2007, 35, 264–272. [Google Scholar] [CrossRef] [PubMed]
- Langille, R.M.; Patrick, J. Precision of Breath Alcohol Testing in the Field using the Intoxilyzer® 5000C and the Paradox of Truncation. J. Can. Soc. Forensic Sci. 2006, 39, 55–64. [Google Scholar] [CrossRef]
- Sorbello, J.G.; Devilly, G.J.; Allen, C.; Hughes, L.R.; Brown, K. Fuel-cell breathalyser use for field research on alcohol intoxication: An independent psychometric evaluation. PeerJ 2018, 6, e4418. [Google Scholar] [CrossRef]
- Grandviewresearch.com. Global Breath Analyzers Market Size, Share Report, 2030. 2022. Available online: https://www.grandviewresearch.com/industry-analysis/breath-analyzer-market (accessed on 16 June 2022).
- Bihar, E.; Deng, Y.; Miyake, T.; Saadaoui, M.; Malliaras, G.G.; Rolandi, M. A Disposable paper breathalyzer with an alcohol sensing organic electrochemical transistor. Sci. Rep. 2016, 6, 27582. [Google Scholar] [CrossRef]
- Ljungblad, J.; Hök, B.; Allalou, A.; Pettersson, H. Passive in-vehicle driver breath alcohol detection using advanced sensor signal acquisition and fusion. Traffic Inj. Prev. 2017, 18, S31–S36. [Google Scholar] [CrossRef] [PubMed]
- Dubowski, K.M. Quality Assurance in Breath-Alcohol Analysis. J. Anal. Toxicol. 1994, 18, 306–311. [Google Scholar] [CrossRef]
- Legge, D. The influence of breath temperature on assessments of blood alcohol level by breath analysis. Q. J. Stud. Alcohol 1965, 26, 371–377. [Google Scholar] [CrossRef]
- Jones, A.W. How Breathing Technique Can Influence the Results of Breath-Alcohol Analysis. Med. Sci. Law 1982, 22, 275–280. [Google Scholar] [CrossRef]
- Mihretu, L.D.; Gebru, A.G.; Mekonnen, K.N.; Asgedom, A.G.; Desta, Y.H. Determination of ethanol in blood using headspace gas chromatography with flameionization detector (HS-GC-FID): Validation of a method. Cogent Chem. 2020, 6, 1760187. [Google Scholar] [CrossRef]
- Charlebois, R.C.; Corbett, M.R.; Wigmore, J.G. Comparison of Ethanol Concentrations in Blood, Serum, and Blood Cells for Forensic Application. J. Anal. Toxicol. 1996, 20, 171–178. [Google Scholar] [CrossRef] [PubMed]
- Rockerbie, R.A. Alcohol and Drug Intoxication; Trafford: Bloomington, IN, USA, 1999. [Google Scholar]
- Tagliaro, F.; Lubli, G.; Ghielmi, S.; Franchi, D.; Marigo, M. Review Chromatographic methods for blood alcohol determination. J. Chromatogr. B Biomed. Sci. Appl. 1992, 580, 161–190. [Google Scholar] [CrossRef]
- Hess, J.R. Conventional blood banking and blood component storage regulation: Opportunities for improvement. Blood Transfus. 2010, 8, S9. [Google Scholar] [CrossRef] [PubMed]
- Jones, A.W.; Lindberg, L.; Olsson, S.-G. Magnitude and Time-Course of Arterio-Venous Differences in Blood-Alcohol Concentration in Healthy Men. Clin. Pharmacokinet. 2004, 43, 1157–1166. [Google Scholar] [CrossRef]
- Preedy, V.R.; Watson, R.R. Comprehensive Handbook of Alcohol Related Pathology—Methods for Determining Blood Alcohol Concentration: Current and Retrospective; Elsevier Academic: Amsterdam, The Netherlands, 2005. [Google Scholar]
- Wojcik, M.H.; Hawthorne, J.S. Sensitivity of commercial ethyl glucuronide (ETG) testing in screening for alcohol abstinence. Alcohol Alcohol. 2007, 42, 317–320. [Google Scholar] [CrossRef]
- Tiscione, N.B.; Alford, I.; Yeatman, D.T.; Shan, X. Ethanol Analysis by Headspace Gas Chromatographywith Simultaneous Flame-Ionization and Mass Spectrometry Detection. J. Anal. Toxicol. 2011, 35, 501–511. [Google Scholar] [CrossRef] [PubMed]
- Peachey, J.E.; Kapur, B.M.; Frsc, D. Monitoring Drinking Behavior with the Alcohol Dipstick during Treatment. Alcohol. Clin. Exp. Res. 1986, 10, 663–666. [Google Scholar] [CrossRef]
- Pate, L.A.; Hamilton, J.D.; Park, R.S.; Strobel, R.M. Evaluation of a saliva alcohol test stick as a therapeutic adjunct in an alcoholism treatment program. J. Stud. Alcohol 1993, 54, 520–521. [Google Scholar] [CrossRef] [PubMed]
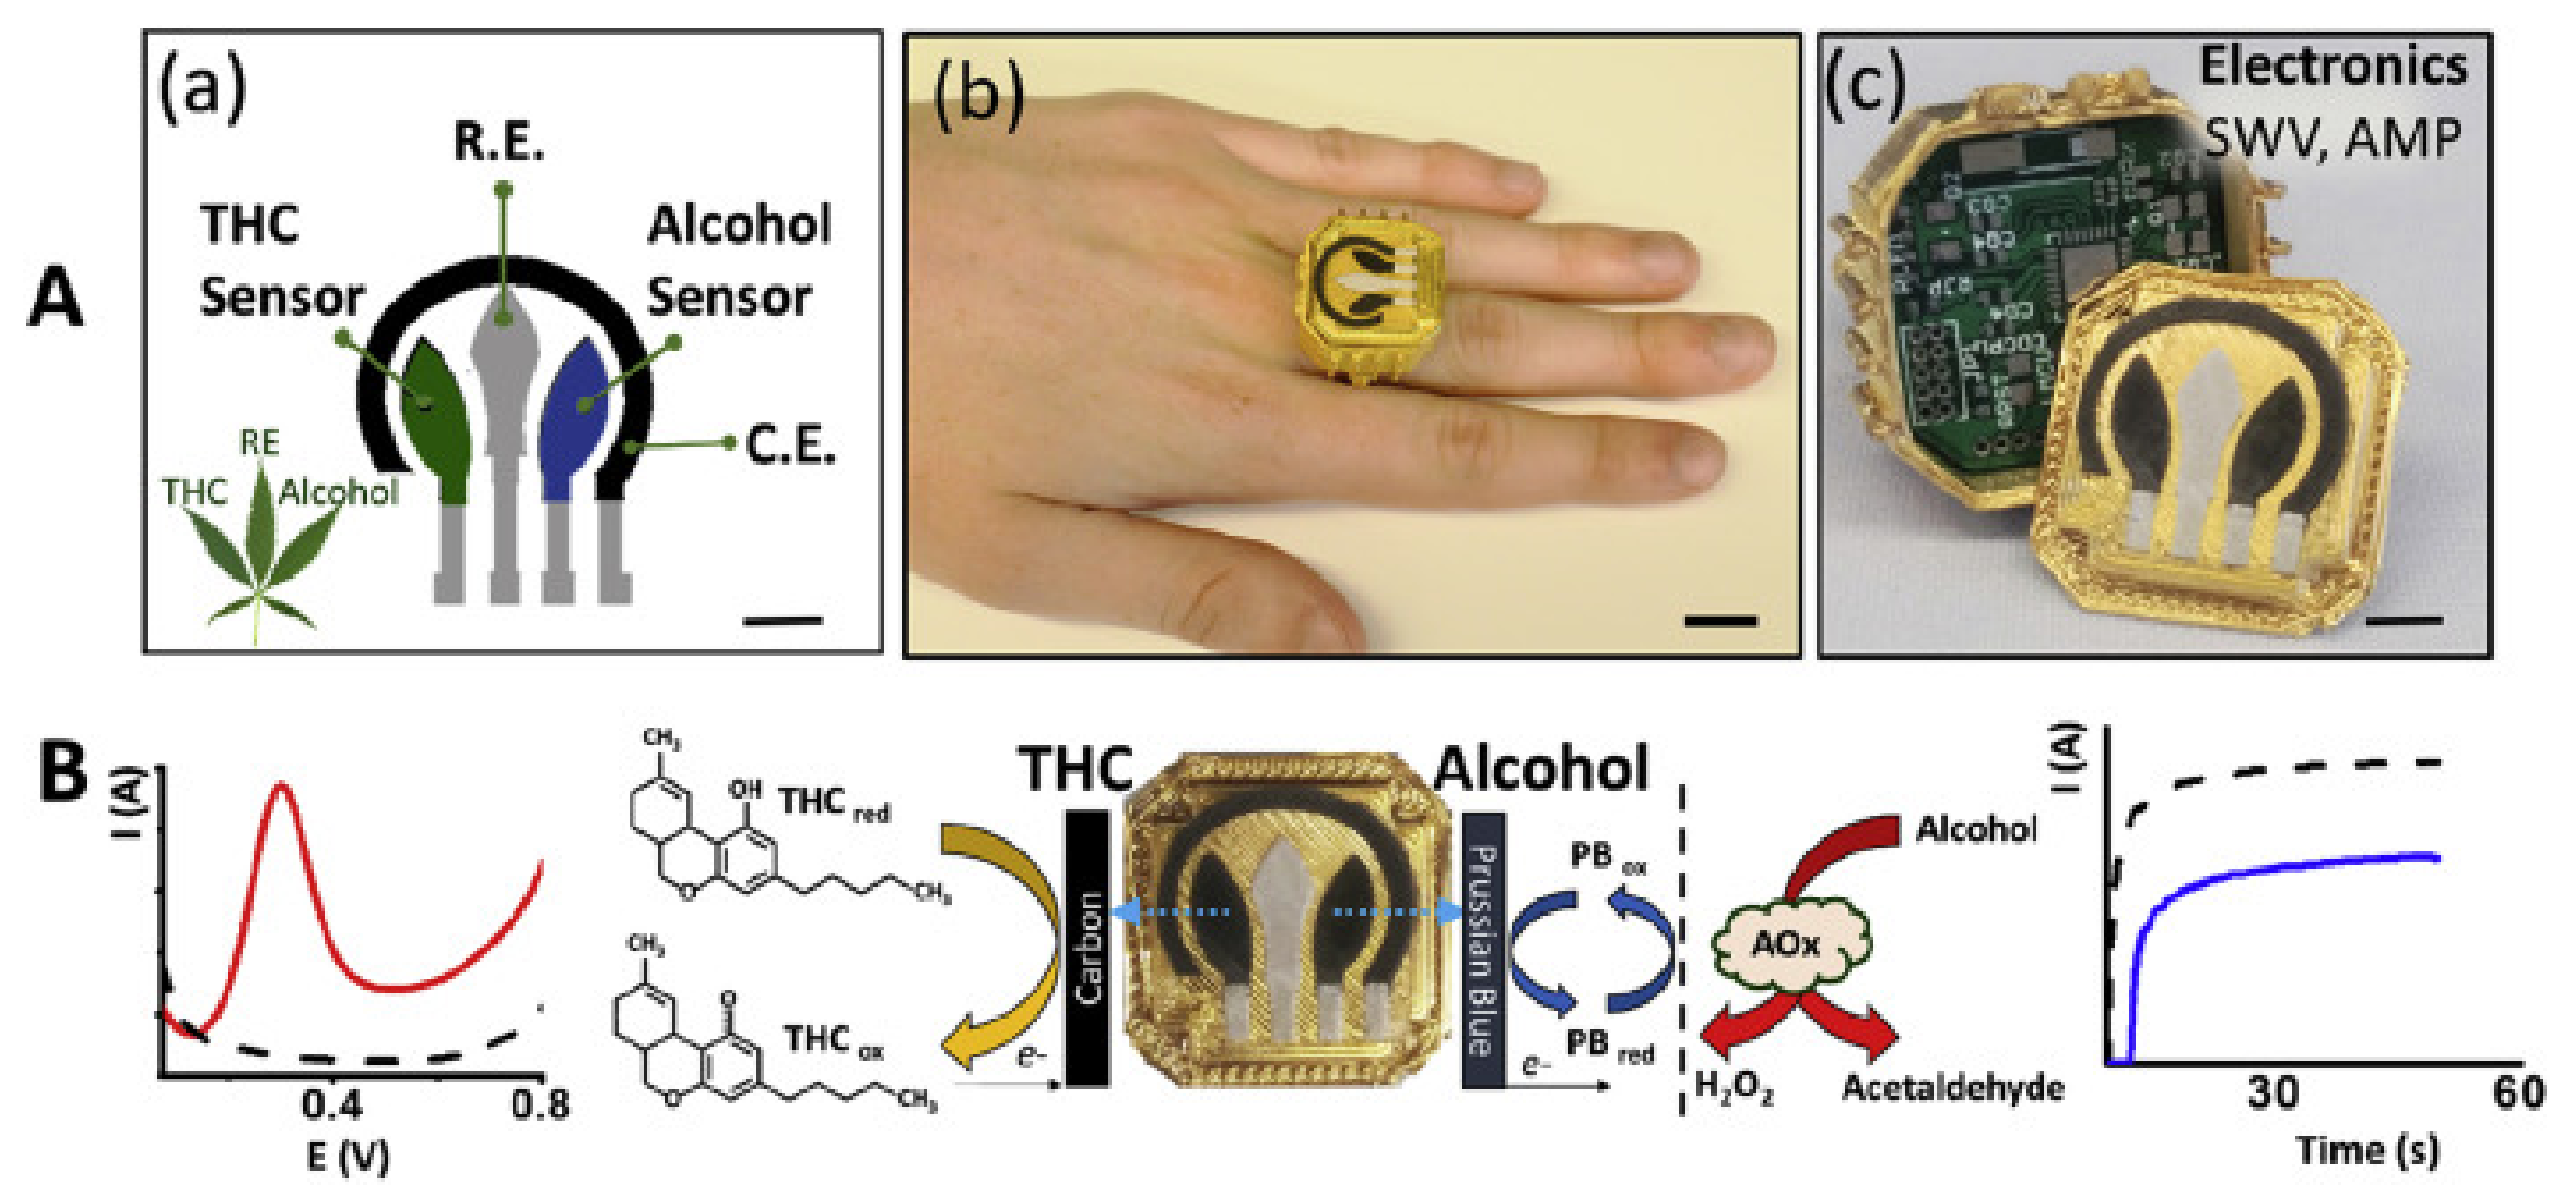
- Mishra, R.K.; Sempionatto, J.R.; Li, Z.; Brown, C.; Galdino, N.M.; Shah, R.; Liu, S.; Hubble, L.J.; Bagot, K.; Tapert, S.; et al. Simultaneous detection of salivary Δ9-tetrahydrocannabinol and alcohol using a Wearable Electrochemical Ring Sensor. Talanta 2020, 211, 120757. [Google Scholar] [CrossRef] [PubMed]
- Mennella, J.A. Regulation of Milk Intake After Exposure to Alcohol in Mothers’ Milk. Alcohol. Clin. Exp. Res. 2001, 25, 590–593. [Google Scholar]
- UpSpring Milkscreen Test for Alcohol in Breastmilk. Available online: https://www.myupspring.com/collections/shop-all/products/milkscreen (accessed on 1 July 2022).
- Fagnani, R.; de Lira, F.M.; Rosolem, C.P. Validation of strip tests for the rapid screening of ethanol residues in milk. J. Dairy Res. 2019, 86, 464–466. [Google Scholar] [CrossRef]
- DeGutis, L.C.; Rabinovici, R.; Sabbaj, A.; Mascia, R.; D’Onofrio, G. The Saliva Strip Test Is an Accurate Method to Determine Blood Alcohol Concentration in Trauma Patients. Acad. Emerg. Med. 2004, 11, 885–887. [Google Scholar] [CrossRef]
- Chen, Y.; Lin, C.; Lin, Y.; Zhao, C. Non-invasive detection of alcohol concentration based on photoplethysmogram signals. IET Image Process. 2018, 12, 188–193. [Google Scholar] [CrossRef]
- Wang, W.-F.; Yang, C.-Y.; Wu, Y.-F. SVM-based classification method to identify alcohol consumption using ECG and PPG monitoring. Pers. Ubiquitous Comput. 2018, 22, 275–287. [Google Scholar] [CrossRef]
- Rachakonda, L.; Mohanty, S.P.; Kougianos, E.; Sayeed, M.A. Smart-Steering: An IoMT-Device to Monitor Blood Alcohol Concentration using Physiological Signals. In Proceedings of the 2020 IEEE International Conference on Consumer Electronics (ICCE), Las Vegas, NV, USA, 4–6 January 2020. [Google Scholar]
- Kubicek, J.; Vilimek, D.; Krestanova, A.; Penhaker, M.; Kotalova, E.; Faure-Brac, B.; Noel, C.; Scurek, R.; Augustynek, M.; Cerny, M.; et al. Prediction Model of Alcohol Intoxication from Facial Temperature Dynamics Based on K-Means Clustering Driven by Evolutionary Computing. Symmetry 2019, 11, 995. [Google Scholar] [CrossRef]
- Piano Mariann, R. Alcohol’s Effects on the Cardiovascular System. Alcohol Res. 2017, 38, 219–241. [Google Scholar]
- Volvo. Volvo Cars to Deploy in-Car Cameras and Intervention against Intoxication, Distraction. 2019. Available online: https://www.media.volvocars.com/global/en-gb/media/pressreleases/250015/volvo-cars-to-deploy-in-car-cameras-and-intervention-against-intoxication-distraction#:~:text=Volvo%20Cars%20believes%20intoxication%20and,involving%20serious%20injury%20or%20death (accessed on 16 June 2022).
- Tabakoff, B.; Cornell, N.; Hoffman, P.L. Alcohol tolerance. Ann. Emerg. Med. 1986, 15, 1005–1012. [Google Scholar] [CrossRef]
- Czaplik, M.; Ulbrich, M.; Hochhausen, N.; Rossaint, R.; Leonhardt, S. Evaluation of a new non-invasive measurement technique based on bioimpedance spectroscopy to estimate blood alcohol content: A pilot study. Biomed. Eng./Biomed. Tech. 2019, 64, 365–371. [Google Scholar] [CrossRef]
- Pinheiro, E.; Postolache, O.; Girão, P.S. Contactless Impedance Cardiography Using Embedded Sensors. Meas. Sci. Rev. 2013, 13, 157–164. [Google Scholar] [CrossRef]
- Teichmann, D.; Foussier, J.; Jia, J.; Leonhardt, S.; Walter, M. Noncontact Monitoring of Cardiorespiratory Activity by Electromagnetic Coupling. IEEE Trans. Biomed. Eng. 2013, 60, 2142–2152. [Google Scholar] [CrossRef]
- Marquez, J.C.; Seoane, F.; Valimaki, E.; Lindecrantz, K. Textile Electrodes in Electrical Bioimpedance Measurements—A Comparison with Conventional Ag/AgCl Electrodes. In Proceedings of the 31st Annual International Conference of the IEEE EMBS, Minneapolis, MN, USA, 2–6 September 2009. [Google Scholar]
- Berger, L.; Fendrich, M.; Jones, J.; Fuhrmann, D.; Plate, C.; Lewis, D. Ethyl glucuronide in hair and fingernails as a long-term alcohol biomarker. Addiction 2014, 109, 425–431. [Google Scholar] [CrossRef]
- Swift, R.M.; Martin, C.S.; Swette, L.; LaConti, A.; Kackley, N. Studies on a Wearable, Electronic, Transdermal Alcohol Sensor. Alcohol. Clin. Exp. Res. 1992, 16, 721–725. [Google Scholar] [CrossRef]
- Davis-Martin Rachel, E.; Alessi Sheila, M.; Boudreaux Edwin, D. Alcohol Use Disorder in the Age of Technology: A Review of Wearable Biosensors in Alcohol Use Disorder Treatment. Front. Psychiatry 2021, 12, 642813. [Google Scholar] [CrossRef]
- Kim, J.; Jeerapan, I.; Imani, S.; Cho, T.N.; Bandodkar, A.; Cinti, S.; Mercier, P.P.; Wang, J. Noninvasive Alcohol Monitoring Using a Wearable Tattoo-Based Iontophoretic-Biosensing System. ACS Sens. 2016, 1, 1011–1019. [Google Scholar] [CrossRef]
- Leonard, N.R.; Silverman, M.; Sherpa, D.P.; Naegle, M.A.; Kim, H.; Coffman, D.L.; Ferdschneider, M. Mobile Health Technology Using a Wearable Sensorband for Female College Students With Problem Drinking: An Acceptability and Feasibility Study. JMIR Mhealth Uhealth 2017, 5, e7399. [Google Scholar] [CrossRef]
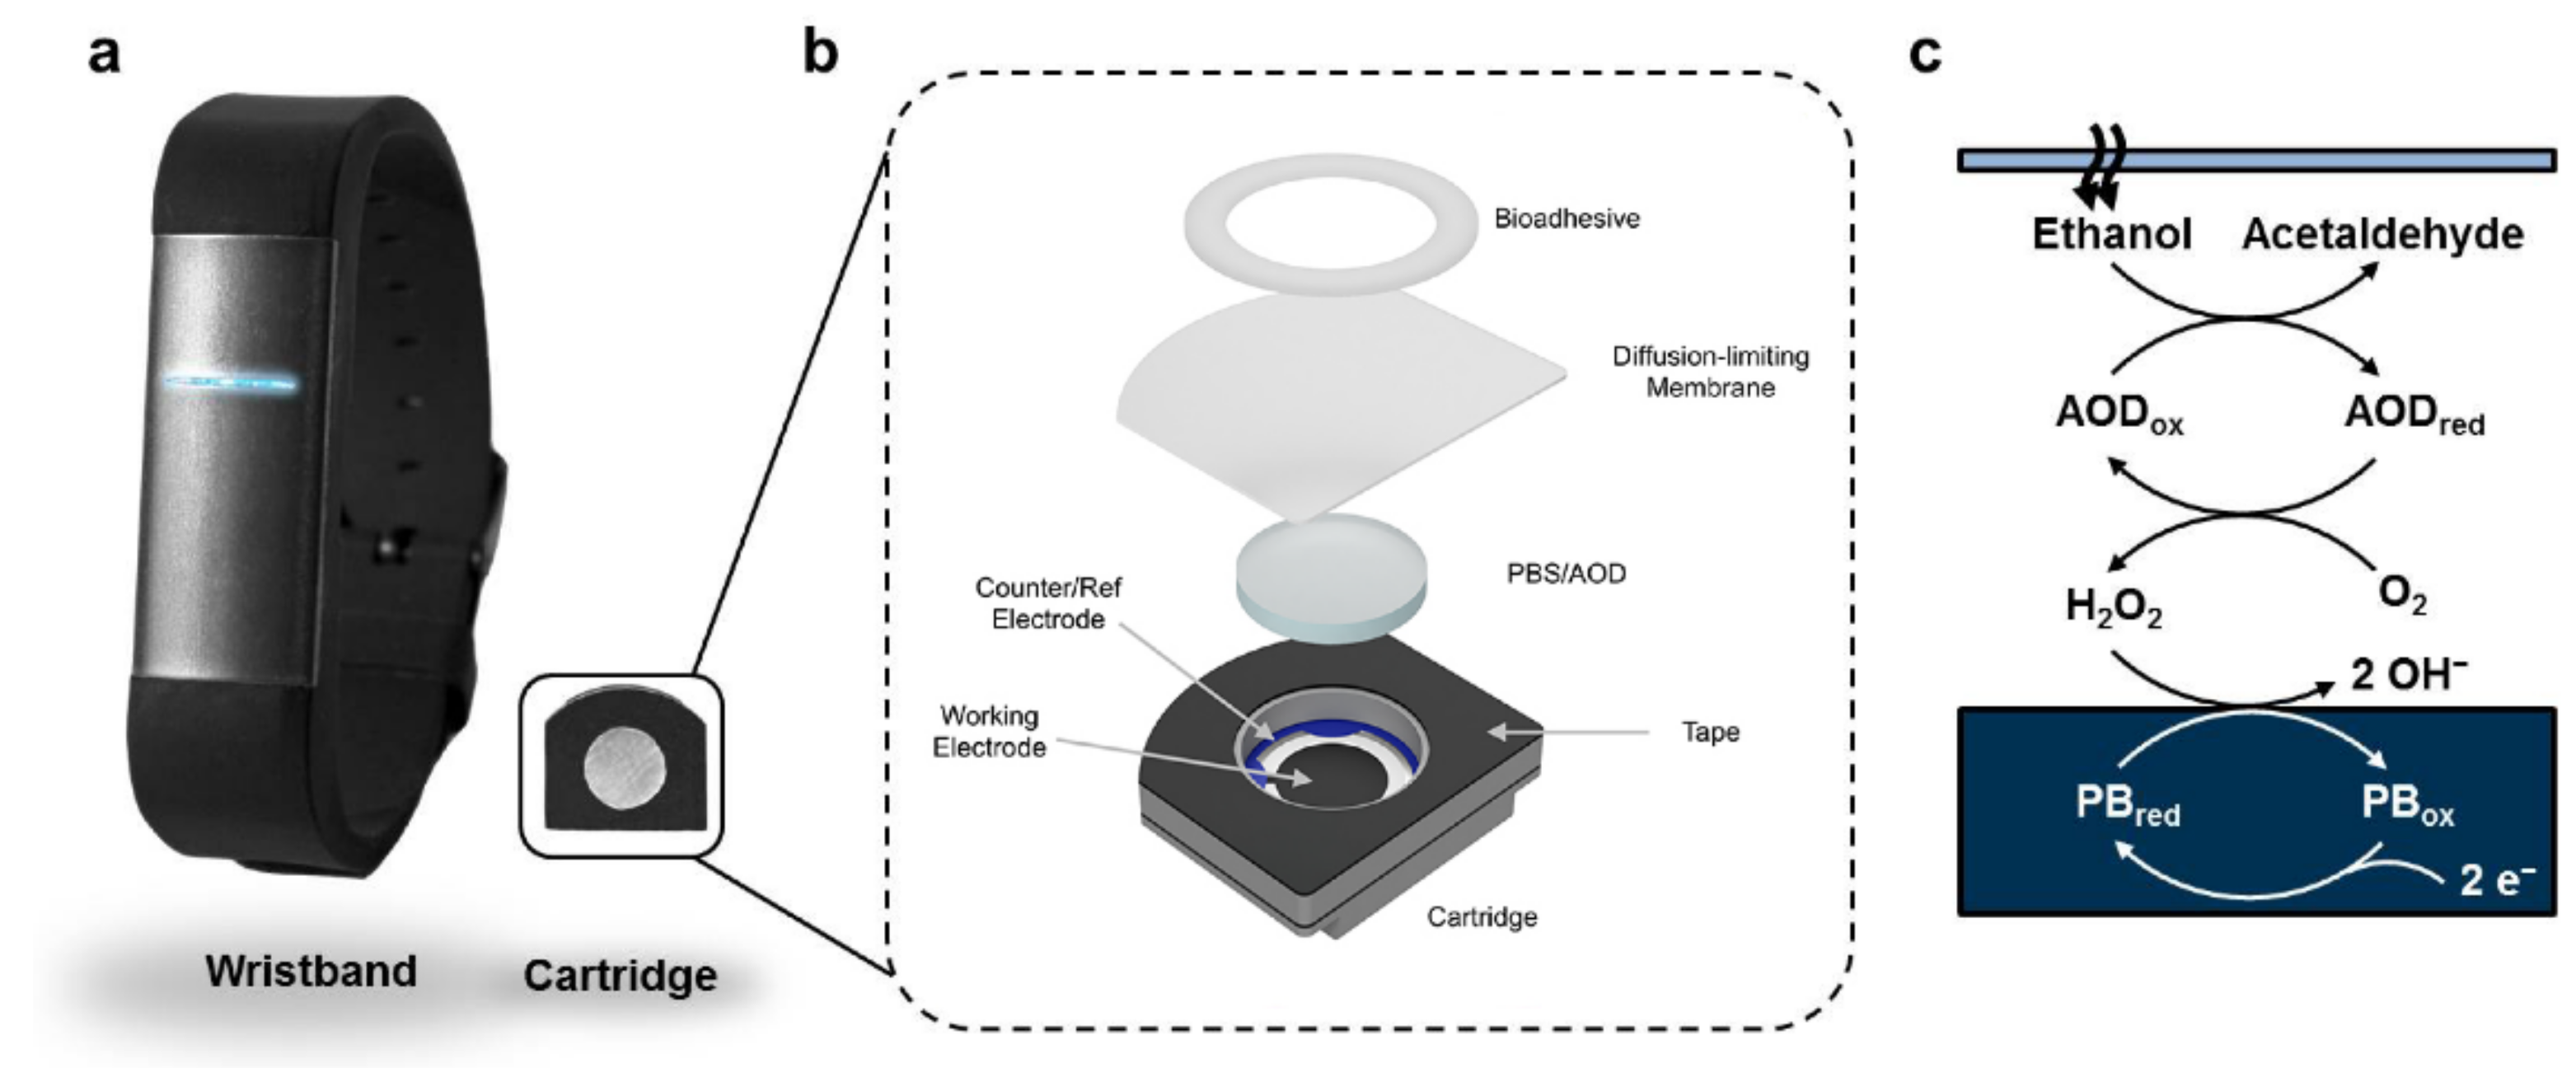
- Lansdorp, B.; Ramsay, W.; Hamid, R.; Strenk, E. Wearable Enzymatic Alcohol Biosensor. Sensors 2019, 19, 2380. [Google Scholar] [CrossRef] [PubMed]
- Arakawa, T.; Aota, T.; Iitani, K.; Toma, K.; Iwasaki, Y.; Mitsubayashi, K. Skin ethanol gas measurement system with a biochemical gas sensor and gas concentrator toward monitoring of blood volatile compounds. Talanta 2020, 219, 121187. [Google Scholar] [CrossRef] [PubMed]
- Selvam, A.P.; Muthukumar, S.; Kamakoti, V.; Prasad, S. A wearable biochemical sensor for monitoring alcohol consumption lifestyle through Ethyl glucuronide (EtG) detection in human sweat. Sci. Rep. 2016, 6, 23111. [Google Scholar] [CrossRef]
- Walsham, N.E.; A Sherwood, R. Ethyl glucuronide. Ann. Clin. Biochem. 2012, 49, 110–117. [Google Scholar] [CrossRef][Green Version]
- Venugopal, M.; Feuvrel, K.E.; Mongin, D.; Bambot, S.; Faupel, M.; Panangadan, A.; Talukder, A.; Pidva, R. Clinical Evaluation of a Novel Interstitial Fluid Sensor System for Remote Continuous Alcohol Monitoring. IEEE Sens. J. 2008, 8, 71–80. [Google Scholar] [CrossRef]
- Wang, P.M.; Cornwell, M.; Prausnitz, M.R. Minimally Invasive Extraction of Dermal Interstitial Fluid for Glucose Monitoring Using Microneedles. Diabetes Technol. Ther. 2005, 7, 131–141. [Google Scholar] [CrossRef]
- Schmitt, V. Sampling and Pharmacokinetics of Skin Interstitial Fluid for Therapeutically Monitored Drugs. Doctoral Thesis, Pharmaceutical Sciences, The University of British Columbia, Vancouver, BC, Canada, 2015. [Google Scholar]
- Tehrani, F.; Teymourian, H.; Wuerstle, B.; Kavner, J.; Patel, R.; Furmidge, A.; Aghavali, R.; Hosseini-Toudeshki, H.; Brown, C.; Zhang, F.; et al. An integrated wearable microneedle array for the continuous monitoring of multiple biomarkers in interstitial fluid. Nat. Biomed. Eng. 2022, 1–11. [Google Scholar] [CrossRef]
- Fairbairn, C.E.; Bosch, N. A new generation of transdermal alcohol biosensing technology: Practical applications, machine-learning analytics and questions for future research. Addiction 2021, 116, 2912–2920. [Google Scholar] [CrossRef]
- Van Egmond, K.; Wright, C.J.C.; Livingston, M.; Kuntsche, E. Wearable Transdermal Alcohol Monitors: A Systematic Review of Detection Validity, and Relationship Between Transdermal and Breath Alcohol Concentration and Influencing Factors. Alcohol. Clin. Exp. Res. 2020, 44, 1918–1932. [Google Scholar] [CrossRef] [PubMed]
- Gardner, C.M. Transmission versus reflectance spectroscopy for quantitation. J. Biomed. Opt. 2018, 23, 018001. [Google Scholar] [CrossRef]
- Boushel, R.; Langberg, H.; Olesen, J.; Gonzales-Alonzo, J.; Bülow, J.; Kjaer, M. Monitoring tissue oxygen availability with near infrared spectroscopy (NIRS) in health and disease. Scand. J. Med. Sci. Sports 2001, 11, 213–222. [Google Scholar] [CrossRef]
- Dai, J.; Ji, Z.; Du, Y.; Chen, S. In vivo noninvasive blood glucose detection using near-infrared spectrum based on the PSO-2ANN model. Technol. Health Care 2018, 26, S229–S239. [Google Scholar] [CrossRef]
- Heise, H.; Delbeck, S.; Marbach, R. Noninvasive Monitoring of Glucose Using Near-Infrared Reflection Spectroscopy of Skin—Constraints and Effective Novel Strategy in Multivariate Calibration. Biosensors 2021, 11, 64. [Google Scholar] [CrossRef] [PubMed]
- Ridder, T.D.; Steeg, B.J.V.; Vanslyke, S.J.; Way, J.F. Noninvasive NIR monitoring of interstitial ethanol concentration. In Optical Diagnostics and Sensing IX; SPIE: Bellingham, WA, USA, 2009; pp. 55–65. [Google Scholar] [CrossRef]
- Workman, J., Jr. The Handbook of Organic Compounds, Three Volume Set, Volume 1–3: NIR, IR, R, and UV-Vis Spectra Featuring Polymers and Surfactants, 1st ed.; Academic Press: Cambridge, MA, USA, 2000. [Google Scholar]
- Ridder, T. Noninvasive Determination of Alcohol in Tissue. U.S. Patent 7,403,804 B2, 22 July 2008. [Google Scholar]
- Ridder, T.D.; Steeg, B.J.V.; Laaksonen, B.D.; Radigan, W.T. Robust Calibration Transfer in Noninvasive Ethanol Measurements, Part II: Modification of Instrument Measurements by Incorporation of Expert Knowledge (MIMIK). Appl. Spectrosc. 2014, 68, 865–878. [Google Scholar] [CrossRef]
- Ridder, T.D.; Steeg, B.J.V.; Price, G.L. Robust Calibration Transfer in Noninvasive Ethanol Measurements, Part I: Mathematical Basis for Spectral Distortions in Fourier Transform Near-Infrared Spectroscopy (FT-NIR). Appl. Spectrosc. 2014, 68, 852–864. [Google Scholar] [CrossRef] [PubMed]
- Ridder, T.D.; Brown, C.D.; ver Steeg, B.J. Framework for Multivariate Selectivity Analysis, Part II: Experimental Applications. Appl. Spectrosc. 2005, 59, 804–815. [Google Scholar] [CrossRef] [PubMed]
- Brown, C.D.; Ridder, T.D. Framework for Multivariate Selectivity Analysis, Part I: Theoretical and Practical Merits. Appl. Spectrosc. 2005, 59, 787–803. [Google Scholar] [CrossRef]
- Liu, W.-F.; Liu, G.-L.; Wang, X.-F.; Bao, Y.-F.; Li, G.; Wang, H.-Q. Non-invasive measurement study of human blood alcohol concentration based on NIR dynamic spectrum. In Proceedings of the 2011 International Conference on Image Analysis and Signal Processing, Wuhan, China, 21–23 October 2011. [Google Scholar] [CrossRef]
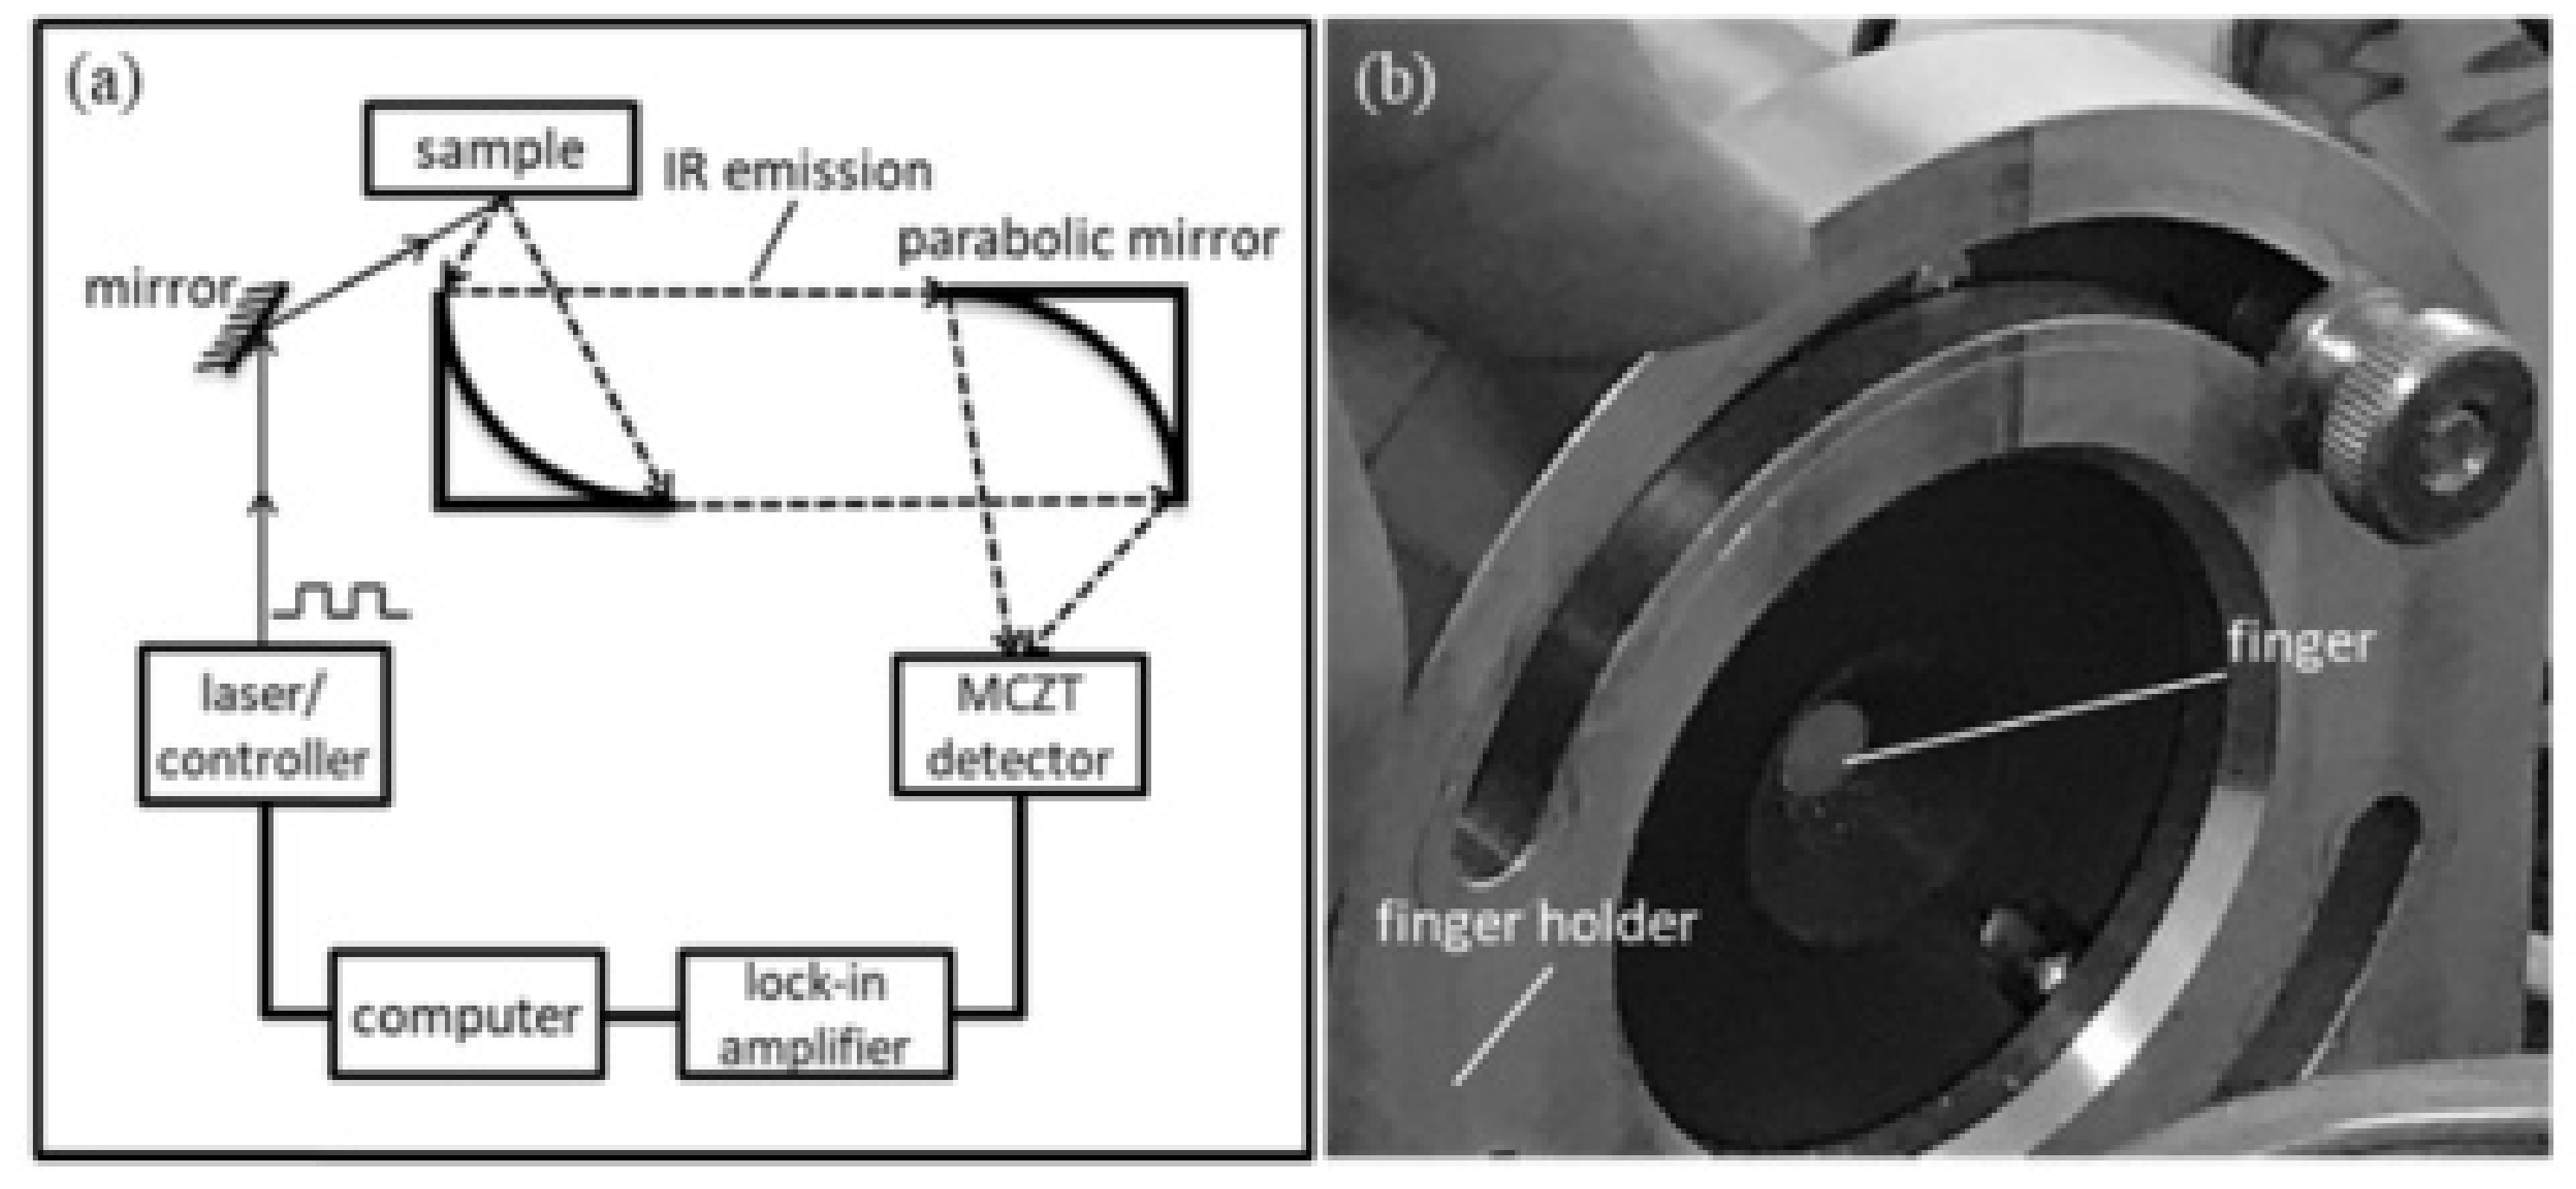
- Guo, X.; Shojaei-Asanjan, K.; Zhang, D.; Sivagurunathan, K.; Sun, Q.; Song, P.; Mandelis, A.; Chen, B.; Goledzinowski, M.; Zhou, Q.; et al. Highly sensitive and specific noninvasive in-vivo alcohol detection using wavelength-modulated differential photothermal radiometry. Biomed. Opt. Express 2018, 9, 4638–4648. [Google Scholar] [CrossRef] [PubMed]
- Yamakoshi, T.; Lee, J.; Matsumura, K.; Yamakoshi, Y.; Rolfe, P.; Kiyohara, D.; Yamakoshi, K.-I. Integrating Sphere Finger-Photoplethysmography: Preliminary Investigation towards Practical Non-Invasive Measurement of Blood Constituents. PLoS ONE 2015, 10, e0143506. [Google Scholar] [CrossRef]
- Rockley Photonics—Rockley Photonics Announces Shipment of VitalSpexTM Pro Biosensing Technology for Alcohol, Lactate, and Glucose Measurement. Available online: https://investors.rockleyphotonics.com/news/news-details/2022/Rockley-Photonics-Announces-Shipment-of-VitalSpex-Pro-Biosensing-Technology-for-Alcohol-Lactate-and-Glucose-Measurement/default.aspx (accessed on 30 June 2022).
- Memon, S.F.; Wang, R.; Strunz, B.; Chowdhry, B.S.; Pembroke, J.T.; Lewis, E. A Review of Optical Fibre Ethanol Sensors: Current State and Future Prospects. Sensors 2022, 22, 950. [Google Scholar] [CrossRef]
- Pathak, A.; Viphavakit, C. A review on all-optical fiber-based VOC sensors: Heading towards the development of promising technology. Sens. Actuators A Phys. 2022, 338, 113455. [Google Scholar] [CrossRef]
- Ridder, T.D.; Steeg, B.J.V.; Laaksonen, B.D. Comparison of spectroscopically measured tissue alcohol concentration to blood and breath alcohol measurements. J. Biomed. Opt. 2009, 14, 054039. [Google Scholar] [CrossRef]
- Woźniak, M.K.; Wiergowski, M.; Namieśnik, J.; Biziuk, M. Biomarkers of Alcohol Consumption in Body Fluids—Possibilities and Limitations of Application in Toxicological Analysis. Curr. Med. Chem. 2019, 26, 177–196. [Google Scholar] [CrossRef] [PubMed]
- Radun, I.; Ohisalo, J.; Rajalin, S.; Radun, J.E.; Wahde, M.; Lajunen, T. Alcohol Ignition Interlocks in All New Vehicles: A Broader Perspective. Traffic Inj. Prev. 2014, 15, 335–342. [Google Scholar] [CrossRef] [PubMed]
- Raghu, A.V.; Karuppanan, K.K.; Nampoothiri, J.; Pullithadathil, B. Wearable, Flexible Ethanol Gas Sensor Based on TiO2 Nanoparticles-Grafted 2D-Titanium Carbide Nanosheets. ACS Appl. Nano Mater. 2019, 2, 1152–1163. [Google Scholar] [CrossRef]
- Kim, K.; Kang, Y.; Bae, K.; Kim, J. Ethanol-sensing properties of cobalt porphyrin-functionalized titanium dioxide nanoparticles as chemiresistive materials that are integrated into a low power microheater. Micro Nano Syst. Lett. 2022, 10, 4. [Google Scholar] [CrossRef]
- Sau, S.; Chakraborty, S.; Das, T.; Pal, M. Ethanol Sensing Properties of Nanocrystalline α-MoO3. Front. Mater. 2019, 6, 285. [Google Scholar] [CrossRef]
- Cai, Z.; Park, S. Enhancement mechanisms of ethanol-sensing properties based on Cr2O3 nanoparticle-anchored SnO2 nanowires. J. Mater. Res. Technol. 2020, 9, 271–281. [Google Scholar] [CrossRef]


| No. | Device/Technique | Parameter | Type | Form Factor |
|---|---|---|---|---|
| 1 | Nicloux Flask | Chemical reaction | Bodily fluid testing | Flask/blood extraction |
| 2 | Widmark Flask | Chemical reaction | Bodily fluid testing | Flask/blood extraction |
| 3 | EBAC Equation | Estimation based on physiological factors | Early estimation method | Equation |
| 4 | Photovoltaic Assay | Color change based on oxidation level | Breath alcohol | Portable device |
| 5 | Intoxilyzer | Near-infrared spectroscopy | Breath alcohol | Benchtop device |
| 6 | Fuel-Cell Analyzer | Current generated by ethanol oxidation | Breath alcohol | Portable device |
| 7 | Semiconductor Breath Analyzer | Strip color change | Breath alcohol | Portable device |
| 8 | Ignition Interlock Breath Analyzer | Alcohol oxidation reaction—fuel cell | Breath alcohol | Portable device |
| 9 | Gas Chromatography | Evaporation and separation of components | Bodily fluid testing | Benchtop device |
| 10 | Headspace Gas Chromatography | Evaporation and separation of components | Bodily fluid testing | Benchtop device |
| 11 | Enzymatic Blood Testing | Strip color change | Modern estimation method | Strip test |
| 12 | EtG Test | Strip color change | Modern estimation method | Strip test |
| 13 | PPG Datum Line | Changes in PPG signal—systolic and diastolic | Physiological factor analysis | PPG analysis/modern estimation method |
| 14 | Face Heat-Map Distribution | IR image analysis of the forehead and nose | Physiological factor analysis | IR in-vehicle cameras |
| 15 | Volvo SPA2 Platform | Head position | Physiological factor analysis | In-vehicle cameras |
| 16 | Bioimpedance Spectroscopy | Impedance across the body, legs, and arms | Transdermal sensor | Experimental device/benchtop |
| 17 | SCRAM CAM | Alcohol in sweat | Transdermal sensor | Wristband |
| 18 | GinerWrist TAS | Alcohol in sweat | Transdermal sensor | Wristband |
| 19 | BACtrack Skyn | Alcohol in sweat | Transdermal sensor | Wristband |
| 20 | Proof | Alcohol in sweat | Transdermal sensor | Wristband |
| 21 | Quantic Tally | Alcohol in sweat | Transdermal sensor | Wristband |
| 22 | Iontophoretic Biosensing System | Stimulated emittance of ethanol from the skin | Transdermal sensor | Tattoo sticker |
| 23 | Enzymatic Biosensors | Enzymatic redox reaction | Transdermal sensors | Transdermal sensors |
| 24 | Biosniffer | Inert gas and fluorescence | Transdermal sensors | Benchtop device |
| 25 | EtG Sensor | By-product of ethanol metabolism | Transdermal sensor | Wristband |
| 26 | ISF Sensor | Extraction of ISF | Transdermal sensor | Wristband |
| 27 | ISF Microneedle Sensor | Sensing of ethanol in the ISF | Transdermal sensors | Skin-attachable patch |
| 28 | TTT1100 | Spectroscopic measurement of tissue | Optical tissue spectroscopy | Benchtop |
| 29 | TTT2500 | Spectroscopic measurement of tissue | Optical tissue spectroscopy | Benchtop |
| 30 | NIR Dynamic Spectrum | Spectroscopic measurement of tissue/physiological parameter | Optical tissue spectroscopy | Algorithm |
| 31 | Autoliv | Spectroscopic measurement of exhaled air | Optical breath spectroscopy | In-vehicle module |
| 32 | WD-DPTR | Spectroscopic measurement of tissue | Optical tissue spectroscopy | Benchtop device |
| 33 | Pulse Alcometry | Absorption of light at specific wavelengths and pulse variation | Optical tissue spectroscopy | PPG adaptation |
| 34 | THC and Alcohol Saliva Sensor | Saliva content reaction with electrodes | Bodily fluid testing | Ring |
| 35 | Breast-Milk Sensing | Strip color change | Bodily fluid testing | Strip test |
| 36 | Rockley Photonics VitaSpex Pro | Spectroscopic measurement of tissue | Optical tissue spectroscopy | Wristband |
| 37 | Hair Analysis | Detection of EtG and EtPA | Modern estimation method | Laboratory test |
| 38 | Nail Analysis | Detection of EtG and EtPA | Modern estimation method | Laboratory test |
| Author | Device/Technique | Year | Performance Summary | Reference |
|---|---|---|---|---|
| Widmark E.M.P. | Widmark flask | 1918 | First direct measure of ethanol blood concentrations | Early BrAC methods |
| Widmark E.M.P. et al. | EBAC equation | 1924 | Largely inaccurate by modern standards, error in the ranges of ±20% from true value | Widmark Flask and early BrAC methods |
| Brokenstein R.F. et al. | Breathalyzer (photovoltaic assay) | 1961 | Revolutionary device in the field of portable testing devices for intoxication, susceptible to environmental error and variance in lung volume across the population | Analysis of blood and bodily fluids |
| Mishra et al. | THC and ethanol saliva sensing ring | 2020 | Detection range: 0.1 to 1 mM (0.1 mM increments RSD of 1.5% (n = 5) Stable multianalyte sensing (THC) | Commercial BrAC device |
| Chen et al. | PPG datum line analysis | 2018 | 85% identification rate 18 ms processing and identification time | Commercial BrAC device |
| Wang et al. | ECG and PPG analysis | 2017 | 95% identification rate Only identifies if a subject is above 0.15 mg/dL | Commercial BrAC device |
| Rachakonda et al. | Multisensory steering wheel | 2020 | Detection between sober and intoxicated at 0.08 mg/dL Accuracy of 93% | No reference stated |
| Kubieck et al. | IR facial imaging | 2019 | No specific correlation number states Results indicate a very strong correlation between alcohol consumption and facial temperature distribution in all cases | No reference stated |
| Chaplik et al. | Bioimpedance spectroscopy | 2019 | Noticeable changes between intoxication and reference group Weak correlation with absolute impedance (r = 0.47) Sensitivity 92% Specificity 76% | Commercial BrAC device Blood-sample analysis (method unknown) |
| Wen-fei et al. | NIR dynamic spectrum | 2011 | Calibration set: R = 0.9672 Prediction set: R = 0.9384 Relative error between 0.6 and 9%, average error 3.26% | Hospital biochemical analysis |
| Yamakoshi et al. | Integrated sphere finger-PPG | 2015 | Lower SNR compared to traditional PPG acquisition method Sensitivity of 0.43 ± 0.29 | No reference (Pilot Study) |
| Kim et al. | Iontophoretic biosensing system | 2016 | Correlation recorded = 0.912 High specificity for ethanol Increased accuracy of the system at higher ethanol concentrations | FDA-approved commercial BrAC device |
| X. Guo et al. | Wavelength-modulated differential photometry | 2018 | High ethanol resolution: 5–6 mg/dL Lag of 10–15 between ISF and blood ethanol Correlation between 0.96 and 0.98 | Commercially available BrAC device |
| Lansborp et al. | Wearable enzymatic alcohol biosensor | 2019 | Linear sensor response between 0 and 0.05 mol/L Results of the sensor closely resemble those predicted by Widmark equation, however fall short during the decay stage, and generally underestimate ethanol readings | Widmark equation (BrAC device deemed impractical for application) |
| Arakawa et al. | Skin ethanol gas | 2020 | Strong correlation of 0.995 Range of estimation 73.9–112.1 ppb/cm2 Results demonstrate superiority over an ordinary biosniffer | No reference for intoxication measure stated |
| Results indicate strong correlation for at least 3 distinct levels of ethanol | ||||
| Selvam at al. | EtG biochemical sensor | 2016 | Ethanol detection in the range of 0.001–100 ug/L Lower sensitivity at 1 ug/L with gold electrodes compared to ZnO (sensitivity of 0.001ug/L) Three distinct levels of EtG identified Correlation of 0.97 | |
| Venugopal et al. | ISF sensor for remote continuous alcohol monitoring | 2008 | Generally strong correlation between 0.7203 to 0.866 Correlation between BrAc = 0.879 | BrAC device and blood testing |
| Tehrani et al. | Microneedle ISF Lactate/Ethanol and Glucose Sensor | 2022 | Low cross-talk between sensing elements Correlation of 0.94 | Commercially available BrAC device |
| Product | Stage in Development | Cost | Applications |
|---|---|---|---|
| Intoxilyzer (near-infrared spectroscopy) | Well established | High ($3.5k) | Forensic testing |
| Ljungblad et al. (Autoliv) | Prototypes in testing | — | Roadside safety |
| Urine alcohol test (strip) | Available to the general public | Low ($10–25) | Workstation monitoring |
| Gas chromatography | Gold standard | High ($50k) | Forensic analysis |
| Saliva alcohol sensing (strip) | Available to the general public | Low ($10–25) | Workstation monitoring |
| Headspace chromatography | Gold standard | High ($70k) | Forensic analysis |
| Breast-milk testing kits | Available to the general public | Low ($10–25) | Home and child well-being |
| Volvo SPA2 | In testing | — | Roadside safety |
| SCRAM CAM | Generally available | Medium ($450 monthly) | High-risk individual monitoring |
| TT1100 | Discontinued | — | Workstation monitoring |
| TTT2500 | Commercially available | High ($300 per week) | Workstation monitoring |
| TT Mark III | In testing | — | Roadside safety |
| Rockley PhotonicsVitalSpex | First prototype release expected in 2023 | — | Personal monitoring |
Publisher’s Note: MDPI stays neutral with regard to jurisdictional claims in published maps and institutional affiliations. |
© 2022 by the authors. Licensee MDPI, Basel, Switzerland. This article is an open access article distributed under the terms and conditions of the Creative Commons Attribution (CC BY) license (https://creativecommons.org/licenses/by/4.0/).
Share and Cite
Paprocki, S.; Qassem, M.; Kyriacou, P.A. Review of Ethanol Intoxication Sensing Technologies and Techniques. Sensors 2022, 22, 6819. https://doi.org/10.3390/s22186819
Paprocki S, Qassem M, Kyriacou PA. Review of Ethanol Intoxication Sensing Technologies and Techniques. Sensors. 2022; 22(18):6819. https://doi.org/10.3390/s22186819
Chicago/Turabian StylePaprocki, Szymon, Meha Qassem, and Panicos A Kyriacou. 2022. "Review of Ethanol Intoxication Sensing Technologies and Techniques" Sensors 22, no. 18: 6819. https://doi.org/10.3390/s22186819
APA StylePaprocki, S., Qassem, M., & Kyriacou, P. A. (2022). Review of Ethanol Intoxication Sensing Technologies and Techniques. Sensors, 22(18), 6819. https://doi.org/10.3390/s22186819