
Thought on Food: A Systematic Review of Current Approaches and Challenges for Food Intake Detection

 ,
,  ,
,  ,
,  ,
,  and
and 
Abstract
:1. Introduction
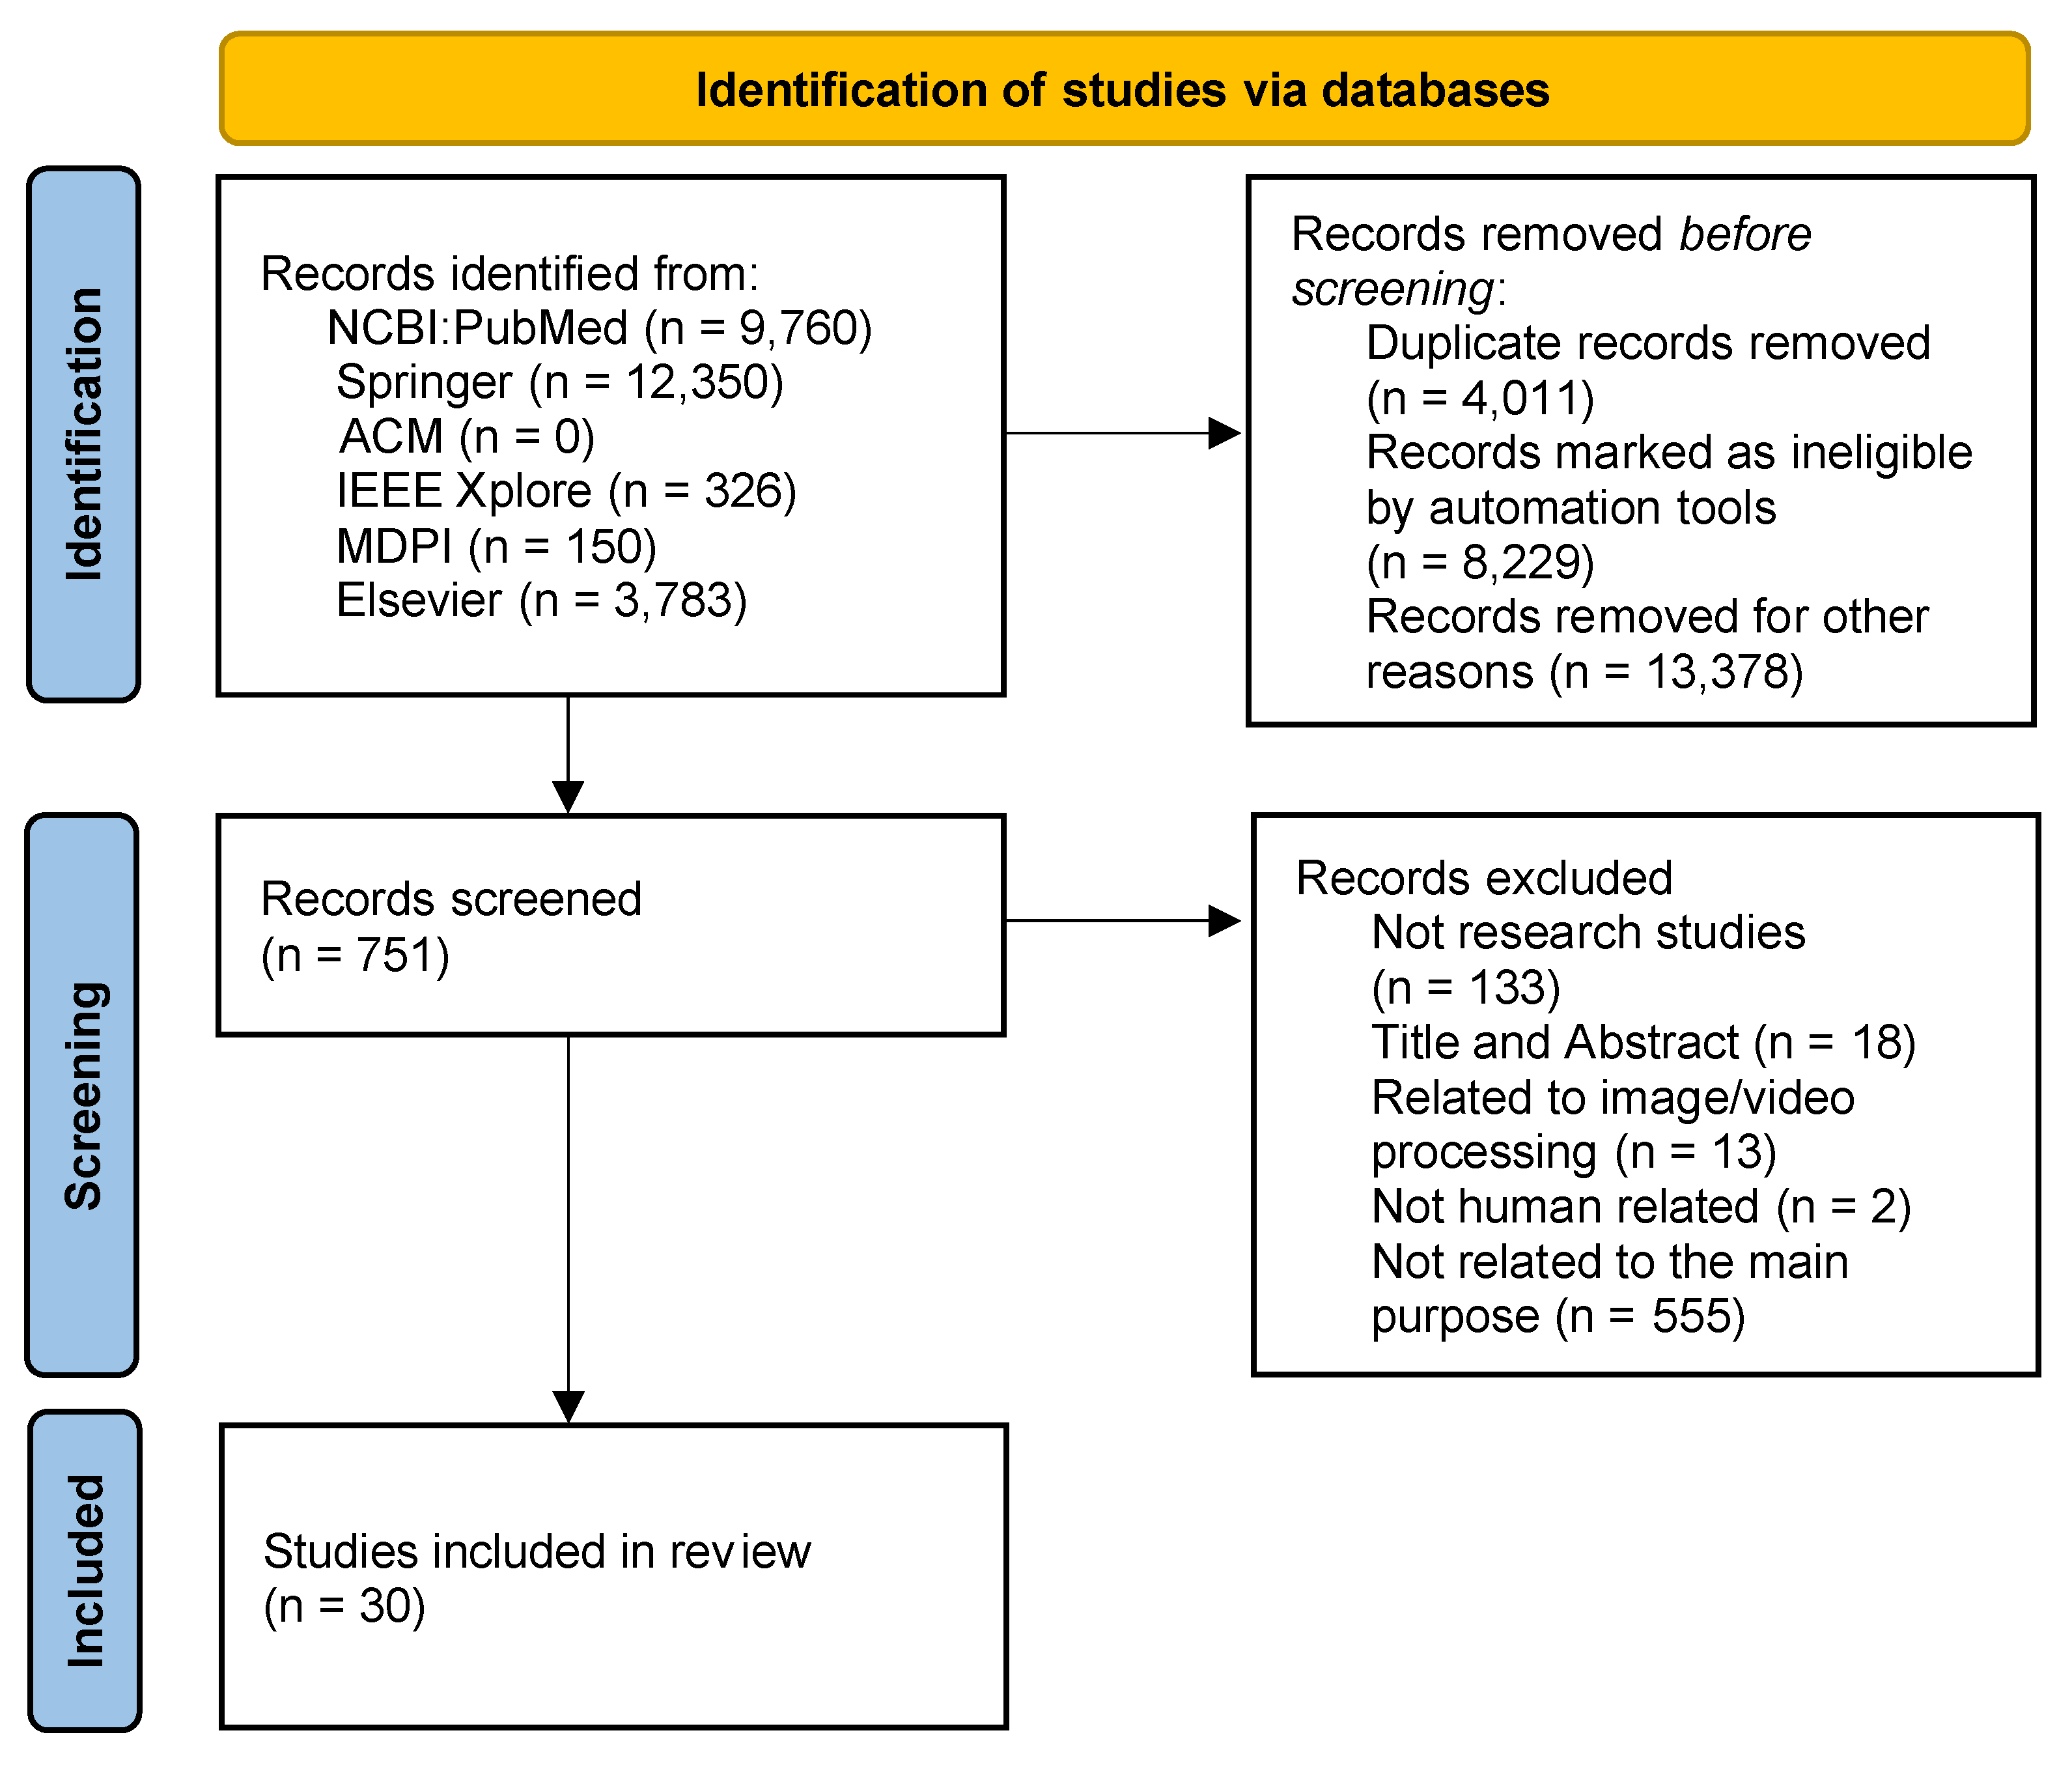
2. Methodology
2.1. Food Intake Detection
2.2. Research Questions
2.3. Inclusion Criteria
2.4. Search Strategy
2.5. Extraction of Study Characteristics
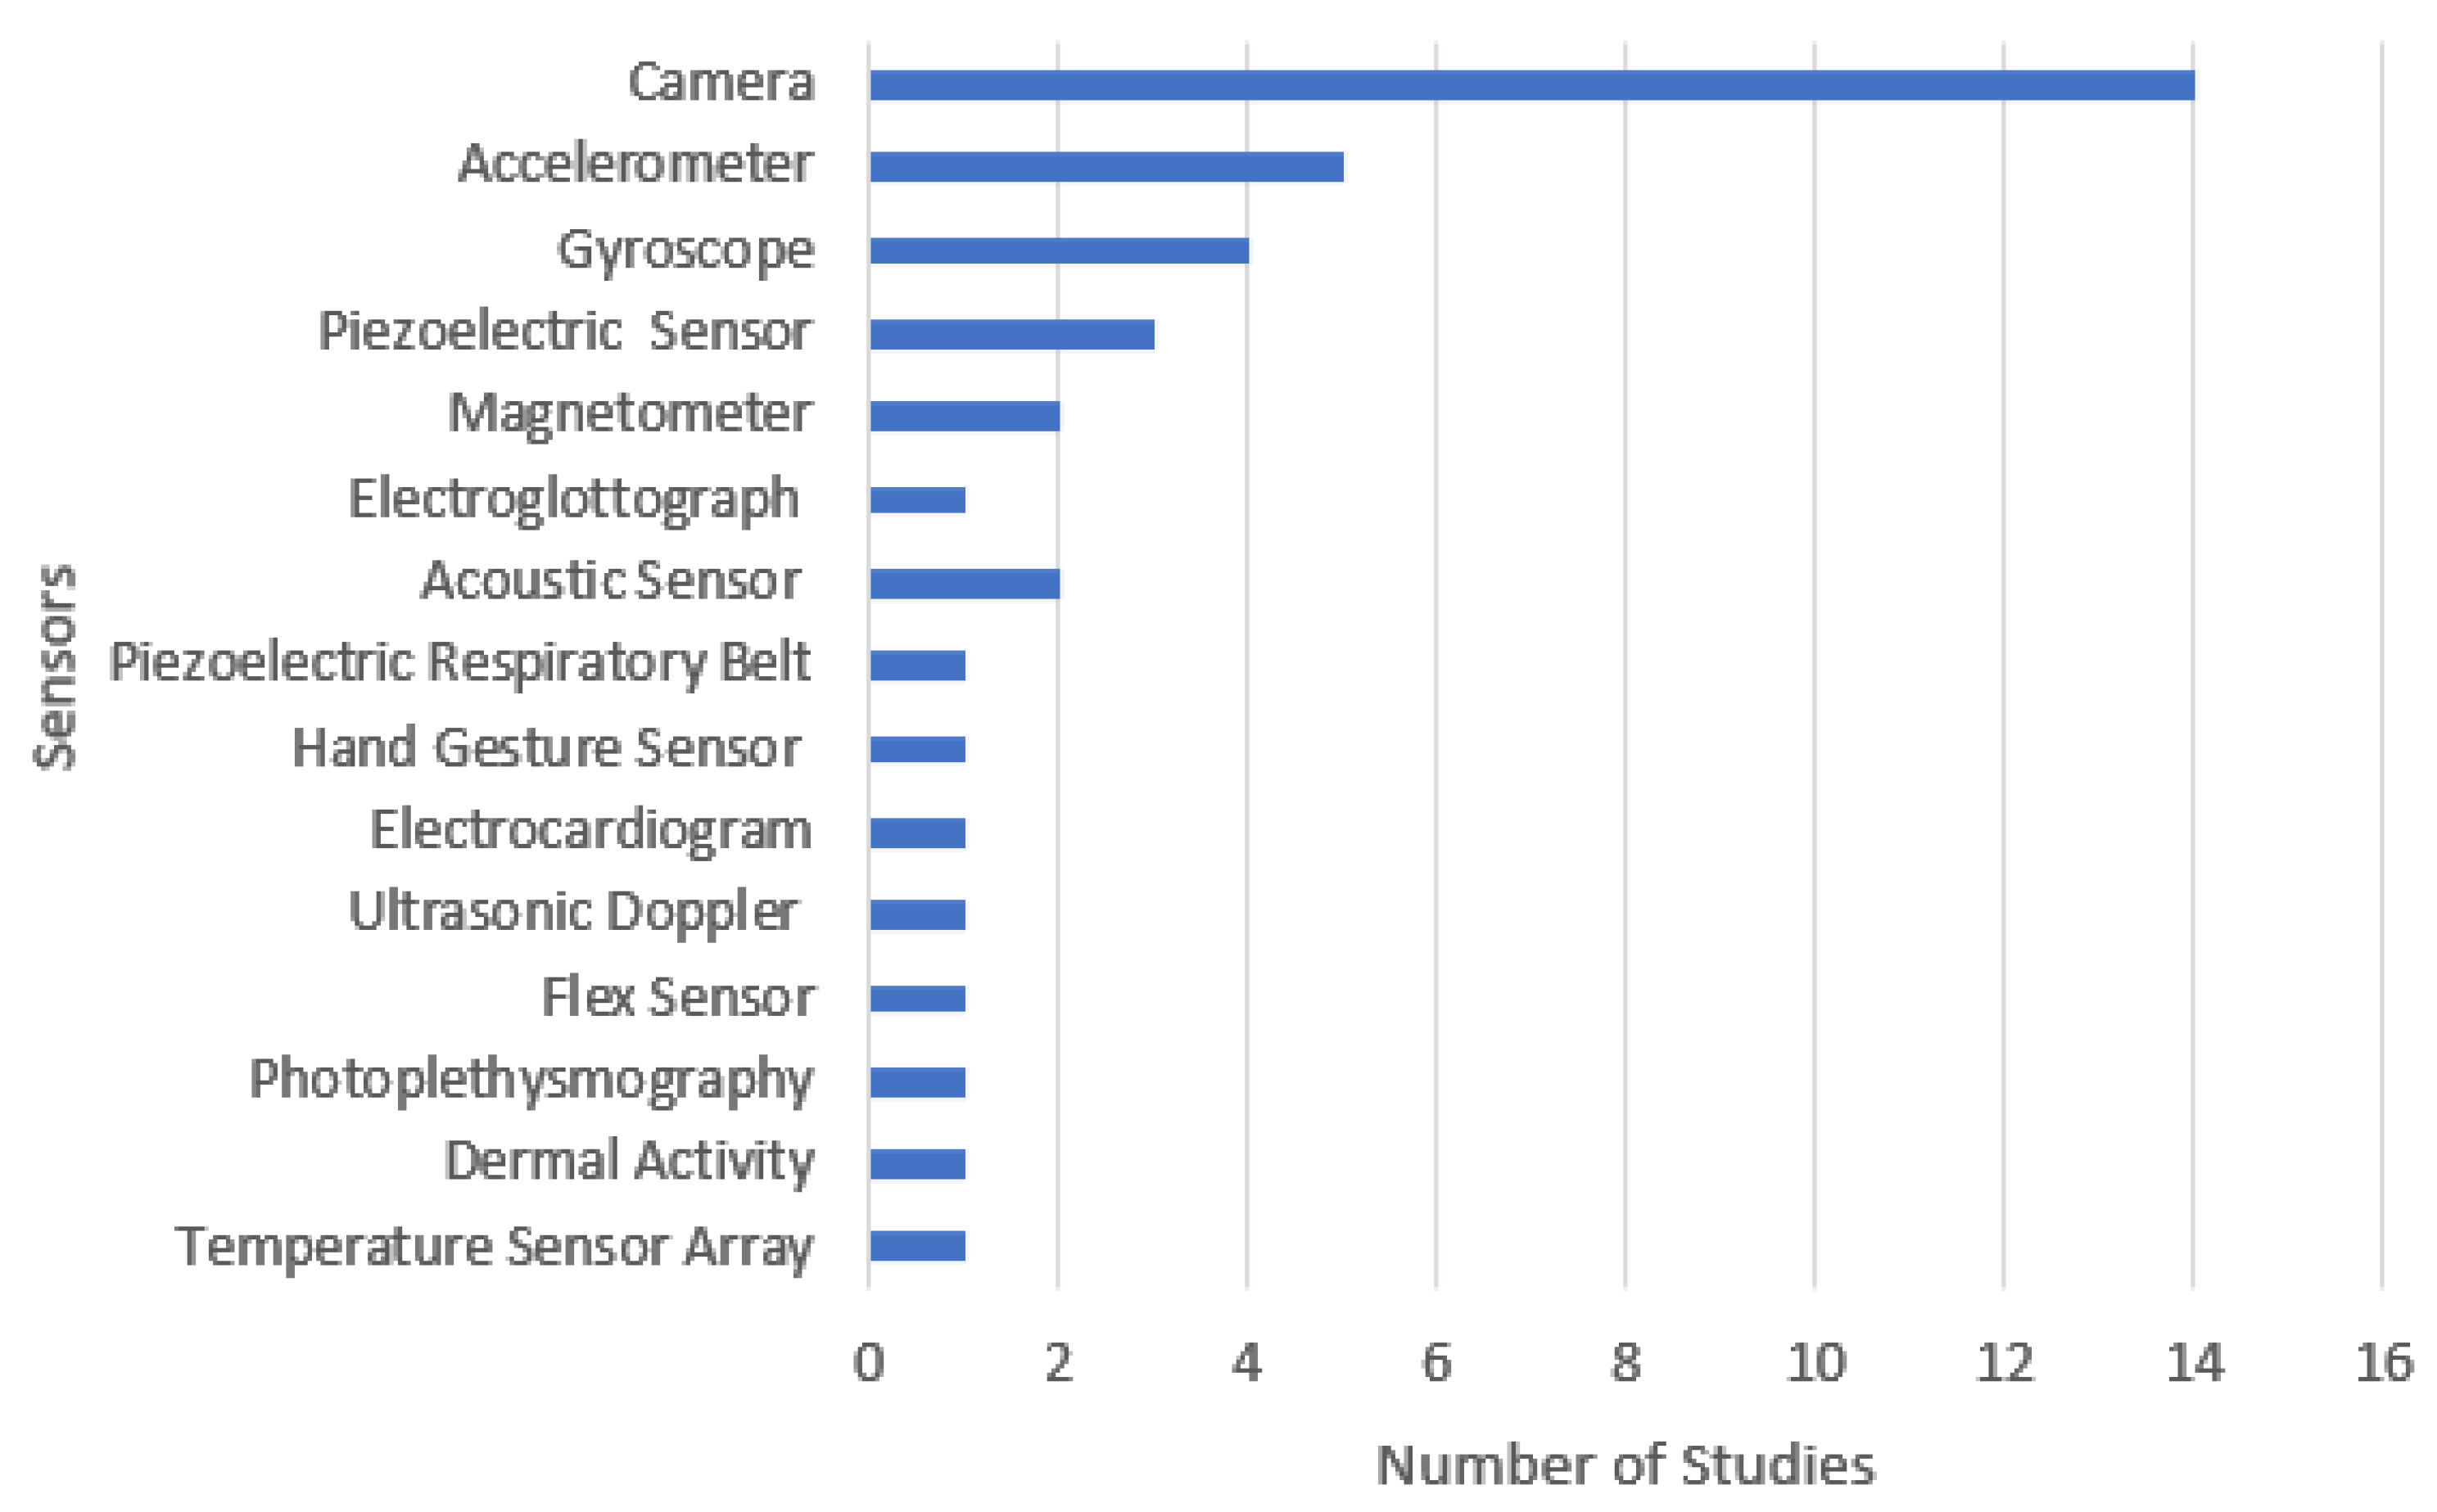
3. Results
Presentation of the Selected Studies
4. Discussion
4.1. Interpretation of the Results
4.2. Comparison of the Different Studies Analyzed
4.3. Answers to Identified Research Questions
4.4. Research Opportunities
5. Conclusions
Author Contributions
Funding
Institutional Review Board Statement
Informed Consent Statement
Data Availability Statement
Acknowledgments
Conflicts of Interest
References
- Turconi, G.; Guarcello, M.; Maccarini, L.; Cignoli, F.; Setti, S.; Bazzano, R.; Roggi, C. Eating Habits and Behaviors, Physical Activity, Nutritional and Food Safety Knowledge and Beliefs in an Adolescent Italian Population. J. Am. Coll. Nutr. 2008, 27, 31–43. [Google Scholar] [CrossRef] [PubMed]
- Christian, P.; Smith, E.R. Adolescent Undernutrition: Global Burden, Physiology, and Nutritional Risks. Ann. Nutr. Metab. 2018, 72, 316–328. [Google Scholar] [CrossRef] [PubMed]
- Chatterjee, A.; Gerdes, M.W.; Martinez, S.G. Identification of Risk Factors Associated with Obesity and Overweight—A Machine Learning Overview. Sensors 2020, 20, 2734. [Google Scholar] [CrossRef] [PubMed]
- Huang, L.; Wang, Z.; Wang, H.; Zhao, L.; Jiang, H.; Zhang, B.; Ding, G. Nutrition transition and related health challenges over decades in China. Eur. J. Clin. Nutr. 2020, 75, 247–252. [Google Scholar] [CrossRef] [PubMed]
- Villasana, M.; Pires, I.; Sá, J.; Garcia, N.; Teixeira, M.; Zdravevski, E.; Chorbev, I.; Lameski, P. Promotion of Healthy Lifestyles to Teenagers with Mobile Devices: A Case Study in Portugal. Healthcare 2020, 8, 315. [Google Scholar] [CrossRef] [PubMed]
- Keleher, H.; Hagger, V. Health Literacy in Primary Health Care. Aust. J. Prim. Health 2007, 13, 24–30. [Google Scholar] [CrossRef]
- Sarwar, M.H.; Sarwar, M.F.; Khalid, M.T.; Sarwar, M. Effects of Eating the Balance Food and Diet to Protect Human Health and Prevent Diseases. Am. J. Circuits Syst. Signal Process. 2015, 1, 99–104. [Google Scholar]
- Teasdale, S.B.; Ward, P.; Rosenbaum, S.; Samaras, K.; Stubbs, B. Solving a weighty problem: Systematic review and meta-analysis of nutrition interventions in severe mental illness. Br. J. Psychiatry 2017, 210, 110–118. [Google Scholar] [CrossRef]
- LeLeiko, N.S.; Dorfzaun, S.; Picoraro, J. The Role of Diet, Nutrition, and Exercise in Preventing Disease. Pediatr. Rev. 2022, 43, 298–308. [Google Scholar] [CrossRef]
- Fernandes, T.H.; Bell, V.; Ferrão, J. Nutrition, Food Safety and Quality in Sub-Saharan Africa. EC Nutr. 2017, 9, 243–255. [Google Scholar]
- Leandro, A.; Pacheco, D.; Cotas, J.; Marques, J.; Pereira, L.; Gonçalves, A. Seaweed’s Bioactive Candidate Compounds to Food Industry and Global Food Security. Life 2020, 10, 140. [Google Scholar] [CrossRef]
- Steele, R. Social Media, Mobile Devices and Sensors: Categorizing New Techniques for Health Communication. In Proceedings of the 2011 Fifth International Conference on Sensing Technology, Palmerston North, New Zealand, 28 November–1 December 2011; pp. 187–192. [Google Scholar]
- Sim, I. Mobile Devices and Health. N. Engl. J. Med. 2019, 381, 956–968. [Google Scholar] [CrossRef]
- García, L.; Parra, L.; Jimenez, J.M.; Lloret, J. Physical Wellbeing Monitoring Employing Non-Invasive Low-Cost and Low-Energy Sensor Socks. Sensors 2018, 18, 2822. [Google Scholar] [CrossRef]
- Xu, J.; Fang, Y.; Chen, J. Wearable Biosensors for Non-Invasive Sweat Diagnostics. Biosensors 2021, 11, 245. [Google Scholar] [CrossRef]
- Boland, M.; Alam, F.; Bronlund, J. Modern Technologies for Personalized Nutrition. In Trends in Personalized Nutrition; Elsevier: Amsterdam, The Netherlands, 2019; pp. 195–222. ISBN 978-0-12-816403-7. [Google Scholar]
- Syed, L.; Jabeen, S.; Manimala, S.; Alsaeedi, A. Smart healthcare framework for ambient assisted living using IoMT and big data analytics techniques. Futur. Gener. Comput. Syst. 2019, 101, 136–151. [Google Scholar] [CrossRef]
- Garcia, N.M.; Rodrigues, J.J.P.C. (Eds.) Ambient Assisted Living; CRC Press: Boca Raton, FL, USA, 2015; ISBN 978-0-429-10674-3. [Google Scholar]
- Owen, L.; Corfe, B. The role of diet and nutrition on mental health and wellbeing. Proc. Nutr. Soc. 2017, 76, 425–426. [Google Scholar] [CrossRef]
- Jia, P.; Luo, M.; Li, Y.; Zheng, J.; Xiao, Q.; Luo, J. Fast-food restaurant, unhealthy eating, and childhood obesity: A systematic review and meta-analysis. Obes. Rev. 2019, 22, e12944. [Google Scholar] [CrossRef]
- Moher, D.; Shamseer, L.; Clarke, M.; Ghersi, D.; Liberati, A.; Petticrew, M.; Shekelle, P.; Stewart, L.A.; PRISMA-P Group. Preferred reporting items for systematic review and meta-analysis protocols (prisma-p) 2015 statement. Syst. Rev. 2015, 4, 1. [Google Scholar] [CrossRef]
- Zdravevski, E.; Lameski, P.; Trajkovik, V.; Chorbev, I.; Goleva, R.; Pombo, N.; Garcia, N.M. Automation in Systematic, Scoping and Rapid Reviews by an NLP Toolkit: A Case Study in Enhanced Living Environments. In Enhanced Living Environments; Ganchev, I., Garcia, N.M., Dobre, C., Mavromoustakis, C.X., Goleva, R., Eds.; Lecture Notes in Computer Science; Springer International Publishing: Cham, Switzerland, 2019; Volume 11369, pp. 1–18. ISBN 978-3-030-10751-2. [Google Scholar]
- Bahador, N.; Ferreira, D.; Tamminen, S.; Kortelainen, J. Deep Learning–Based Multimodal Data Fusion: Case Study in Food Intake Episodes Detection Using Wearable Sensors. JMIR mHealth uHealth 2021, 9, e21926. [Google Scholar] [CrossRef]
- Doulah, A.B.M.S.U.; Ghosh, T.; Hossain, D.; Imtiaz, M.H.; Sazonov, E. “Automatic Ingestion Monitor Version 2”—A Novel Wearable Device for Automatic Food Intake Detection and Passive Capture of Food Images. IEEE J. Biomed. Health Inform. 2020, 25, 568–576. [Google Scholar] [CrossRef]
- Heydarian, H.; Adam, M.T.P.; Burrows, T.; Rollo, M.E. Exploring Score-Level and Decision-Level Fusion of Inertial and Video Data for Intake Gesture Detection. IEEE Access 2021, 1. [Google Scholar] [CrossRef]
- Rouast, P.V.; Heydarian, H.; Adam, M.T.P.; Rollo, M.E. OREBA: A Dataset for Objectively Recognizing Eating Behavior and Associated Intake. IEEE Access 2020, 8, 181955–181963. [Google Scholar] [CrossRef]
- Kyritsis, K.; Diou, C.; Delopoulos, A. A Data Driven End-to-End Approach for In-the-Wild Monitoring of Eating Behavior Using Smartwatches. IEEE J. Biomed. Health Inform. 2020, 25, 22–34. [Google Scholar] [CrossRef]
- Multimedia Understanding Group. The Food Intake Cycle (FIC) Dataset. Available online: https://mug.ee.auth.gr/intake-cycle-detection/ (accessed on 10 July 2022).
- Multimedia Understanding Group. The Free-Living Food Intake Cycle (FreeFIC) Dataset. Available online: https://mug.ee.auth.gr/free-food-intake-cycle-detection/ (accessed on 10 July 2022).
- Lee, K.-S. Automatic Estimation of Food Intake Amount Using Visual and Ultrasonic Signals. Electronics 2021, 10, 2153. [Google Scholar] [CrossRef]
- Mamud, S.; Bandyopadhyay, S.; Chatterjee, P.; Bhandari, S.; Chakraborty, N. DietSN: A Body Sensor Network for Automatic Dietary Monitoring System. In Data Management, Analytics and Innovation; Sharma, N., Chakrabarti, A., Balas, V.E., Bruckstein, A.M., Eds.; Lecture Notes on Data Engineering and Communications Technologies; Springer: Singapore, 2021; Volume 70, pp. 367–381. ISBN 9789811629334. [Google Scholar]
- Mirtchouk, M.; Kleinberg, S. Detecting Granular Eating Behaviors From Body-Worn Audio and Motion Sensors. In Proceedings of the 2021 IEEE EMBS International Conference on Biomedical and Health Informatics (BHI), Athens, Greece, 27–30 July 2021; pp. 1–4. [Google Scholar]
- Rouast, P.V.; Adam, M.T.P. Single-Stage Intake Gesture Detection Using CTC Loss and Extended Prefix Beam Search. IEEE J. Biomed. Health Inform. 2020, 25, 2733–2743. [Google Scholar] [CrossRef]
- Fuchs, K.; Haldimann, M.; Grundmann, T.; Fleisch, E. Supporting food choices in the Internet of People: Automatic detection of diet-related activities and display of real-time interventions via mixed reality headsets. Futur. Gener. Comput. Syst. 2020, 113, 343–362. [Google Scholar] [CrossRef]
- Heremans, E.R.M.; Chen, A.S.; Wang, X.; Cheng, J.; Xu, F.; Martinez, A.E.; Lazaridis, G.; Van Huffel, S.; Chen, J.D.Z. Artificial Neural Network-Based Automatic Detection of Food Intake for Neuromodulation in Treating Obesity and Diabetes. Obes. Surg. 2020, 30, 2547–2557. [Google Scholar] [CrossRef]
- Hossain, D.; Imtiaz, M.H.; Ghosh, T.; Bhaskar, V.; Sazonov, E. Real-Time Food Intake Monitoring Using Wearable Egocnetric Camera. In Proceedings of the 2020 42nd Annual International Conference of the IEEE Engineering in Medicine & Biology Society (EMBC), Montreal, QC, Canada, 20–24 July 2020; pp. 4191–4195. [Google Scholar]
- Rachakonda, L.; Mohanty, S.P.; Kougianos, E. iLog: An Intelligent Device for Automatic Food Intake Monitoring and Stress Detection in the IoMT. IEEE Trans. Consum. Electron. 2020, 66, 115–124. [Google Scholar] [CrossRef]
- Sundarramurthi, M.; Giridharan, A. Personalised Food Classifier and Nutrition Interpreter Multimedia Tool Using Deep Learning. In Proceedings of the 2020 IEEE Region 10 Conference (Tencon), Osaka, Japan, 16–19 November 2020; pp. 881–884. [Google Scholar]
- Bossard, L.; Guillaumin, M.; Van Gool, L. Food-101–Mining Discriminative Components with Random Forests. In Computer Vision–ECCV 2014, Lecture Notes in Computer Science; Fleet, D., Pajdla, T., Schiele, B., Tuytelaars, T., Eds.; Springer International Publishing: Cham, Switzerland, 2014; Volume 8694, pp. 446–461. ISBN 978-3-319-10598-7. [Google Scholar]
- Ye, H.; Zou, Q. Food Recognition and Dietary Assessment for Healthcare System at Mobile Device End Using Mask R-CNN. In Testbeds and Research Infrastructures for the Development of Networks and Communications; Gao, H., Li, K., Yang, X., Yin, Y., Eds.; Lecture Notes of the Institute for Computer Sciences, Social Informatics and Telecommunications Engineering; Springer International Publishing: Cham, Switzerland, 2020; Volume 309, pp. 18–35. ISBN 978-3-030-43214-0. [Google Scholar]
- Lin, T.-Y.; Maire, M.; Belongie, S.; Bourdev, L.; Girshick, R.; Hays, J.; Perona, P.; Ramanan, D.; Zitnick, C.L.; Dollár, P. Microsoft COCO: Common Objects in Context. In Computer Vision—ECCV 2014; Fleet, D., Pajdla, T., Schiele, B., Tuytelaars, T., Eds.; Springer: Cham, Switzerland, 2014; Volume 8693, pp. 740–755. ISBN 978-3-319-10601-4. [Google Scholar]
- Farooq, M.; Doulah, A.; Parton, J.; McCrory, M.A.; Higgins, J.A.; Sazonov, E. Validation of Sensor-Based Food Intake Detection by Multicamera Video Observation in an Unconstrained Environment. Nutrients 2019, 11, 609. [Google Scholar] [CrossRef]
- Johnson, G.; Wang, Y.; Rajamani, R.; Johnson, G.; Wang, Y.; Rajamani, R. Real-Time Detection of Food Consumption Activities Using Wearable Wireless Sensors. In Proceedings of the 2019 American Control Conference (ACC), Philadelphia, PA, USA, 10–12 July 2019; pp. 3450–3455. [Google Scholar]
- Konstantinidis, D.; Dimitropoulos, K.; Ioakimidis, I.; Langlet, B.; Daras, P. A Deep Network for Automatic Video-Based Food Bite Detection. In Computer Vision Systems; Tzovaras, D., Giakoumis, D., Vincze, M., Argyros, A., Eds.; Lecture Notes in Computer Science; Springer International Publishing: Cham, Switzerland, 2019; Volume 11754, pp. 586–595. ISBN 978-3-030-34994-3. [Google Scholar]
- Kumari, S.K.; Mathana, J.M. Blood Sugar Level Indication Through Chewing and Swallowing from Acoustic MEMS Sensor and Deep Learning Algorithm for Diabetic Management. J. Med Syst. 2018, 43, 1–9. [Google Scholar] [CrossRef]
- Park, S.-J.; Palvanov, A.; Lee, C.-H.; Jeong, N.; Cho, Y.-I.; Lee, H.-J. The development of food image detection and recognition model of Korean food for mobile dietary management. Nutr. Res. Pract. 2019, 13, 521–528. [Google Scholar] [CrossRef] [PubMed]
- Qiu, J.; Lo, F.P.-W.; Lo, B. Assessing Individual Dietary Intake in Food Sharing Scenarios with a 360 Camera and Deep Learning. In Proceedings of the 2019 IEEE 16th International Conference on Wearable and Implantable Body Sensor Networks (BSN), Chicago, IL, USA, 19–22 May 2019; pp. 1–4. [Google Scholar]
- Raju, V.; Sazonov, E. Processing of Egocentric Camera Images from a Wearable Food Intake Sensor. In Proceedings of the 2019 SoutheastCon, Huntsville, AL, USA, 11–14 April 2019; pp. 1–6. [Google Scholar]
- Tugtekin Turan, M.A.; Erzin, E. Detection of Food Intake Events From Throat Microphone Recordings Using Convolutional Neural Networks. In Proceedings of the 2018 IEEE International Conference on Multimedia & Expo Workshops (ICMEW), San Diego, CA, USA, 23–27 July 2018; pp. 1–6. [Google Scholar]
- Wan, Y.; Liu, Y.; Li, Y.; Zhang, P. P-Faster R-CNN Algorithm for Food Detection. In Collaborative Computing: Networking, Applications and Worksharing; Romdhani, I., Shu, L., Takahiro, H., Zhou, Z., Gordon, T., Zeng, D., Eds.; Lecture Notes of the Institute for Computer Sciences, Social Informatics and Telecommunications Engineering; Springer International Publishing: Cham, Switzerland, 2018; Volume 252, pp. 132–142. ISBN 978-3-030-00915-1. [Google Scholar]
- Lee, K.-S. Food Intake Detection Using Ultrasonic Doppler Sonar. IEEE Sens. J. 2017, 17, 6056–6068. [Google Scholar] [CrossRef]
- Nguyen, D.T.; Cohen, E.; Pourhomayoun, M.; Alshurafa, N. SwallowNet: Recurrent Neural Network Detects and Characterizes Eating Patterns. In Proceedings of the 2017 IEEE International Conference on Pervasive Computing and Communications Workshops (PerCom Workshops), Kona, HI, USA, 13–17 March 2017; pp. 401–406. [Google Scholar]
- Papapanagiotou, V.; Diou, C.; Delopoulos, A. Chewing Detection from an In-Ear Microphone Using Convolutional Neural Networks. In Proceedings of the 2017 39th Annual International Conference of the IEEE Engineering in Medicine and Biology Society (EMBC), Seogwipo, Korea, 11–15 July 2017; pp. 1258–1261. [Google Scholar]
- Farooq, M.; Sazonov, E. Automatic Measurement of Chew Count and Chewing Rate during Food Intake. Electronics 2016, 5, 62. [Google Scholar] [CrossRef] [PubMed]
- Farooq, M.; Fontana, J.M.; Sazonov, E. A novel approach for food intake detection using electroglottography. Physiol. Meas. 2014, 35, 739–751. [Google Scholar] [CrossRef] [PubMed] [Green Version]
- Dong, B.; Biswas, S. Wearable Diet Monitoring through Breathing Signal Analysis. In Proceedings of the 2013 35th Annual International Conference of the IEEE Engineering in Medicine and Biology Society (EMBC), Osaka, Japan, 3–7 July 2013; pp. 1186–1189. [Google Scholar]
- Pouladzadeh, P.; Shirmohammadi, S.; Arici, T. Intelligent SVM Based Food Intake Measurement System. In Proceedings of the 2013 IEEE International Conference on Computational Intelligence and Virtual Environments for Measurement Systems and Applications (CIVEMSA), Milan, Italy, 15–17 July 2013; pp. 87–92. [Google Scholar]


| Paper | Year of Publication | Population/Dataset | Purpose of Study | Sensors Used | Methodology |
|---|---|---|---|---|---|
| Bahador et al. [23] | 2021 | Two scenarios: 1. data from three days of wristband device use form a single person, and 2. Open data set of 10 individuals performing 186 activities (mobility, eating, personal hygiene, and housework) | Develop a data fusion technique to achieve a more comprehensive insight of human activity dynamics. Authors considered statistical dependency of multisensory data and exploring intramodality correlation patters for different activities. | Sensor array with temperature, interbeat intervals, dermal activity, photoplethysmography, heart rate (1st dataset). Wristband 9 axis inertial measurement units (2nd dataset) | Deep residual network. |
| Doulah et al. [24] | 2021 | 30 volunteers using the system for 24 h in pseudo-free-living and 24 in a free-living environment | Food intake detection, sensor fusion classifier (accelerometer and flex sensor). Image sensor was used to capture data every 15 s and validate sensor fusion decision. | 5 mp camera glasses add-on, accelerometer and flex sensor in contact with temporalis muscle | SVM model. |
| Heydarian et al. [25] | 2021 | OREBA dataset [26], composed by OREBA-DIS with 100 participants consuming food in discrete portions and OREBA-SHA with 102 participants while consuming a communal dish | Data fusion for automatic food intake gesture detection | Although no sensors were used, dataset was obtained through video and inertial sensors data | Fusion of inertial and video data with several methods that use deep learning. |
| Kyritsis et al. [27] | 2021 | FIC [28], FreeFIC [29], and FreeFIC held-out datasets containing triaxial acceleration and orientation velocity signals | A complete Framework towards automated modeling of in-meal eating behavior and temporal localization of meals | Data from smartwatch either worn on right or left wrist—accelerometer and gyroscope | CNN for feature extraction and LSTM network to model temporal evolution. Both parts are jointly trained by minimizing a single loss function. |
| Lee [30] | 2021 | 8 participants in noisy environments | Detect eating events and calculate calorie intake | Ultrasonic doppler shifts to detect chewing events and a camera placed on user’s neck | Markov hidden model recognizer to maximize swallow detection accuracy. Relation between chewing counts and amount of food through a linear regression model. CNN to recognize food items. |
| Mamud et al. [31] | 2021 | Not specified, students were used with emphasis on acoustic signal | Develop a Body Area Network for automatic dietary monitoring system to detect food type and volume, nutritional benefit and eating behavior | Camera on chest with system hub, phones with added microphone and dedicated hardware to capture chewing and swallowing sounds, wrist-worn band with accelerometer and gyroscope | Emphasis was given to the hardware system and the captured signals, but not on signal processing itself. |
| Mirtchouk and Kleinberg [32] | 2021 | 6 subjects for 6 h in a total of 59 h of data | Gain insight on dietary activity, namely chews per minute and causes for food choices | Custom earbud with 2 microphones—one in-ear and one external | SVDKL uses a deep neural network and multiple Gaussian Processes, one per feature, to do multiclass classification. |
| Rouast and Adam [33] | 2021 | Two datasets of annotated intake gestures—OREBA [26] and Clemson University | A single stage approach which directly decodes the probabilities learned from sensor data into sparse intake detection—eating and drinking | Video and inertial data | Deep neural network with weakly supervised training using Connectionist Temporal Classification loss and decoding using an extended prefix beam search decoding algorithm. |
| Fuchs et al. [34] | 2020 | 10,035 labeled product image instances created by the authors | Detection of diet related activities to support health food choices | Mixed reality headset-mounted cameras | Comparison of several neural networks were performed based on object detection and classification accuracy. |
| Heremans et al. [35] | 2020 | 16 subjects for training, and 37 healthy control subjects and 73 patients with functional dyspepsia for testing | Automatic food intake detection through dynamic analysis of heart rate variability | Electrocardiogram | ANN with leave-one-out. |
| Hossain et al. [36] | 2020 | 15,343 images (2127 food images and 13,216 not food images) | Target and classify images as food/not food | Wearable egocentric camera | CNN based image classifier in a Cortex M7 microcontroller. |
| Rachakonda et al. [37] | 2020 | 1000 images obtained from copyright-free sources—800 used for training and 200 for testing | Focus on eating behavior of users, detect normal eating and stress eating, create awareness about its food intake behaviors | Camera mounted on glasses | Machine learning models to automatically classify the food from the plate, automatic object detection from plate, and automatic calorie quantification. |
| Sundarramurthi et al. [38] | 2020 | Food101 dataset [39] (101,000 images with 101 food categories) | Develop a GUI-based interactive tool | Mobile device camera | Convolutional Neural Network for food image classification and detection. |
| Ye et al. [40] | 2020 | COCO2017 dataset [41] | A method for food smart recognition and automatic dietary assessment on a mobile device | Mobile device camera | Mask R-CNN. |
| Farooq et al. [42] | 2019 | 40 participants | Create an automatic ingestion monitor | Automatic ingestion monitor—hand gesture sensor used on the dominant hand, piezoelectric strain sensor, and a data collection module | Neural network classifier. |
| Johnson et al. [43] | 2019 | 25 min of data divided into 30 s segments, while eating, shaving, and brushing teeth | Development of a wearable sensor system for detection of food consumption | Two wireless battery-powered sensor assemblies, each with sensors on the wrist and upper arm. Each unit has 9-axis inertial measurement units with accelerometer, magnetometer, and gyroscope | Machine learning to reduce false positive eating detection after the use of a Kalman filter to detect position of hand relative to the mouth. |
| Konstantinidis et al. [44] | 2019 | 85 videos with people eating from a side view | Detect food bite instances accurately, robustly, and automatically | Cameras to capture body and face motion videos | Deep network to extract human motion features from video sequences. A two-steam deep network is proposed to process body and face motion, together with the data form the first deep network to take advantage of both types of features simultaneously. |
| Kumari et al. [45] | 2019 | 30 diabetic persons to confirm glucose levels with a glucometer | Regulate glycemic index through calculation of food size, chewing style and swallow time | Acoustic sensor in trachea using MEMS technology | Deep belief network with Belief Net and Restricted Boltzmann Machine combined. |
| Park et al. [46] | 2019 | 4000 food images by taking pictures of dishes in restaurants and Internet search | Develop Korean food image detection and recognition model for use in mobile devices for accurate estimation of dietary intake | Camera | Training with TensorFlow machine learning framework with a batch size of 64. Authors present a deep convolutional neural network—K-foodNet. |
| Qiu et al. [47] | 2019 | 360 videos and COCO dataset to train mask R-CNN | Dietary intake on shared food scenarios—detection of subject’s face, hands and food | Video camera (Samsung gear 360) | Mask R-CNN to detect food class, bounding box indicating the location and segmentation mask of each food item. Predicted food masks could presumably be used to calculate food volume. |
| Raju et al. [48] | 2019 | Two datasets (food and no food) with 1600 images each | Minimization of number of images needed to be processed either by human or computer vision algorithm for food image analysis | Automatic Ingestion Monitor 2.0 with camera mounted on glasses frame | Image processing techniques—lens barrel distortion, image sharpness analysis, and face detection and blurring. |
| Turan et al. [49] | 2018 | O participants, 4 male and 4 female, 22–29 years old | Detection of ingestion sounds, namely swallowing and chewing | Throat microphone with IC recorder | Captured sounds are transformed into spectrograms using short-time Fourier transforms and use Convolutional Neural network for food intake classification problem. |
| Wan et al. [50] | 2018 | 300 types of Chinese food and 101 kinds of western food from food-101 | Identify the ingredients of the food to determine if diet is healthy | Digital camera | p-faster R-CNN based on Faster-CNN with Zeiler and Fergus model and Caffe network. |
| Lee [51] | 2017 | 10 participants with 6 types of food | Food intake monitoring, estimating the processes of chewing and swallowing | Acoustic Doppler sonar | Analysis of the jaw and its vibration pattern depending on type of food, feature extraction and classification with an Artificial Neural Network. |
| Nguyen et al. [52] | 2017 | 10 participants in a lab environment | Calculate the number of swallows in food intake to calculate caloric values | Wearable necklace with piezoelectric sensors, accelerometer, gyroscope and magnetometer | A recurrent neural network framework, named SwallowNet, detects swallows on continuous data steam after being trained with raw data using automated feature learning methods. |
| Papapanagiotou et al. [53] | 2017 | 60 h semi-free living dataset | Design a convolutional neural network for chewing detection | In-ear microphone | 1-dimensional convolutional neural network. Authors also present results from leave-one-subject-out with fusion+ (acoustic and inertial sensors) |
| Farooq et al. [54] | 2016 | 120 meals, 4 visits of 30 participants, from which 104 meals were analyzed | Automatic measurement of chewing count and chewing rate | Piezoelectric sensor to capture lower jaw motion | ANN machine learning to classify epochs as chewing or not chewing. Epochs were derived from sensor data processing. |
| Farooq et al. [55] | 2014 | 30 subjects (5 were left out) in a 4-visit experiment | Automatic detection of food intake | Electroglottograph, PS3Eye camera and miniature throat microphone | Three-layer feed-forward neural network trained by the back propagation algorithm, neural network toolbox of Matlab. |
| Dong et al. [56] | 2013 | 3 subjects, one female and two males | Development of a system for wireless and wearable diet monitoring system to detect solid and liquid swallow events based on breathing cycles | Piezoelectric respiratory belt | Machine learning for feature extraction and selection. |
| Pouladzadeh et al. [57] | 2013 | Over 200 images of food, 100 for training set and another 100 for testing set | Measurement and record of food calorie intake | Built-in camera of mobile device | Image processing using color segmentation, k-means clustering and texture segmentation to separate food items. Food portion identification through SVM and calorific value of food using nutritional table. |
| Sensors | Methodology | |||||||||||||||||||||||||||||
|---|---|---|---|---|---|---|---|---|---|---|---|---|---|---|---|---|---|---|---|---|---|---|---|---|---|---|---|---|---|---|
| Studies | Accelerometer | Gyroscope | Piezoelectric Strain Sensor | Magnetometer | Electroglottograph | Camera | Acoustic Sensor | Piezoelectric Respiratory Belt | Hand Gesture Sensor | Electrocardiogram | Ultrasonic Doppler | Flex Sensor | Photoplethysmography | Dermal Activity | Temperature Sensor Array | Convolutional Neural Network | Deep Neural Network | Support Vector Machine | Artificial Neural Network | J48 | Naive Bayes | Swallow Net | Short-Time Fourier Transforms | TensorFlow | Restricted Boltzmann Machine | Belief Net | Markov Hidden Model | Long Short-Term Memory | Gaussian Processes | Connectionist Temporal Classification Loss |
| Bahador et al. [23] | X | X | X | X | ||||||||||||||||||||||||||
| Doulah et al. [24] | X | X | X | X | ||||||||||||||||||||||||||
| Heydarian et al. [25] | X | X | ||||||||||||||||||||||||||||
| Kyritsis et al. [27] | X | X | X | X | X | |||||||||||||||||||||||||
| Lee [30] | X | X | X | |||||||||||||||||||||||||||
| Mamud et al. [31] | X | X | X | |||||||||||||||||||||||||||
| Mirtchouk and Kleinberg [32] | X | X | X | |||||||||||||||||||||||||||
| Rouast and Adam [33] | X | X | ||||||||||||||||||||||||||||
| Fuchs et al. [34] | X | X | ||||||||||||||||||||||||||||
| Heremans et al. [35] | X | X | ||||||||||||||||||||||||||||
| Hossain et al. [36] | X | X | ||||||||||||||||||||||||||||
| Rachakonda et al. [37] | X | |||||||||||||||||||||||||||||
| Sundarramurthi et al. [38] | X | X | ||||||||||||||||||||||||||||
| Ye et al. [40] | X | X | ||||||||||||||||||||||||||||
| Farooq et al. [42] | X | X | X | |||||||||||||||||||||||||||
| Johnson et al. [43] | X | X | X | X | ||||||||||||||||||||||||||
| Konstantinidis et al. [44] | X | X | ||||||||||||||||||||||||||||
| Kumari et al. [45] | X | X | X | |||||||||||||||||||||||||||
| Park et al. [46] | X | X | ||||||||||||||||||||||||||||
| Qiu et al. [47] | X | X | ||||||||||||||||||||||||||||
| Raju et al. [48] | X | |||||||||||||||||||||||||||||
| Turan et al. [49] | X | X | X | |||||||||||||||||||||||||||
| Wan et al. [50] | X | X | ||||||||||||||||||||||||||||
| Lee [51] | X | |||||||||||||||||||||||||||||
| Nguyen et al. [52] | X | X | X | X | X | |||||||||||||||||||||||||
| Papapanagiotou et al. [53] | X | X | X | |||||||||||||||||||||||||||
| Farooq et al. [54] | X | X | ||||||||||||||||||||||||||||
| Farooq et al. [55] | X | X | X | X | X | |||||||||||||||||||||||||
| Dong et al. [56] | X | X | X | X | ||||||||||||||||||||||||||
| Pouladzadeh et al. [57] | X | X | ||||||||||||||||||||||||||||
Publisher’s Note: MDPI stays neutral with regard to jurisdictional claims in published maps and institutional affiliations. |
© 2022 by the authors. Licensee MDPI, Basel, Switzerland. This article is an open access article distributed under the terms and conditions of the Creative Commons Attribution (CC BY) license (https://creativecommons.org/licenses/by/4.0/).
Share and Cite
Neves, P.A.; Simões, J.; Costa, R.; Pimenta, L.; Gonçalves, N.J.; Albuquerque, C.; Cunha, C.; Zdravevski, E.; Lameski, P.; Garcia, N.M.; et al. Thought on Food: A Systematic Review of Current Approaches and Challenges for Food Intake Detection. Sensors 2022, 22, 6443. https://doi.org/10.3390/s22176443
Neves PA, Simões J, Costa R, Pimenta L, Gonçalves NJ, Albuquerque C, Cunha C, Zdravevski E, Lameski P, Garcia NM, et al. Thought on Food: A Systematic Review of Current Approaches and Challenges for Food Intake Detection. Sensors. 2022; 22(17):6443. https://doi.org/10.3390/s22176443
Chicago/Turabian StyleNeves, Paulo Alexandre, João Simões, Ricardo Costa, Luís Pimenta, Norberto Jorge Gonçalves, Carlos Albuquerque, Carlos Cunha, Eftim Zdravevski, Petre Lameski, Nuno M. Garcia, and et al. 2022. "Thought on Food: A Systematic Review of Current Approaches and Challenges for Food Intake Detection" Sensors 22, no. 17: 6443. https://doi.org/10.3390/s22176443
APA StyleNeves, P. A., Simões, J., Costa, R., Pimenta, L., Gonçalves, N. J., Albuquerque, C., Cunha, C., Zdravevski, E., Lameski, P., Garcia, N. M., & Pires, I. M. (2022). Thought on Food: A Systematic Review of Current Approaches and Challenges for Food Intake Detection. Sensors, 22(17), 6443. https://doi.org/10.3390/s22176443