
Study of the Steady-State Operation of a Dual-Longitudinal-Mode and Self-Biasing Laser Gyroscope


 ,
,
Abstract
:1. Introduction
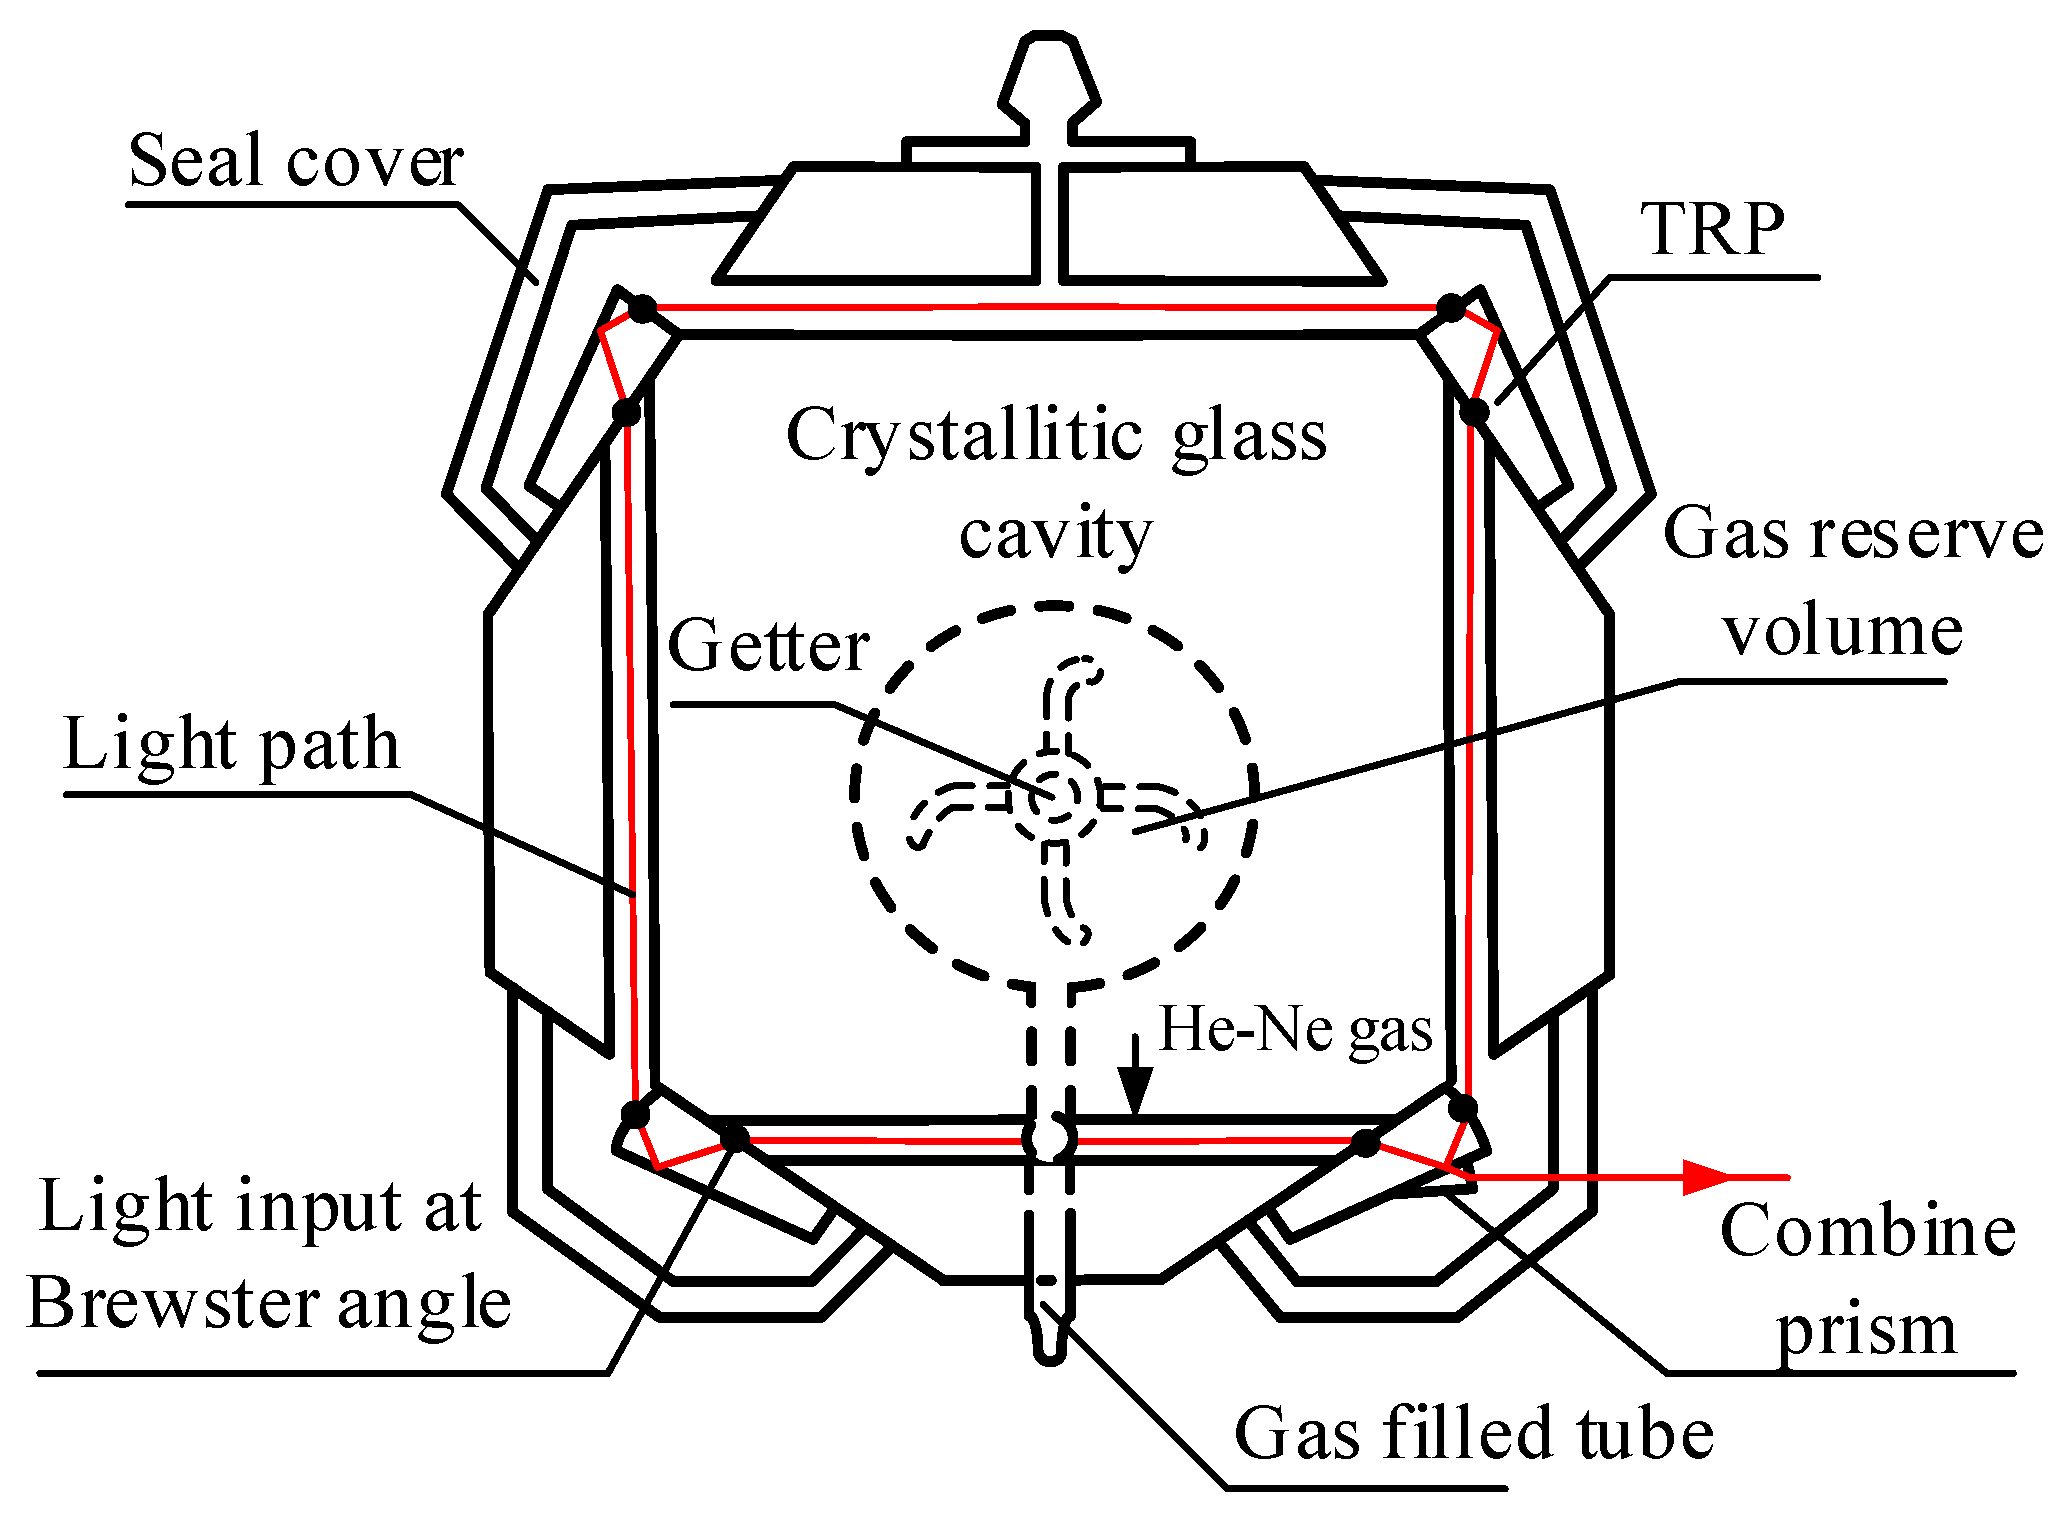
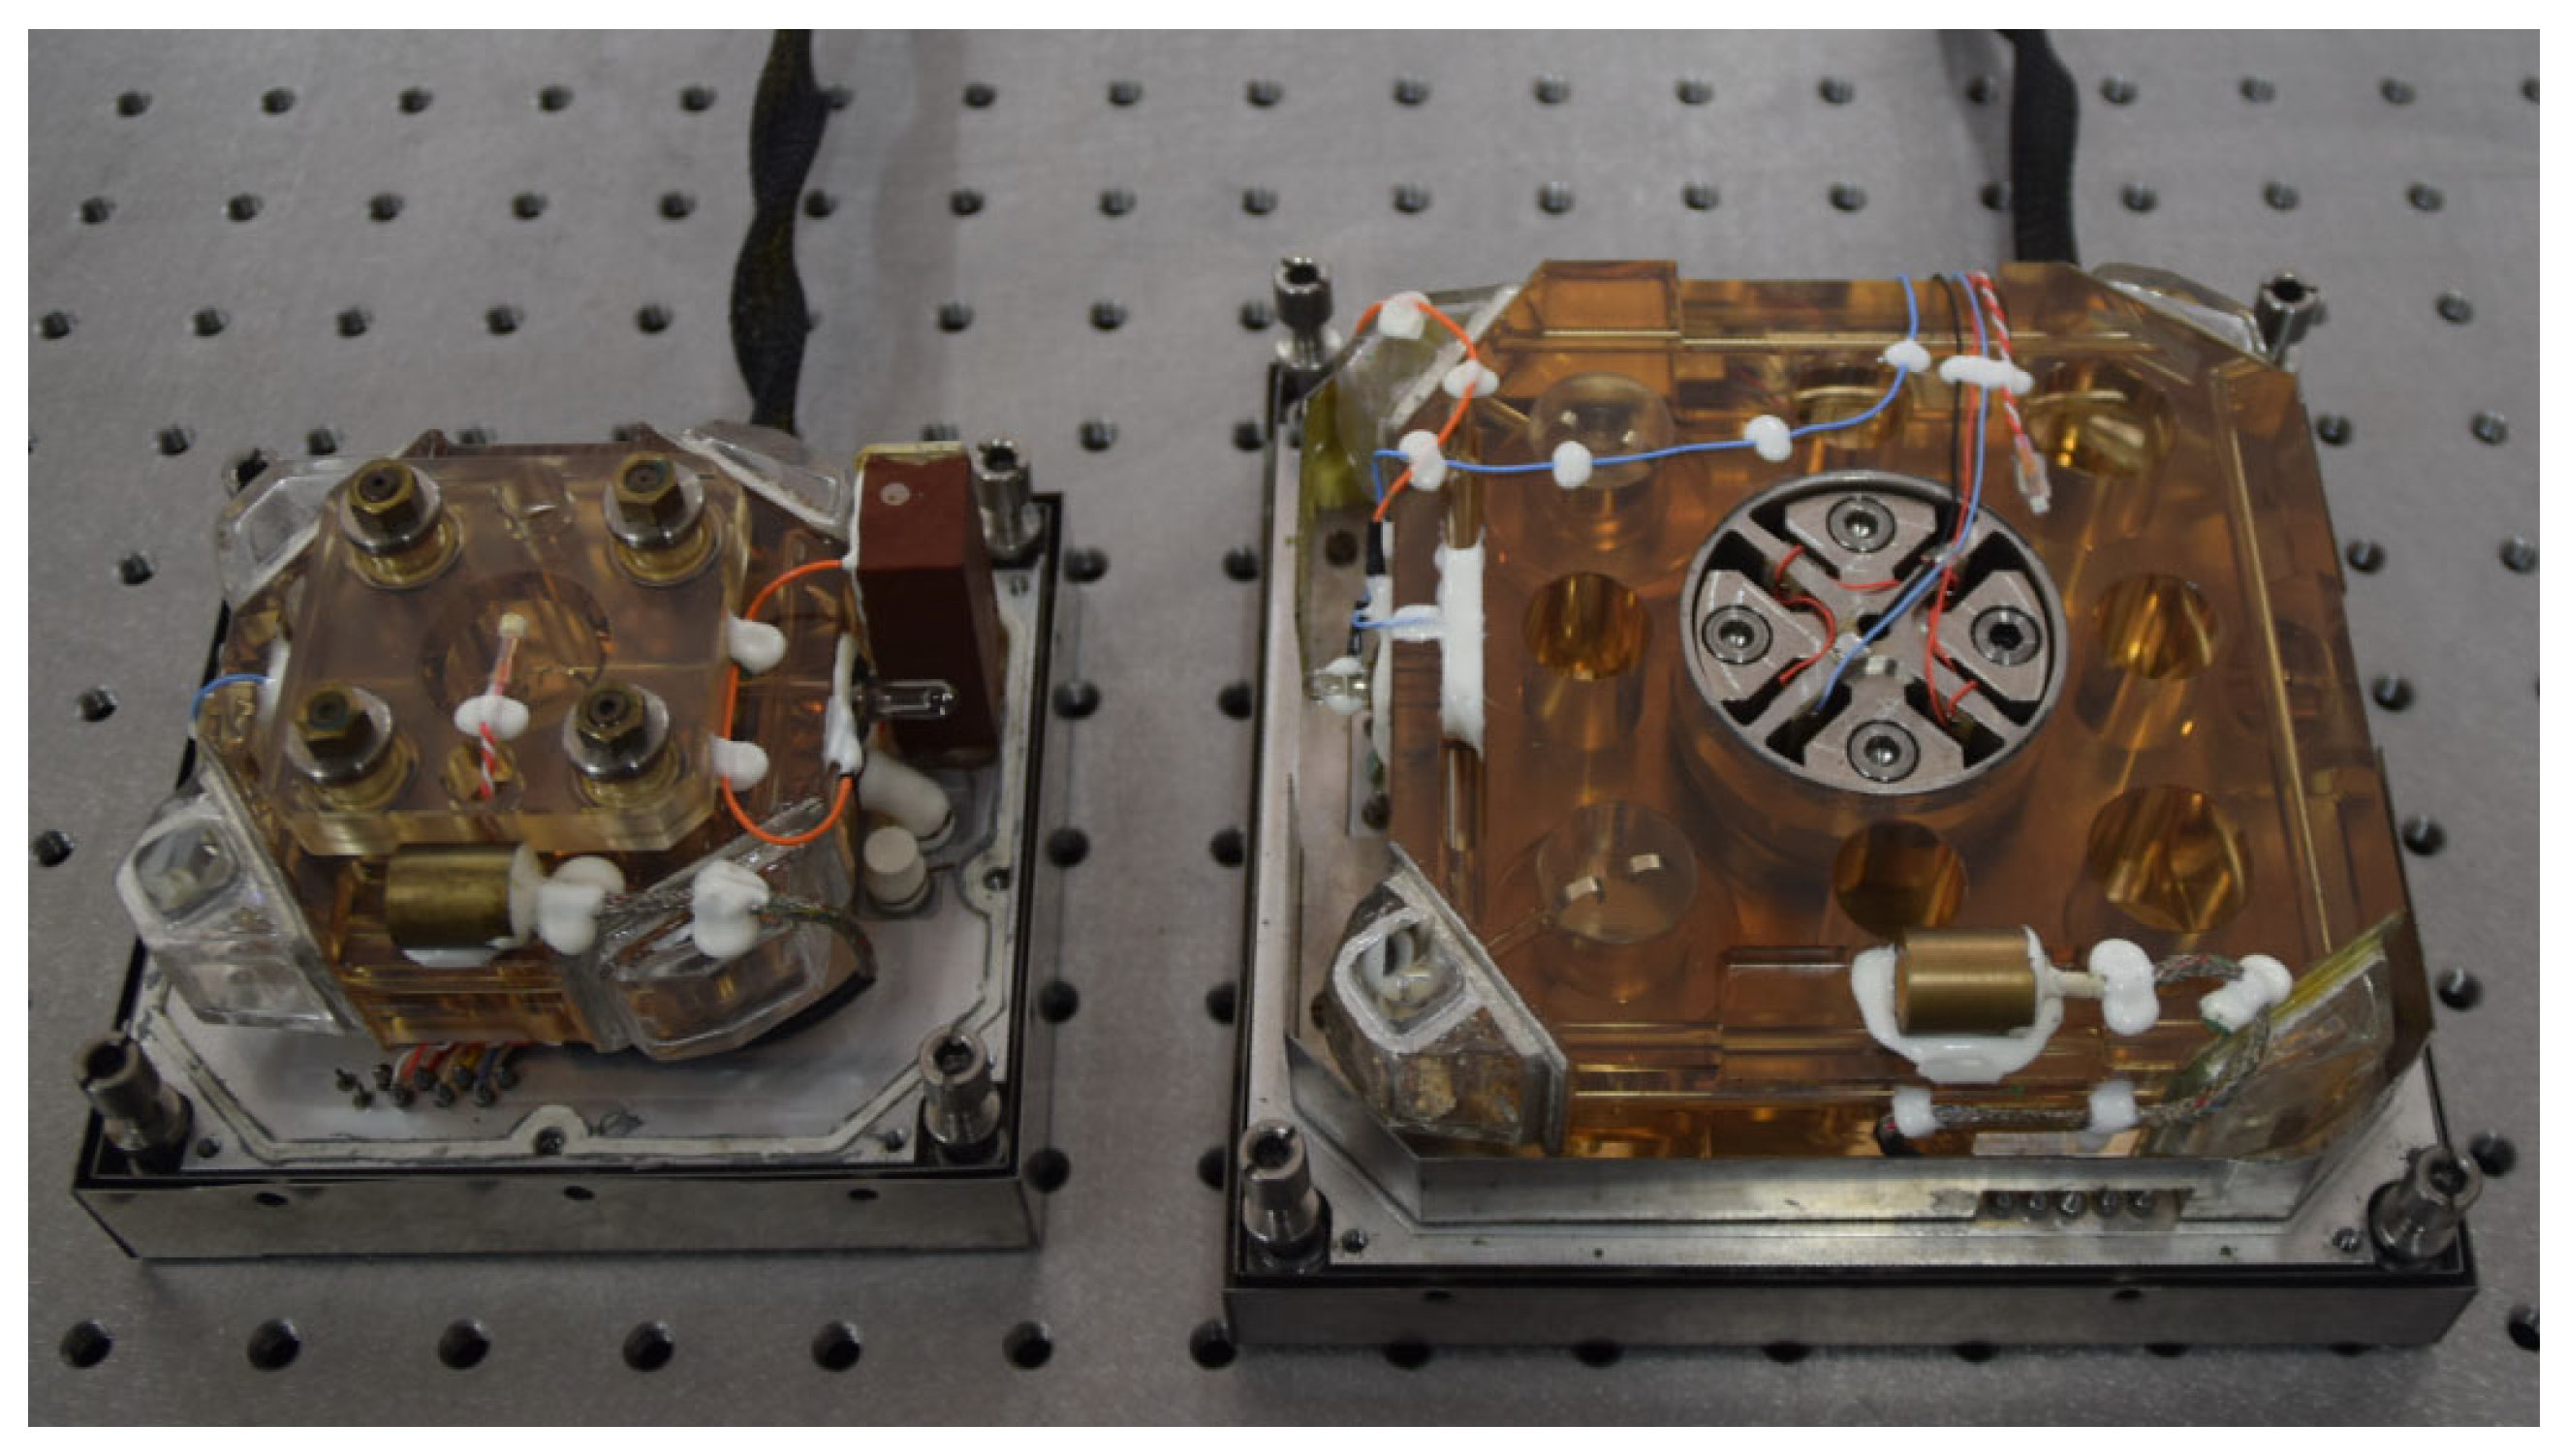
2. Prism Ring Laser
3. Profile of the Intensity Tuning Curve in a Ring Laser
3.1. Lamb Theory and Ring Resonator
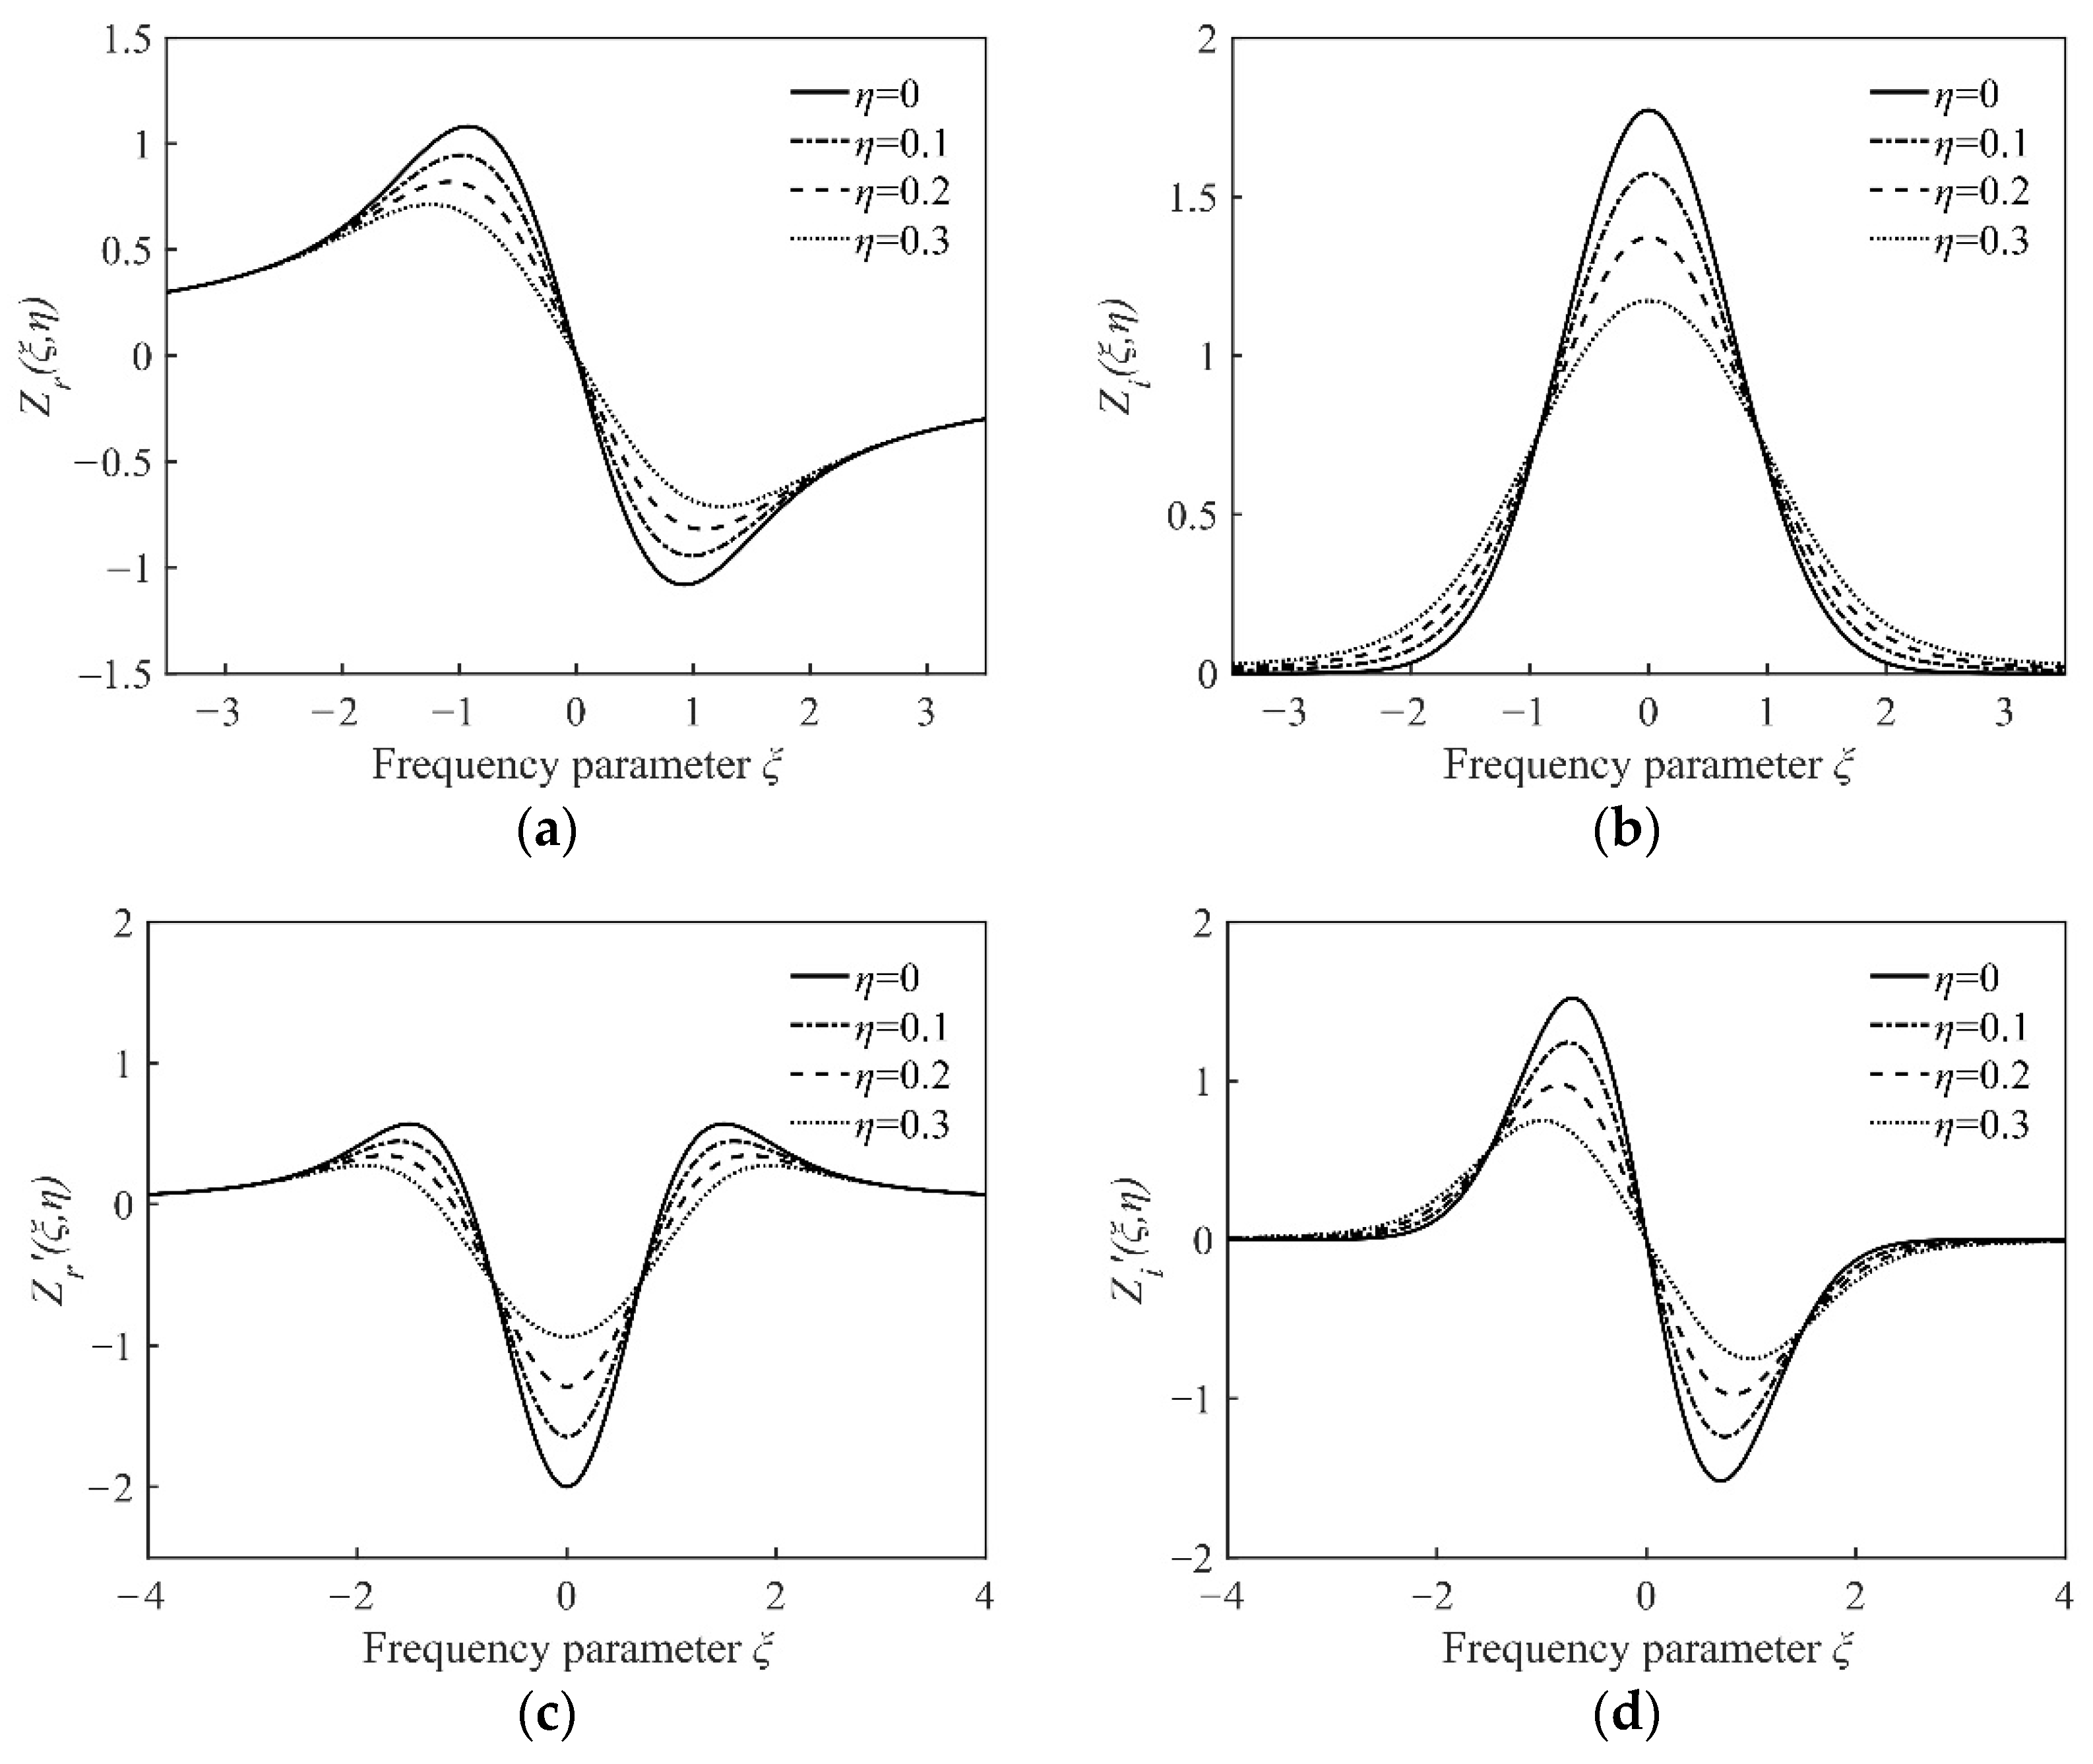
3.2. Dispersion Functions Theory of Plasma
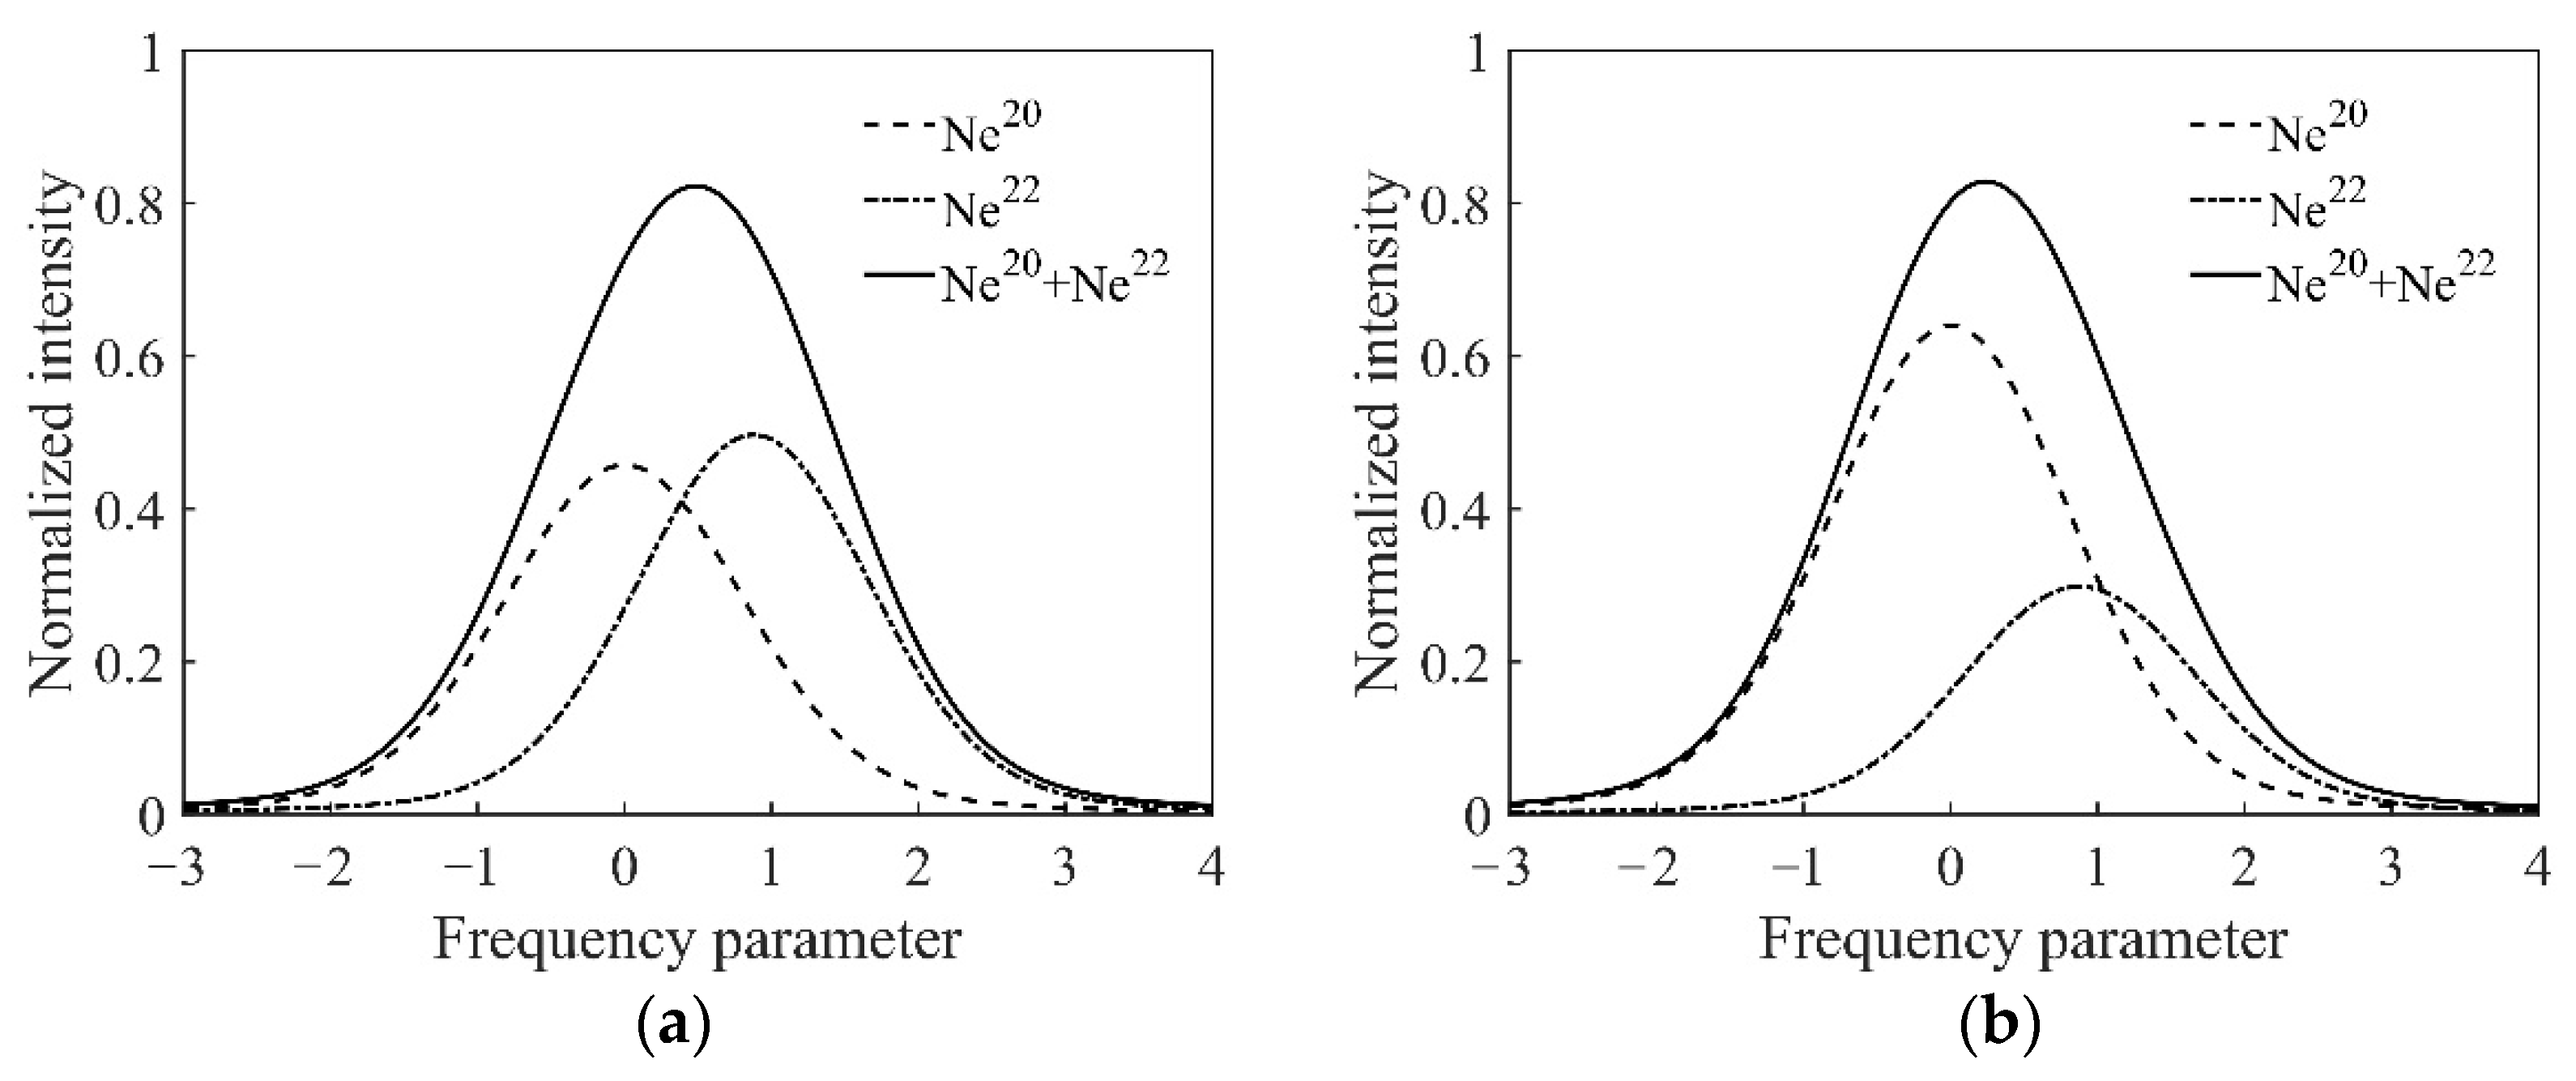
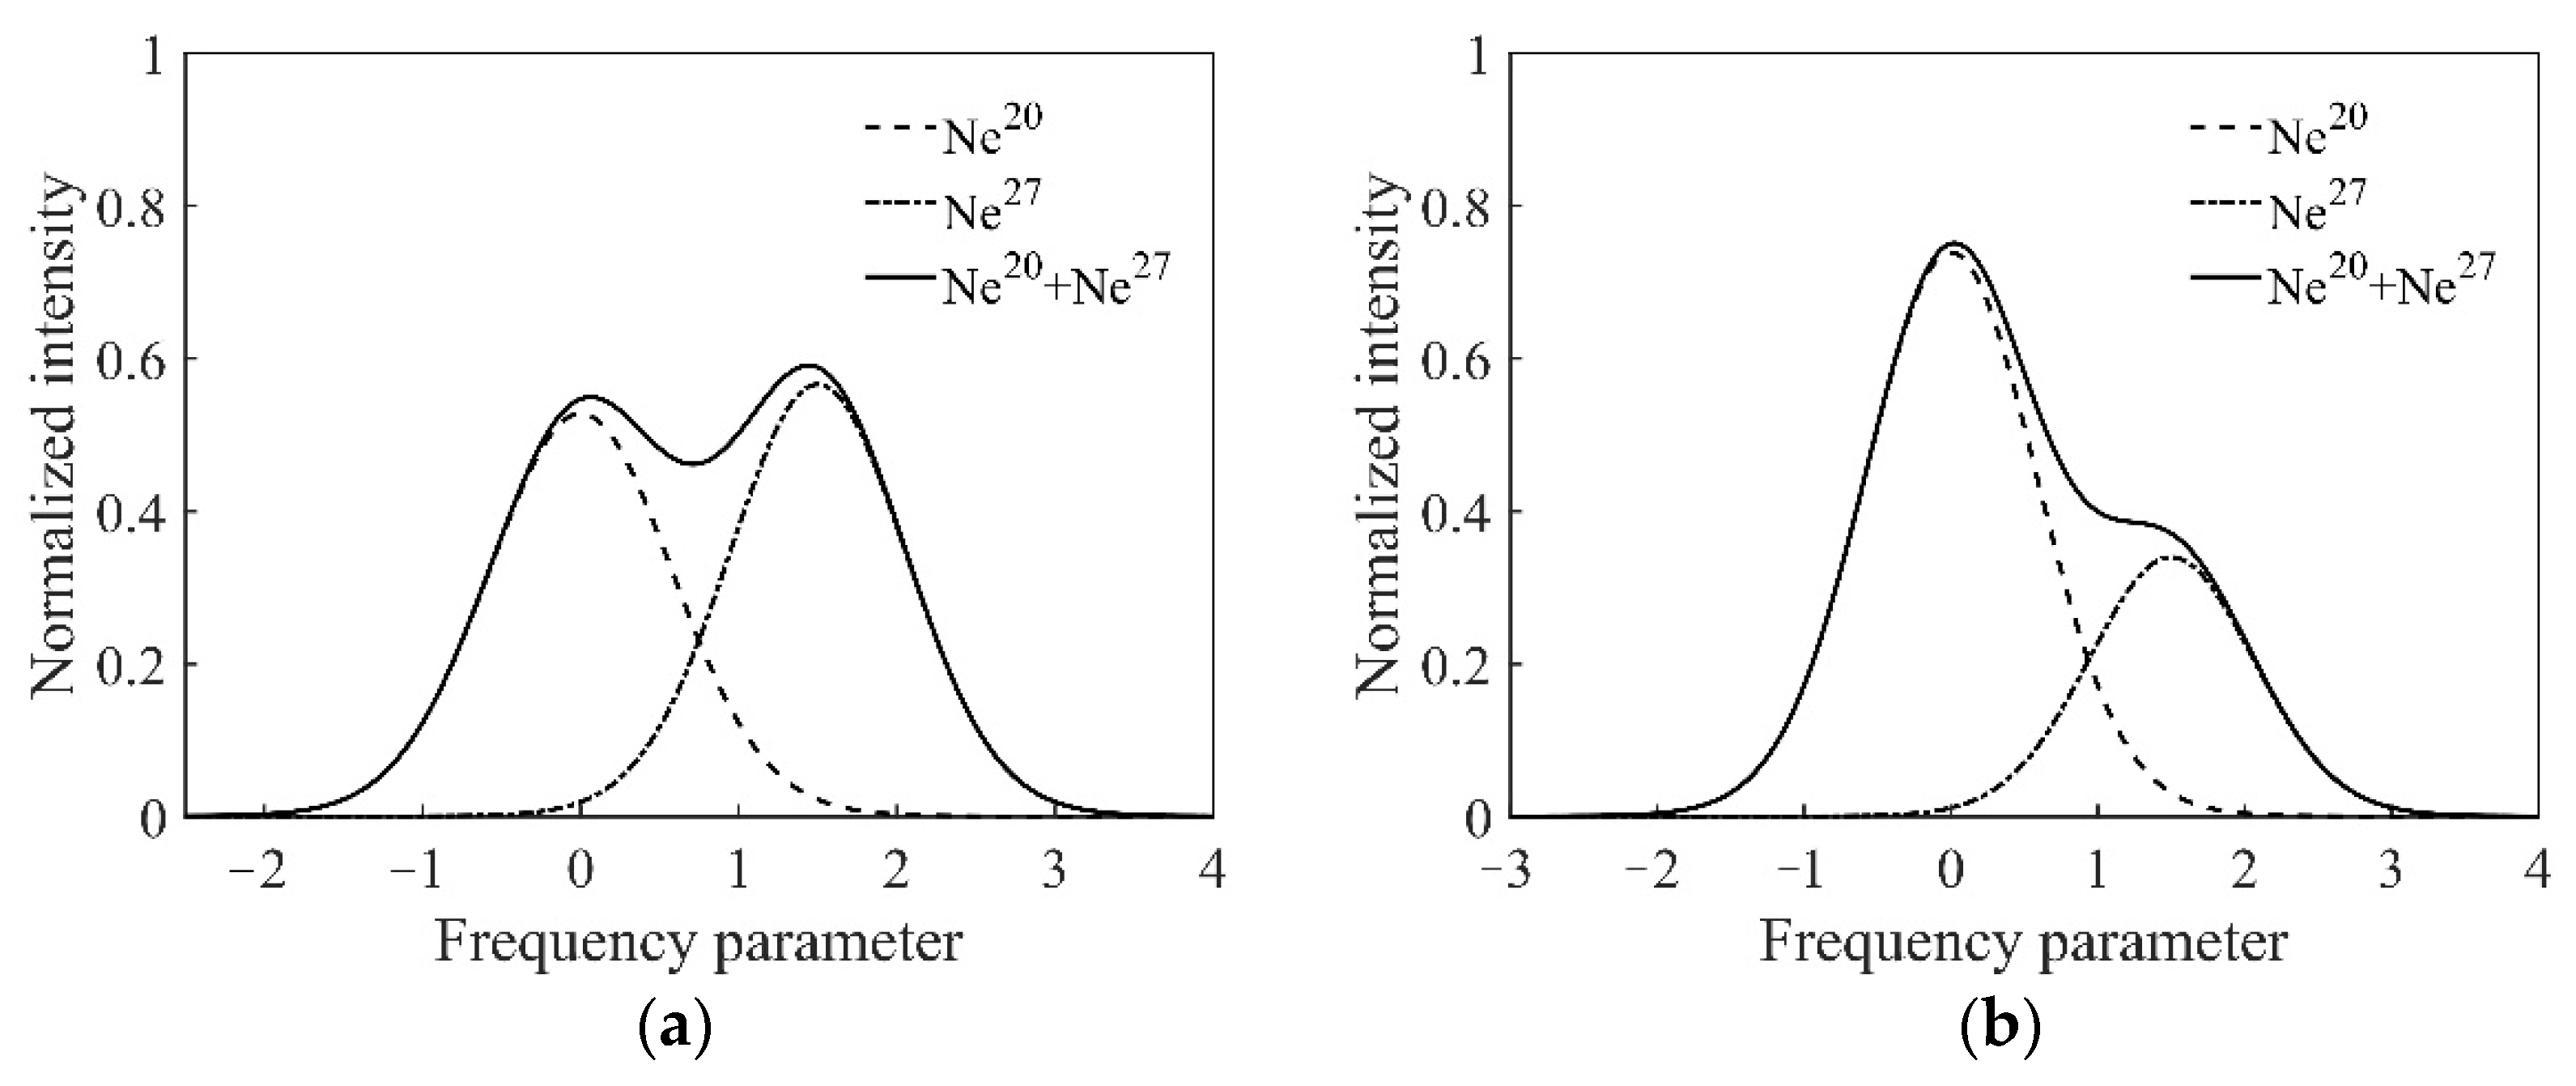
3.3. Ne Isotopes, Inflation Pressures, and Profile of the Intensity Tuning Curve
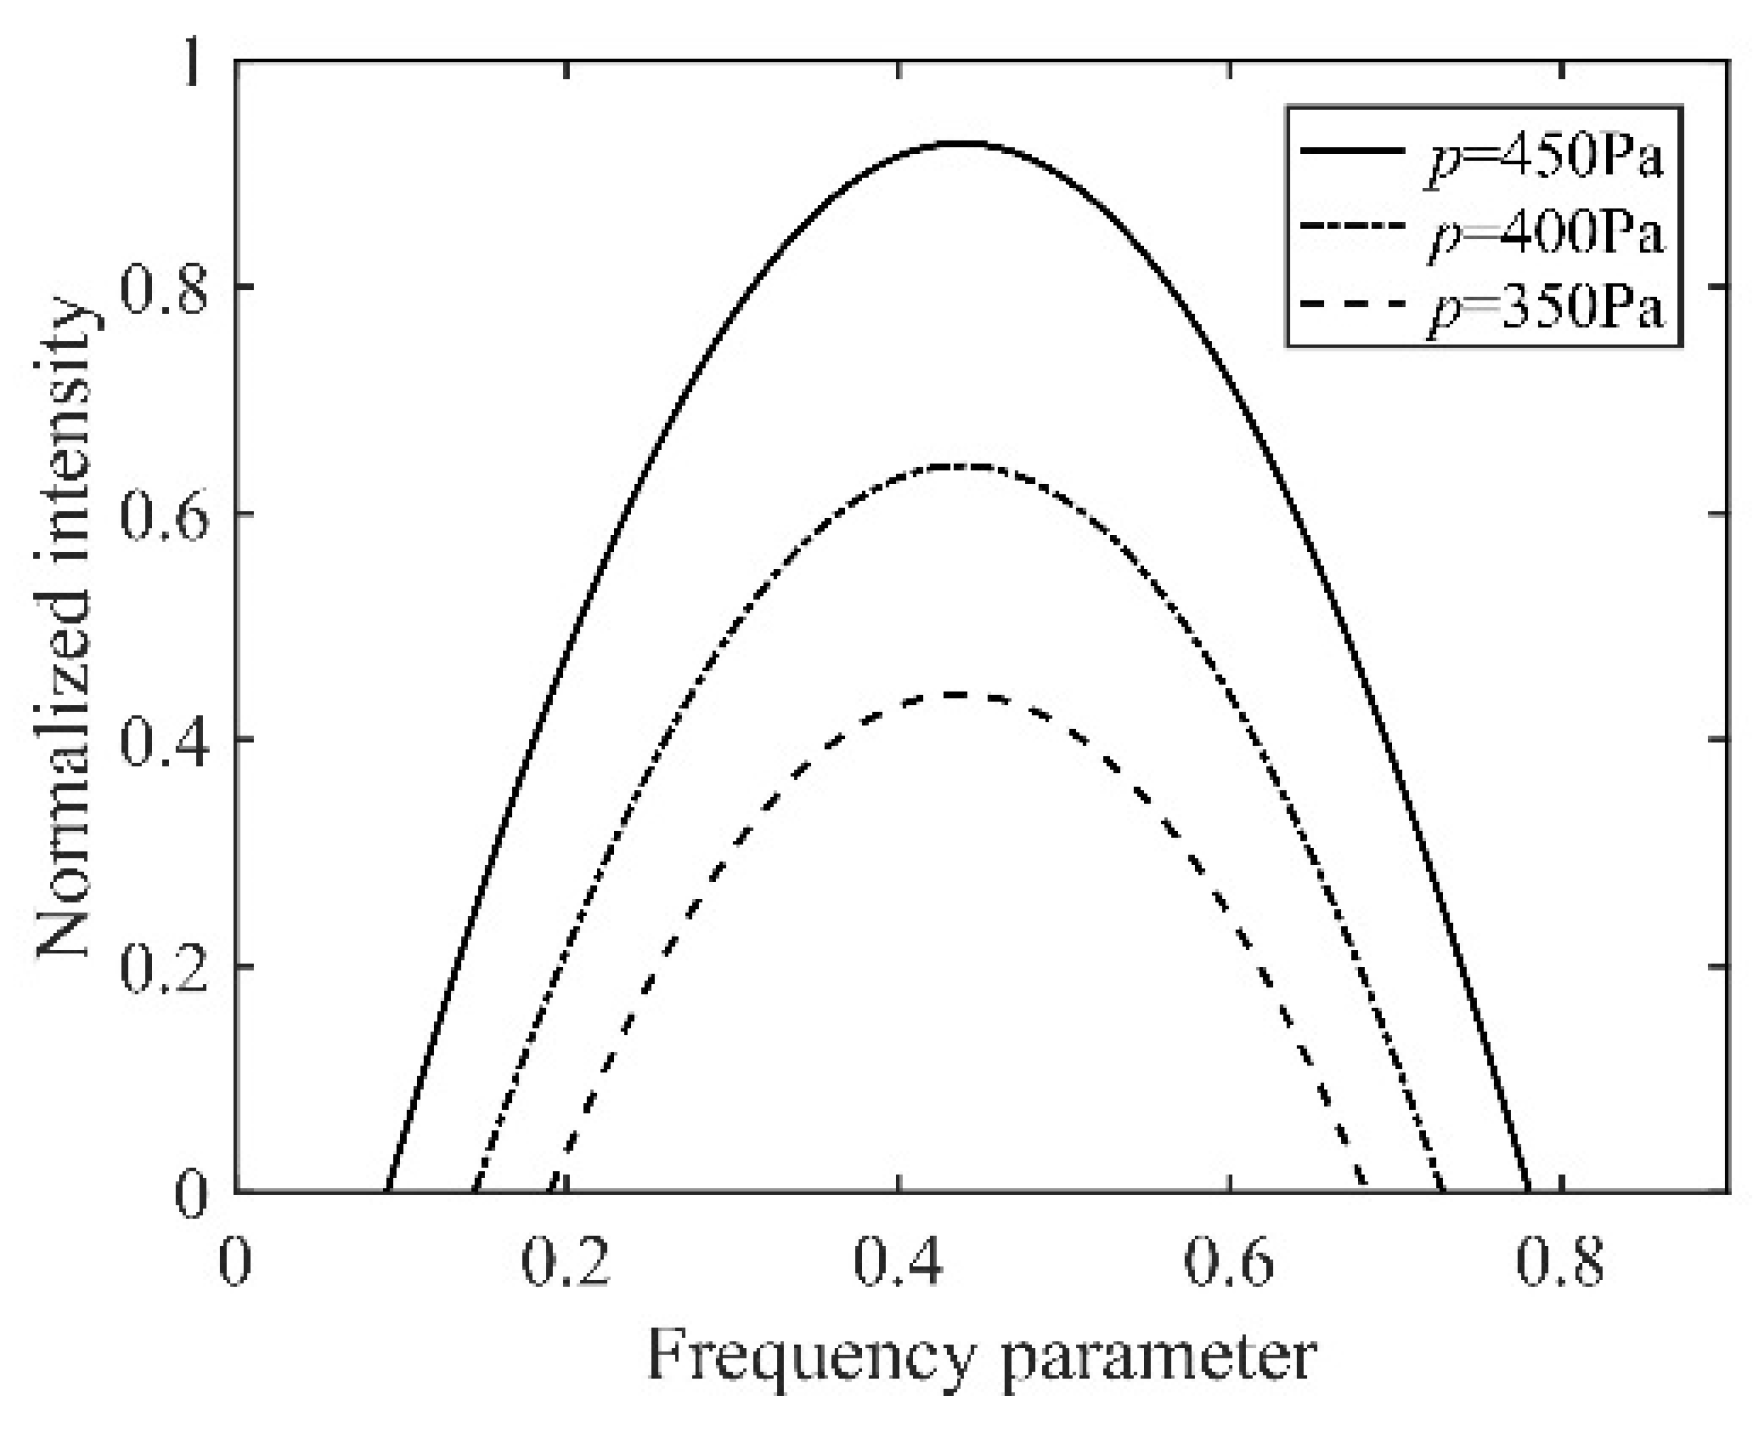
3.4. Inflation Pressure and Profile of Intensity Tuning Curve
4. Experimental Results
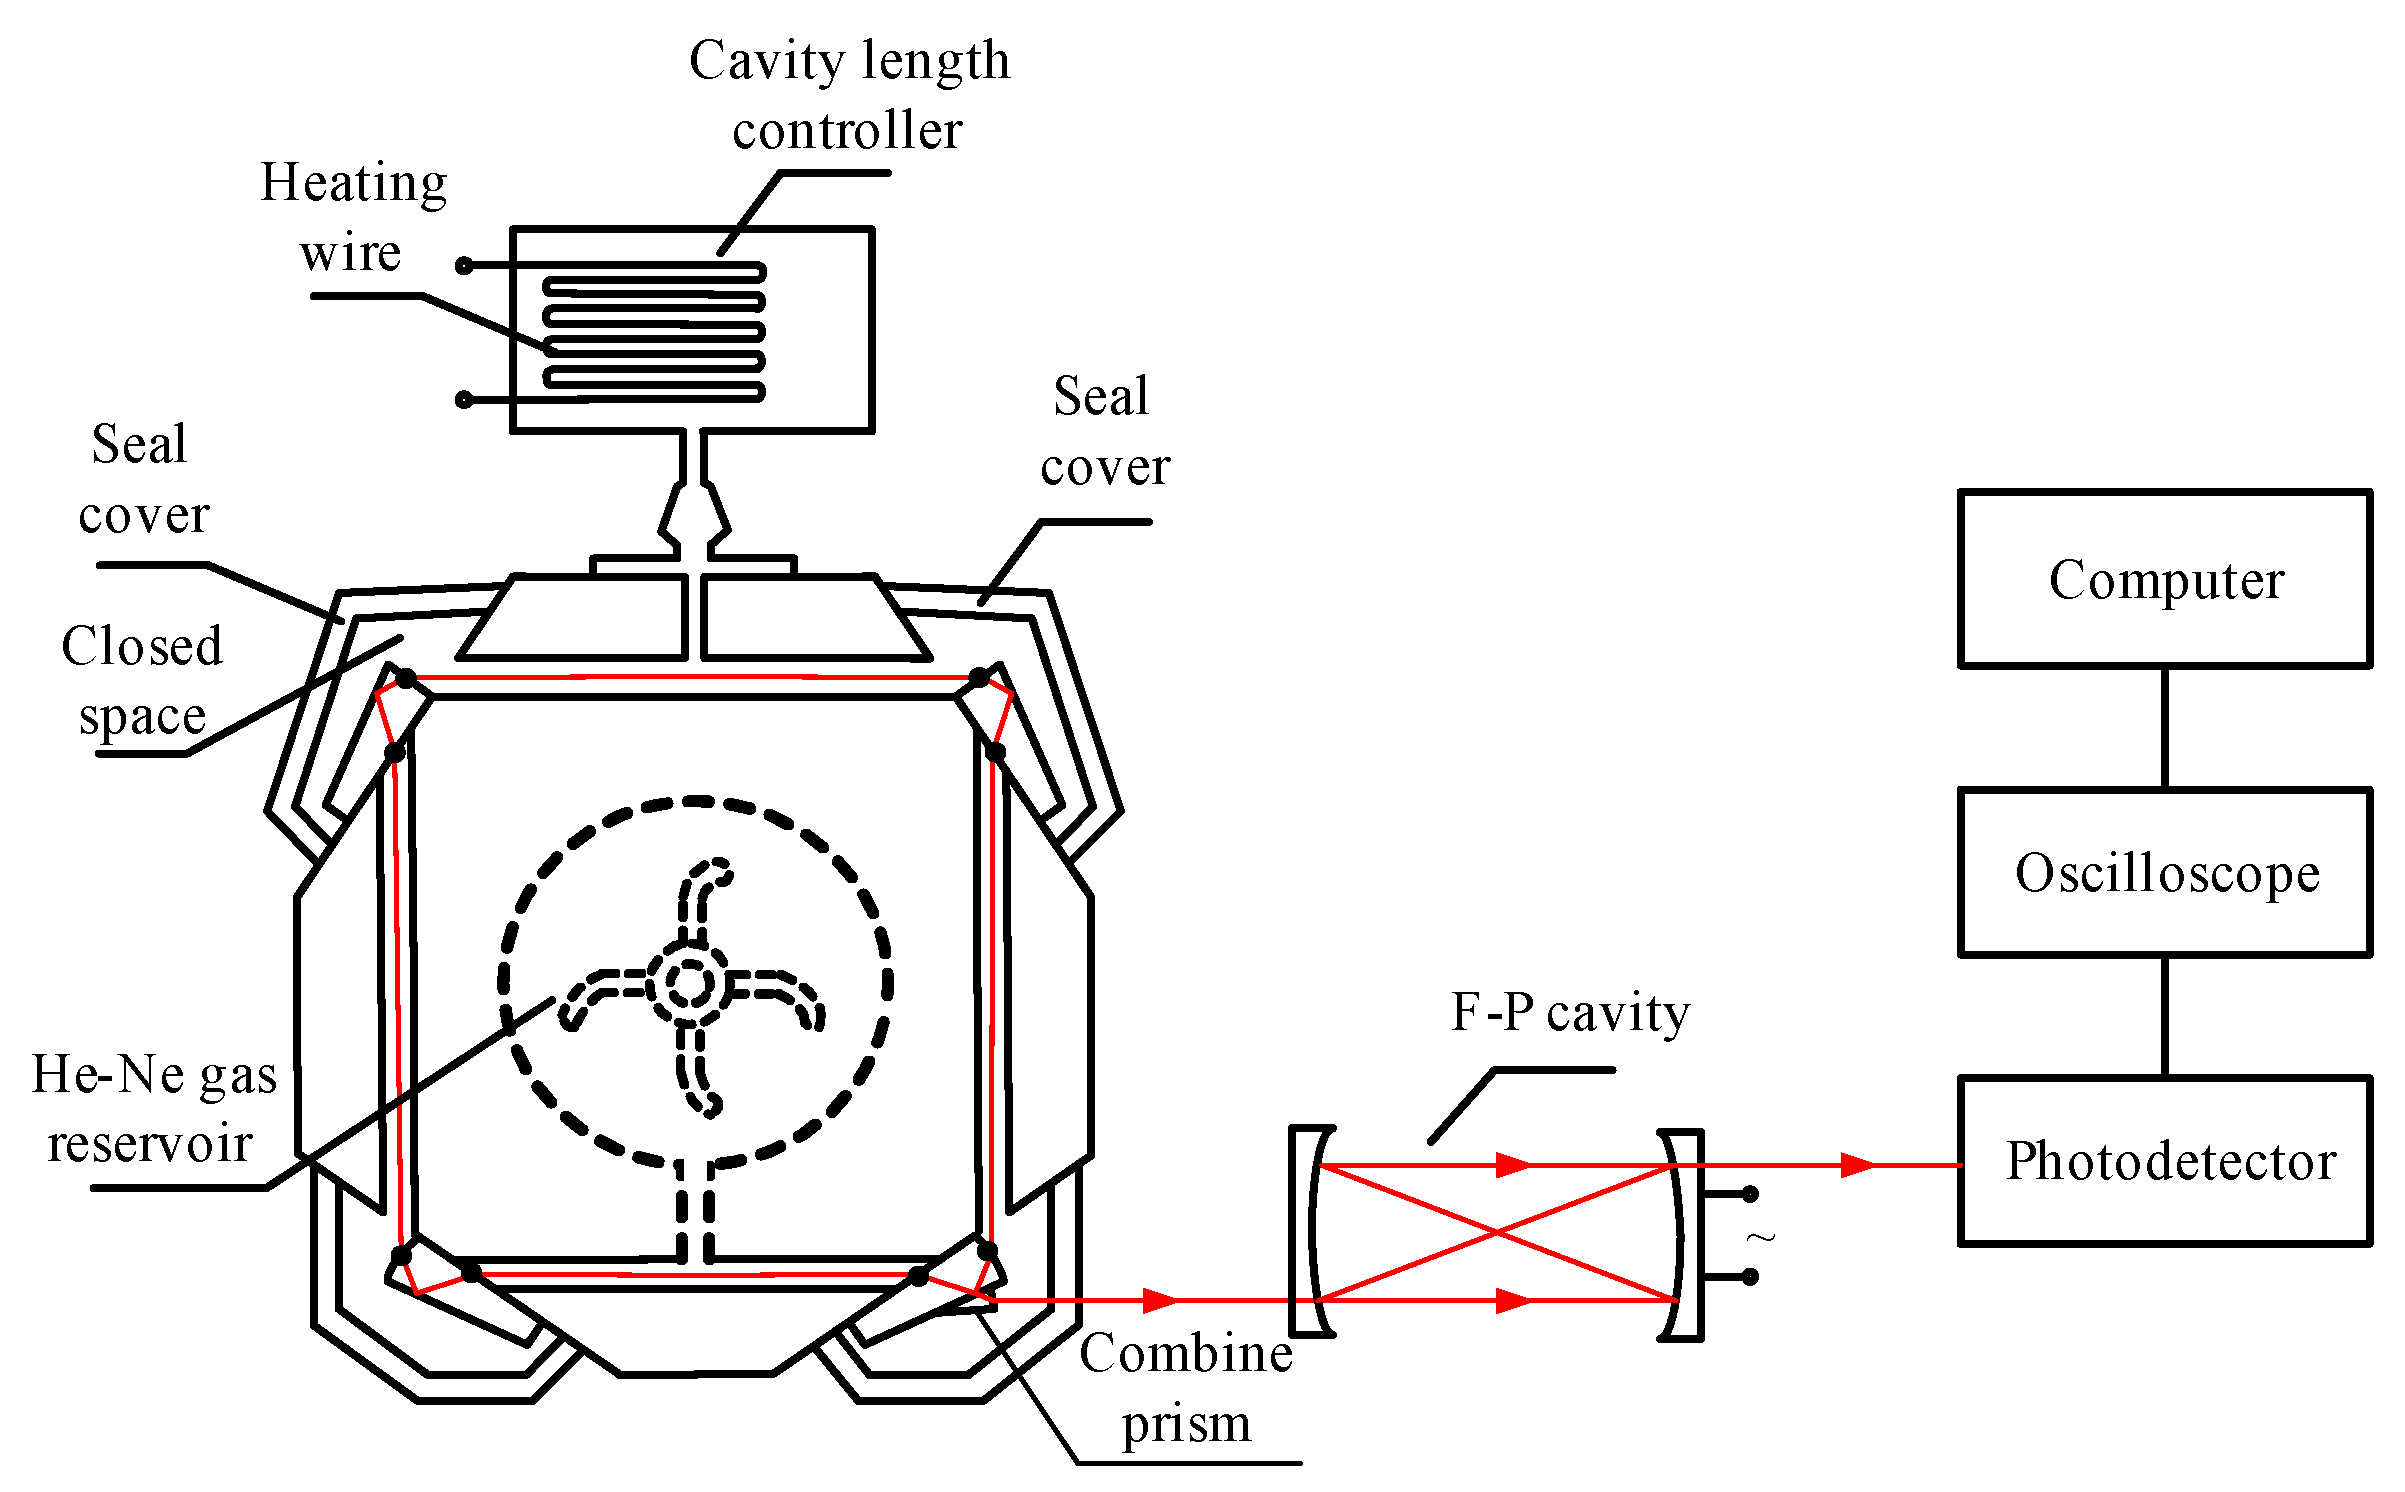
4.1. Experimental System
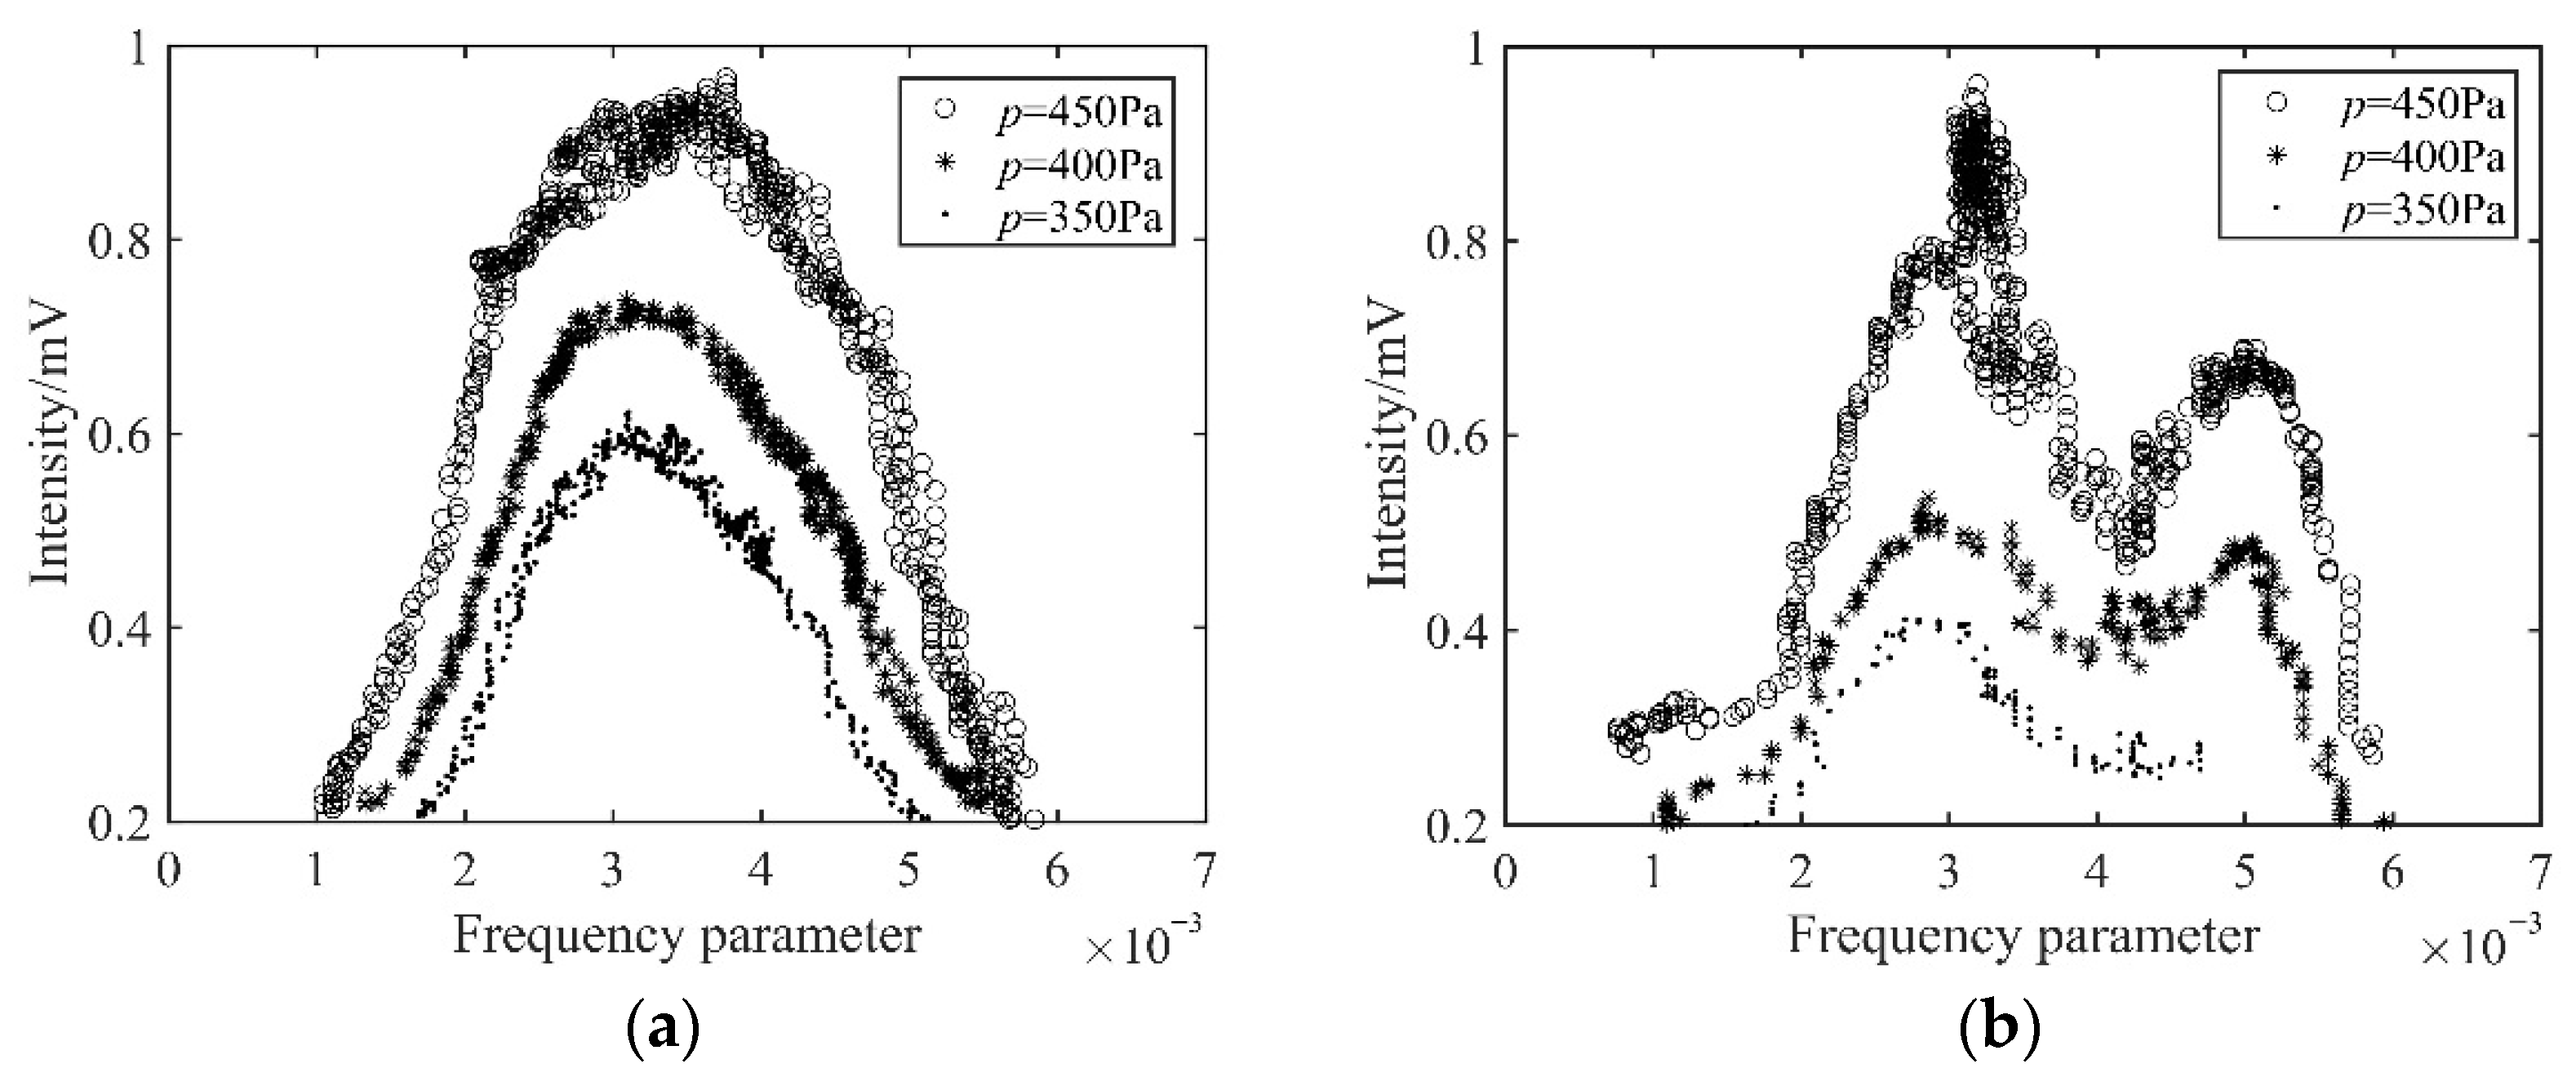
4.2. Ne Isotopes and Inflation Pressure Experiment
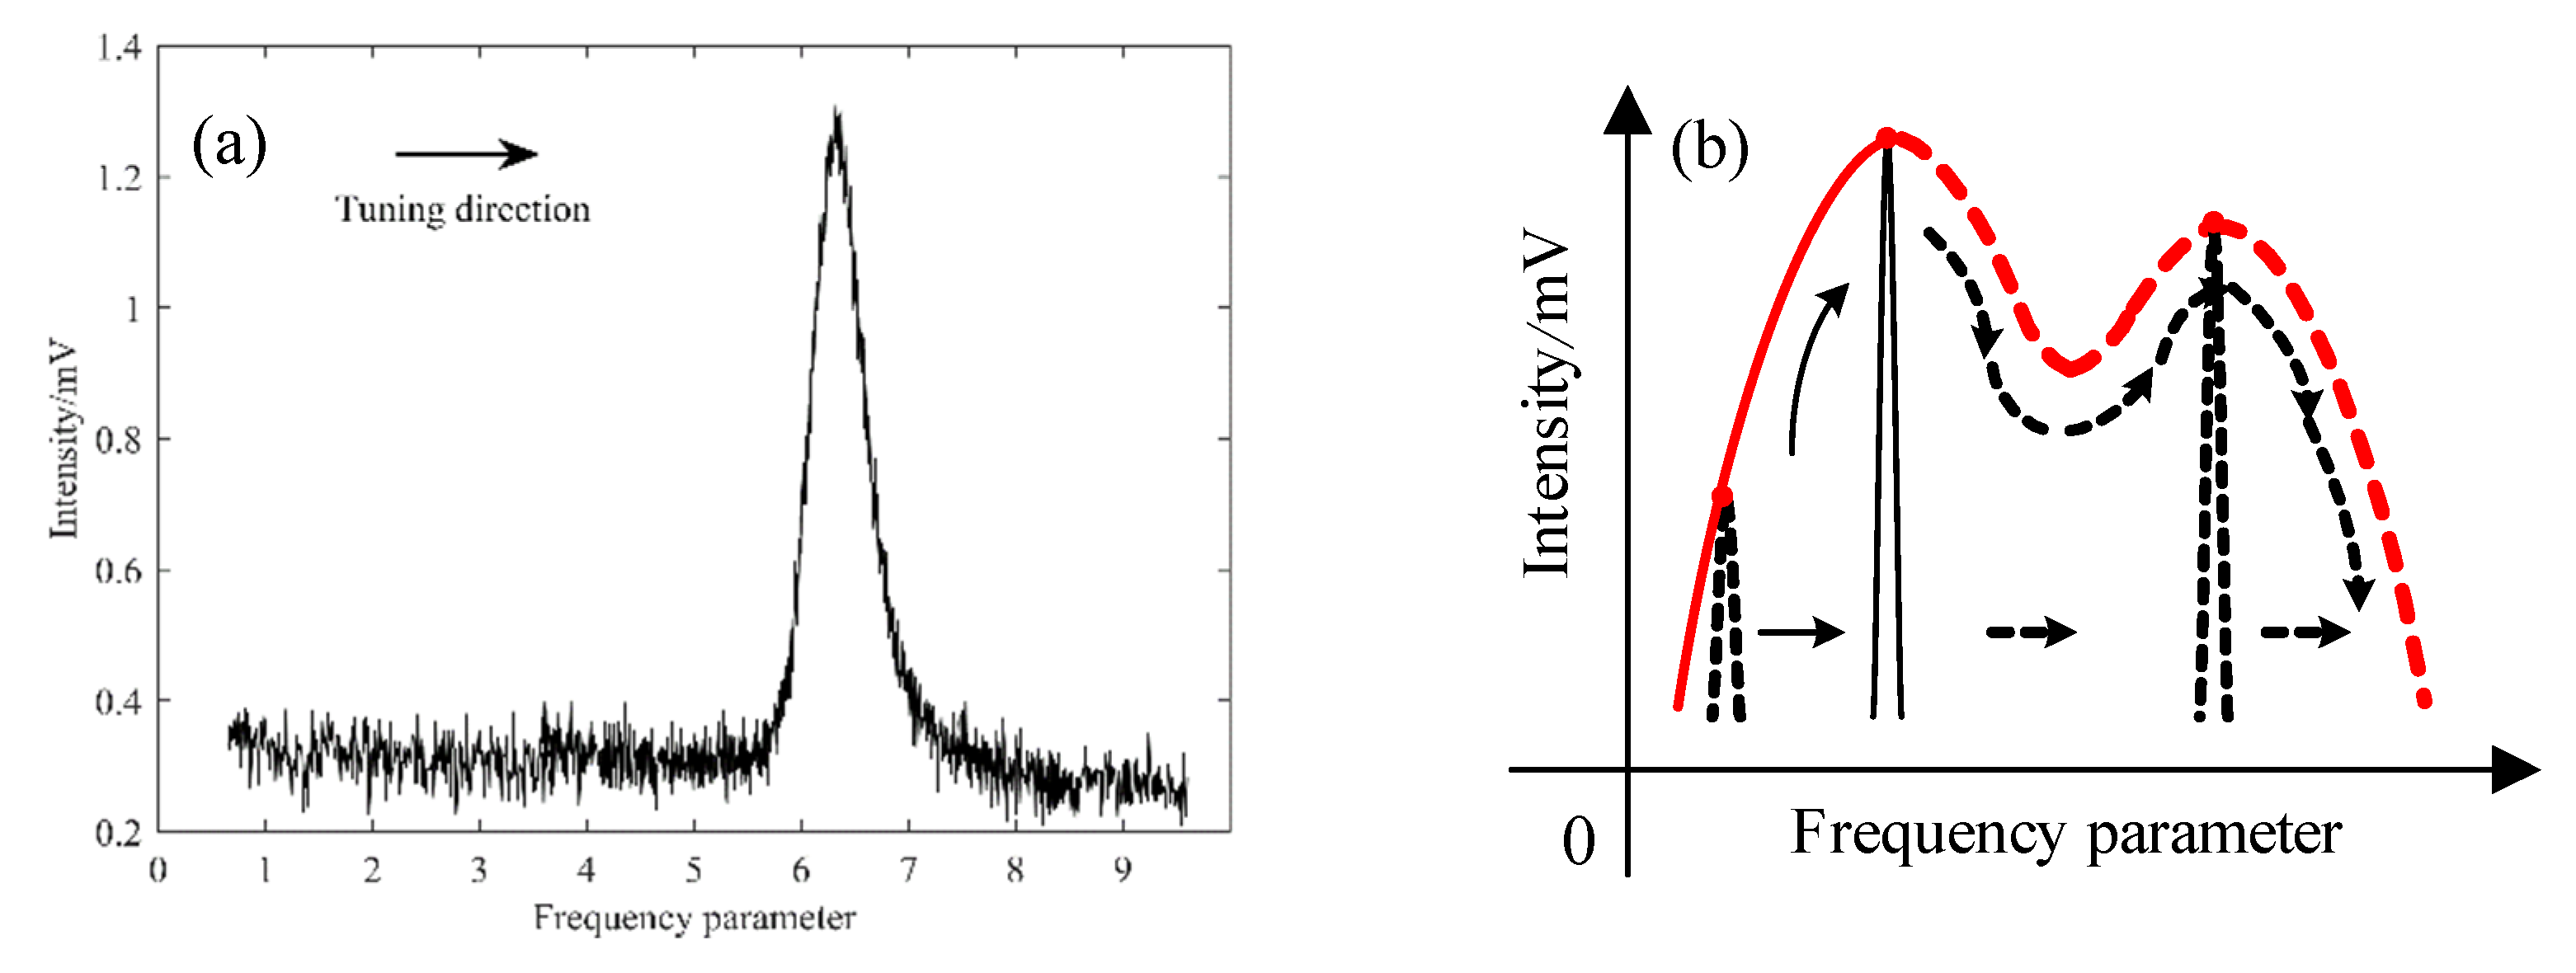
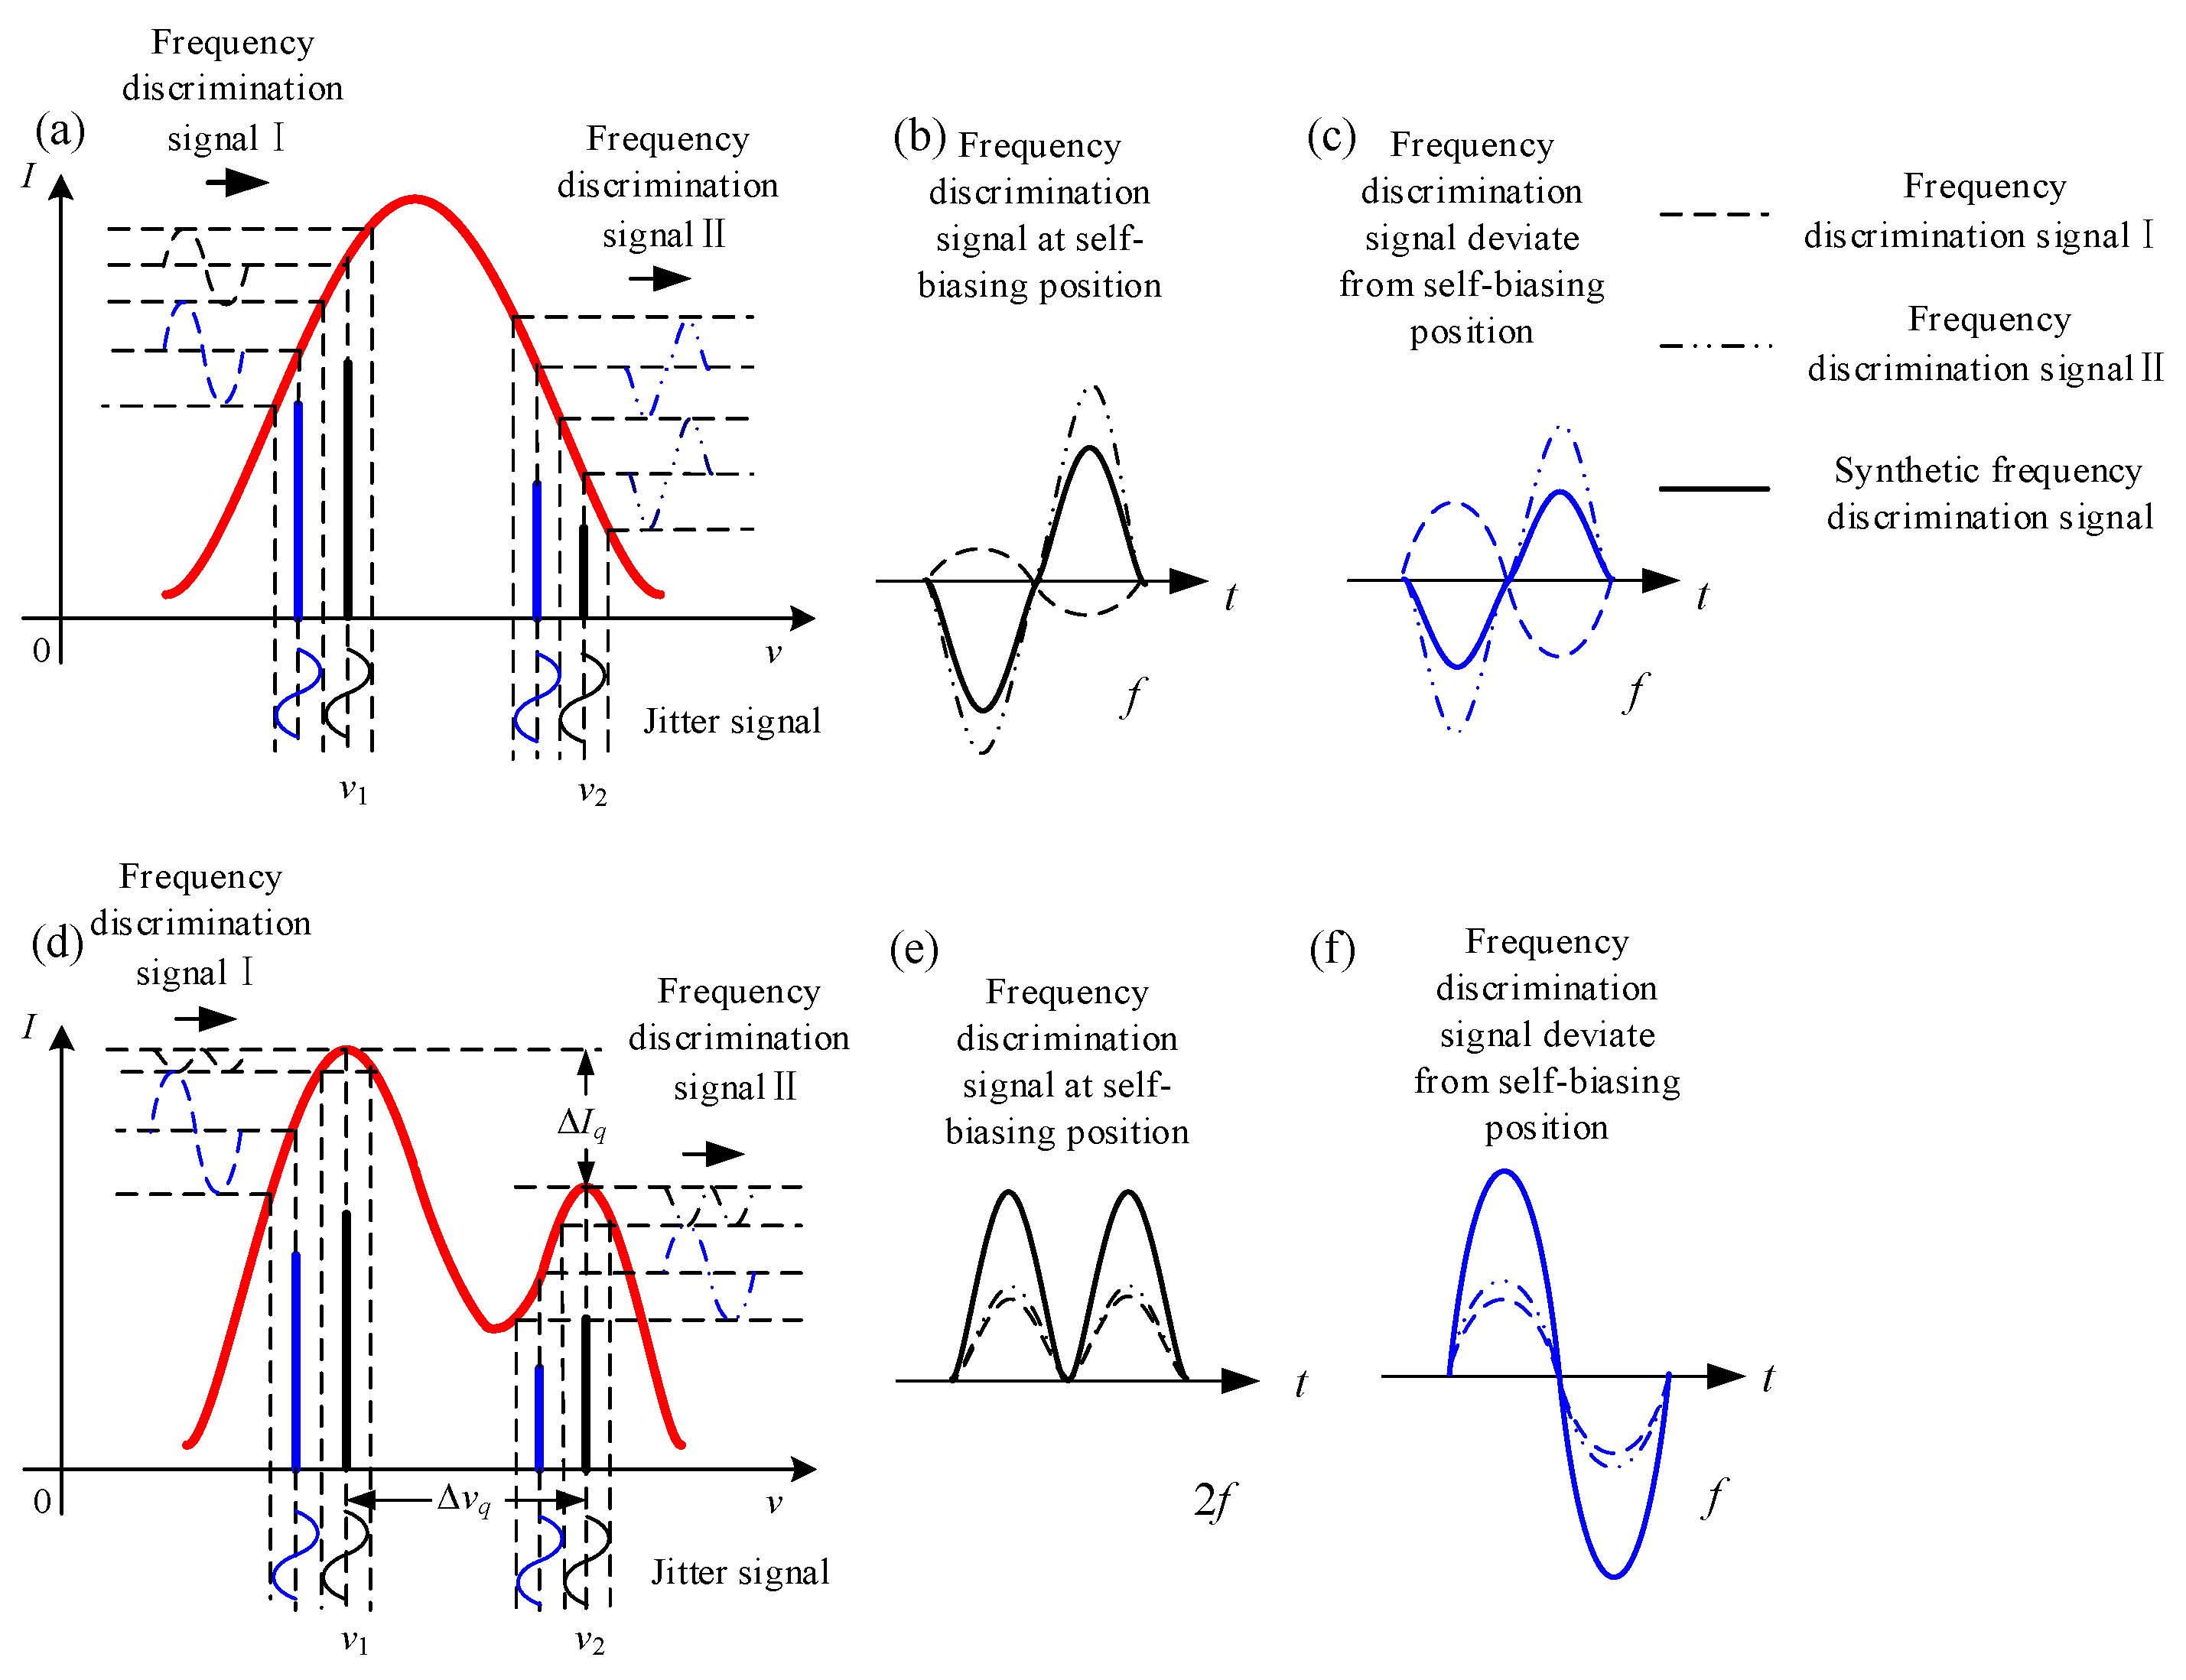
5. Dual-Mode Stabilization at the Asymmetrical Position
6. Conclusions
Author Contributions
Funding
Acknowledgments
Conflicts of Interest
References
- Filatov, Y.V.; Pavlov, P.A.; Velikoseltsev, A.A.; Schreiber, K.U. Precision angle measurement systems on the basis of ring laser gyro. Sensors 2020, 20, 6930. [Google Scholar] [CrossRef]
- Hokmabadi, M.P.; Schumer, A.; Christodoulides, D.N.; Khajavikhan, M. Non-Hermitian ring laser gyroscopes with enhanced Sagnac sensitivity. Nature 2019, 576, 70–74. [Google Scholar] [CrossRef] [PubMed]
- Weng, J.; Bian, X.; Kou, K.; Lian, T. Optimization of ring laser gyroscope bias compensation algorithm in variable temperature environment. Sensors 2020, 20, 377. [Google Scholar] [CrossRef] [PubMed]
- Azarova, V.V.; Golyaev, Y.D.; Kuznetsov, E.V. Effect of unequal intensity of counter-propagating waves on the frequency response of laser gyroscopes. Gyroscopy Navig. 2020, 11, 285–292. [Google Scholar] [CrossRef]
- Liu, J.; Jiao, M.; Jiang, J.; Lian, T.; Ma, J.; Liu, Y. Self-biasing phenomenon in prism laser gyro operating in double-longitudinal-mode state. Opt. Express 2018, 26, 32353–32364. [Google Scholar] [CrossRef] [PubMed]
- Chow, W.W.; Gea-Banacloche, J.; Pedrotti, L.M.; Sanders, V.E.; Schleich, W.; Scully, M.O. The ring laser gyro. Rev. Mod. Phys. 1985, 57, 86–89. [Google Scholar] [CrossRef]
- Liu, J.; Jiao, M.; Ma, J.; Lian, T.; Ren, L. Study of the double longitudinal mode operation and the Self-biasing phenomenon in prism laser gyro. Acta Armamentarii 2017, 38, 1113–1119. [Google Scholar]
- Milikov, E.A.; Broslavets, Y.; Semenov, V.G.; Fomichev, A.A. Four-frequency Zeeman laser gyro’s counter propagating waves signals processing methods. In Proceedings of the 2020 International Conference Laser Optics, St. Petersburg, Russia, 2–6 November 2020. [Google Scholar]
- Diao, X.; Tan, J.; Hu, P.; Yang, H.; Wang, P. Frequency stabilization of an internal mirror He-Ne laser with a high frequency reproducibility. Appl. Opt. 2013, 52, 456–460. [Google Scholar] [CrossRef] [PubMed]
- Arkhipov, I.I.; Miranowicz, A.; Stefano, O.D.; Stassi, R.; Savasta, S.; Nori, F.; Őzdemir, Ş.K. Scully-Lamb quantum laser model for parity-time-symmetric whispering-gallery microcavities: Gain saturation effects and non-reciprocity. Phys. Rev. A 2019, 99, 053806. [Google Scholar] [CrossRef]
- Lamb, W.E. Theory of an optical maser. Phys. Rev. A 1964, 134, 1429–1449. [Google Scholar] [CrossRef]
- Vyas, R.; Singh, S. Laser theory without the rotating-wave approximation. Phys. Rev. A 1986, 33, 375. [Google Scholar] [CrossRef] [PubMed]
- Stenholm, S. The Semiclassical Theory of the Gas Laser; Pergamon Press: New York, NY, USA, 1971; pp. 189–267. [Google Scholar]
- O’Bryan, C.L.; Sargent, M. Theory of multimode laser operation. Phys. Rev. A 1973, 8, 3071–3092. [Google Scholar] [CrossRef]
- Summer, D.; Thorne, R.M. The modified plasma dispersion function. Phys. Plasma 1991, 3, 69–71. [Google Scholar] [CrossRef]
- Yoon, P.H. Plasma Dispersion Function; Cambridge University Press: Cambridge, UK, 2019; pp. 309–312. [Google Scholar]
- Pinhas, H.; Wagner, O.; Danan, Y.; Danino, M.; Zalevsky, Z.; Sinvani, M. Plasma dispersion effect based super-resolved imaging in silicon. Opt. Express 2018, 26, 25370–25380. [Google Scholar] [CrossRef]
- Tao, Y.; Li, S.; Zheng, J.; Wu, F.; Fu, Q. High precision compensation for a total reflection prism laser gyro bias in consideration of high frequency oscillator voltage. Sensors 2019, 19, 2986. [Google Scholar] [CrossRef]
- Tao, Y.; Li, S.; Fu, Q.; Zheng, J.; Liu, S.; Yuan, Y. A method for improving light intensity stability of a total reflection prism laser gyro based on series correction and feedforward compensation. IEEE Access 2020, 8, 13651–13660. [Google Scholar] [CrossRef]
- Chow, W.W.; Hambenne, J.B.; Hutchings, T.J.; Sanders, V.E.; Sargent, M.; Scully, M.O. Multioscillator laser gyros. IEEE J. Quantum Electron. 1980, 16, 918–936. [Google Scholar] [CrossRef]
- Jiang, Y. Ring Laser Gyroscope; Tsinghua University Press: Beijing, China, 1985; p. 73. [Google Scholar]
- Holden, N.E. Table of the Isotopes (Revised 2002); Brookhaven National Laboratory: New York, NY, USA, 2005; pp. 3–4. [Google Scholar]
- Ohta, T.; Seriu, J.; Ogawa, T. Isotope effects in the two-mode operation of a He-Ne laser. Opt. Quantum Electron. 1974, 6, 433–442. [Google Scholar] [CrossRef]
- Audi, G.; Bersillon, O.; Blachot, J.; Wapstra, A.H. The Nubase evaluation of nuclear and decay properties. Nucl. Phys. A 2003, 729, 3–128. [Google Scholar] [CrossRef]
- Bakin, Y.V.; Ziouzev, G.N.; Lioudomirski, M.B. Laser Gyros with Total Reflection Prisms; Bauman Moscow State Technical University: Moscow, Russian, 2003; pp. 1–34. [Google Scholar]
- Grant, M.J.; Digonnet, M.J.F. Enhanced rotation sensing and exceptional points in a parity-time-symmetric coupled-ring gyroscope. Opt. Lett. 2020, 45, 6538–6541. [Google Scholar] [CrossRef]
- Poudyal, S.; Srivastava, S.; Gowrishankar, R. Self-beating resonant optical gyroscope with a “reflector”: The possibility of high sensitivities at reduced costs. Appl. Opt. 2019, 58, 1699–1701. [Google Scholar]
- Sunada, S. Large Sagnac frequency splitting in a ring resonator operating at an exceptional point. Phys. Rev. A 2017, 96, 033842. [Google Scholar] [CrossRef]


| Pressure (Pa) | η | ℜ | Gm/G0 | k0 |
|---|---|---|---|---|
| 350 | 0.15 | 0.41 | 0.88 | 1.01 |
| 400 | 0.20 | 0.42 | 0.87 | 1.02 |
| 450 | 0.30 | 0.43 | 0.86 | 1.04 |
Publisher’s Note: MDPI stays neutral with regard to jurisdictional claims in published maps and institutional affiliations. |
© 2022 by the authors. Licensee MDPI, Basel, Switzerland. This article is an open access article distributed under the terms and conditions of the Creative Commons Attribution (CC BY) license (https://creativecommons.org/licenses/by/4.0/).
Share and Cite
Liu, J.; Weng, J.; Jiang, J.; Liu, Y.; Jiao, M.; Zhao, K.; Zheng, Y. Study of the Steady-State Operation of a Dual-Longitudinal-Mode and Self-Biasing Laser Gyroscope. Sensors 2022, 22, 6300. https://doi.org/10.3390/s22166300
Liu J, Weng J, Jiang J, Liu Y, Jiao M, Zhao K, Zheng Y. Study of the Steady-State Operation of a Dual-Longitudinal-Mode and Self-Biasing Laser Gyroscope. Sensors. 2022; 22(16):6300. https://doi.org/10.3390/s22166300
Chicago/Turabian StyleLiu, Jianning, Jun Weng, Junbiao Jiang, Yujie Liu, Mingxing Jiao, Kai Zhao, and Yi Zheng. 2022. "Study of the Steady-State Operation of a Dual-Longitudinal-Mode and Self-Biasing Laser Gyroscope" Sensors 22, no. 16: 6300. https://doi.org/10.3390/s22166300
APA StyleLiu, J., Weng, J., Jiang, J., Liu, Y., Jiao, M., Zhao, K., & Zheng, Y. (2022). Study of the Steady-State Operation of a Dual-Longitudinal-Mode and Self-Biasing Laser Gyroscope. Sensors, 22(16), 6300. https://doi.org/10.3390/s22166300