
Development of an Adaptive Computer-Aided Soft Sensor Diagnosis System for Assessment of Executive Functions

 , , ,
, , ,  and
and 
Abstract
:1. Introduction
2. Classical or Technology-Based Testing
3. Technology and Neurodevelopmental Disorders
4. The Assessment of Executive Functions (EF) in Neuropsychology
5. Goal of the Present Study
6. Administering the Tower of London Adaptive Test
6.1. Background
6.2. The Framework
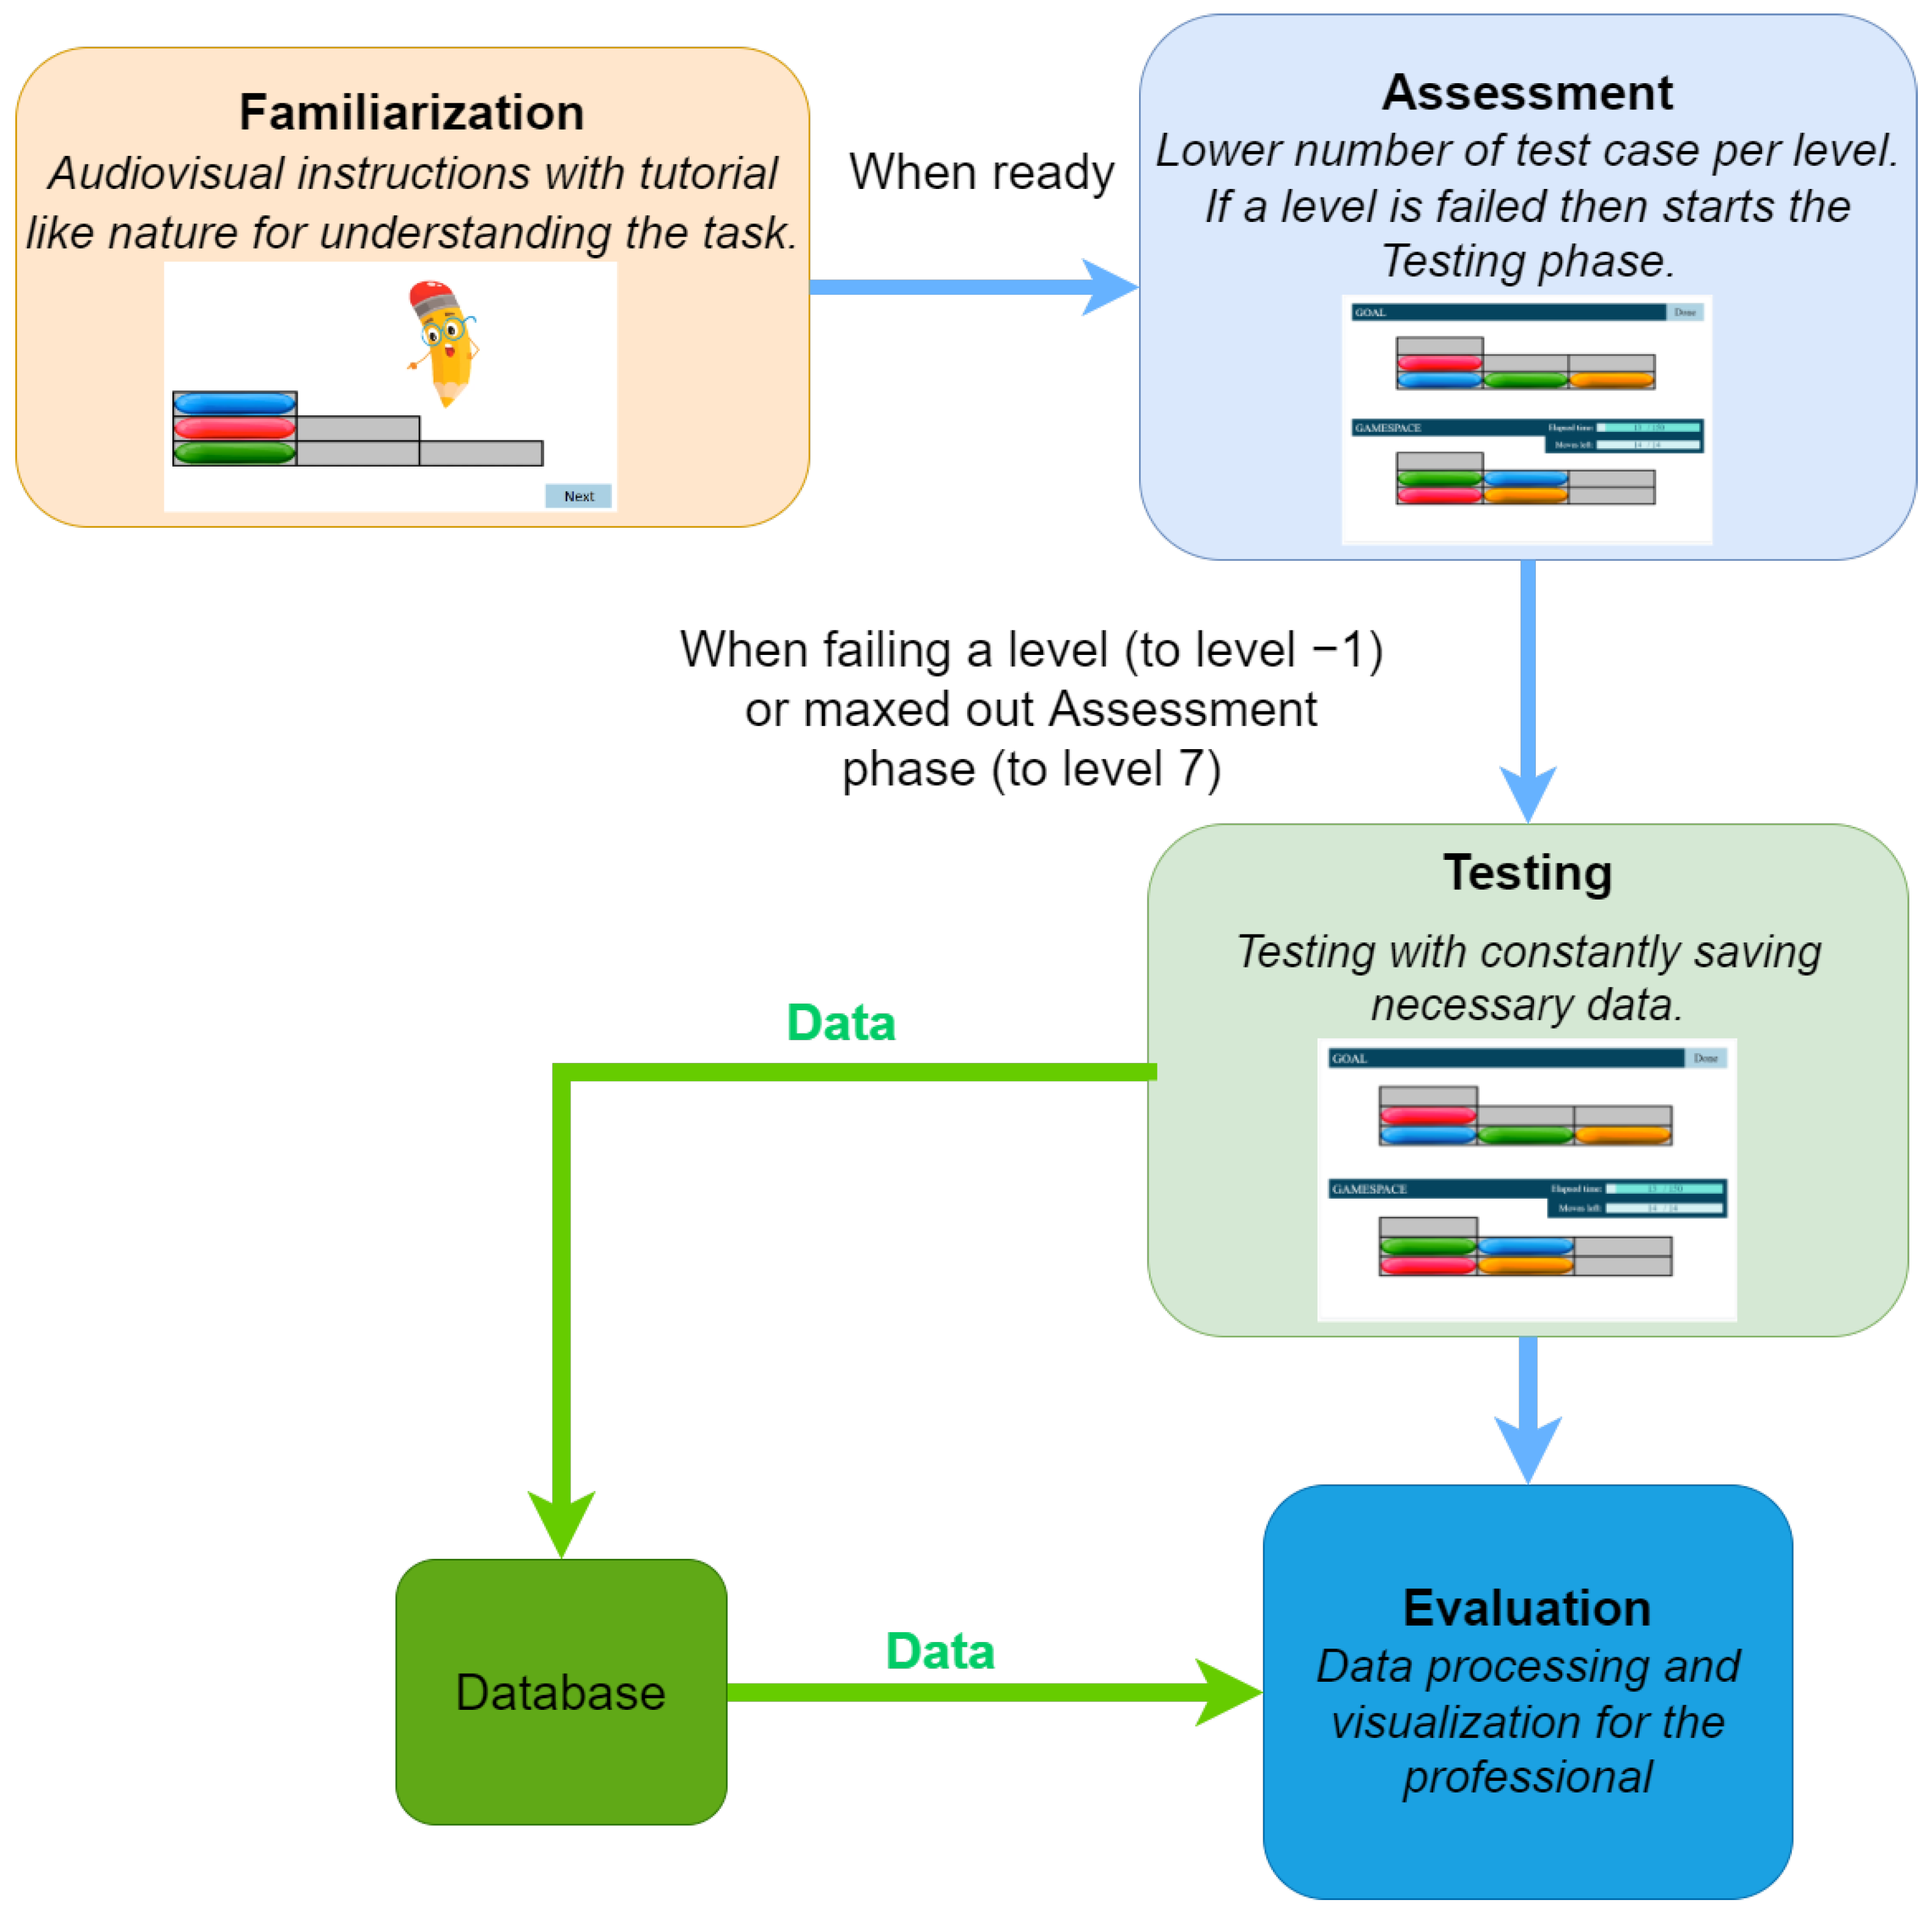
6.3. Software
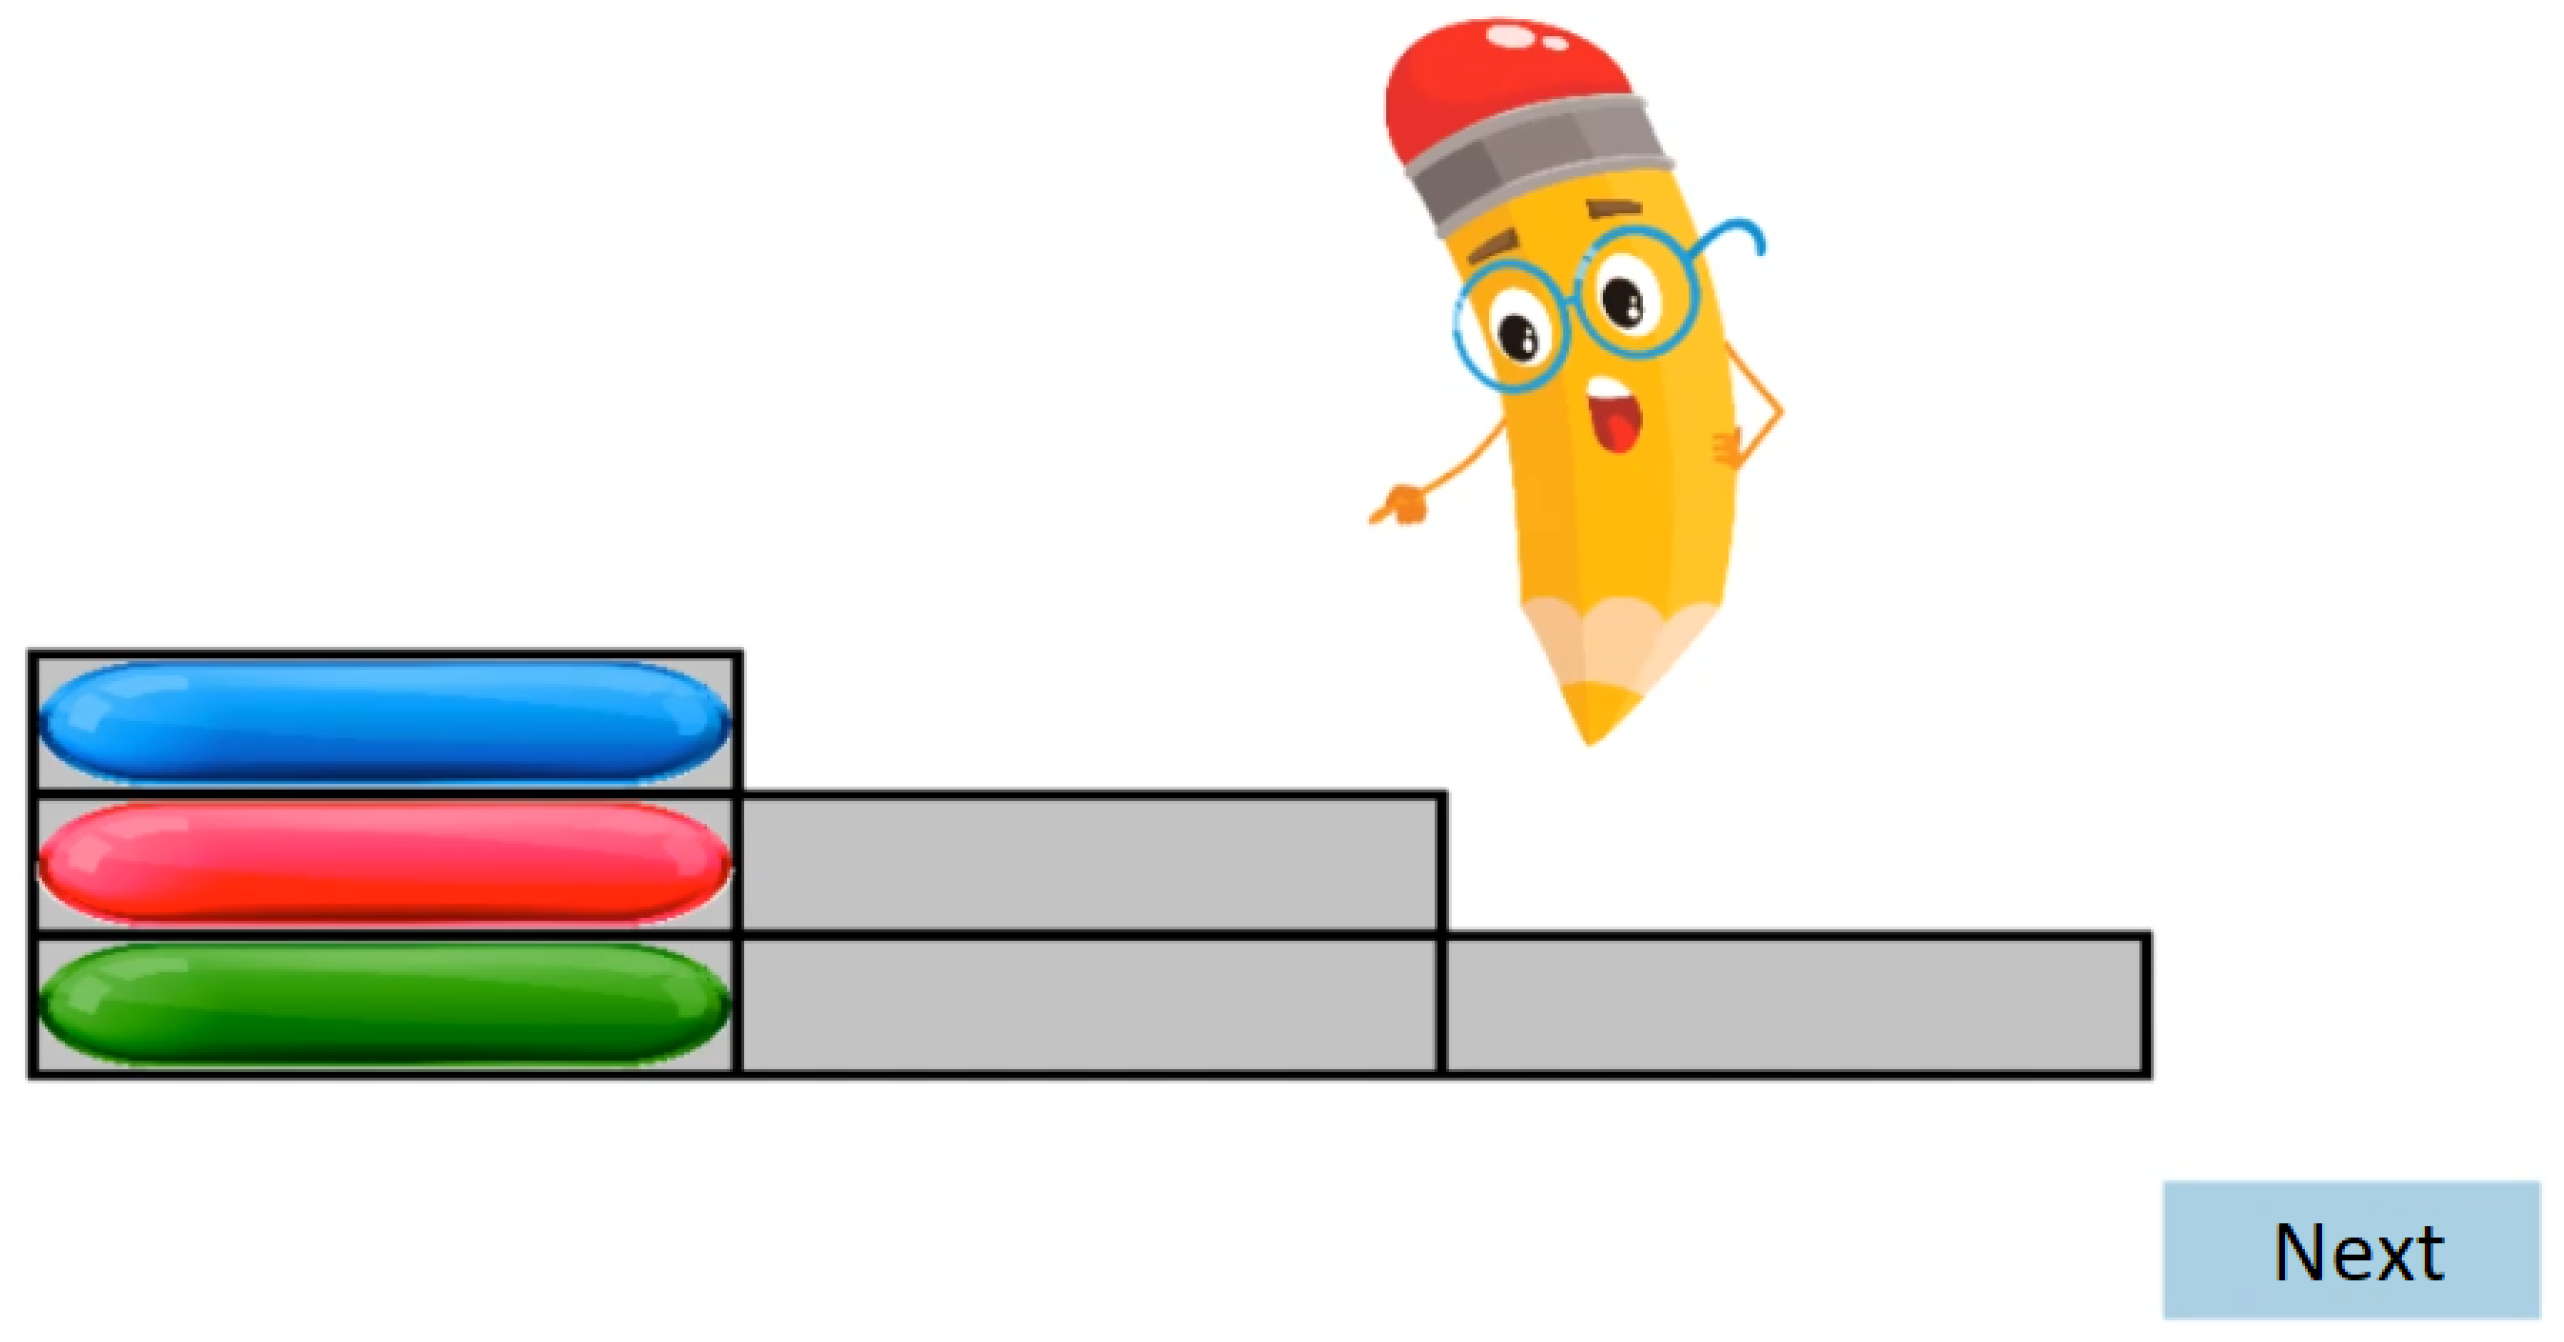
- During the Familiarization phase, an animated tutorial is performed, which is designed to get high attention from the participants’ age group (see Figure 2). At the end of the Familiarization, there are two test cases with feedback. There is no measurement during the Familiarization phase test cases.
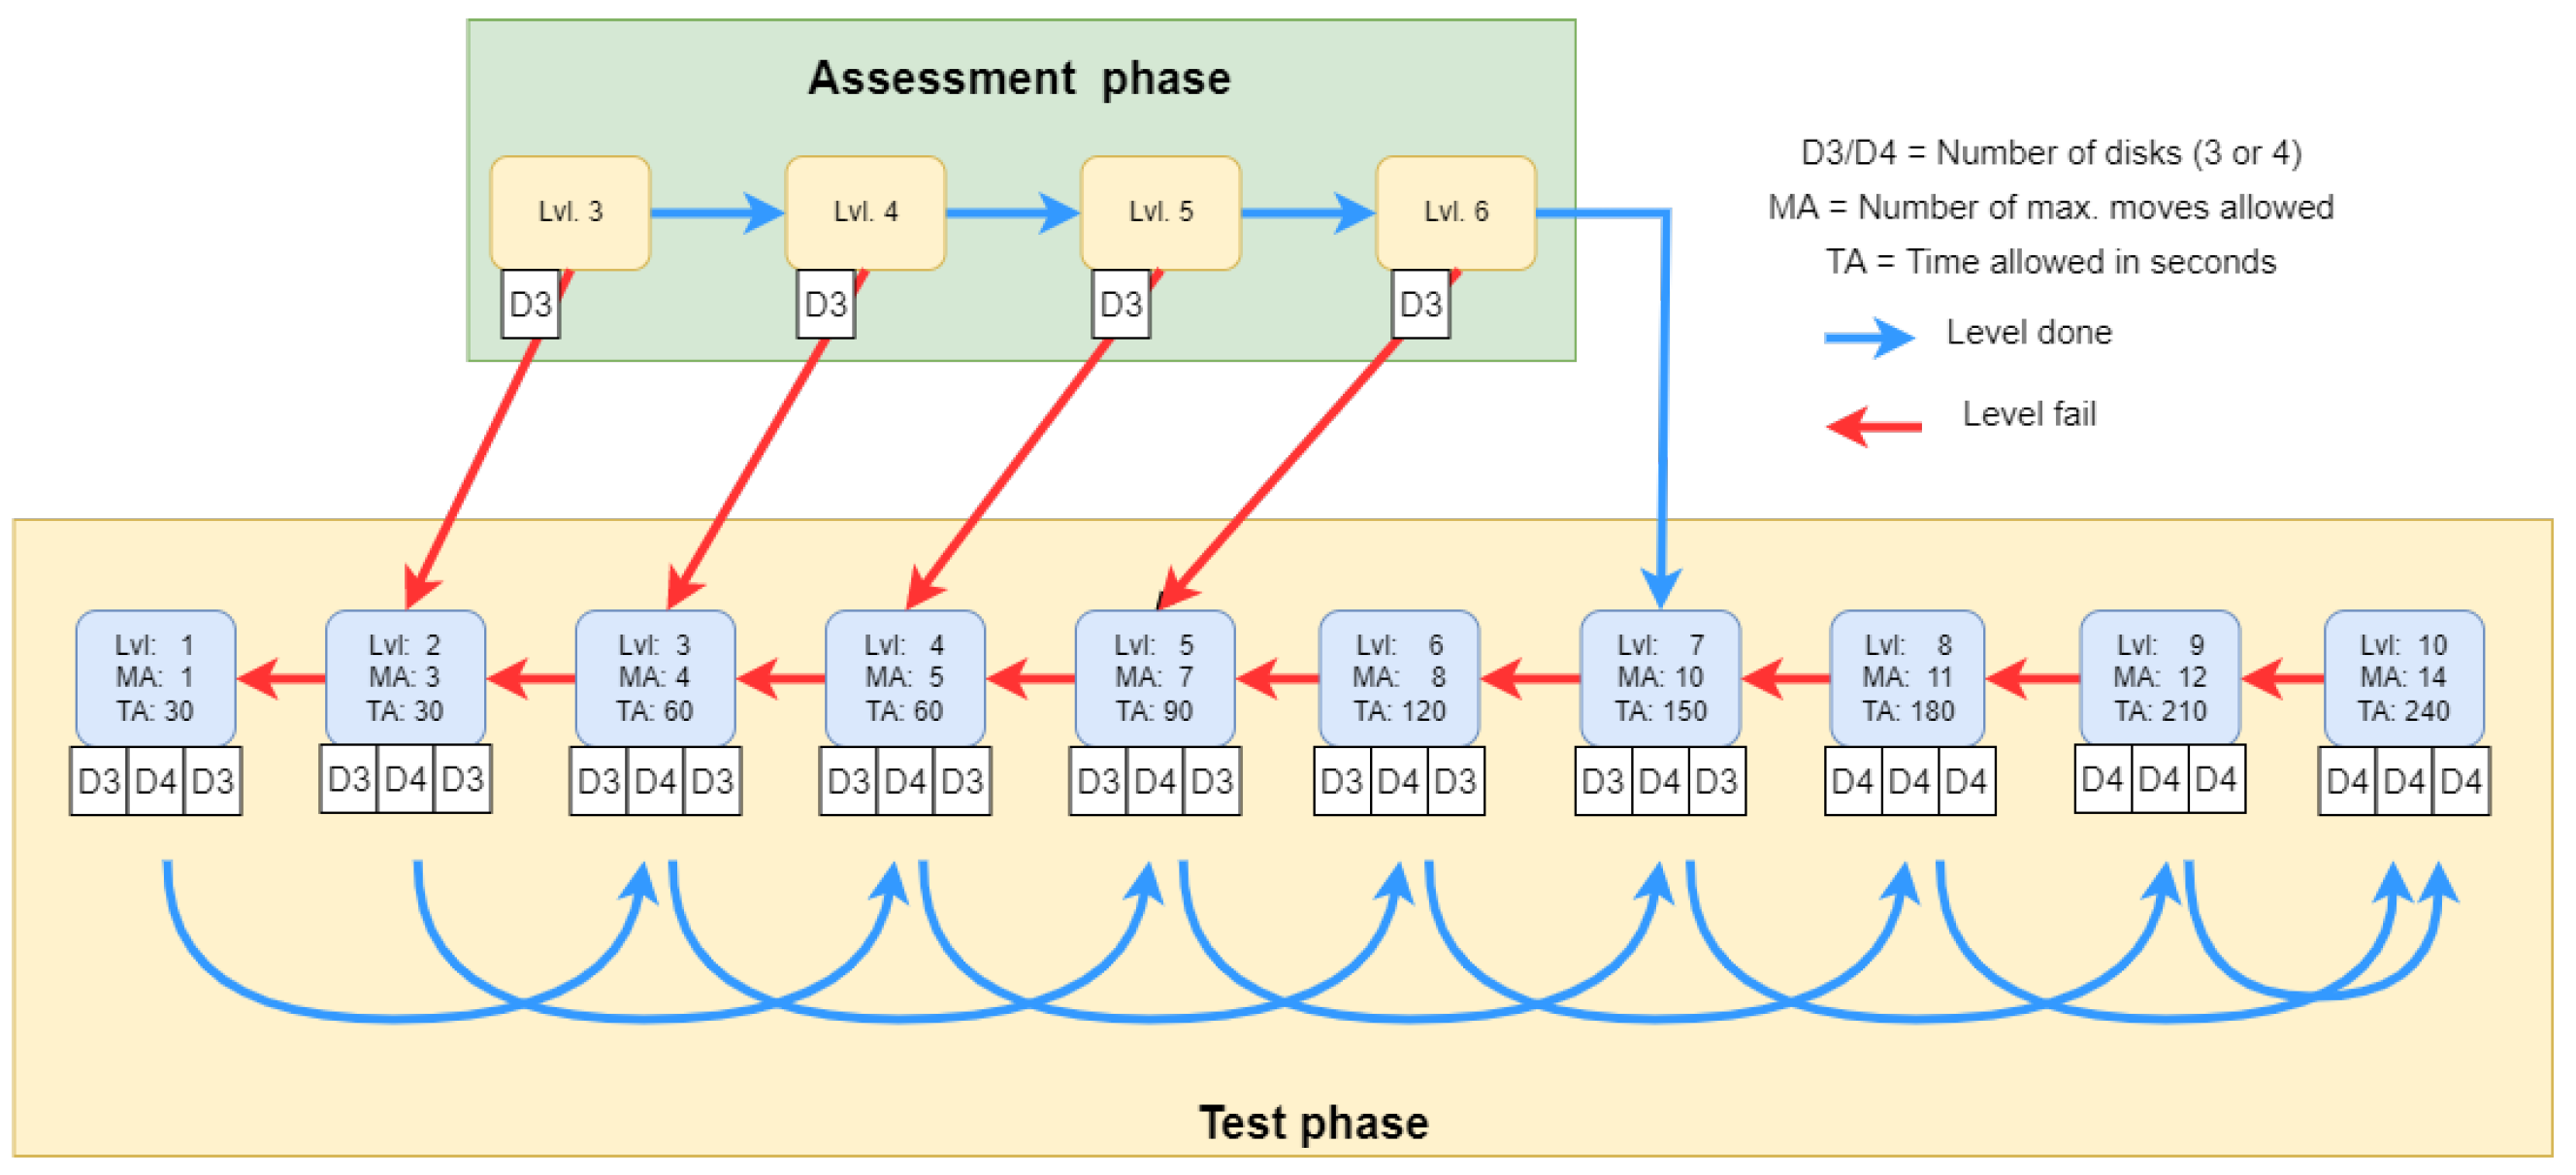
- The Assessment phase has a maximum of four test cases. The four assessment phase tests have different levels of difficulty. Here the predefined stopping condition is a bad answer, the assessment phase ends and the Testing phase begins.
- Finally, according to the participant’s results, the Testing phase is started at a level defined by the results from the Assessment phase. The number of all test cases is , there are 3 test cases per level.
6.4. Test Administration
6.5. Analysis and Results
7. Summary
Author Contributions
Funding
Institutional Review Board Statement
Informed Consent Statement
Data Availability Statement
Conflicts of Interest
References
- Ernst, G.W.; Newell, A. GPS: A Case Study in Generality and Problem Solving; Academic Press: New York, NY, USA, 1969. [Google Scholar]
- Newell, A.; Simon, H.A. Human Problem Solving; Prentice-hall Englewood Cliffs: Hoboken, NJ, USA, 1972; Volume 104. [Google Scholar]
- Tager-Flusberg, H. Chapter: Introduction to Research on Neurodevelopmental Disorders from a Cognitive Neuroscience Perspective. In Neurodevelopmental Disorders; MIT Press: Cambridge, MA, USA, 1999. [Google Scholar]
- Denckla, M.B. Neurodevelopmental disorders from a cognitive neurosciences perspective. Marian. Found. Paediatr. Neurol. Ser. 2005, 13, 1. [Google Scholar]
- Parsey, C.M.; Schmitter-Edgecombe, M. Applications of technology in neuropsychological assessment. Clin. Neuropsychol. 2013, 27, 1328–1361. [Google Scholar] [CrossRef] [PubMed] [Green Version]
- Hakkinen, M. Assistive technologies for computer-based assessments. R&D Connect. 2015, 24, 1–9. [Google Scholar]
- Csapó, B.; Ainley, J.; Bennett, R.E.; Latour, T.; Law, N. Technological issues for computer-based assessment. In Assessment and Teaching of 21st Century Skills; Springer: New York, NY, USA, 2012; pp. 143–230. [Google Scholar]
- Alrababah, S.A.; Molnár, G. The evolution of technology-based assessment: Past, present, and future. Int. J. Learn. Technol. 2021, 16, 134–157. [Google Scholar] [CrossRef]
- Csapó, B.; Molnár, G. Online diagnostic assessment in support of personalized teaching and learning: The eDia system. Front. Psychol. 2019, 10, 1522. [Google Scholar] [CrossRef] [Green Version]
- Rezaie, M.; Golshan, M. Computer adaptive test (CAT): Advantages and limitations. Int. J. Educ. Investig. 2015, 2, 128–137. [Google Scholar]
- Wang, T.; Kolen, M.J. Evaluating comparability in computerized adaptive testing: Issues, criteria and an example. J. Educ. Meas. 2001, 38, 19–49. [Google Scholar] [CrossRef]
- Singleton, C. Using Computer-Based Assessment to Identify Learning Problems. In ICT and Special Educational Needs: A Tool for Inclusion; McGraw-Hill Education: London, UK, 2004; pp. 46–63. [Google Scholar]
- Istiyono, E. Computer adaptive test as the appropriate model to assess physics achievement in 21st century. In Proceedings of the 1st International Conference on Innovation in Education (ICoIE 2018), Padang, Indonesia, 6–7 September 2019; pp. 304–309. [Google Scholar]
- Sands, W.A.; Waters, B.K.; McBride, J.R. Computerized Adaptive Testing: From Inquiry to Operation; American Psychological Association: Washington, DC, USA, 1997. [Google Scholar]
- Sorrel, M.A.; Barrada, J.R.; de la Torre, J.; Abad, F.J. Adapting cognitive diagnosis computerized adaptive testing item selection rules to traditional item response theory. PLoS ONE 2020, 15, e0227196. [Google Scholar] [CrossRef]
- Khoshsima, H.; Toroujeni, S.M.H. Computer Adaptive Testing (CAT) Design; Testing Algorithm and Administration Mode Investigation. Eur. J. Educ. Stud. 2017, 3, 764–795. [Google Scholar]
- Moore, T.M.; Calkins, M.E.; Satterthwaite, T.D.; Roalf, D.R.; Rosen, A.F.; Gur, R.C.; Gur, R.E. Development of a computerized adaptive screening tool for overall psychopathology (“p”). J. Psychiatr. Res. 2019, 116, 26–33. [Google Scholar] [CrossRef]
- Redecker, C.; Johannessen, Ø. Changing assessment—Towards a new assessment paradigm using ICT. Eur. J. Educ. 2013, 48, 79–96. [Google Scholar] [CrossRef]
- Singleton, C.; Thomas, K.; Horne, J. Computer-based cognitive assessment and the development of reading. J. Res. Read. 2000, 23, 158–180. [Google Scholar] [CrossRef]
- Madsen, H.S. Chapter: Computer-Adaptive Testing of Listening and Reading Comprehension. In Computer-Assisted Language Learning and Testing: Research Issues and Practice; Newbury House: New York, NY, USA, 1991. [Google Scholar]
- Weiss, D.J. Computerized adaptive testing for effective and efficient measurement in counseling and education. Meas. Eval. Couns. Dev. 2004, 37, 70–84. [Google Scholar] [CrossRef]
- Kingsbury, G.G. Adaptive Item Calibration: A Process for Estimating Item Parameters within a Computerized Adaptive Test. In Proceedings of the 2009 GMAC Conference on Computerized Adaptive Testing, 2 June 2009. Available online: www.psych.umn.edu/psylabs/CATCentral/ (accessed on 10 July 2022).
- Rizopoulos, D. ltm: An R package for latent variable modeling and item response analysis. J. Stat. Softw. 2007, 17, 1–25. [Google Scholar]
- Thompson, N.A.; Weiss, D.A. A framework for the development of computerized adaptive tests. Pract. Assess. Res. Eval. 2011, 16, 1. [Google Scholar]
- Desforges, M.; Lindsay, G. Procedures Used to Diagnose a Disability and to Assess Special Educational Needs: An International Review; National Council for Special Education: Trim, Ireland, 2010. [Google Scholar]
- Phelps, R.P. Synergies for better learning: An international perspective on evaluation and assessment. Assess. Educ. Princ. Policy Pract. 2014, 21, 481–493. [Google Scholar] [CrossRef]
- Györi, M.; Mohai, K. A diagnosztikus, támogató és edukációs technológiák pszichológiája. In A Humán Fogyatékosságok Pszichológiája—A Gyógypedagógiai Pszichológia Alapjai; ELTE Eötvös Kiadó: Budapest, Hungary, in press.
- Abbott, C.; Brown, D.; Evett, L.; Standen, P.; Wright, J. Learning Difference and Digital Technologies: A Literature Review of Research Involving Children and Young People Using Assistive Technologies 2007–2010; King’s College London: London, UK, 2011. [Google Scholar]
- Whitney, G.; Keith, S.; Bühler, C.; Hewer, S.; Lhotska, L.; Miesenberger, K.; Sandnes, F.E.; Stephanidis, C.; Velasco, C.A. Twenty five years of training and education in ICT Design for All and Assistive Technology. Technol. Disabil. 2011, 23, 163–170. [Google Scholar] [CrossRef] [Green Version]
- Williams, P.; Jamali, H.R.; Nicholas, D. Using ICT with people with special education needs: What the literature tells us. Aslib Proc. New Inf. Perspect. 2006, 58, 330–345. [Google Scholar] [CrossRef]
- Tistarelli, N.; Fagnani, C.; Troianiello, M.; Stazi, M.A.; Adriani, W. The nature and nurture of ADHD and its comorbidities: A narrative review on twin studies. Neurosci. Biobehav. Rev. 2020, 109, 63–77. [Google Scholar] [CrossRef]
- Morris-Rosendahl, D.J.; Crocq, M.A. Neurodevelopmental disorders—The history and future of a diagnostic concept. Dialogues Clin. Neurosci. 2022, 22. [Google Scholar] [CrossRef]
- Zelazo, P.D. Executive function and psychopathology: A neurodevelopmental perspective. Annu. Rev. Clin. Psychol. 2020, 16, 431–454. [Google Scholar] [CrossRef] [PubMed] [Green Version]
- Crisci, G.; Caviola, S.; Cardillo, R.; Mammarella, I.C. Executive functions in neurodevelopmental disorders: Comorbidity overlaps between attention deficit and hyperactivity disorder and specific learning disorders. Front. Hum. Neurosci. 2021, 15, 594234. [Google Scholar] [CrossRef]
- Corbett, B.A.; Constantine, L.J.; Hendren, R.; Rocke, D.; Ozonoff, S. Examining executive functioning in children with autism spectrum disorder, attention deficit hyperactivity disorder and typical development. Psychiatry Res. 2009, 166, 210–222. [Google Scholar] [CrossRef] [Green Version]
- Hughes, C.; Ensor, R. Does executive function matter for preschoolers’ problem behaviors? J. Abnorm. Child Psychol. 2008, 36, 1–14. [Google Scholar] [CrossRef]
- McCloskey, G.; Perkins, L.A.; Van Divner, B. Assessment and Intervention for Executive Function Difficulties; Routledge Taylor & Francis Group: New York, NY, USA, 2008. [Google Scholar]
- Skoff, B. Executive functions in developmental disabilities. Insights Learn. Disabil. 2004, 15, 4–10. [Google Scholar]
- Barkley, R. Executive Functions: What They Are, How They Work, and Why They Evolved; The Guilford Press: New York, NY, USA, 2012. [Google Scholar]
- Miyake, A.; Friedman, N.P.; Emerson, M.J.; Witzki, A.H.; Howerter, A.; Wager, T.D. The unity and diversity of executive functions and their contributions to complex “frontal lobe” tasks: A latent variable analysis. Cogn. Psychol. 2000, 41, 49–100. [Google Scholar] [CrossRef] [PubMed] [Green Version]
- Baggetta, P.; Alexander, P.A. Conceptualization and Operationalization of Executive Function. Mind Brain Educ. 2016, 10, 10–33. [Google Scholar] [CrossRef]
- Shallice, T. Specific impairments of planning. Philos. Trans. R. Soc. London. Biol. Sci. 1982, 298, 199–209. [Google Scholar]
- Mohai, K.; Kalózi-Szabó, C.; Rózsa, S. A végrehajtó funkciók adaptív mérésének lehetoségei. Psychol. Hung. Caroliensis 2016, 4, 40–85. [Google Scholar]
- Rizopoulos, D. Package ‘ltm’. 2022. Available online: https://cran.r-project.org/web/packages/ltm/ltm.pdf (accessed on 10 July 2022).
- DeMars, C. Item Response Theory; Oxford University Press: Oxford, UK, 2010. [Google Scholar]
- Pennington, B.F.; McGrath, L.M.; Peterson, R.L. Diagnosing Learning Disorders: From Science to Practice; Guilford Publications: New York, NY, USA, 2019. [Google Scholar]
- Florian, L. Uses of Technology That Support Pupils with Special Educational Needs. In ICT and Special Educational Needs: A Tool for Inclusion; McGraw-Hill Education: London, UK, 2004; pp. 7–20. [Google Scholar]
- Vygotsky, L. Thinking and Speech. In The Collected Works of LS Vygotsky; Rieber, R.W., Carton, A.S., Eds.; Plenum Press: New York, NY, USA, 1987. [Google Scholar]
- Lebeer, J. Shifting perspective: Dynamic assessment of learning processes in children with developmental disturbances. Transylv. J. Psychol. Spec. Issue 2005, 1, 57–85. [Google Scholar]
- Grigorenko, E.L. Dynamic assessment and response to intervention: Two sides of one coin. J. Learn. Disabil. 2009, 42, 111–132. [Google Scholar] [CrossRef] [PubMed]


| Level (number of minimally necessary moves) | 1 | 2 | 3 | 4 | 5 | 6 | 7 | 8 | 9 | 10 |
| Moves allowed | 1 | 3 | 4 | 5 | 7 | 8 | 10 | 11 | 12 | 14 |
| Difficulty | Discrimination | |||||
|---|---|---|---|---|---|---|
| Value | std.err | z.vals | Value | std.err | z.vals | |
| Item_1_2 | −4.8904 | 1.9344 | −2.5281 | 0.9907 | 0.4987 | 1.9866 |
| Item_3_1 | −4.9173 | 2.006 | −2.4513 | 1.1036 | 0.6024 | 1.8318 |
| Item_3_2 | −4.3959 | 1.4469 | −3.0382 | 1.0487 | 0.4528 | 2.316 |
| Item_3_3 | −2.957 | 0.8585 | −3.4443 | 0.6356 | 0.1981 | 3.2088 |
| Item_4_1 | −2.5104 | 0.5025 | −4.9956 | 1.0311 | 0.2511 | 4.1064 |
| Item_4_2 | −2.0959 | 0.3384 | −6.1936 | 1.3667 | 0.294 | 4.649 |
| Item_4_3 | −2.1625 | 0.3542 | −6.1046 | 1.3482 | 0.2946 | 4.5768 |
| Item_5_1 | −1.4868 | 0.2948 | −5.0429 | 1.0414 | 0.2134 | 4.8809 |
| Item_5_2 | −1.1268 | 0.347 | −3.2473 | 0.6743 | 0.1731 | 3.8946 |
| Item_5_3 | −0.7598 | 0.2605 | −2.9172 | 0.7722 | 0.1812 | 4.2625 |
| Item_6_1 | −0.6452 | 0.1684 | −3.8325 | 1.3412 | 0.2423 | 5.5359 |
| Item_6_2 | −0.8772 | 0.1888 | −4.6455 | 1.3214 | 0.2396 | 5.5148 |
| Item_6_3 | −0.504 | 0.1139 | −4.4251 | 2.7899 | 0.491 | 5.6826 |
| Item_7_1 | 0.1914 | 0.2075 | 0.9228 | 0.7322 | 1855 | 3.9468 |
| Item_7_2 | −0.7521 | 0.1988 | −3.7842 | 1.0973 | 0.2121 | 5.1743 |
| Item_7_3 | −0.1788 | 0.1442 | −1.2404 | 1.2702 | 0.237 | 5.3586 |
| Item_8_1 | 0.2875 | 0.126 | 2.2826 | 1.4433 | 0.2802 | 5.1509 |
| Item_8_2 | 0.2639 | 0.0895 | 2.9476 | 2.9337 | 0.5436 | 5.397 |
| Item_8_3 | 0.1208 | 0.0788 | 1.5325 | 5.3265 | 1.434 | 3.7145 |
| Item_9_1 | 0.5437 | 0.1192 | 4.5604 | 1.7809 | 0.3563 | 4.9981 |
| Item_9_2 | 0.9257 | 0.1589 | 5.824 | 1.7362 | 0.3887 | 4.4662 |
| Item_9_3 | 0.7767 | 0.1279 | 6.0739 | 1.9745 | 0.4043 | 4.8842 |
| Item_10_1 | 0.7677 | 0.1262 | 6.0855 | 1.9243 | 0.397 | 4.8475 |
| Item_10_2 | 0.6361 | 0.0872 | 7.2932 | 3.4896 | 0.8635 | 4.0411 |
| Item_10_3 | 0.8017 | 0.12 | 6.6781 | 2.1448 | 0.4535 | 4.7295 |
| Item_1_2 | 8.4019 | 0.3952 |
| Item_3_1 | 14.8232 | 0.0627 |
| Item_3_2 | 7.9789 | 0.4355 |
| Item_3_3 | 13.322 | 0.1012 |
| Item_4_1 | 4.9713 | 0.7606 |
| Item_4_2 | 3.9275 | 0.8636 |
| Item_4_3 | 7.2758 | 0.5072 |
| Item_5_1 | 9.1146 | 0.3327 |
| Item_5_2 | 23.0207 | 0.0033 |
| Item_5_3 | 29.703 | 0.0002 |
| Item_6_1 | 18.1583 | 0.0201 |
| Item_6_2 | 17.2215 | 0.0279 |
| Item_6_3 | 10.4865 | 0.2325 |
| Item_7_1 | 26.7456 | 0.0008 |
| Item_7_2 | 19.8636 | 0.0109 |
| Item_7_3 | 24.3304 | 0.002 |
| Item_8_1 | 16.5941 | 0.0346 |
| Item_8_2 | 3.5923 | 0.8919 |
| Item_8_3 | 7.1894 | 0.5163 |
| Item_9_1 | 9.9894 | 0.2658 |
| Item_9_2 | 17.9461 | 0.0216 |
| Item_9_3 | 8.5134 | 0.385 |
| Item_10_1 | 11.2503 | 0.1879 |
| Item_10_2 | 7.5525 | 0.4784 |
| Item_10_3 | 9.3497 | 0.3137 |
| Model | AIC | BIC | log.Lik | LRT | df | sig. |
|---|---|---|---|---|---|---|
| 2PL | 4766.76 | 4935.06 | −2333.38 | |||
| 3PL | 4816.76 | 5069.21 | −2333.38 | 0 | 25 | 1 |
| Model | AIC | BIC | log.Lik | LRT | df | p Value |
|---|---|---|---|---|---|---|
| Rasch | 4890.91 | 4975.06 | −2420.46 | |||
| 2PL | 4766.76 | 4935.06 | −2333.38 | 174.15 | 25 | <0.001 |
Publisher’s Note: MDPI stays neutral with regard to jurisdictional claims in published maps and institutional affiliations. |
© 2022 by the authors. Licensee MDPI, Basel, Switzerland. This article is an open access article distributed under the terms and conditions of the Creative Commons Attribution (CC BY) license (https://creativecommons.org/licenses/by/4.0/).
Share and Cite
Mohai, K.; Kálózi-Szabó, C.; Jakab, Z.; Fecht, S.D.; Domonkos, M.; Botzheim, J. Development of an Adaptive Computer-Aided Soft Sensor Diagnosis System for Assessment of Executive Functions. Sensors 2022, 22, 5880. https://doi.org/10.3390/s22155880
Mohai K, Kálózi-Szabó C, Jakab Z, Fecht SD, Domonkos M, Botzheim J. Development of an Adaptive Computer-Aided Soft Sensor Diagnosis System for Assessment of Executive Functions. Sensors. 2022; 22(15):5880. https://doi.org/10.3390/s22155880
Chicago/Turabian StyleMohai, Katalin, Csilla Kálózi-Szabó, Zoltán Jakab, Szilárd Dávid Fecht, Márk Domonkos, and János Botzheim. 2022. "Development of an Adaptive Computer-Aided Soft Sensor Diagnosis System for Assessment of Executive Functions" Sensors 22, no. 15: 5880. https://doi.org/10.3390/s22155880
APA StyleMohai, K., Kálózi-Szabó, C., Jakab, Z., Fecht, S. D., Domonkos, M., & Botzheim, J. (2022). Development of an Adaptive Computer-Aided Soft Sensor Diagnosis System for Assessment of Executive Functions. Sensors, 22(15), 5880. https://doi.org/10.3390/s22155880