
Multi-Scale Evaluation of Sleep Quality Based on Motion Signal from Unobtrusive Device

 ,
,  ,
,  , and
, and
Abstract
:1. Introduction
- The implementation of a visualization tool for sleep fragmentation as a function of the activity level;
- The evaluation of the sleep activity level dynamics from the multi-scale perspective;
- The sleep quality indexes extracted from the visualization tool and multi-scale analysis which were compared to clinical metrics, such as Sleep Efficiency (SE) and Apnea-Hypopnea Index (AHI);
- The analysis on motion signal from two different datasets composed of shift-working nurses and people with suspicions of sleep apnea;
- An easy tool useful for non-invasive devices based on the only motion signal suitable for home monitoring.
2. Materials and Methods
2.1. Data Acquisition and Study Population
2.2. Data Conditioning
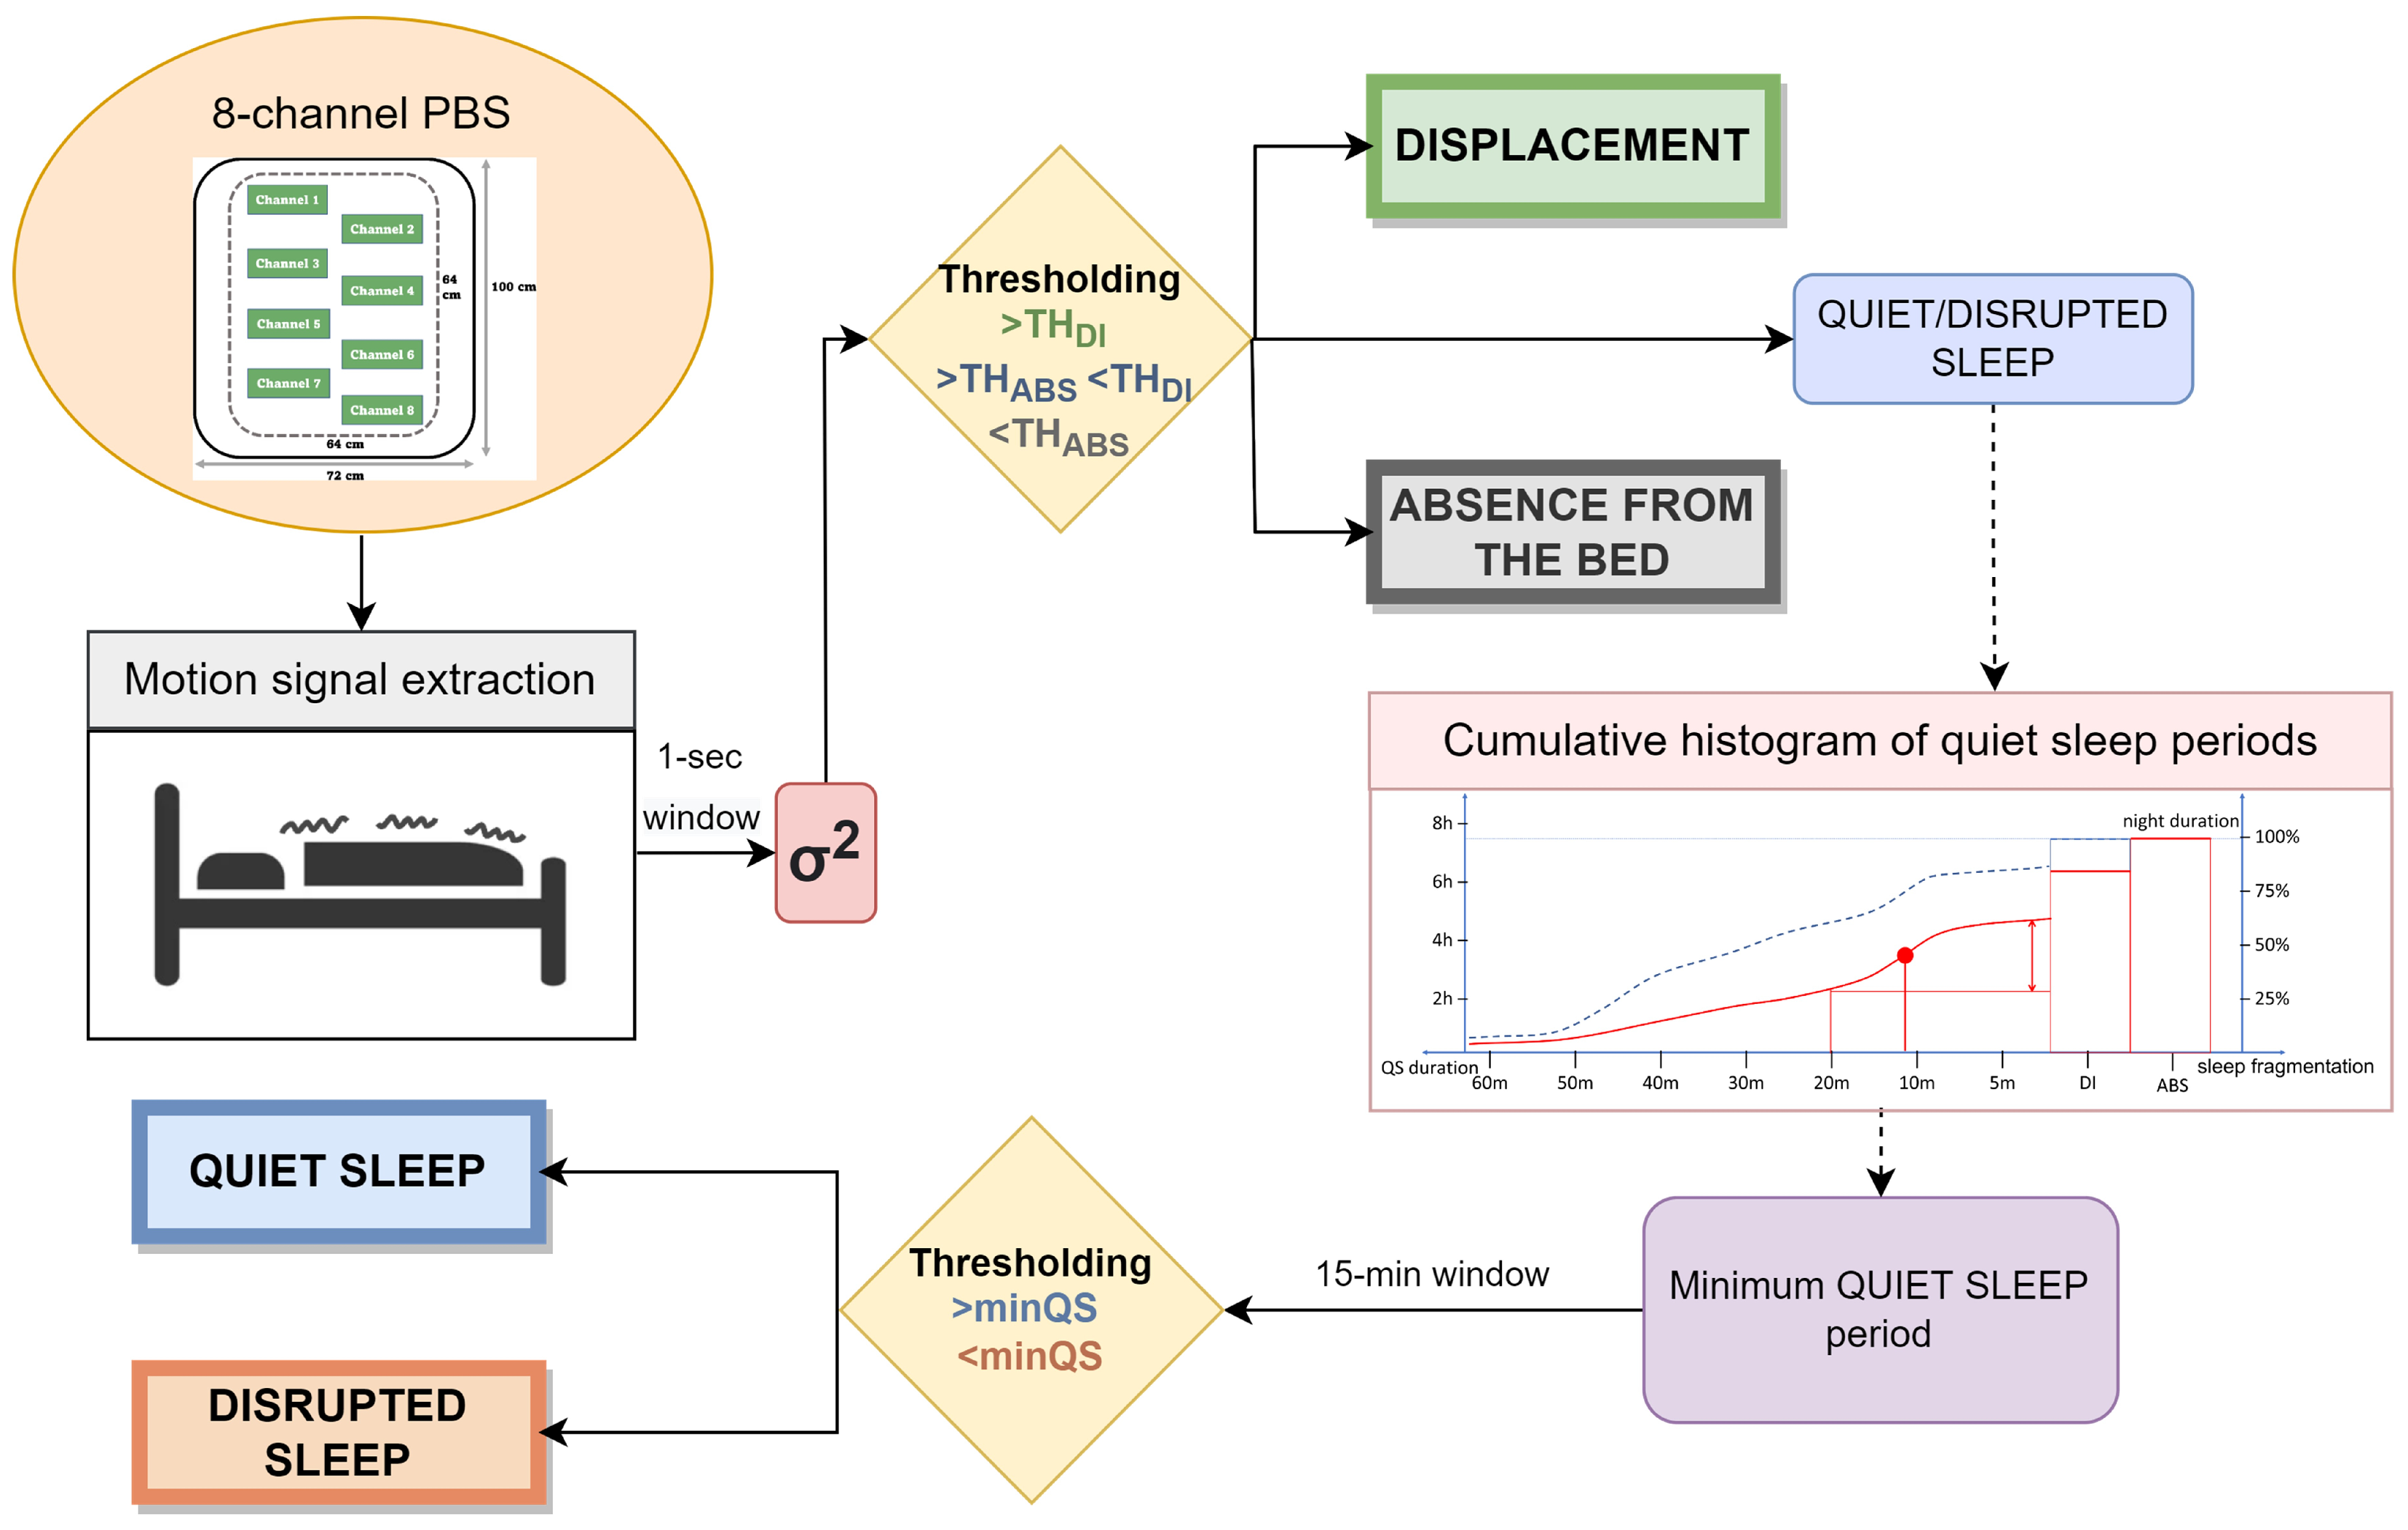
2.3. Pipeline Overview
2.3.1. Motion Detection
- External noise: due to the characteristics of the surrounding environment (e.g., traffic). When only this noise is present () absence from the bed can be assumed (hereafter called ABS);
- Physiological noise: due to the natural physiological activity (e.g., breathing) of the subject. If detected (), presence in the bed with no sleep disturbs or movements can be assumed (hereafter called quiet sleep—QS);
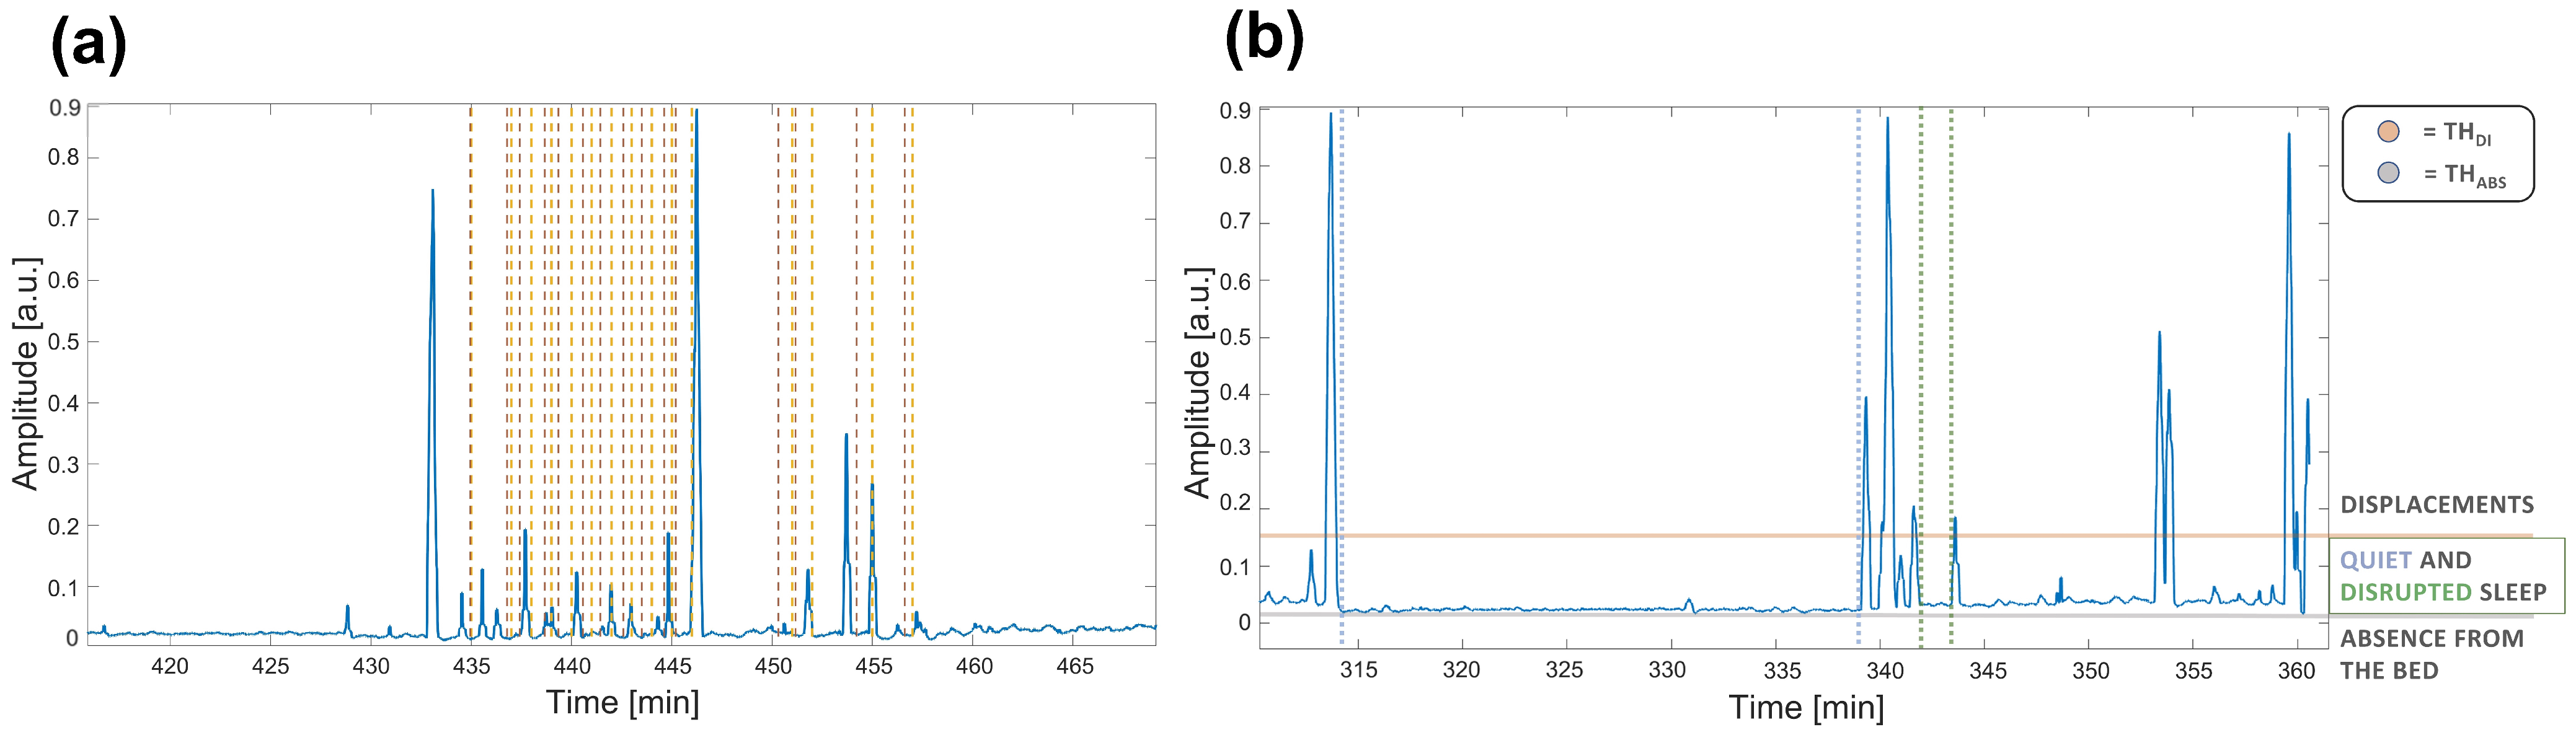
- Displacement: due to physiological movements () during sleep cycle or abnormal ones (hereafter called DI).Body movements cause the strongest components in the signal, sometimes even saturating the sensor signal, being many orders higher than the other possible components generated by the different noise sources. It is well-known that in typical adult sleep behavior transitions from REM to almost-awake moments generate body movements each 1.5 h that last a few seconds in physiological sleep [38,39]. On the other hand, displacements may also be related to other kind of conditions and scenarios. In particular, the presence of disturbed breathing events (i.e., all thoracic movements stronger than normal physiological activity such as apnea) or abnormal movements (such as myclonias) induce strong fluctuations in the motion signal.The major difference between these cases can be identified through the different duration and periodicity of the events. The abnormal ones are, indeed, more frequent and closer to each other, resulting in shorter periods of disrupted sleep (hereafter called DS). An example of signal highlighting apnea events is shown Figure 2 (box 1).
2.3.2. Multi-Scale Analysis for Sleep Fragmentation
2.4. Displacement Analysis and Parameters Optimization
2.5. Detrended Fluctuation Analysis
- H = 0.5, the time series is uncorrelated;
- H > 0.5, there are larger fluctuations on longer time-scales than expected by chance, thus long-range correlations;
- H < 0.5, means that fluctuations are smaller in larger time windows than expected by chance, thus the time series is anti-correlated.
2.6. Experimental Evaluation
- Normal (N):
- Mild sleep apnea (Mi):
- Moderate sleep apnea (Mo):
- Severe sleep apnea (S):
3. Results
4. Discussion
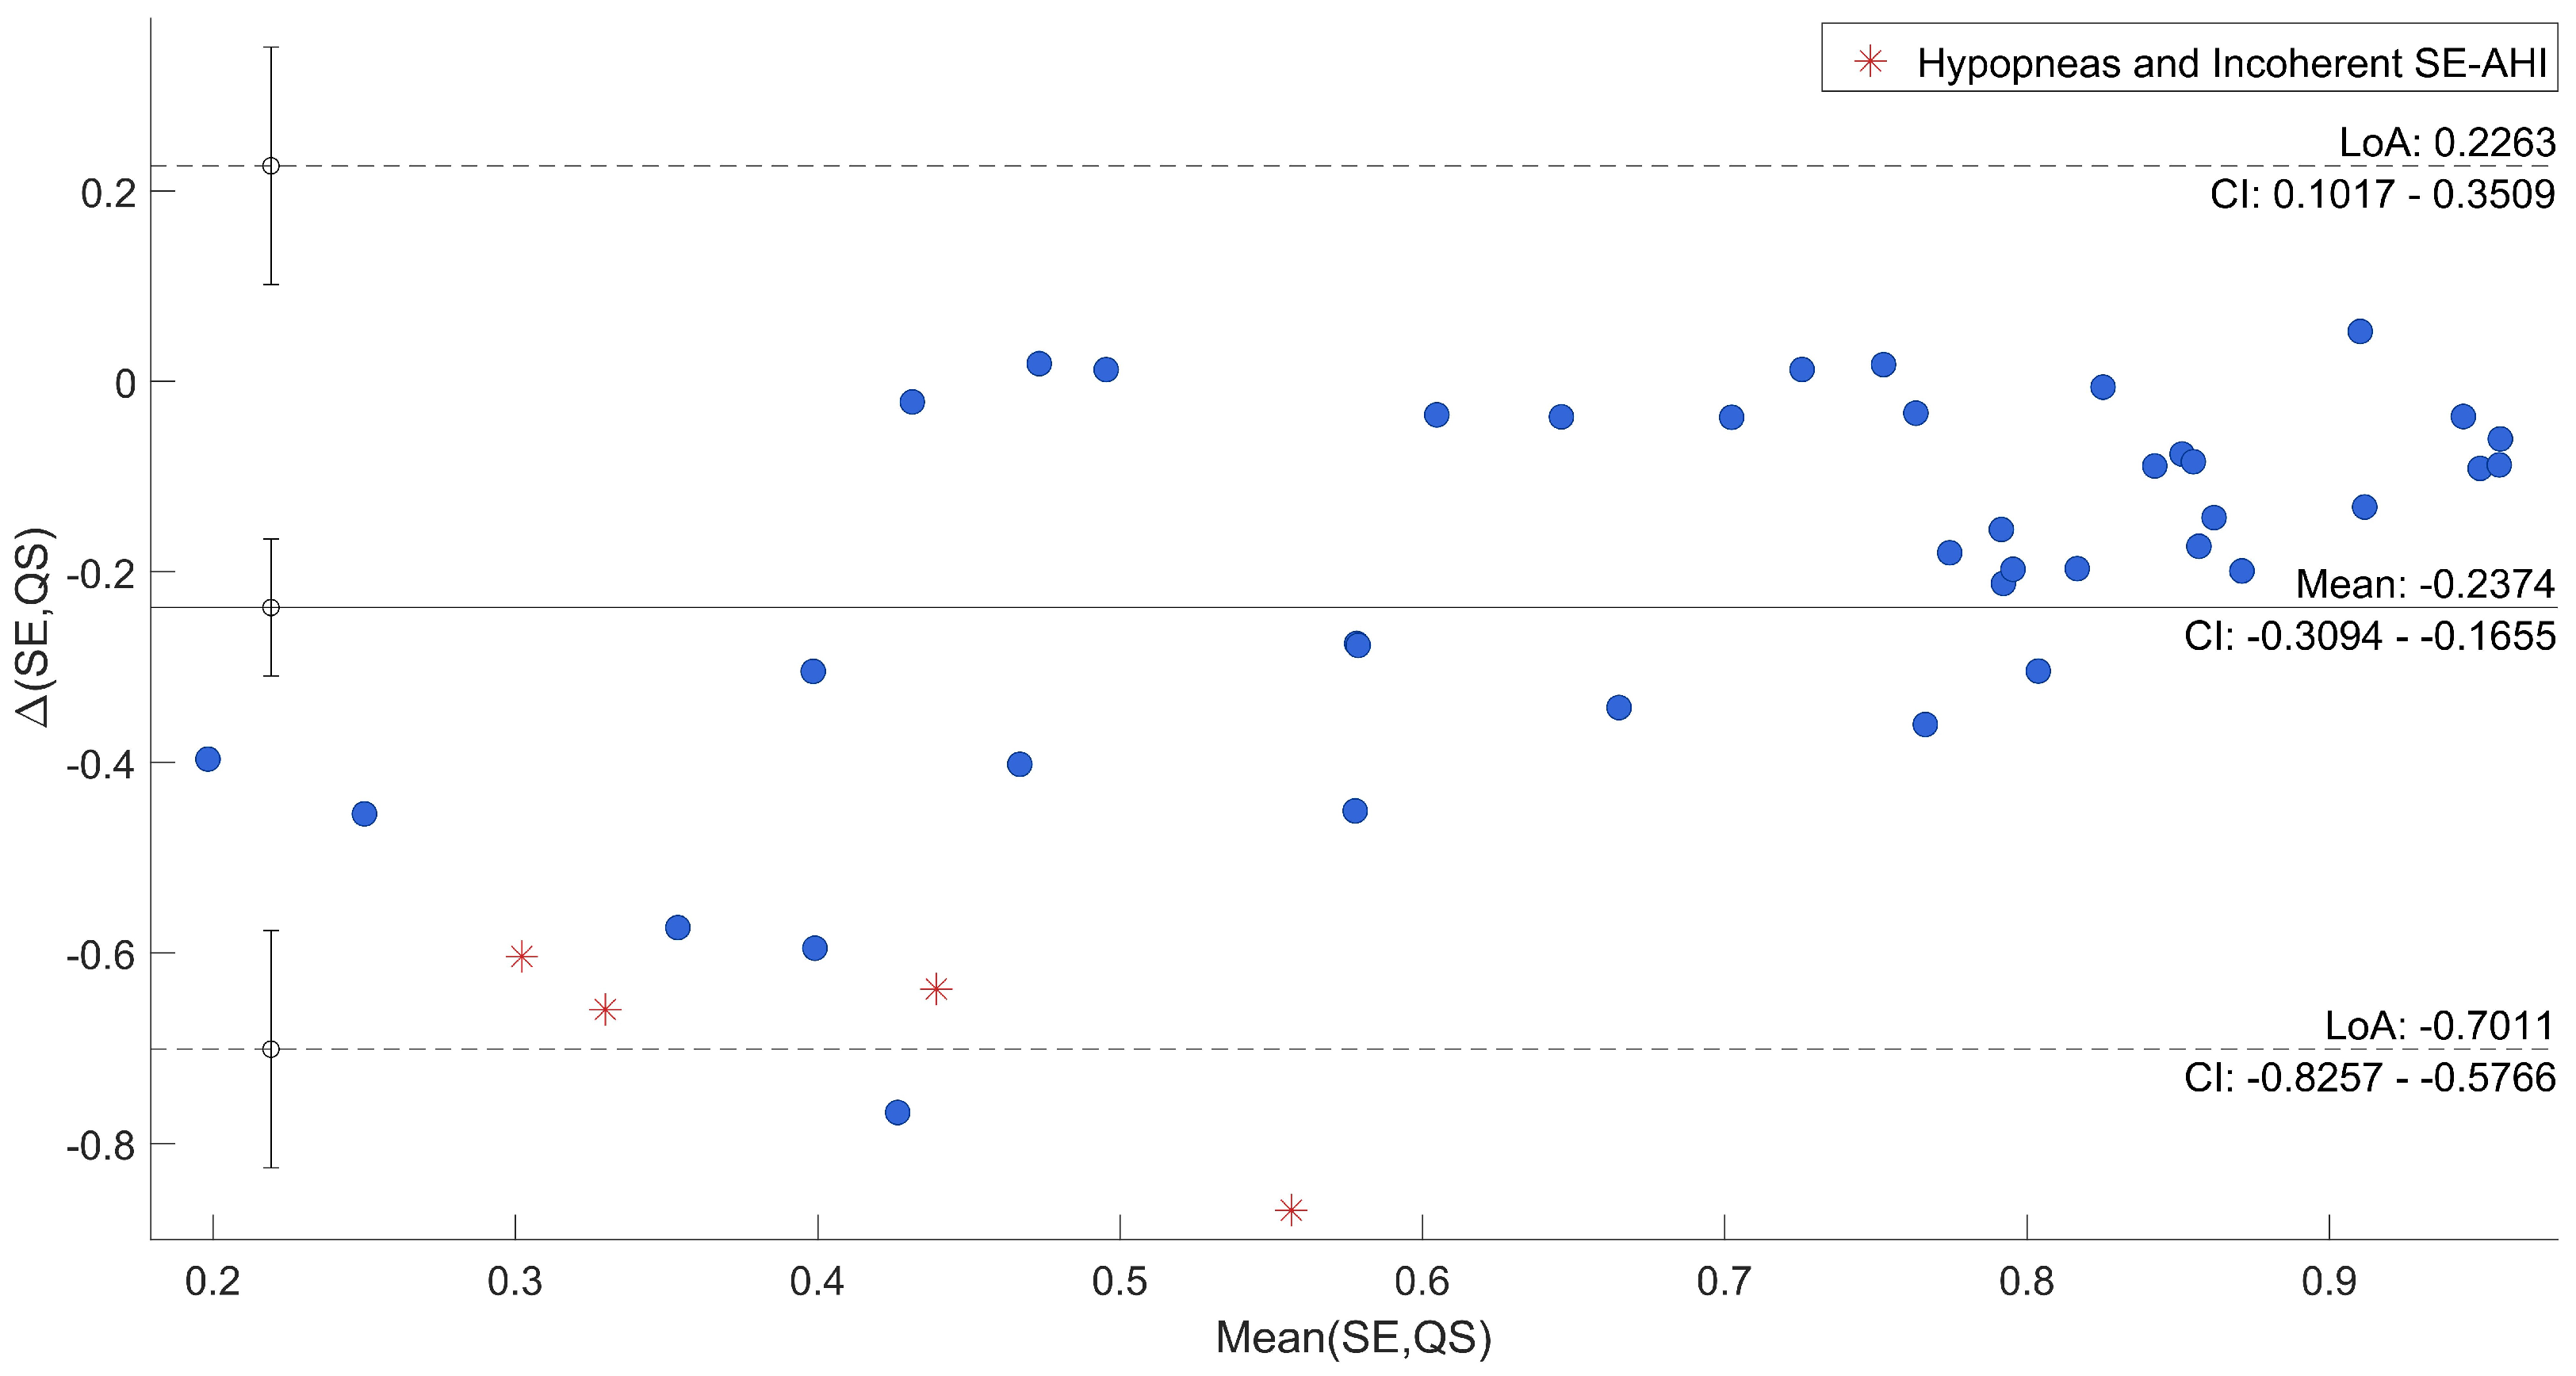
4.1. Sleep Quality Indexes Assessment
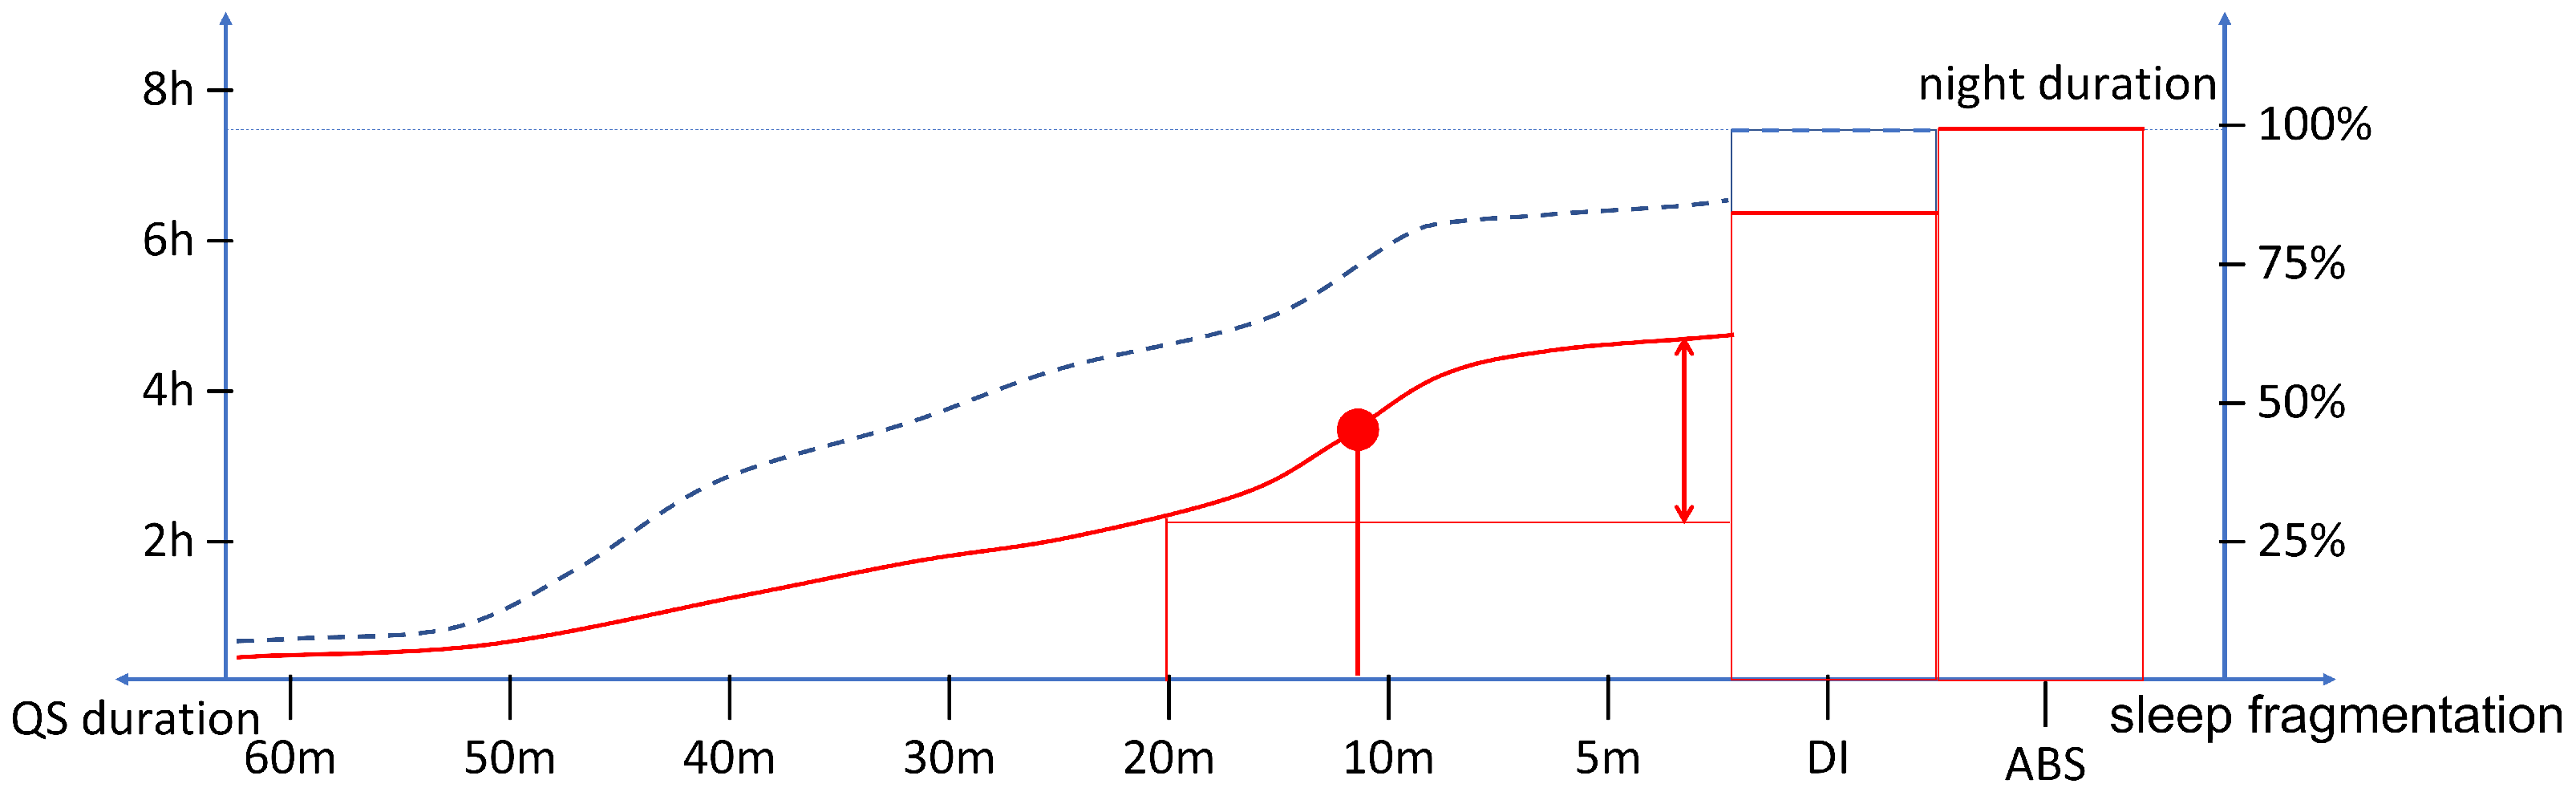
- Total time spent in DI state is greater than in the case of healthy sleep;
- Long periods of QS with an absence of DI constitute a small percentage of the night and fragment a modest percentage of sleep into short periods of QS;
- The point of maximum slope characterizes the dynamics of fragmented sleep.
- The validity of the cumulative histogram of QS periods as a tool for the qualitative investigation of sleep fragmentation during a night of sleep;
- Its worthiness in longitudinal studies, whatever the chosen period is. In fact, although different sleep disorders can have different and specific dynamics, it is possible to highlight quality trends, showing improvements and worsenings among multiple days.
4.2. Multi-Scale Analyses Comparison
4.3. Home Monitoring Perspectives
4.4. Accelerometer Experimentation and Adaptability
5. Conclusions
Author Contributions
Funding
Institutional Review Board Statement
Informed Consent Statement
Acknowledgments
Conflicts of Interest
References
- Medic, G.; Wille, M.; Hemels, M.E. Short- and long-term health consequences of sleep disruption. Nat. Sci. Sleep 2017, 9, 151–161. [Google Scholar] [CrossRef] [PubMed] [Green Version]
- Short, M.A.; Banks, S. The Functional Impact of Sleep Deprivation, Sleep Restriction, and Sleep Fragmentation. In Sleep Deprivation and Disease: Effects on the Body, Brain and Behavior; Bianchi, M.T., Ed.; Springer: New York, NY, USA, 2014; pp. 13–26. [Google Scholar] [CrossRef]
- Institute of Medicine (US) Committee on Sleep Medicine and Research. Sleep Disorders and Sleep Deprivation: An Unmet Public Health Problem; The National Academies Collection: Reports Funded by National Institutes of Health; National Academies Press (US): Washington, DC, USA, 2006. [Google Scholar]
- Bonnet, M.H.; Arand, D.L. Clinical effects of sleep fragmentation versus sleep deprivation. Sleep Med. Rev. 2003, 7, 297–310. [Google Scholar] [CrossRef] [PubMed] [Green Version]
- Young, T.; Peppard, P.E.; Gottlieb, D.J. Epidemiology of Obstructive Sleep Apnea. Am. J. Respir. Crit. Care Med. 2002, 165, 1217–1239. [Google Scholar] [CrossRef] [PubMed] [Green Version]
- Kim, N.H.; Lee, S.K.; Eun, C.R.; Seo, J.A.; Kim, S.G.; Choi, K.M.; Baik, S.H.; Choi, D.S.; Yun, C.H.; Kim, N.H.; et al. Short Sleep Duration Combined with Obstructive Sleep Apnea is Associated with Visceral Obesity in Korean Adults. Sleep 2013, 36, 723–729. [Google Scholar] [CrossRef]
- Mora, G.G.; Kortelainen, J.M.; Hernández, E.R.P.; Tenhunen, M.; Bianchi, A.M.; Méndez, M.O. Evaluation of Pressure Bed Sensor for Automatic SAHS Screening. IEEE Trans. Instrum. Meas. 2015, 64, 1935–1943. [Google Scholar] [CrossRef]
- Sleep-related breathing disorders in adults: Recommendations for syndrome definition and measurement techniques in clinical research. The Report of an American Academy of Sleep Medicine Task Force. Sleep 1999, 22, 667–689. [CrossRef]
- Boudreau, P.; Dumont, G.A.; Boivin, D.B. Circadian Adaptation to Night Shift Work Influences Sleep, Performance, Mood and the Autonomic Modulation of the Heart. PLoS ONE 2013, 8, e70813. [Google Scholar] [CrossRef]
- Mendez, M.O.; Palacios-Hernandez, E.R.; Alba, A.; Kortelainen, J.M.; Tenhunen, M.L.; Bianchi, A.M. Detection of the Sleep Stages Throughout Non-Obtrusive Measures of Inter-Beat Fluctuations and Motion: Night and Day Sleep of Female Shift Workers. Fluct. Noise Lett. 2017, 16, 1750033. [Google Scholar] [CrossRef]
- Kelly, J.M.; Strecker, R.E.; Bianchi, M.T. Recent Developments in Home Sleep-Monitoring Devices. ISRN Neurol. 2012, 2012, 768794. [Google Scholar] [CrossRef] [Green Version]
- Isetta, V.; Torres, M.; González, K.; Ruiz, C.; Dalmases, M.; Embid, C.; Navajas, D.; Farré, R.; Montserrat, J.M. A New mHealth application to support treatment of sleep apnoea patients. J. Telemed. Telecare 2017, 23, 14–18. [Google Scholar] [CrossRef]
- Lara, O.D.; Labrador, M.A. A Survey on Human Activity Recognition using Wearable Sensors. IEEE Commun. Surv. Tutor. 2013, 15, 1192–1209. [Google Scholar] [CrossRef]
- Li, R.T.; Kling, S.R.; Salata, M.J.; Cupp, S.A.; Sheehan, J.; Voos, J.E. Wearable Performance Devices in Sports Medicine. Sports Health 2016, 8, 74–78. [Google Scholar] [CrossRef] [Green Version]
- Patel, S.; Park, H.; Bonato, P.; Chan, L.; Rodgers, M. A review of wearable sensors and systems with application in rehabilitation. J. Neuroeng. Rehabil. 2012, 9, 21. [Google Scholar] [CrossRef] [Green Version]
- Rivolta, M.W.; Aktaruzzaman, M.; Rizzo, G.; Lafortuna, C.L.; Ferrarin, M.; Bovi, G.; Bonardi, D.R.; Caspani, A.; Sassi, R. Evaluation of the Tinetti score and fall risk assessment via accelerometry-based movement analysis. Artif. Intell. Med. 2019, 95, 38–47. [Google Scholar] [CrossRef]
- Coluzzi, D.; Rivolta, M.W.; Mastropietro, A.; Porcelli, S.; Mauri, M.L.; Civiello, M.T.L.; Denna, E.; Rizzo, G.; Sassi, R. Design and Validation of a Minimal Complexity Algorithm for Stair Step Counting. Computers 2020, 9, 31. [Google Scholar] [CrossRef]
- Ibáñez, V.; Silva, J.; Cauli, O. A survey on sleep assessment methods. PeerJ 2018, 6, e4849. [Google Scholar] [CrossRef] [Green Version]
- de Zambotti, M.; Cellini, N.; Goldstone, A.; Colrain, I.M.; Baker, F.C. Wearable Sleep Technology in Clinical and Research Settings. Med. Sci. Sport. Exerc. 2019, 51, 1538–1557. [Google Scholar] [CrossRef]
- Hees, V.T.v.; Sabia, S.; Anderson, K.N.; Denton, S.J.; Oliver, J.; Catt, M.; Abell, J.G.; Kivimäki, M.; Trenell, M.I.; Singh-Manoux, A. A Novel, Open Access Method to Assess Sleep Duration Using a Wrist-Worn Accelerometer. PLoS ONE 2015, 10, e0142533. [Google Scholar] [CrossRef] [Green Version]
- Cerutti, S.; Bianchi, A.M.; Reiter, H. Analysis of sleep and stress profiles from biomedical signal processing in wearable devices. In Proceedings of the 2006 International Conference of the IEEE Engineering in Medicine and Biology Society, New York, NY, USA, 30 August–3 September 2006; pp. 6530–6532. [Google Scholar] [CrossRef]
- Mendez, M.O.; Ruini, D.D.; Villantieri, O.P.; Matteucci, M.; Penzel, T.; Cerutti, S.; Bianchi, A.M. Detection of Sleep Apnea from surface ECG based on features extracted by an Autoregressive Model. In Proceedings of the 2007 29th Annual International Conference of the IEEE Engineering in Medicine and Biology Society, Lyon, France, 22–26 August 2007; pp. 6105–6108. [Google Scholar] [CrossRef]
- Kortelainen, J.M.; Mendez, M.O.; Bianchi, A.M.; Matteucci, M.; Cerutti, S. Sleep Staging Based on Signals Acquired Through Bed Sensor. IEEE Trans. Inf. Technol. B 2010, 14, 776–785. [Google Scholar] [CrossRef]
- Aktaruzzaman, M.; Rivolta, M.W.; Karmacharya, R.; Scarabottolo, N.; Pugnetti, L.; Garegnani, M.; Bovi, G.; Scalera, G.; Ferrarin, M.; Sassi, R. Performance comparison between wrist and chest actigraphy in combination with heart rate variability for sleep classification. Comput. Biol. Med. 2017, 89, 212–221. [Google Scholar] [CrossRef]
- Kesper, K.; Canisius, S.; Penzel, T.; Ploch, T.; Cassel, W. ECG signal analysis for the assessment of sleep-disordered breathing and sleep pattern. Med. Biol. Eng. Comput. 2012, 50, 135–144. [Google Scholar] [CrossRef]
- Smith, M.T.; McCrae, C.S.; Cheung, J.; Martin, J.L.; Harrod, C.G.; Heald, J.L.; Carden, K.A. Use of Actigraphy for the Evaluation of Sleep Disorders and Circadian Rhythm Sleep-Wake Disorders: An American Academy of Sleep Medicine Clinical Practice Guideline. J. Clin. Sleep Med. 2018, 14, 1231–1237. [Google Scholar] [CrossRef] [Green Version]
- Reimer, U.; Emmenegger, S.; Maier, E.; Zhang, Z.; Khatami, R. Recognizing sleep stages with wearable sensors in everyday settings. In Proceedings of the 3rd International Conference on Information and Communication Technologies for Ageing Well and e-Health (ICT4AWE 2017), Porto, Portugal, 1 January 2017; pp. 172–179. [Google Scholar] [CrossRef]
- Kalkbrenner, C.; Stark, P.; Kouemou, G.; Algorri, M.E.; Brucher, R. Sleep monitoring using body sounds and motion tracking. In Proceedings of the 2014 36th Annual International Conference of the IEEE Engineering in Medicine and Biology Society, Chicago, IL, USA, 26–30 August 2014; pp. 6941–6944. [Google Scholar] [CrossRef]
- Kortelainen, J.M.; Gils, M.v.; Pärkkä, J. Multichannel bed pressure sensor for sleep monitoring. In Proceedings of the 2012 Computing in Cardiology, Krakow, Poland, 9–12 September 2012; pp. 313–316. [Google Scholar]
- Sadeh, A.; Sharkey, M.; Carskadon, M.A. Activity-Based Sleep-Wake Identification: An Empirical Test of Methodological Issues. Sleep 1994, 17, 201–207. [Google Scholar] [CrossRef] [Green Version]
- Lamprecht, M.L.; Bradley, A.P.; Tran, T.; Boynton, A.; Terrill, P.I. Multisite accelerometry for sleep and wake classification in children. Physiol. Meas. 2014, 36, 133–147. [Google Scholar] [CrossRef]
- Mendez, M.O.; Corthout, J.; Huffel, S.V.; Matteucci, M.; Penzel, T.; Cerutti, S.; Bianchi, A.M. Automatic screening of obstructive sleep apnea from the ECG based on empirical mode decomposition and wavelet analysis. Physiol. Meas. 2010, 31, 273–289. [Google Scholar] [CrossRef]
- Migliorini, M.; Bianchi, A.M.; Nisticò, D.; Kortelainen, J.; Arce-Santana, E.; Cerutti, S.; Mendez, M.O. Automatic sleep staging based on ballistocardiographic signals recorded through bed sensors. In Proceedings of the 2010 Annual International Conference of the IEEE Engineering in Medicine and Biology, Buenos Aires, Argentina, 31 August–4 September 2010; pp. 3273–3276. [Google Scholar] [CrossRef]
- Camcı, B.; Kahveci, A.Y.; Arnrich, B.; Ersoy, C. Sleep apnea detection via smart phones. In Proceedings of the 2017 25th Signal Processing and Communications Applications Conference (SIU), Antalya, Turkey, 15–18 May 2017; pp. 1–4. [Google Scholar] [CrossRef]
- Sundararajan, K.; Georgievska, S.; te Lindert, B.H.W.; Gehrman, P.R.; Ramautar, J.; Mazzotti, D.R.; Sabia, S.; Weedon, M.N.; van Someren, E.J.W.; Ridder, L.; et al. Sleep classification from wrist-worn accelerometer data using random forests. Sci. Rep. 2021, 11, 24. [Google Scholar] [CrossRef]
- Baty, F.; Boesch, M.; Widmer, S.; Annaheim, S.; Fontana, P.; Camenzind, M.; Rossi, R.M.; Schoch, O.D.; Brutsche, M.H. Classification of Sleep Apnea Severity by Electrocardiogram Monitoring Using a Novel Wearable Device. Sensors 2020, 20, 286. [Google Scholar] [CrossRef] [Green Version]
- Trevenen, M.L.; Turlach, B.A.; Eastwood, P.R.; Straker, L.M.; Murray, K. Using hidden Markov models with raw, triaxial wrist accelerometry data to determine sleep stages. Aust. N. Z. J. Stat. 2019, 61, 273–298. [Google Scholar] [CrossRef]
- El Shakankiry, H.M. Sleep physiology and sleep disorders in childhood. Nat. Sci. Sleep 2011, 3, 101–114. [Google Scholar] [CrossRef] [Green Version]
- Mong, J.A.; Cusmano, D.M. Sex differences in sleep: Impact of biological sex and sex steroids. Philos. Trans. R. Soc. Lond. B Biol. Sci. 2016, 371, 20150110. [Google Scholar] [CrossRef]
- Penzel, T.; McNames, J.; de Chazal, P.; Raymond, B.; Murray, A.; Moody, G. Systematic comparison of different algorithms for apnoea detection based on electrocardiogram recordings. Med. Biol. Eng. Comput. 2002, 40, 402–407. [Google Scholar] [CrossRef] [PubMed]
- Castiglioni, P.; Parati, G.; Civijian, A.; Quintin, L.; Rienzo, M.D. Local Scale Exponents of Blood Pressure and Heart Rate Variability by Detrended Fluctuation Analysis: Effects of Posture, Exercise, and Aging. IEEE Trans. Bio-Med. Eng. 2009, 56, 675–684. [Google Scholar] [CrossRef] [PubMed]
- Márton, L.F.; Brassai, S.T.; Bakó, L.; Losonczi, L. Detrended Fluctuation Analysis of EEG Signals. Proc. Technol. 2014, 12, 125–132. [Google Scholar] [CrossRef] [Green Version]
- Trang, H.; Leske, V.; Gaultier, C. Use of Nasal Cannula for Detecting Sleep Apneas and Hypopneas in Infants and Children. Am. J. Respir. Crit. Care Med. 2002, 166, 464–468. [Google Scholar] [CrossRef]
- Desjardins, S.; Lapierre, S.; Hudon, C.; Desgagné, A. Factors involved in sleep efficiency: A population-based study of community-dwelling elderly persons. Sleep 2019, 42, zsz038. [Google Scholar] [CrossRef] [Green Version]
- Varady, P.; Micsik, T.; Benedek, S.; Benyo, Z. A novel method for the detection of apnea and hypopnea events in respiration signals. IEEE Trans. Biomed. Eng. 2002, 49, 936–942. [Google Scholar] [CrossRef]
- Schlüter, T.; Conrad, S. An approach for automatic sleep stage scoring and apnea-hypopnea detection. Front. Comput. Sci. 2012, 6, 230–241. [Google Scholar] [CrossRef]
- Sadek, I.; Mohktari, M. Nonintrusive Remote Monitoring of Sleep in Home-Based Situation. J. Med. Syst. 2018, 42, 64. [Google Scholar] [CrossRef]
- Murata, K.; Yano, E.; Hashimoto, H.; Karita, K.; Dakeishi, M. Effects of shift work on QTc interval and blood pressure in relation to heart rate variability. Int. Arch. Occup. Environ. Health 2005, 78, 287–292. [Google Scholar] [CrossRef]
- Panossian, L.A.; Avidan, A.Y. Review of Sleep Disorders. Med. Clin. N. Am. 2009, 93, 407–425. [Google Scholar] [CrossRef]
- Hedner, J.; Pillar, G.; Pittman, S.D.; Zou, D.; Grote, L.; White, D.P. A Novel Adaptive Wrist Actigraphy Algorithm for Sleep-Wake Assessment in Sleep Apnea Patients. Sleep 2004, 27, 1560–1566. [Google Scholar] [CrossRef] [Green Version]
- Nandakumar, R.; Gollakota, S.; Watson, N. Contactless Sleep Apnea Detection on Smartphones. In Proceedings of the 13th Annual International Conference on Mobile Systems, Applications, and Services (MobiSys’15), Florence, Italy, 18–22 May 2015; Association for Computing Machinery: New York, NY, USA, 2015; pp. 45–57. [Google Scholar] [CrossRef]
- Zheng, Y.L.; Ding, X.R.; Poon, C.C.Y.; Lo, B.P.L.; Zhang, H.; Zhou, X.L.; Yang, G.Z.; Zhao, N.; Zhang, Y.T. Unobtrusive Sensing and Wearable Devices for Health Informatics. IEEE Trans. Bio-Med. Eng. 2014, 61, 1538–1554. [Google Scholar] [CrossRef]
- Chen, Z.; Lin, M.; Chen, F.; Lane, N.D.; Cardone, G.; Wang, R.; Li, T.; Chen, Y.; Choudhury, T.; Campbell, A.T. Unobtrusive sleep monitoring using smartphones. In Proceedings of the 2013 7th International Conference on Pervasive Computing Technologies for Healthcare and Workshops, Venice, Italy, 5–8 May 2013; pp. 145–152. [Google Scholar]
- Hutchison, K.N.; Song, Y.; Wang, L.; Malow, B.A. Analysis of Sleep Parameters in Patients with Obstructive Sleep Apnea Studied in a Hospital vs. a Hotel-Based Sleep Center. J. Clin. Sleep Med. 2008, 4, 119–122. [Google Scholar] [CrossRef] [Green Version]
- Church, G.D. The Role of Polysomnography in Diagnosing and Treating Obstructive Sleep Apnea in Pediatric Patients. Curr. Probl. Pediatr. Adolesc. Health Care 2012, 42, 2–25. [Google Scholar] [CrossRef]
- Ometov, A.; Shubina, V.; Klus, L.; Skibińska, J.; Saafi, S.; Pascacio, P.; Flueratoru, L.; Gaibor, D.Q.; Chukhno, N.; Chukhno, O.; et al. A Survey on Wearable Technology: History, State-of-the-Art and Current Challenges. Comput. Netw. 2021, 193, 108074. [Google Scholar] [CrossRef]
- Hussain, I.; Hossain, M.A.; Jany, R.; Bari, M.A.; Uddin, M.; Kamal, A.R.M.; Ku, Y.; Kim, J.S. Quantitative Evaluation of EEG-Biomarkers for Prediction of Sleep Stages. Sensors 2022, 22, 3079. [Google Scholar] [CrossRef]
- Yang, Q.; Zou, L.; Wei, K.; Liu, G. Obstructive sleep apnea detection from single-lead electrocardiogram signals using one-dimensional squeeze-and-excitation residual group network. Comput. Biol. Med. 2022, 140, 105124. [Google Scholar] [CrossRef]
- Wu, S.; Chen, M.; Wei, K.; Liu, G. Sleep apnea screening based on Photoplethysmography data from wearable bracelets using an information-based similarity approach. Comput. Methods Programs Biomed. 2021, 211, 106442. [Google Scholar] [CrossRef]
- Hussain, I.; Park, S.J. HealthSOS: Real-Time Health Monitoring System for Stroke Prognostics. IEEE Access 2020, 8, 213574–213586. [Google Scholar] [CrossRef]
- Qin, H.; Liu, G. A dual-model deep learning method for sleep apnea detection based on representation learning and temporal dependence. Neurocomputing 2022, 473, 24–36. [Google Scholar] [CrossRef]
- Tang, L.; Liu, G. The novel approach of temporal dependency complexity analysis of heart rate variability in obstructive sleep apnea. Comput. Biol. Med. 2021, 135, 104632. [Google Scholar] [CrossRef]
- Banfi, T.; Valigi, N.; di Galante, M.; d’Ascanio, P.; Ciuti, G.; Faraguna, U. Efficient embedded sleep wake classification for open-source actigraphy. Sci. Rep. 2021, 11, 345. [Google Scholar] [CrossRef]
- Hulsegge, G.; Loef, B.; Kerkhof, L.W.v.; Roenneberg, T.; Beek, A.J.v.d.; Proper, K.I. Shift work, sleep disturbances and social jetlag in healthcare workers. J. Sleep Res. 2019, 28, e12802. [Google Scholar] [CrossRef]
- Stöberl, A.S.; Schwarz, E.I.; Haile, S.R.; Turnbull, C.D.; Rossi, V.A.; Stradling, J.R.; Kohler, M. Night-to-night variability of obstructive sleep apnea. J. Sleep Res. 2017, 26, 782–788. [Google Scholar] [CrossRef] [Green Version]
- Ondo, W.G.; Vuong, K.D.; Jankovic, J. Exploring the Relationship Between Parkinson Disease and Restless Legs Syndrome. Arch. Neurol. 2002, 59, 421–424. [Google Scholar] [CrossRef] [Green Version]
- Natarajan, R. Review of periodic limb movement and restless leg syndrome. J. Postgrad. Med. 2010, 56, 157. [Google Scholar] [CrossRef]
- Postuma, R.B.; Berg, D. Advances in markers of prodromal Parkinson disease. Nat. Rev. Neurol. 2016, 12, 622–634. [Google Scholar] [CrossRef]
- Mendelson, M.; Borowik, A.; Michallet, A.S.; Perrin, C.; Monneret, D.; Faure, P.; Levy, P.; Pépin, J.L.; Wuyam, B.; Flore, P. Sleep quality, sleep duration and physical activity in obese adolescents: Effects of exercise training. Pediatr. Obes. 2016, 11, 26–32. [Google Scholar] [CrossRef]
- Vanderlinden, J.; Boen, F.; van Uffelen, J.G.Z. Effects of physical activity programs on sleep outcomes in older adults: A systematic review. Int. J. Behav. Nutr. Phys. Act. 2020, 17, 11. [Google Scholar] [CrossRef]
- Lastella, M.; Rigney, G.; Browne, M.; Sargent, C. Electronic device use in bed reduces sleep duration and quality in adults. Sleep Biol. Rhythm. 2020, 18, 121–129. [Google Scholar] [CrossRef]
- Natale, V.; Léger, D.; Martoni, M.; Bayon, V.; Erbacci, A. The role of actigraphy in the assessment of primary insomnia: A retrospective study. Sleep Med. 2014, 15, 111–115. [Google Scholar] [CrossRef] [PubMed]


| 1. Apnea Dataset | 2. Shift-Work Dataset | |||||||||
|---|---|---|---|---|---|---|---|---|---|---|
| Rec. | Subj. | ST (h) | SE | TNE | AHI | Rec. | Subj. | ST (h) | SE | Timetable |
| 1 * | S1 | 6.01 | 0.72 | 21 | 3.49 | 23 | S23 | 4.34 | 0.95 | D |
| 2 | S2 | 9.66 | 0.77 | 145 | 15.01 | 24 | S23 | 9.00 | 0.83 | N |
| 3 * | S3 | 8.98 | 0.95 | 368 | 40.99 | 25 | S24 | 3.90 | 0.84 | D |
| 4 | S4 | 8.74 | 0.42 | 2 | 0.23 | 26 | S24 | 9.83 | 0.85 | N |
| 5 | S5 | 7.64 | 0.44 | 1 | 0.13 | 27 | S25 | 4.94 | 0.85 | D |
| 6 | S6 | 8.87 | 0.66 | 454 | 50.63 | 28 | S25 | 8.36 | 0.69 | N |
| 7 | S7 | 7.22 | 0.63 | 13 | 1.80 | 29 | S26 | 4.06 | 0.69 | D |
| 8 | S8 | 8.34 | 0.59 | 6 | 0.72 | 30 | S26 | 8.37 | 0.89 | N |
| 9 | S9 | 9.65 | 0.68 | 5 | 0.52 | 31 | S27 | 4.89 | 0.86 | D |
| 10 | S10 | 6.18 | 0.46 | 196 | 31.74 | 32 | S27 | 9.05 | 0.83 | N |
| 11 | S11 | 6.61 | 0.61 | 345 | 52.21 | 33 | S28 | 5.54 | 0.94 | D |
| 12 | S12 | 6.49 | 0.53 | 180 | 27.75 | 34 | S28 | 8.46 | 0.95 | N |
| 13 * | S13 | 7.69 | 0.58 | 99 | 12.87 | 35 | S29 | 5.25 | 0.93 | D |
| 14 | S14 | 9.05 | 0.68 | 162 | 17.90 | 36 | S29 | 8.68 | 0.75 | N |
| 15 * | S15 | 7.32 | 0.63 | 161 | 22.00 | 37 | S30 | 4.13 | 0.93 | D |
| 16 | S16 | 11.17 | 0.64 | 109 | 9.76 | 38 | S30 | 8.09 | 0.90 | N |
| 17 | S17 | 6.79 | 0.38 | 319 | 46.97 | 39 | S31 | 4.60 | 0.86 | D |
| 18 | S18 | 8.56 | 0.90 | 39 | 4.56 | 40 | S31 | 9.23 | 0.85 | N |
| 19 | S19 | 8.18 | 0.87 | 27 | 3.30 | 41 | S32 | 4.80 | 0.79 | D |
| 20 | S20 | 7.02 | 0.77 | 161 | 22.92 | 42 | S32 | 7.86 | 0.92 | N |
| 21 | S21 | 8.40 | 0.91 | 1 | 0.12 | 43 | S33 | 5.21 | 0.47 | D |
| 22 | S22 | 5.73 | 0.80 | 34 | 5.93 | 44 | S33 | 9.52 | 0.71 | N |
| 1. Apnea Dataset | 2. Shift-Work Dataset | ||||||||
|---|---|---|---|---|---|---|---|---|---|
| Rec. | Subj. | QS (%) | DS (%) | DI (%) | Rec. | Subj. | QS (%) | DS (%) | DI (%) |
| 1 * | S1 | 12.02 | 51.46 | 36.52 | 23 | S23 | 90.42 | 8.92 | 0.66 |
| 2 | S2 | 35.23 | 49.81 | 14.96 | 24 | S23 | 71.37 | 27.34 | 1.29 |
| 3 * | S3 | 12.14 | 81.02 | 6.84 | 25 | S24 | 93.64 | 5.43 | 0.93 |
| 4 | S4 | 42.05 | 47.10 | 10.85 | 26 | S24 | 79.78 | 19.66 | 0.56 |
| 5 | S5 | 48.26 | 41.38 | 10.36 | 27 | S25 | 81.31 | 17.99 | 0.70 |
| 6 | S6 | 10.15 | 72.20 | 17.65 | 28 | S25 | 68.34 | 30.61 | 1.05 |
| 7 | S7 | 62.73 | 32.11 | 5.16 | 29 | S26 | 73.18 | 25.99 | 0.82 |
| 8 | S8 | 58.72 | 36.49 | 4.79 | 30 | S26 | 79.03 | 20.08 | 0.89 |
| 9 | S9 | 44.06 | 45.47 | 10.47 | 31 | S27 | 81.28 | 18.13 | 0.59 |
| 10 | S10 | 2.30 | 84.54 | 13.16 | 32 | S27 | 68.44 | 30.76 | 0.80 |
| 11 | S11 | 6.69 | 7.23 | 86.08 | 33 | S28 | 92.63 | 6.94 | 0.43 |
| 12 | S12 | 24.62 | 56.64 | 18.74 | 34 | S28 | 91.23 | 8.34 | 0.43 |
| 13 * | S13 | 0.02 | 82.63 | 17.35 | 35 | S29 | 77.15 | 22.40 | 0.45 |
| 14 | S14 | 44.02 | 48.89 | 7.09 | 36 | S29 | 74.65 | 24.63 | 0.72 |
| 15 * | S15 | 0 | 60.32 | 39.68 | 37 | S30 | 84.57 | 14.87 | 0.56 |
| 16 | S16 | 26.58 | 62.37 | 11.05 | 38 | S30 | 77.02 | 22.19 | 0.79 |
| 17 | S17 | 0 | 19.48 | 80.52 | 39 | S31 | 68.61 | 30.76 | 0.63 |
| 18 | S18 | 58.62 | 37.71 | 3.67 | 40 | S31 | 69.66 | 29.31 | 1.03 |
| 19 | S19 | 71.82 | 24.86 | 3.32 | 41 | S32 | 82.21 | 17.14 | 0.65 |
| 20 | S20 | 4.26 | 70.11 | 25.63 | 42 | S32 | 92.58 | 6.87 | 0.55 |
| 21 | S21 | 65.16 | 30.89 | 3.95 | 43 | S33 | 50.16 | 48.39 | 1.45 |
| 22 | S22 | 49.38 | 45.14 | 5.48 | 44 | S33 | 76.13 | 23.27 | 0.60 |
| Displacements | ||||
|---|---|---|---|---|
| 1. Apnea Dataset | ||||
| Dur | N/Mi (n = 10) | Mo/S (n = 8) | p | Wh |
| mean [rank] (s) | 22.93 [1, 63] | 26.85 [1, 110] | <0.05 | 25.54 [1, 110] |
| n. DI | 1494 | 2973 | 4467 | |
| 2. Shift-Work Dataset | ||||
| Dur | D (n = 11) | N (n = 11) | p | Wh |
| mean [rank] (s) | 2.19 [1, 6] | 2.17 [1, 5] | >0.05 | 2.17 [1, 6] |
| n. DI | 607 | 1271 | 1878 | |
| Both | ||||
| Dur | GSE (n = 19) | BSE (n = 21) | p | Wh |
| mean [rank] (s) | 4.65 [1, 21] | 24.12 [1, 111] | <0.05 | 18.62 [1, 111] |
| n. DI | 1791 | 4554 | 6345 | |
| Hurst Exponent | ||||
|---|---|---|---|---|
| 1. Apnea Dataset | ||||
| H | N/Mi (n = 10) | Mo/S (n = 8) | p | Wh |
| mean ± std | >0.05 | |||
| 2. Shift-Work Dataset | ||||
| H | D (n = 11) | N (n = 11) | p | Wh |
| mean ± std | >0.05 | |||
| Both | ||||
| H | GSE (n = 19) | BSE (n = 21) | p | Wh |
| mean ± std | <0.05 | |||
| Correlation Analyses | |||||||||
|---|---|---|---|---|---|---|---|---|---|
| 1. Apnea Dataset | 2. Shift-Work Dataset | Both | |||||||
| N/Mi (n = 10) | Mo/S (n = 8) | Whole | D (n = 11) | N (n = 11) | Whole | GSE (n = 19) | BSE (n = 21) | Whole | |
| QS-SE | 0.53 | 0.48 | 0.50 | 0.82 | 0.66 | 0.76 | 0.40 | 0.39 | 0.72 |
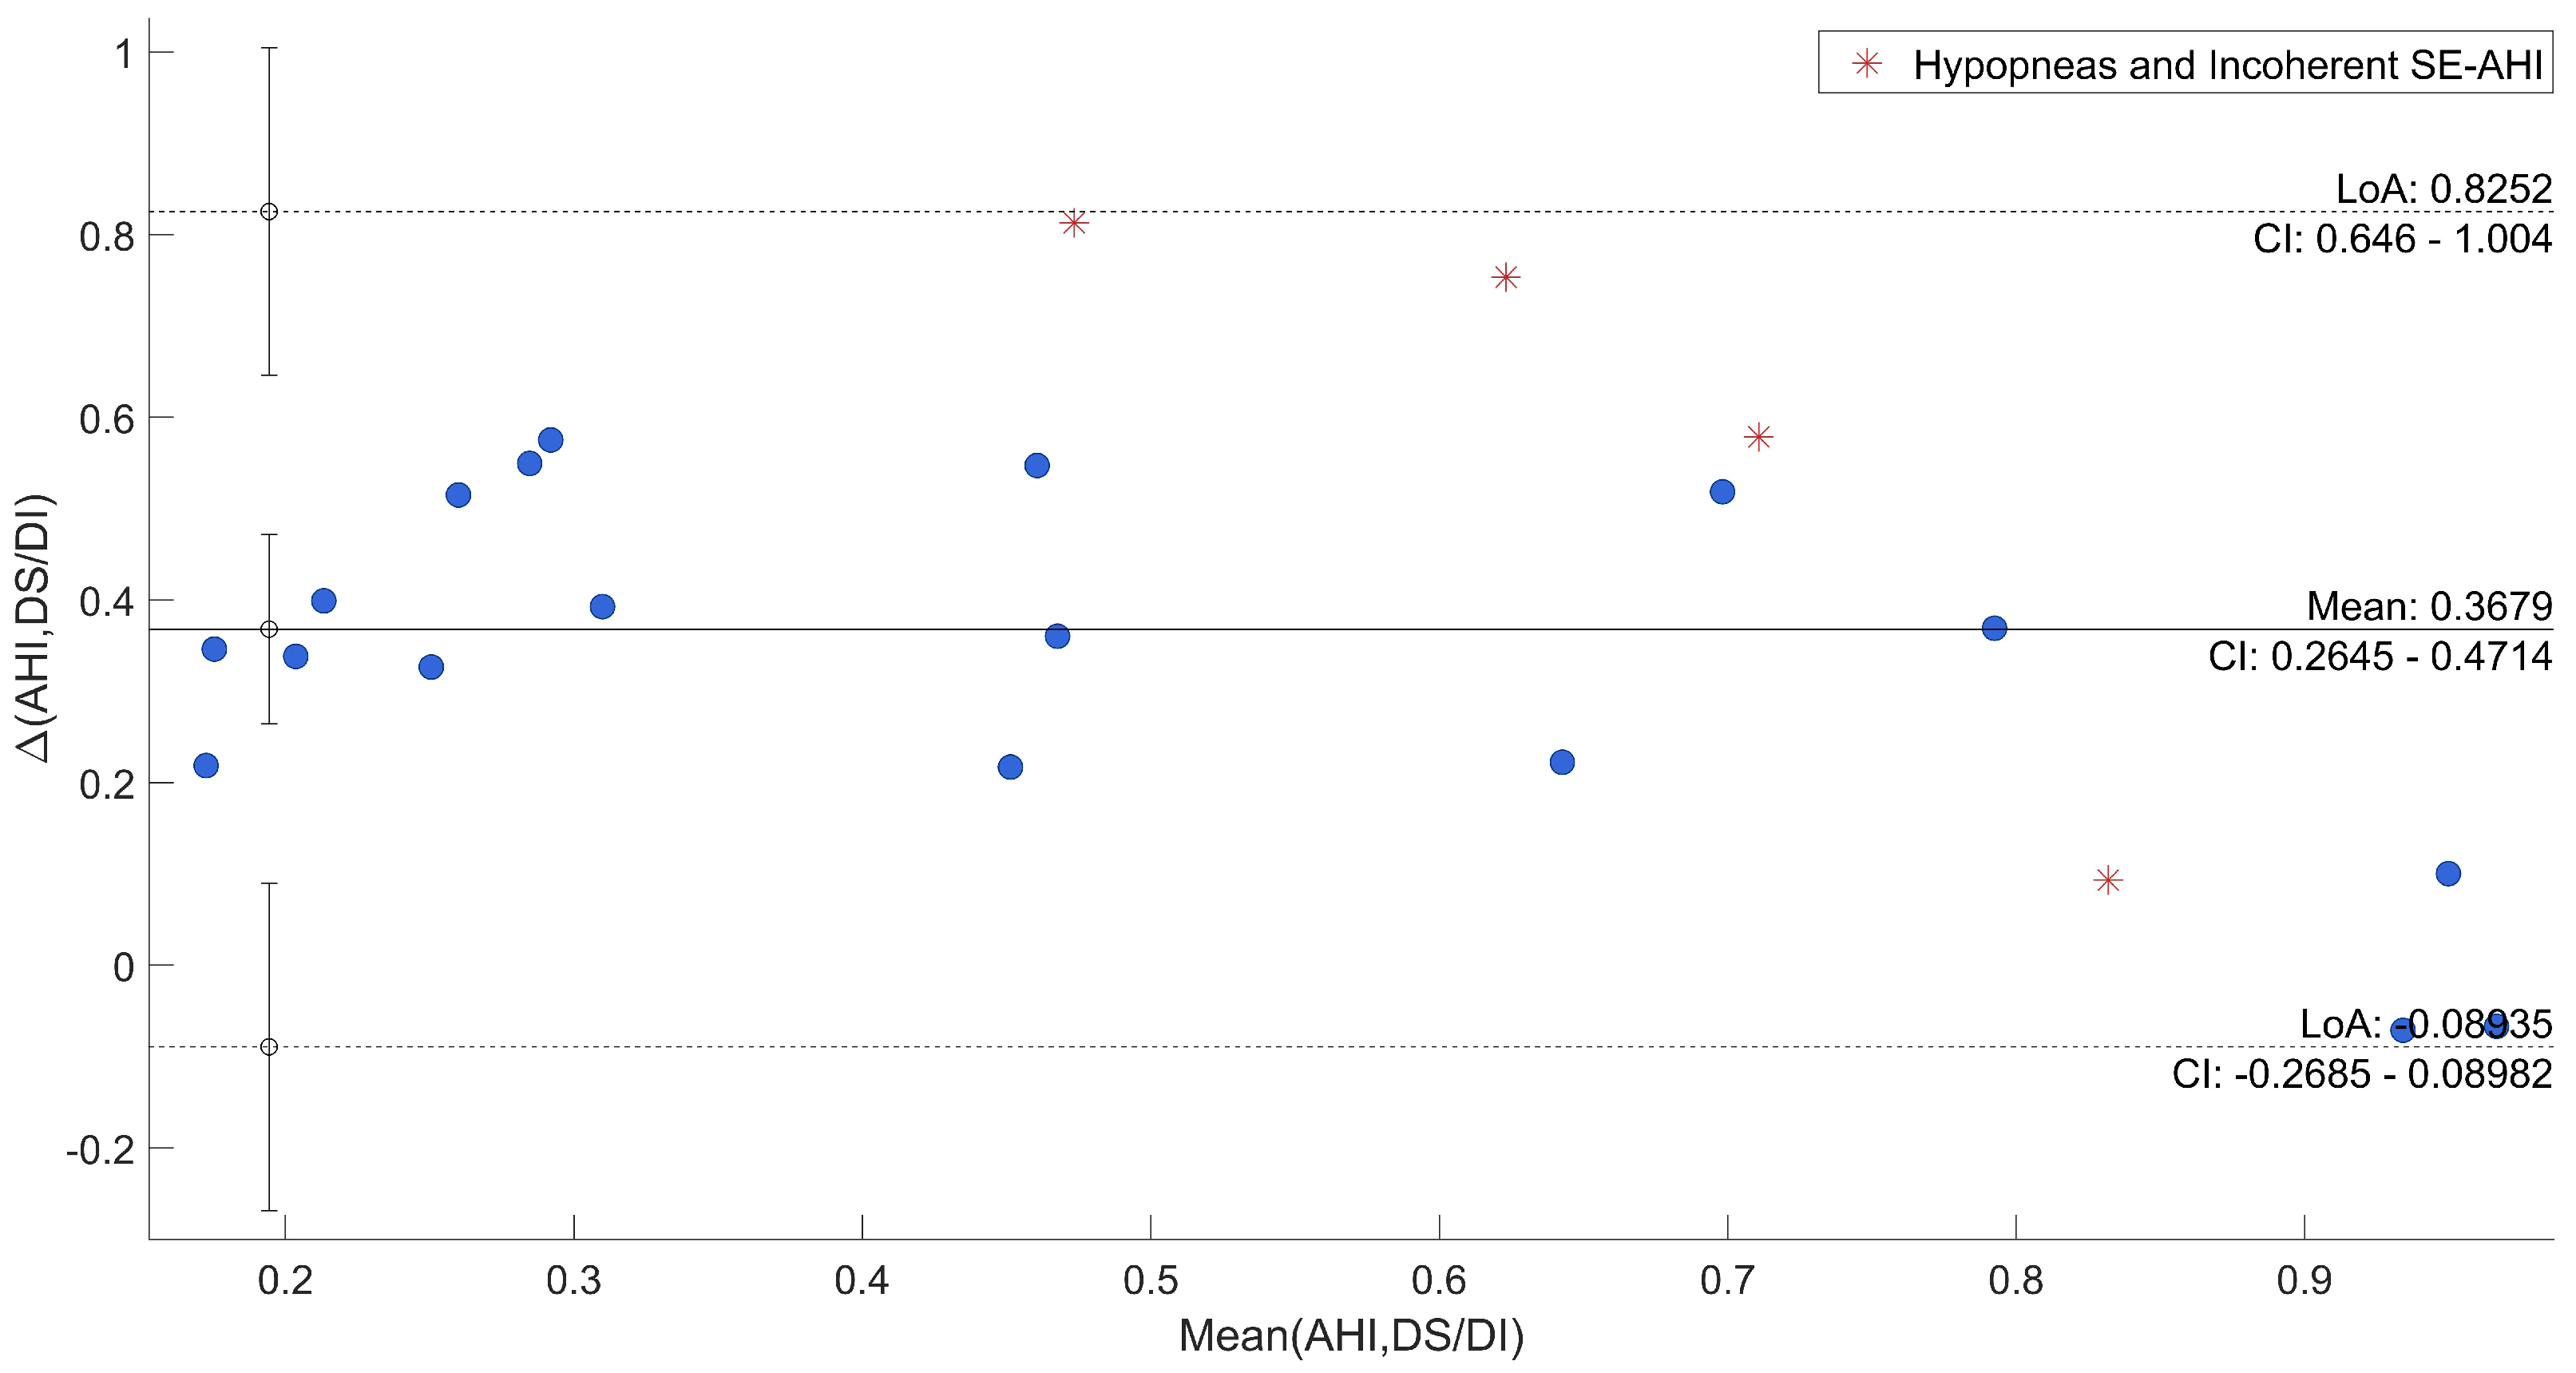
| DS/DI-AHI | 0.44 | 0.68 | 0.85 | na | na | na | na | na | na |
| H-SE | −0.60 | 0.75 | 0.07 | 0.34 | −0.53 | ||||
| H-AHI | 0.30 | na | na | na | na | na | na | ||
| State of the Art | ||||||
|---|---|---|---|---|---|---|
| Reference | Year | Device | Method | Dataset (n. sub) | Detected Indexes | Advantages |
| Proposed work | 2022 | PBS | Multi-Scale Signal Processing based method | 33 (HC vs. SAHS vs. SW) | ABS, QS, DS, DI | No discomfort, interpretability, model complexity |
| Hussain et al. [57] | 2022 | EEG | MLP | 154 | Sleep stages | Performance, low number of channels, no feature extraction |
| Yang et al. [58] | 2022 | ECG | 1D-SEResGNet | 25 (HC vs. SAHS) | OSA | Embeddable in wearable, no feature extraction |
| Wu et al. [59] | 2021 | PPG (wrist) | IBS for fluctuation analysis, RFC | 92 (HC vs. SAHS) | AHI | Mild discomfort, interpretability |
| Banfi et al. [63] | 2021 | ACC (wrist) | CNN | 81 | Sleep vs. Wake | Mild discomfort, no feature extraction |
| Baty et al. [36] | 2020 | ECG belt | SVM | 241 (HC vs. SAHS) | AHI | Mild discomfort, interpretability |
| Hulsegge et al. [64] | 2019 | 2 ACC (thigh, ankle) | LMM and GEE logistic regression | 194 (SW vs. non-SW) | Onset, Offset, TST | Mild discomfort, interpretability, model complexity |
| Mendez et al. [10] | 2017 | PBS | SVM | 6 SW | Sleep Stages | No discomfort, interpretability, model complexity |
| Aktaruzzaman et al. [24] | 2017 | ACC (wrist), HRV | SVM | 18 HC | Sleep vs. Wake | Mild discomfort, interpretability, model complexity |
| Mora et al. [7] | 2015 | PBS | Signal Processing based method | 24 (HC vs. SAHS) | AHI | No discomfort, interpretability, model complexity |
Publisher’s Note: MDPI stays neutral with regard to jurisdictional claims in published maps and institutional affiliations. |
© 2022 by the authors. Licensee MDPI, Basel, Switzerland. This article is an open access article distributed under the terms and conditions of the Creative Commons Attribution (CC BY) license (https://creativecommons.org/licenses/by/4.0/).
Share and Cite
Coluzzi, D.; Baselli, G.; Bianchi, A.M.; Guerrero-Mora, G.; Kortelainen, J.M.; Tenhunen, M.L.; Mendez, M.O. Multi-Scale Evaluation of Sleep Quality Based on Motion Signal from Unobtrusive Device. Sensors 2022, 22, 5295. https://doi.org/10.3390/s22145295
Coluzzi D, Baselli G, Bianchi AM, Guerrero-Mora G, Kortelainen JM, Tenhunen ML, Mendez MO. Multi-Scale Evaluation of Sleep Quality Based on Motion Signal from Unobtrusive Device. Sensors. 2022; 22(14):5295. https://doi.org/10.3390/s22145295
Chicago/Turabian StyleColuzzi, Davide, Giuseppe Baselli, Anna Maria Bianchi, Guillermina Guerrero-Mora, Juha M. Kortelainen, Mirja L. Tenhunen, and Martin O. Mendez. 2022. "Multi-Scale Evaluation of Sleep Quality Based on Motion Signal from Unobtrusive Device" Sensors 22, no. 14: 5295. https://doi.org/10.3390/s22145295
APA StyleColuzzi, D., Baselli, G., Bianchi, A. M., Guerrero-Mora, G., Kortelainen, J. M., Tenhunen, M. L., & Mendez, M. O. (2022). Multi-Scale Evaluation of Sleep Quality Based on Motion Signal from Unobtrusive Device. Sensors, 22(14), 5295. https://doi.org/10.3390/s22145295