Abstract
Oxygen (O2) is a colorless and odorless substance, and is the most important gas in human life and industrial production. In this invited paper, a highly sensitive O2 sensor based on reflector-enhanced photoacoustic spectroscopy (PAS) is reported for the first time. A diode laser emitting at 760 nm was used as the excitation source. The diode laser beam was reflected by the adopted reflector to pass thorough the photoacoustic cell twice and further increase the optical absorption. With such enhanced absorption strategy, compared with the PAS system without the reflector, the reflector-enhanced O2-PAS sensor system had 1.85 times the signal improvement. The minimum detection limit (MDL) of such a reflector-enhanced O2-PAS sensor was experimentally determined to be 0.54%. The concentration response of this sensor was investigated when O2 with a different concentration was used. The obtained results showed it has an excellent linear concentration response. The system stability was analyzed by using Allan variance, which indicated that the MDL for such a reflector-enhanced O2-PAS sensor could be improved to 318 ppm when the integration time of this sensor system is 1560 s. Finally, the O2 concentration on the outside was continuously monitored for 24 h, indicated that this reflector-enhanced O2-PAS sensor system has an excellent measurement ability for actual applications in environmental monitoring, medical diagnostics, and other fields.
1. Introduction
Oxygen (O2) is a colorless and odorless substance, and is the most common gas in human life and industrial production. Because of its combustibility, O2 in high concentration too easily causes explosions after mixing with other dangerous gases. In industrial production, O2 concentration monitoring is not only conducive to the complete combustion of fuel, and reduces exhaust emissions, but is also related to smooth production activities and workers’ safety. In food processing, the existence of O2 makes aerobic microorganisms multiply and grow, causing an oxidation reaction, which will reduce the shelf life and quality of food. In the medical field, the detection of blood O2 concentration in the human body can be used to monitor the physiological status of patients over time. Therefore, the detection of O2 concentration has a very high significance in medical [1], industry, life [2], and other fields.
With these broad requirements in applications, O2 sensors have been developed vigorously in recent years. Electrochemical devices [3,4], optical O2 sensors [5,6], and luminescent dissolved O2 sensors [7] based on fluorescence quenching [8] are typically used in O2 detection. The electrochemical O2 sensor device is widely adopted because of its low price and small size. However, long-term contact with the substance under test can cause corrosion of the device. Optical sensors have the merits of high sensitivity, long life and noninvasive detection [9,10,11,12]. Tunable diode laser absorption spectroscopy (TDLAS) is one of the widely used optical methods for gas detection [13]. However, due to its non-zero background measurement, the detection performance is restricted. Furthermore, the photodetector has wavelength response limitations, so it is not suitable for measurement in all wavebands.
With the appearance of highly sensitive microphones [14] and piezoelectric ceramic microphones, photoacoustic spectroscopy (PAS) has developed rapidly as a popular method to detect gas concentration in recent years [15,16,17,18]. It has the advantages of high sensitivity, high selectivity, zero background, and real-time online monitoring [19]. As shown in Figure 1, the principle of PAS is that when a substance absorbs light and receives excitation, it can return to its initial state by non-radiative transition. Because the absorbed light intensity changes periodically, a pressure wave is generated in the sample. Since the frequency of the modulated light is generally in the acoustic range, these pressure fluctuations transform into acoustic waves and can be detected by acoustic wave detectors. The intensity of the detected photoacoustic signal is proportional to the sensitivity of the microphone, the power of the light source, the gas concentration, and the absorption coefficient [20,21].
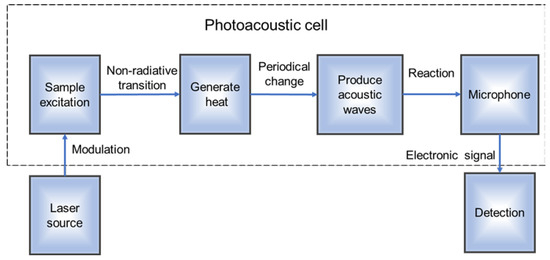
Figure 1.
Schematic diagram of the principle of PAS.
In this invited paper, a reflector-enhanced PAS-based O2 sensor was presented for the first time. A plane mirror coated with gold film was used as the reflector to reflect the diode laser beam and increase the absorption time. Using this strategy, the optical absorption and sensor signal level were improved. A wavelength modulation spectroscopy (WMS) technique combined with second harmonic signal demodulation (2f) was used to simplify the data processing and further improve the sensor performance.
2. Experimental Setup
The experimental setup of the reflector-enhanced O2-PAS system is shown in Figure 2. The laser source is a diode laser with an output wavelength of 760 nm (Eblana Photonics, model: EP760-DM-TP39, Dublin, Ireland). Firstly, the laser beam passes through a lens for collimation. After that, it passes through a resonant photoacoustic cell to generate the photoacoustic signal. The resonant PA cell has a central cylindrical tube as an acoustic resonator and its performance depends on Q factor and cell constant. The PA cell operates in the first longitudinal resonance mode, where the Q factor increases with the radius of the PA cell. However, the cell constant decreases with the increase in the PA cell radius. For length consideration, the element constant increases with the increase in PA element length, but the resonance frequency decreases with the increase in the PA element length. The diameter and length of the cylindrical acoustic resonators are 10 mm and 100 mm, respectively. Two buffers with radius of 25 mm and 50 mm are fixed on both sides of the resonator to reduce noise generated by airflow and interference signals generated by window absorption. Two calcium fluoride (CaF2) windows are attached at both ends of the PA cells. The acoustic signal in the PA cell is ultimately detected by a condenser microphone with a detection sensitivity of 50 mV/Pa. A plane mirror coated with gold film is placed at the exit of the photoacoustic cell to serve as the reflector. The reflected laser passes through the photoacoustic cell again to increase the laser absorption. In the experiment, O2 and pure nitrogen (N2) were mixed to obtain 20–80% O2 concentration, and the flow rate was controlled through the gas mass controller. The generated photoacoustic signal was detected by a microphone. This signal was amplified by a preamplifier, and finally demodulated by a lock-in amplifier to obtain the second harmonic (2f) signal.
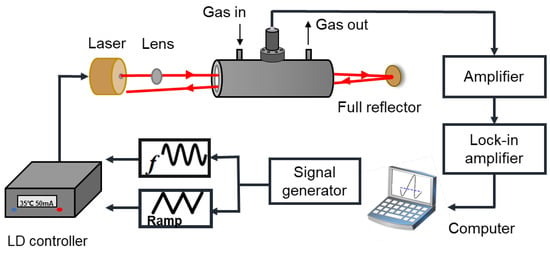
Figure 2.
Diagram of the reflector-enhanced O2-PAS experimental system.
In order to improve the intensity of the photoacoustic signal, it is necessary to optimize the O2 absorption line. Absorption spectrum lines calculated based on the HITRAN2020 database are shown in Figure 3. In the range of 13,000–13,200 cm−1, only O2 absorption lines exist, which means there is no interference from other gases. In addition, lasers in this band are available on the market. Therefore, in the experiment, a strong absorption line located at 13,144.54 cm−1 was selected.
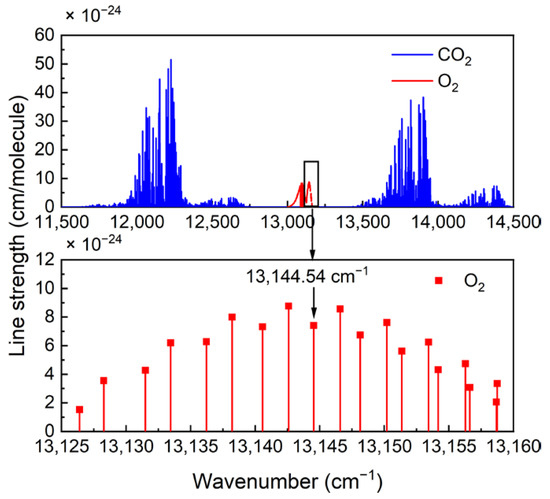
Figure 3.
Absorption lines calculated based on the HITRAN2020 database.
3. Experimental Results and Discussions
Firstly, the resonant frequency characteristic of the photoacoustic cell used was measured. The obtained curve was fitted by Lorentz function and the results are shown in Figure 4. The resonance frequency f0 was found to be 1490.55 Hz, and the width Δf at the half-high value was 80.35 Hz. According to Q = f0/Δf, the quality factor Q was calculated to be 18.55. In this experiment, the demodulation frequency of the lock-in amplifier was set as f0/2 = 745.27 Hz to ensure the maximum 2f signal amplitude. In WMS, the amplitude of the sensor signal is affected by the laser modulation depth. Therefore, in the following experiments, the relationship between the modulation depth and PAS signal level was investigated. When the O2 concentration was 20% and the modulation depth was 0-1.2 mA, the amplitude of the 2f signal was measured, and this is shown in Figure 5. It can be seen that when the modulation depth was 0.83 mA, the PAS signal reached the maximum. When the modulation depth was greater than 0.83 mA, the signal value gradually decreased. Therefore, 0.83 mA was chosen as the optimum modulation depth in subsequent experiments.
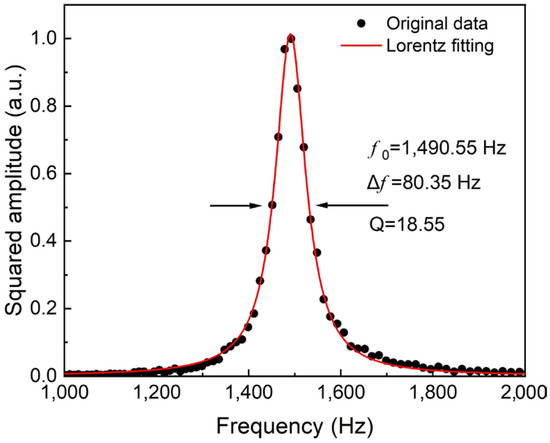
Figure 4.
The resonant characteristic of the photoacoustic cell.
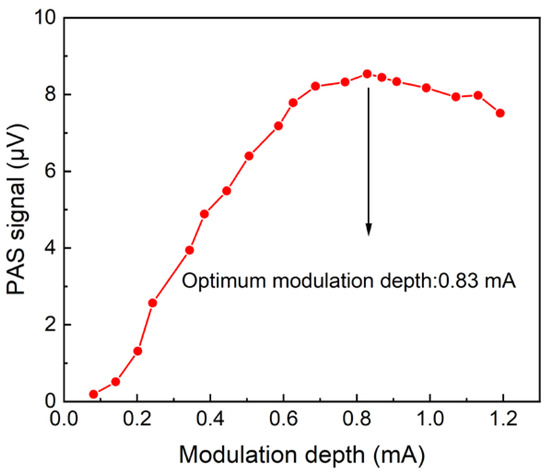
Figure 5.
The relationship between O2-PAS signal amplitude and modulated current under the condition of O2 concentration of 20%.
In the experiment, the signal generator produced a sawtooth wave with an 8 mV amplitude. The bias current of the laser was 67.2 mA, and thus the scanning current could be controlled to 67.2–73.6 mA. The current and temperature of the laser controller at the absorption line were 70 mA and 35 °C, and the laser output power was 14.8 mW under this condition. In this condition, the output wavelength of the laser swept through the absorption line of 13,144.54 cm−1 completely. A sinusoidal wave with frequency f = f0/2 = 745.27 Hz was superimposed on the sawtooth current to perform the wavelength modulation. The PAS signal was detected by the microphone and transmitted to the lock-in amplifier. The lock-in amplifier can filter out the jamming interference of other frequency signals. Its integration time was set to 1 s. To increase the optical absorption, a gold-coated reflector was added in the experiment to make the laser pass through the photoacoustic cell twice. Figure 6 shows the 2f signal measured with the addition of the reflector when the O2 concentration was 80%. It can be seen that the signal amplitude was increased by 1.85 times after the reflector was added.
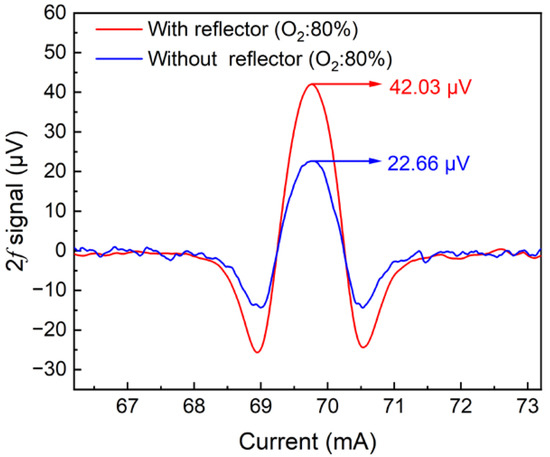
Figure 6.
O2-PAS 2f signal after the addition of reflector under the condition of O2 concentration of 80%.
In order to verify the linear response of the reflector-enhanced O2-PAS system to O2 concentration, the 2f signal at different O2 concentrations was measured and averaged 20 times, and the final results are shown in Figure 7a. In this investigation, two mass flow controllers were used to control the gas flow rate of 80% O2 and pure N2, respectively, to produce an O2 mixture with different concentrations of 20%, 35%, 50%, 65%, and 80%. The linear fitting of the obtained O2-PAS 2f signal amplitude with O2 concentration is shown in Figure 8. The calculated R squared value is R2 = 0.99, indicating that this O2-PAS sensor has a good linear response to the O2 concentration level.
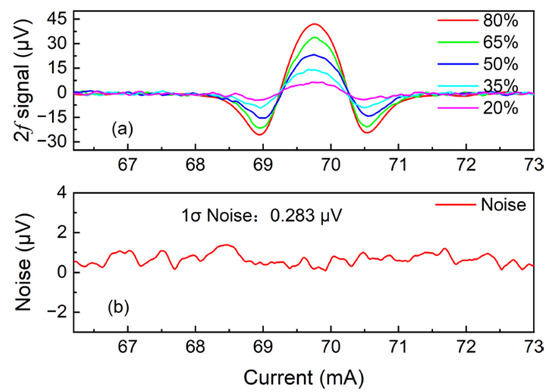
Figure 7.
(a) 2f signal of reflector-enhanced O2-PAS sensor at different O2 concentrations; (b) the noise of the system when pure N2 is adopted.
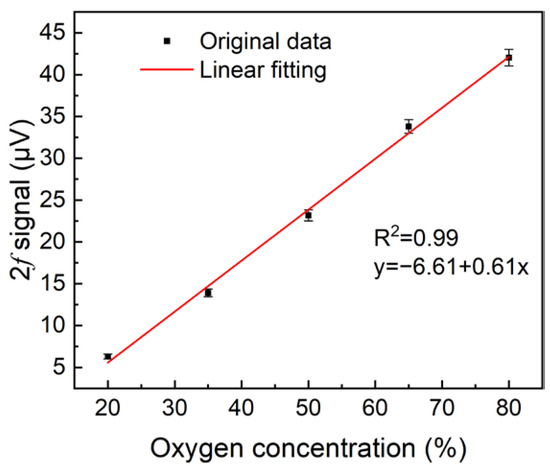
Figure 8.
Linear fitting of 2f signal peak values at different O2 concentrations.
The noise level of this O2-PAS sensor was determined when the photoacoustic cell was filled with pure N2. The measured result is shown in Figure 7(b). The standard deviation of this measurement is 1σ = 0.283 μV. When the selected oxygen concentration is 65% the measured 2f signal is 33.803 μV and the SNR is 119. According to the formula minimum detection limit (MDL) = O2 concentration/SNR, the MDL of this reflector-enhanced O2-PAS sensor system is finally calculated to be 0.54%. Without the reflector, the MDL is 0.99%.
The Allan variance analysis method was used to investigate the system’s stability and detection limit. The collection points were obtained for continuous monitoring of 2.5 h when the photoacoustic cell was filled with pure N2. The processing results are shown in Figure 9. It can be seen that Allan deviation is closely related to 1/√t over a long period of time. This result proves that the noise in the measurement over several hours is mostly white noise. When the integration time is 1560 s, the detection limit can reach 318 ppm.
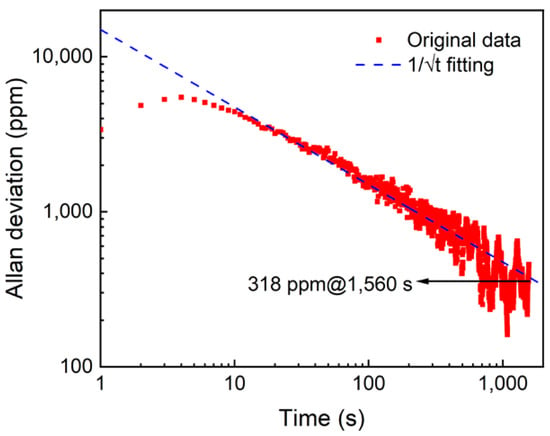
Figure 9.
Allan variance analysis of the reflector-enhanced O2-PAS sensor system.
Finally, the O2 concentration on the outside was continuously monitored for 24 h. A gas pump was used to transport outdoor air to the photoacoustic cell. The obtained results are shown in Figure 10, which proves that this reflector-enhanced O2-PAS sensor system has excellent measurement ability for actual applications.
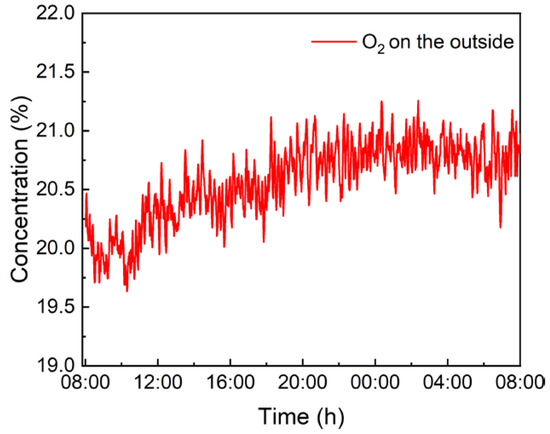
Figure 10.
Real-time monitoring of O2 concentration on the outside for 24 h.
4. Conclusions
In this paper, a highly sensitive O2 sensor based on reflector-enhanced PAS is reported for the first time. Using a 760 nm diode laser as the excitation source, an O2 absorption line located at 13,144.54 cm−1 was selected. The diode laser beam was reflected by the adopted reflector. Therefore, a double-pass beam transmission was realized to increase the optical absorption. With such enhanced absorption, the O2-PAS sensor system had a signal improvement of 1.85 times when compared with the PAS system without the reflector. The reflector-enhanced O2-PAS sensor showed an excellent linear concentration response when O2 with different concentrations was used. The MDL was found to be 0.54%. The system stability was analyzed by using Allan variance, which indicated that the MDL for such a reflector-enhanced O2-PAS sensor could be improved to 318 ppm when the integration time of this sensor system is 1560 s. Finally, the O2 concentration on the outside was continuously monitored for 24 h, proving that this reflector-enhanced O2-PAS sensor system has excellent measurement ability for actual applications.
Author Contributions
Validation, investigation and writing—original draft preparation, S.Y.; methodology, S.Q.; discussion, X.L.; writing—review and editing, supervision, Y.M. All authors have read and agreed to the published version of the manuscript.
Funding
This research was funded by National Natural Science Foundation of China (Grant Nos. 62022032, 61875047, and 61505041), Natural Science Foundation of Heilongjiang Province of China (Grant No. YQ2019F006), Fundamental Research Funds for the Central Universities, Financial Grant from the Heilongjiang Province Postdoctoral Foundation (Grant No. LBH-Q18052).
Institutional Review Board Statement
Not applicable.
Informed Consent Statement
Not applicable.
Data Availability Statement
The data presented in this study are available on request from the corresponding author.
Conflicts of Interest
The authors declare no conflict of interest.
References
- Whitmire, A.L.; Letelier, R.M.; Villagrán, V.; Ulloa, O. Autonomous observations of in vivo fluorescence and particle backscatteringin an oceanic oxygen minimum zone. Opt. Express 2009, 17, 21992–22004. [Google Scholar]
- Pénicaud, C.; Guilbert, S.; Peyron, S.; Gontard, N.; Guillard, V. Oxygen transfer in foods using oxygen luminescence sensors: Influence of oxygen partial pressure and food nature and composition. Food Chem. 2010, 123, 1275–1281. [Google Scholar]
- Han, J.; Zhou, F.; Bao, J.; Wang, X.; Song, X.A. High performance limiting current oxygen sensor with Ce0.8Sm0.2O1.9 electrolyte and La0.8Sr0.2Co0.8Fe0.2O3 diffusion barrier. Electrochim. Acta. 2013, 108, 763–768. [Google Scholar]
- Gao, X.; Liu, T.; Yu, J.; Li, L. Limiting current oxygen sensor based on La0.8Sr0.2Ga0.8 Mg0.2O3-δ as both dense diffusion barrier and solid electrolyte. Ceram. Int. 2017, 43, 6329–6332. [Google Scholar]
- Mi, Y.; Ma, Y.F. Ultra-highly sensitive ammonia detection based on light-induced thermoelastic spectroscopy. Sensors 2021, 21, 4548. [Google Scholar]
- Pohlkötter, A.; Köhring, M.; Willer, U.; Schade, W. Detection of molecular oxygen at low concentrations using quartz enhanced photoacoustic spectroscopy. Sensors 2010, 10, 8466–8477. [Google Scholar]
- Wittmann, C.; Kim, H.M.; John, G.; Heinzle, E. Characterization and application of an optical sensor for quantification of dissolved O2 in shake-flasks. Biotechnol. Lett. 2003, 25, 377–380. [Google Scholar]
- Choi, H.D.; Park, Y.; Cho, K.; Rhee, B.K.; Hong, J.M. Highly sensitive oxygen gas sensor using surface plasmon with a common path homodyne interferometer. Opt. Commun. 2011, 284, 4588–4591. [Google Scholar]
- Ma, Y.F.; Feng, W.; Qiao, S.D.; Zhao, Z.X.; Gao, S.F.; Wang, Y.Y. Hollow-core anti-resonant fiber based light-induced thermoelastic spectroscopy for gas sensing. Opt. Express 2022, 30, 18836–18844. [Google Scholar]
- Lang, Z.T.; Qiao, S.D.; Ma, Y.F. Acoustic microresonator based in-plane quartz-enhanced photoacoustic spectroscopy sensor with a line interaction mode. Opt. Lett. 2022, 47, 1295–1298. [Google Scholar]
- Sampaolo, A.; Menduni, C.; Patimisco, P.; Giglio, M.; Passaro, V.M.N.; Dong, L.; Wua, H.P.; Tittel, F.K.; Spagnolo, V. Quartz-enhanced photoacoustic spectroscopy for hydrocarbon trace gas detection and petroleum exploration. Fuel 2020, 277, 118118. [Google Scholar]
- Ma, Y.F.; He, Y.; Tong, Y.; Yu, X.; Tittel, F.K. Quartz-tuning-fork enhanced photothermal spectroscopy for ultra-high sensitive trace gas detection. Opt. Express 2018, 26, 32103–32110. [Google Scholar]
- Gianfrani, L.; Sasso, A.; Tino, G.M. Monitoring of O2 and NO2 using tunable diode lasers in the near-infrared region. Sens. Actuator B-Chem. 1997, 39, 283–285. [Google Scholar]
- De Paula, M.H.; De Carvalho, A.A.; Vinha, C.A.; Cella, N.; Vargas, H. Opmethodstical microphone for photoacoustic spectroscopy. J. Appl. Phys. 1988, 64, 3722–3724. [Google Scholar]
- Sim, J.Y.; Ahn, C.H.; Huh, C.; Chung, K.H.; Jeong, E.J.; Kim, B.K. Synergetic resonance matching of a microphone and a photoacoustic cell. Sensors 2017, 17, 804. [Google Scholar]
- Lang, Z.T.; Qiao, S.D.; He, Y.; Ma, Y.F. Quartz tuning fork-based demodulation of an acoustic signal induced by photo-thermo-elastic energy conversion. Photoacoustics 2021, 22, 100272. [Google Scholar]
- Ma, Y.F.; Lewicki, R.; Razeghi, M.; Tittel, F.K. QEPAS based ppb-level detection of CO and N2O using a high power CW DFB-QCL. Opt. Express 2013, 21, 1008–1019. [Google Scholar]
- Lenka, H.; Tomáš, H.; Jiří, P.; Dalibor, M.; Zdeněk, Z.; Pavel, K.; Radmila, J.; Václav, N.; Petr, B.; Michal, S.; et al. CO2-laser photoacoustic detection of gaseous n-pentylacetate. J. Mol. Spectrosc. 2009, 256, 109–110. [Google Scholar]
- Wang, Q.; Wang, S.C.; Liu, T.Y.; Chen, Z.Q. Research progress of multi-component gas detection by photoacoustic spectroscopy. Spectrosc. Spectr. Anal. 2022, 42, 1–8. [Google Scholar]
- Hodgkinson, J.; Tatam, R.P. Optical gas sensing: A review. Meas. Sci. Technol. 2012, 24, 012004. [Google Scholar]
- Chen, T.; Su, G.F.; Yuan, H.Y. In situ gas filter correlation: Photoacoustic CO detection method for fire warning. Sens. Actuator B-Chem. 2005, 109, 233–237. [Google Scholar]
Publisher’s Note: MDPI stays neutral with regard to jurisdictional claims in published maps and institutional affiliations. |
© 2022 by the authors. Licensee MDPI, Basel, Switzerland. This article is an open access article distributed under the terms and conditions of the Creative Commons Attribution (CC BY) license (https://creativecommons.org/licenses/by/4.0/).