
Insulator Umbrella Disc Shedding Detection in Foggy Weather


Abstract
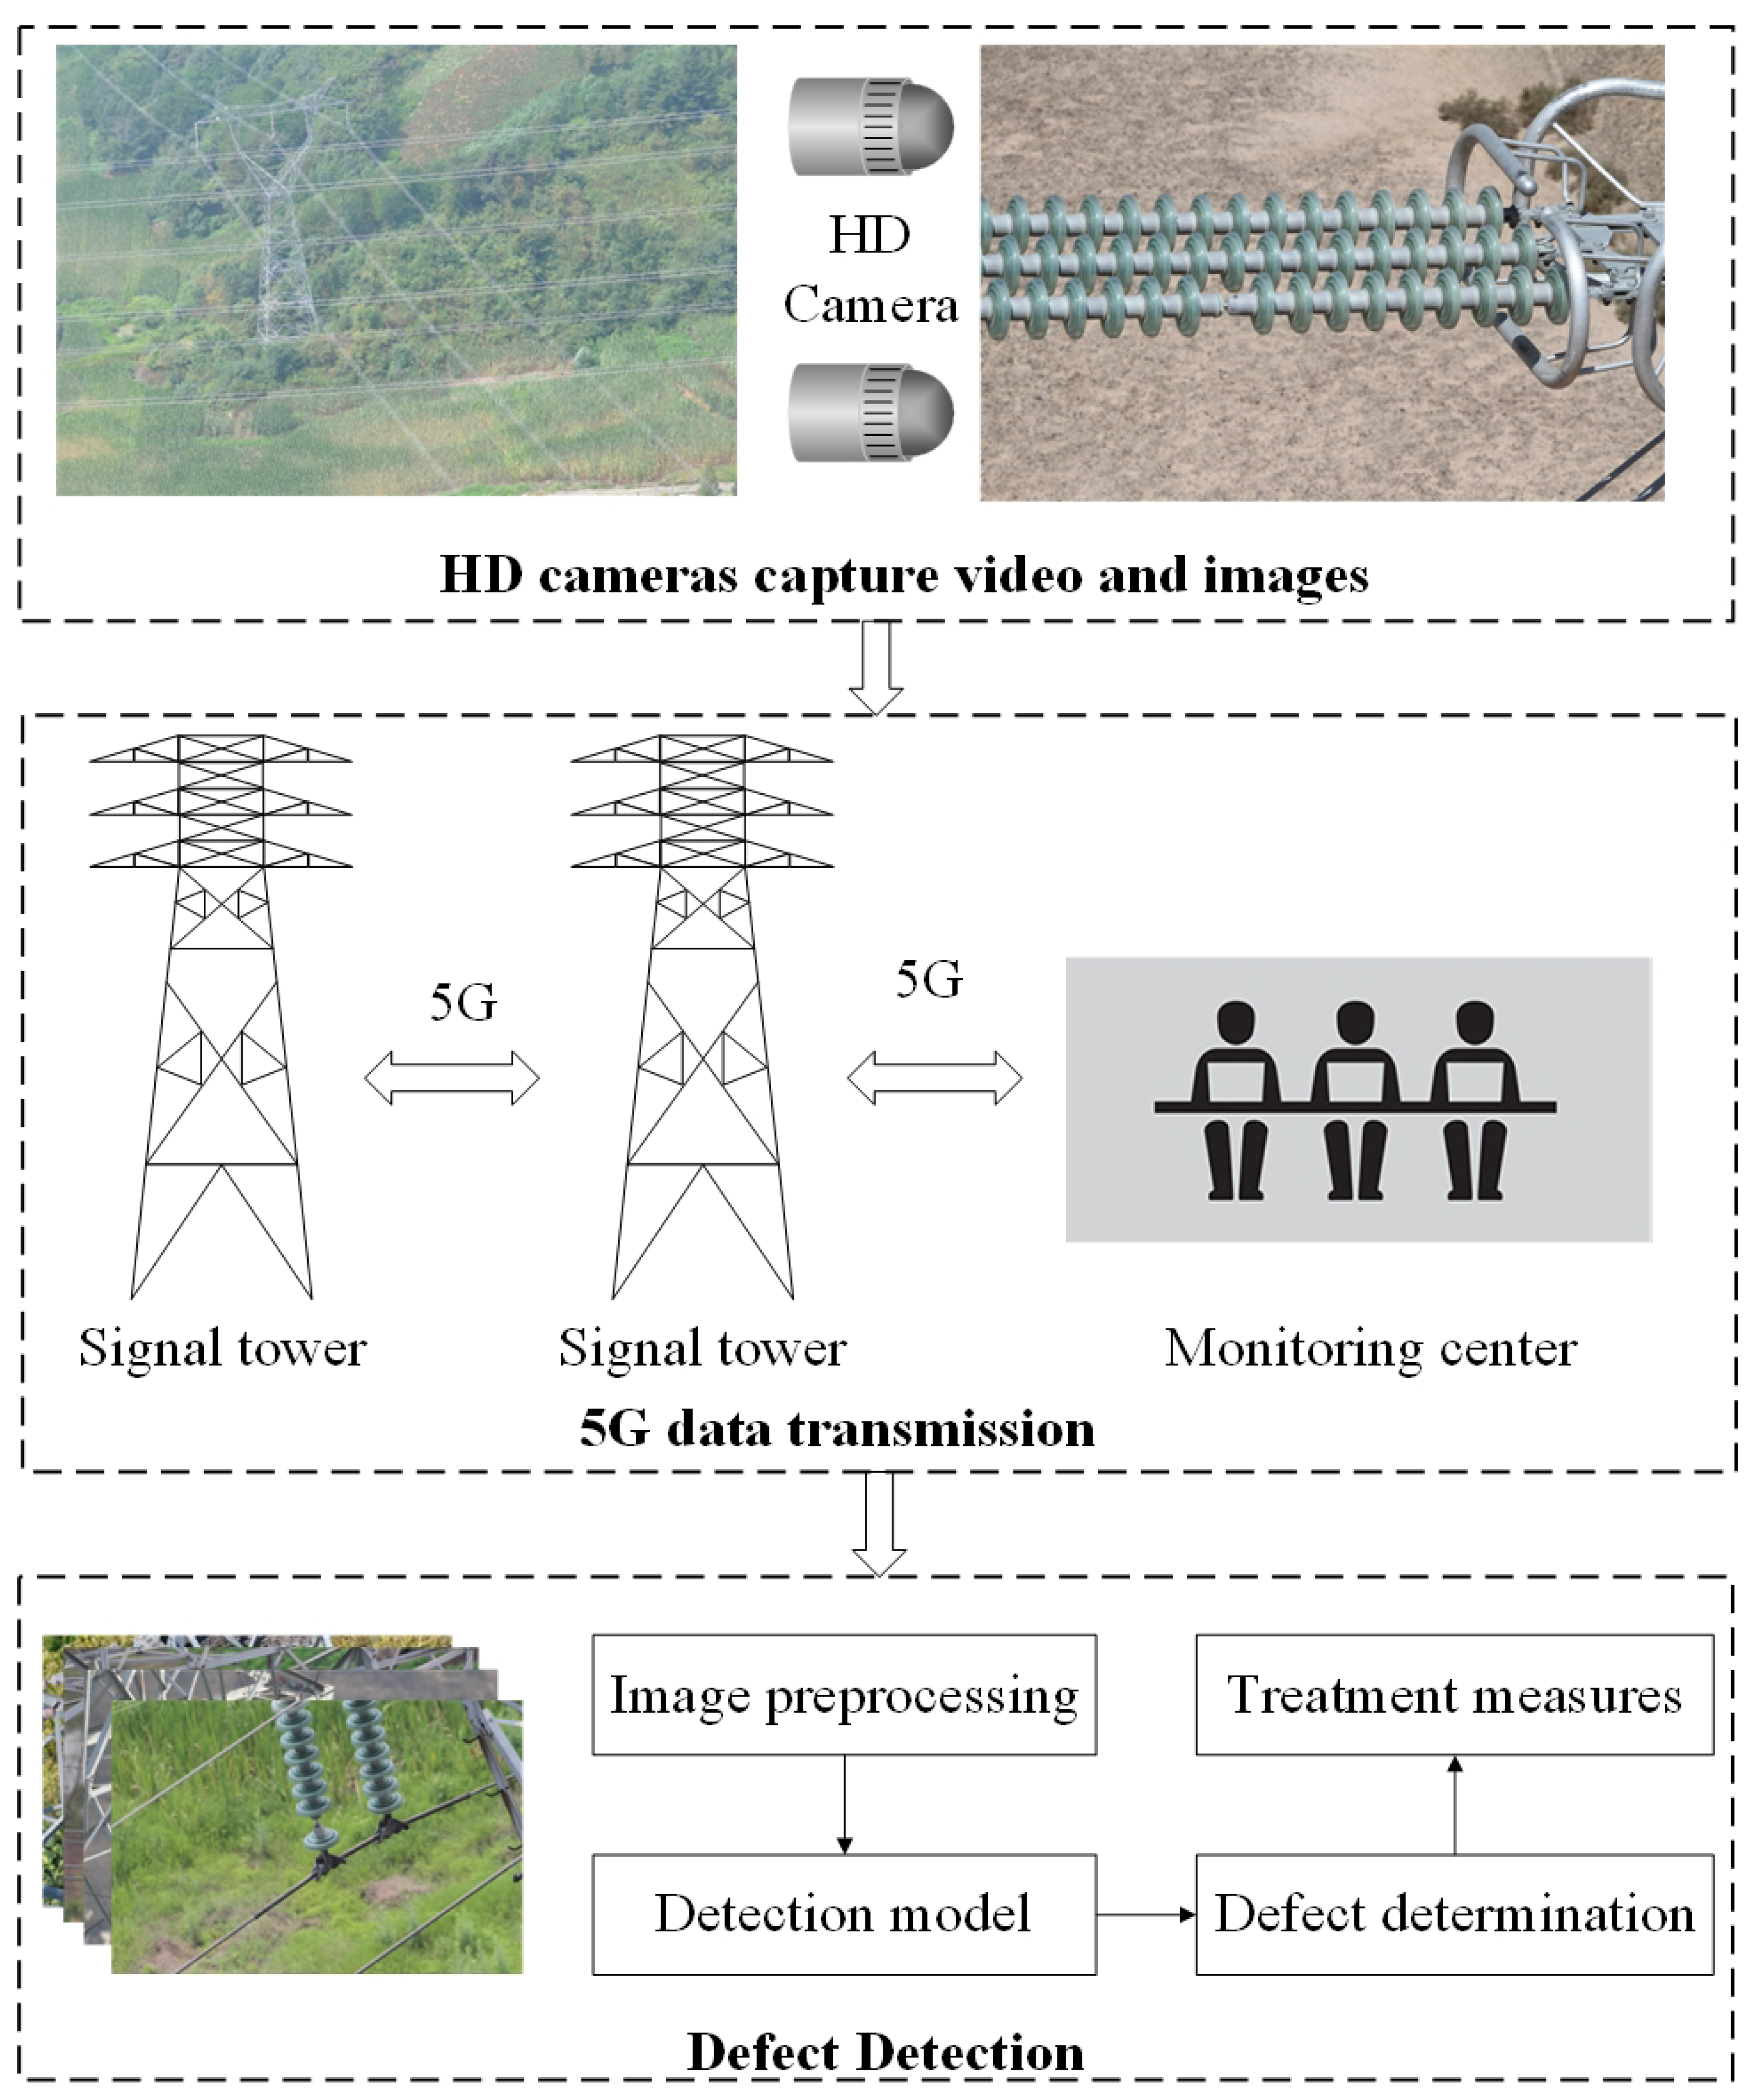
:1. Introduction
- (1)
- For the first time, the detection of insulator umbrella disc shedding in foggy conditions is realized, which provides a new way to detect transmission line defects in complex weather.
- (2)
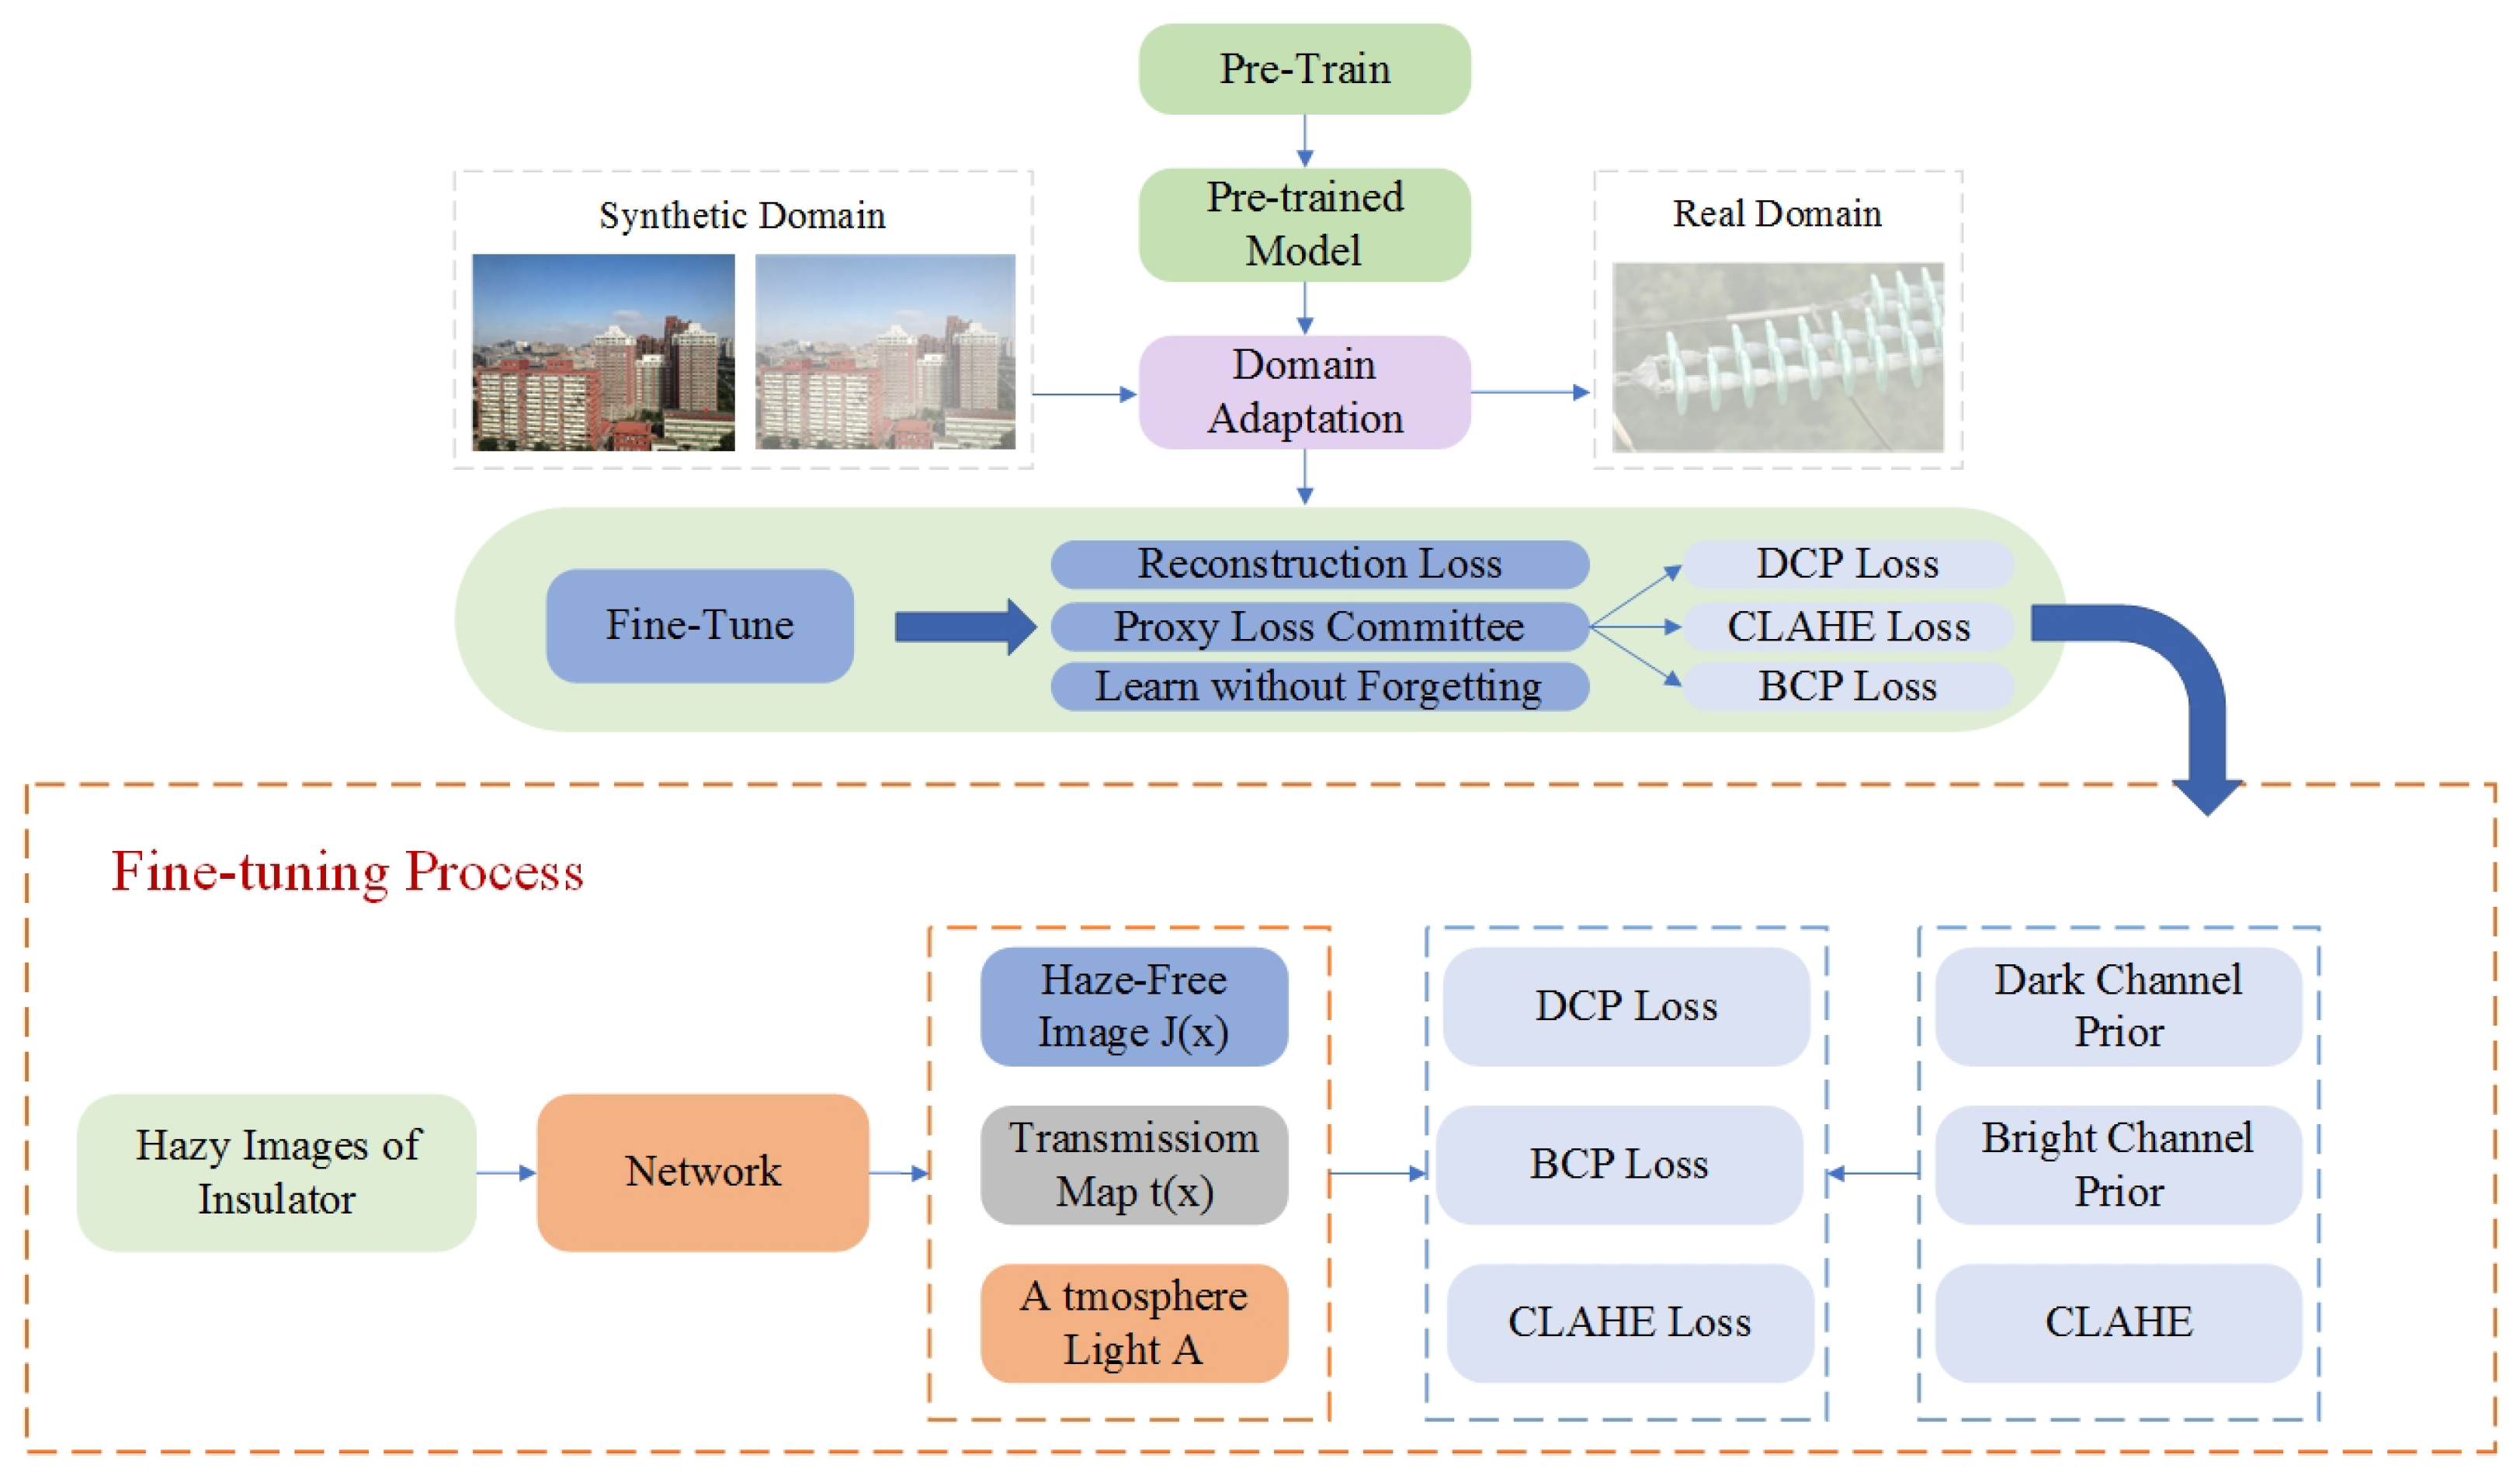
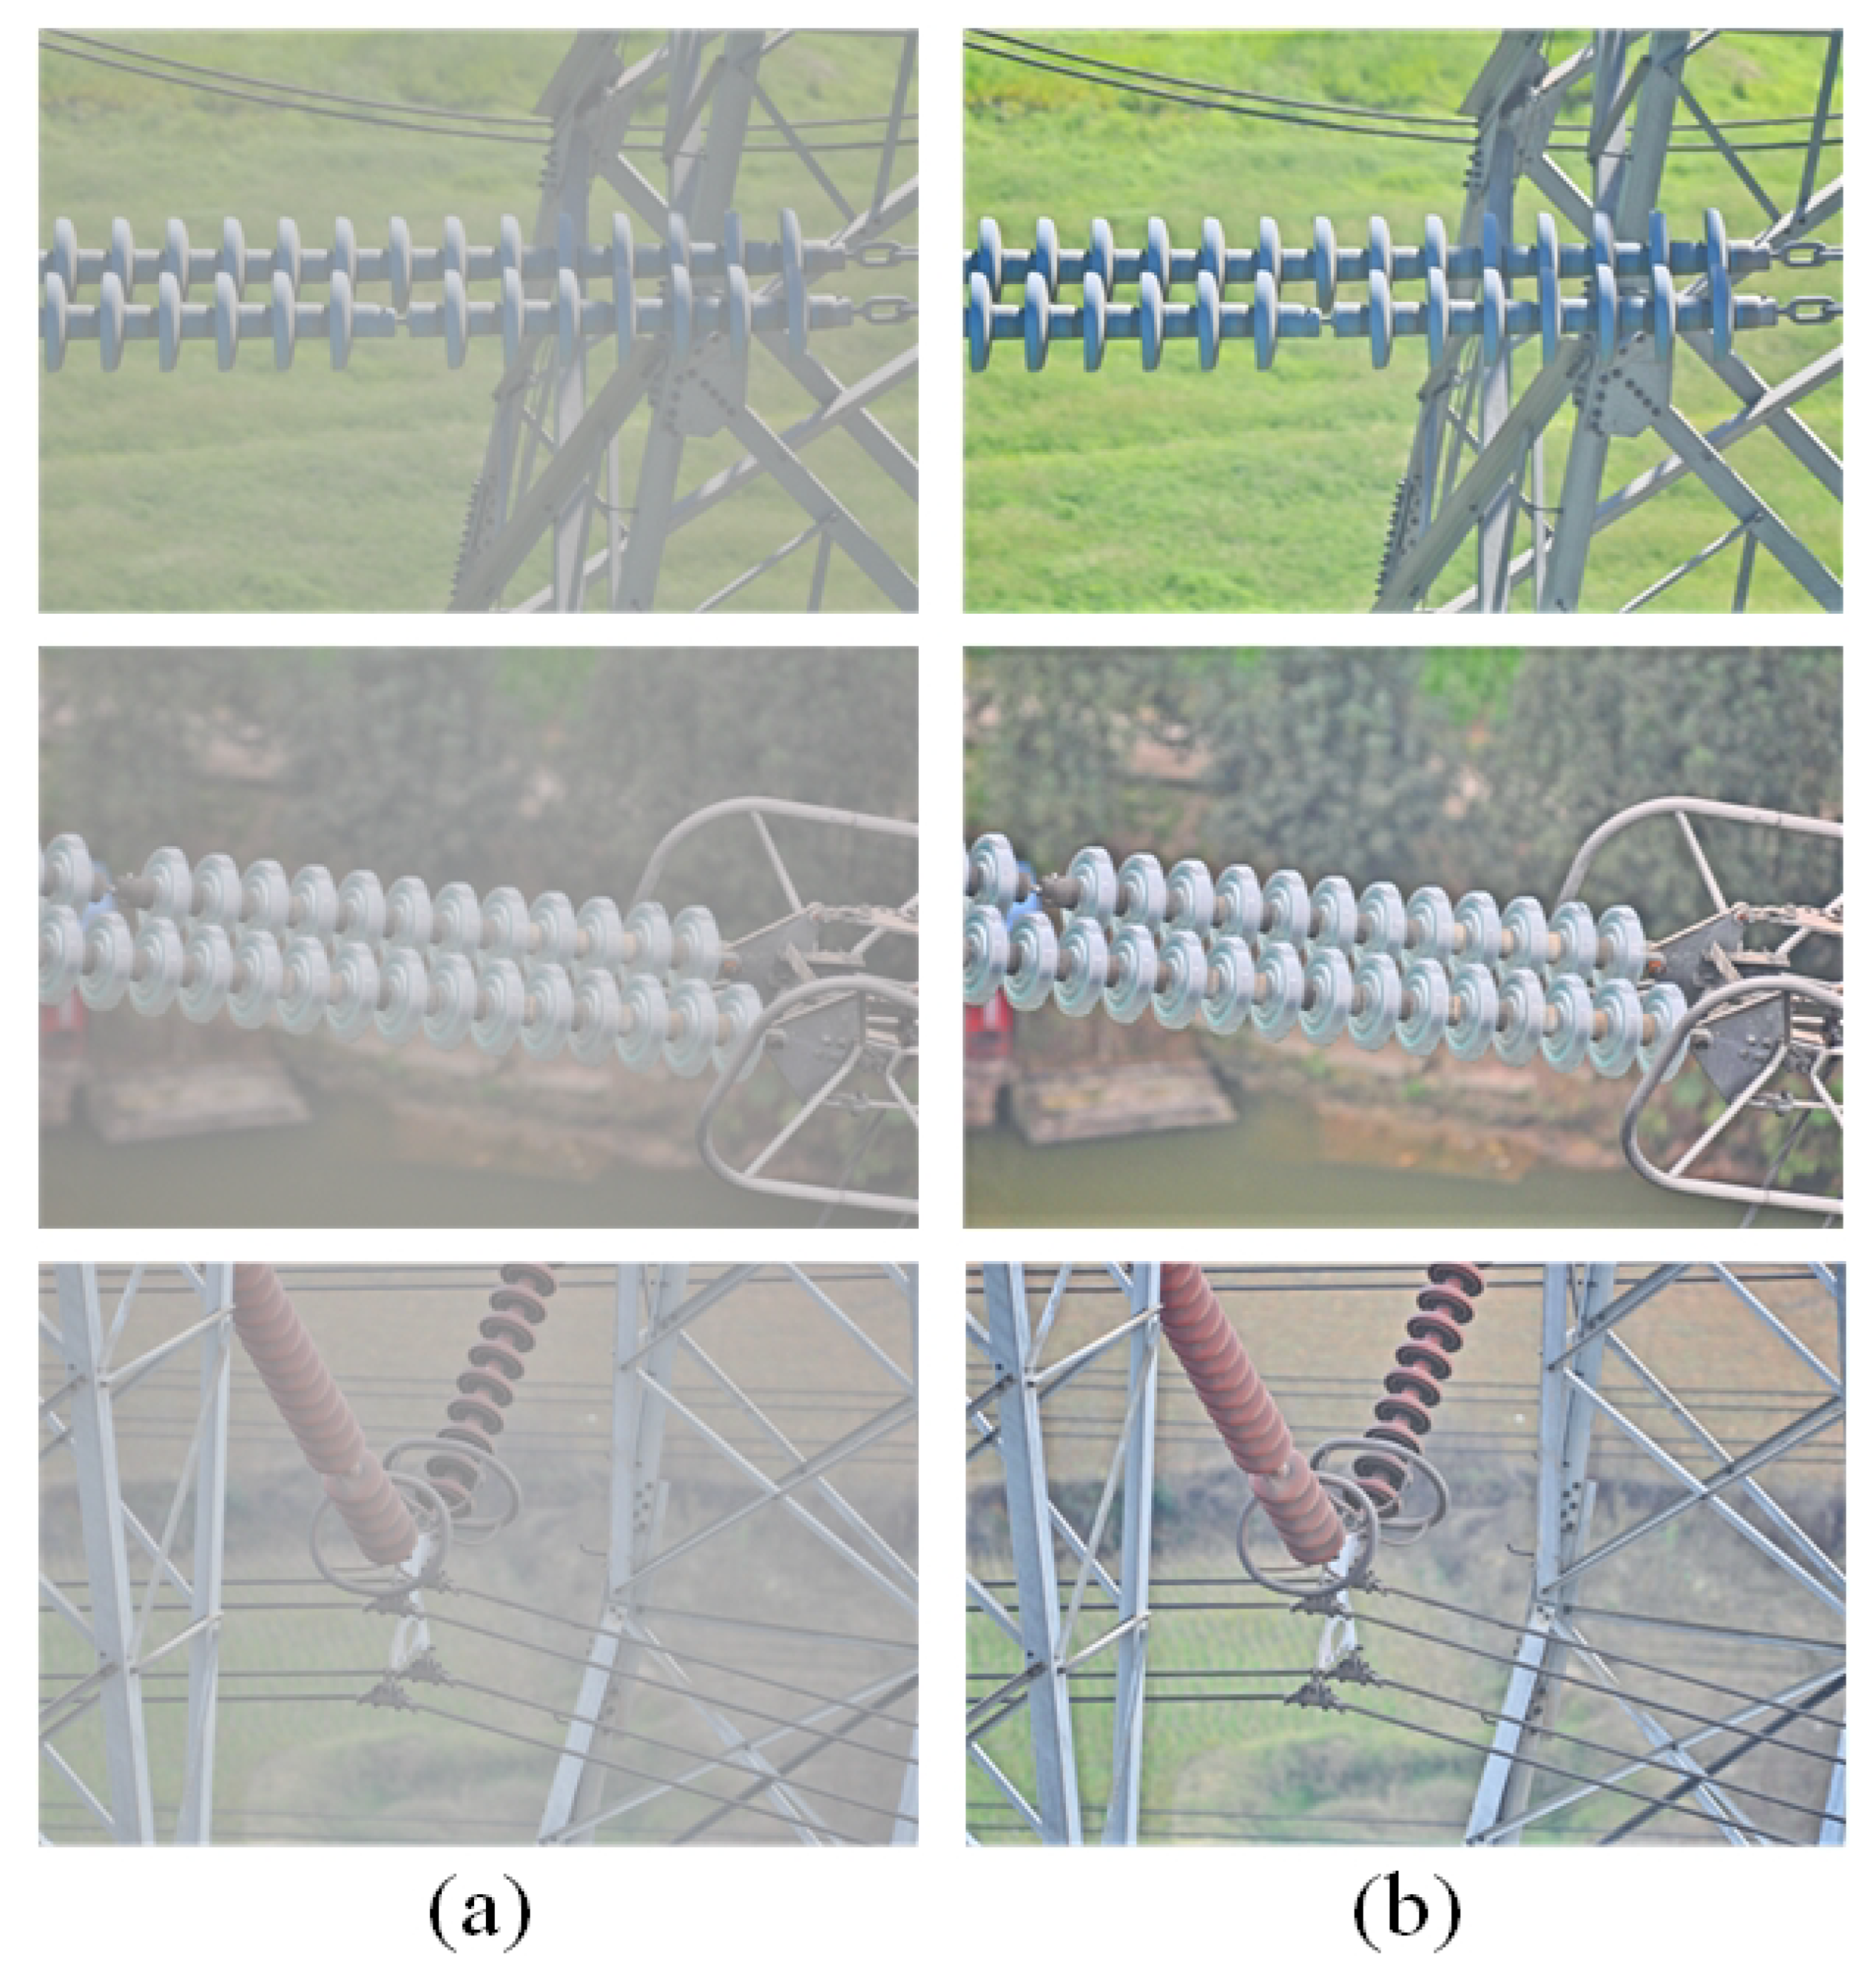
- A dehazing model with synthetic image pre-training and real image fine-tuning is proposed to solve the problem of the poor dehazing effect on real hazy images.
- (3)
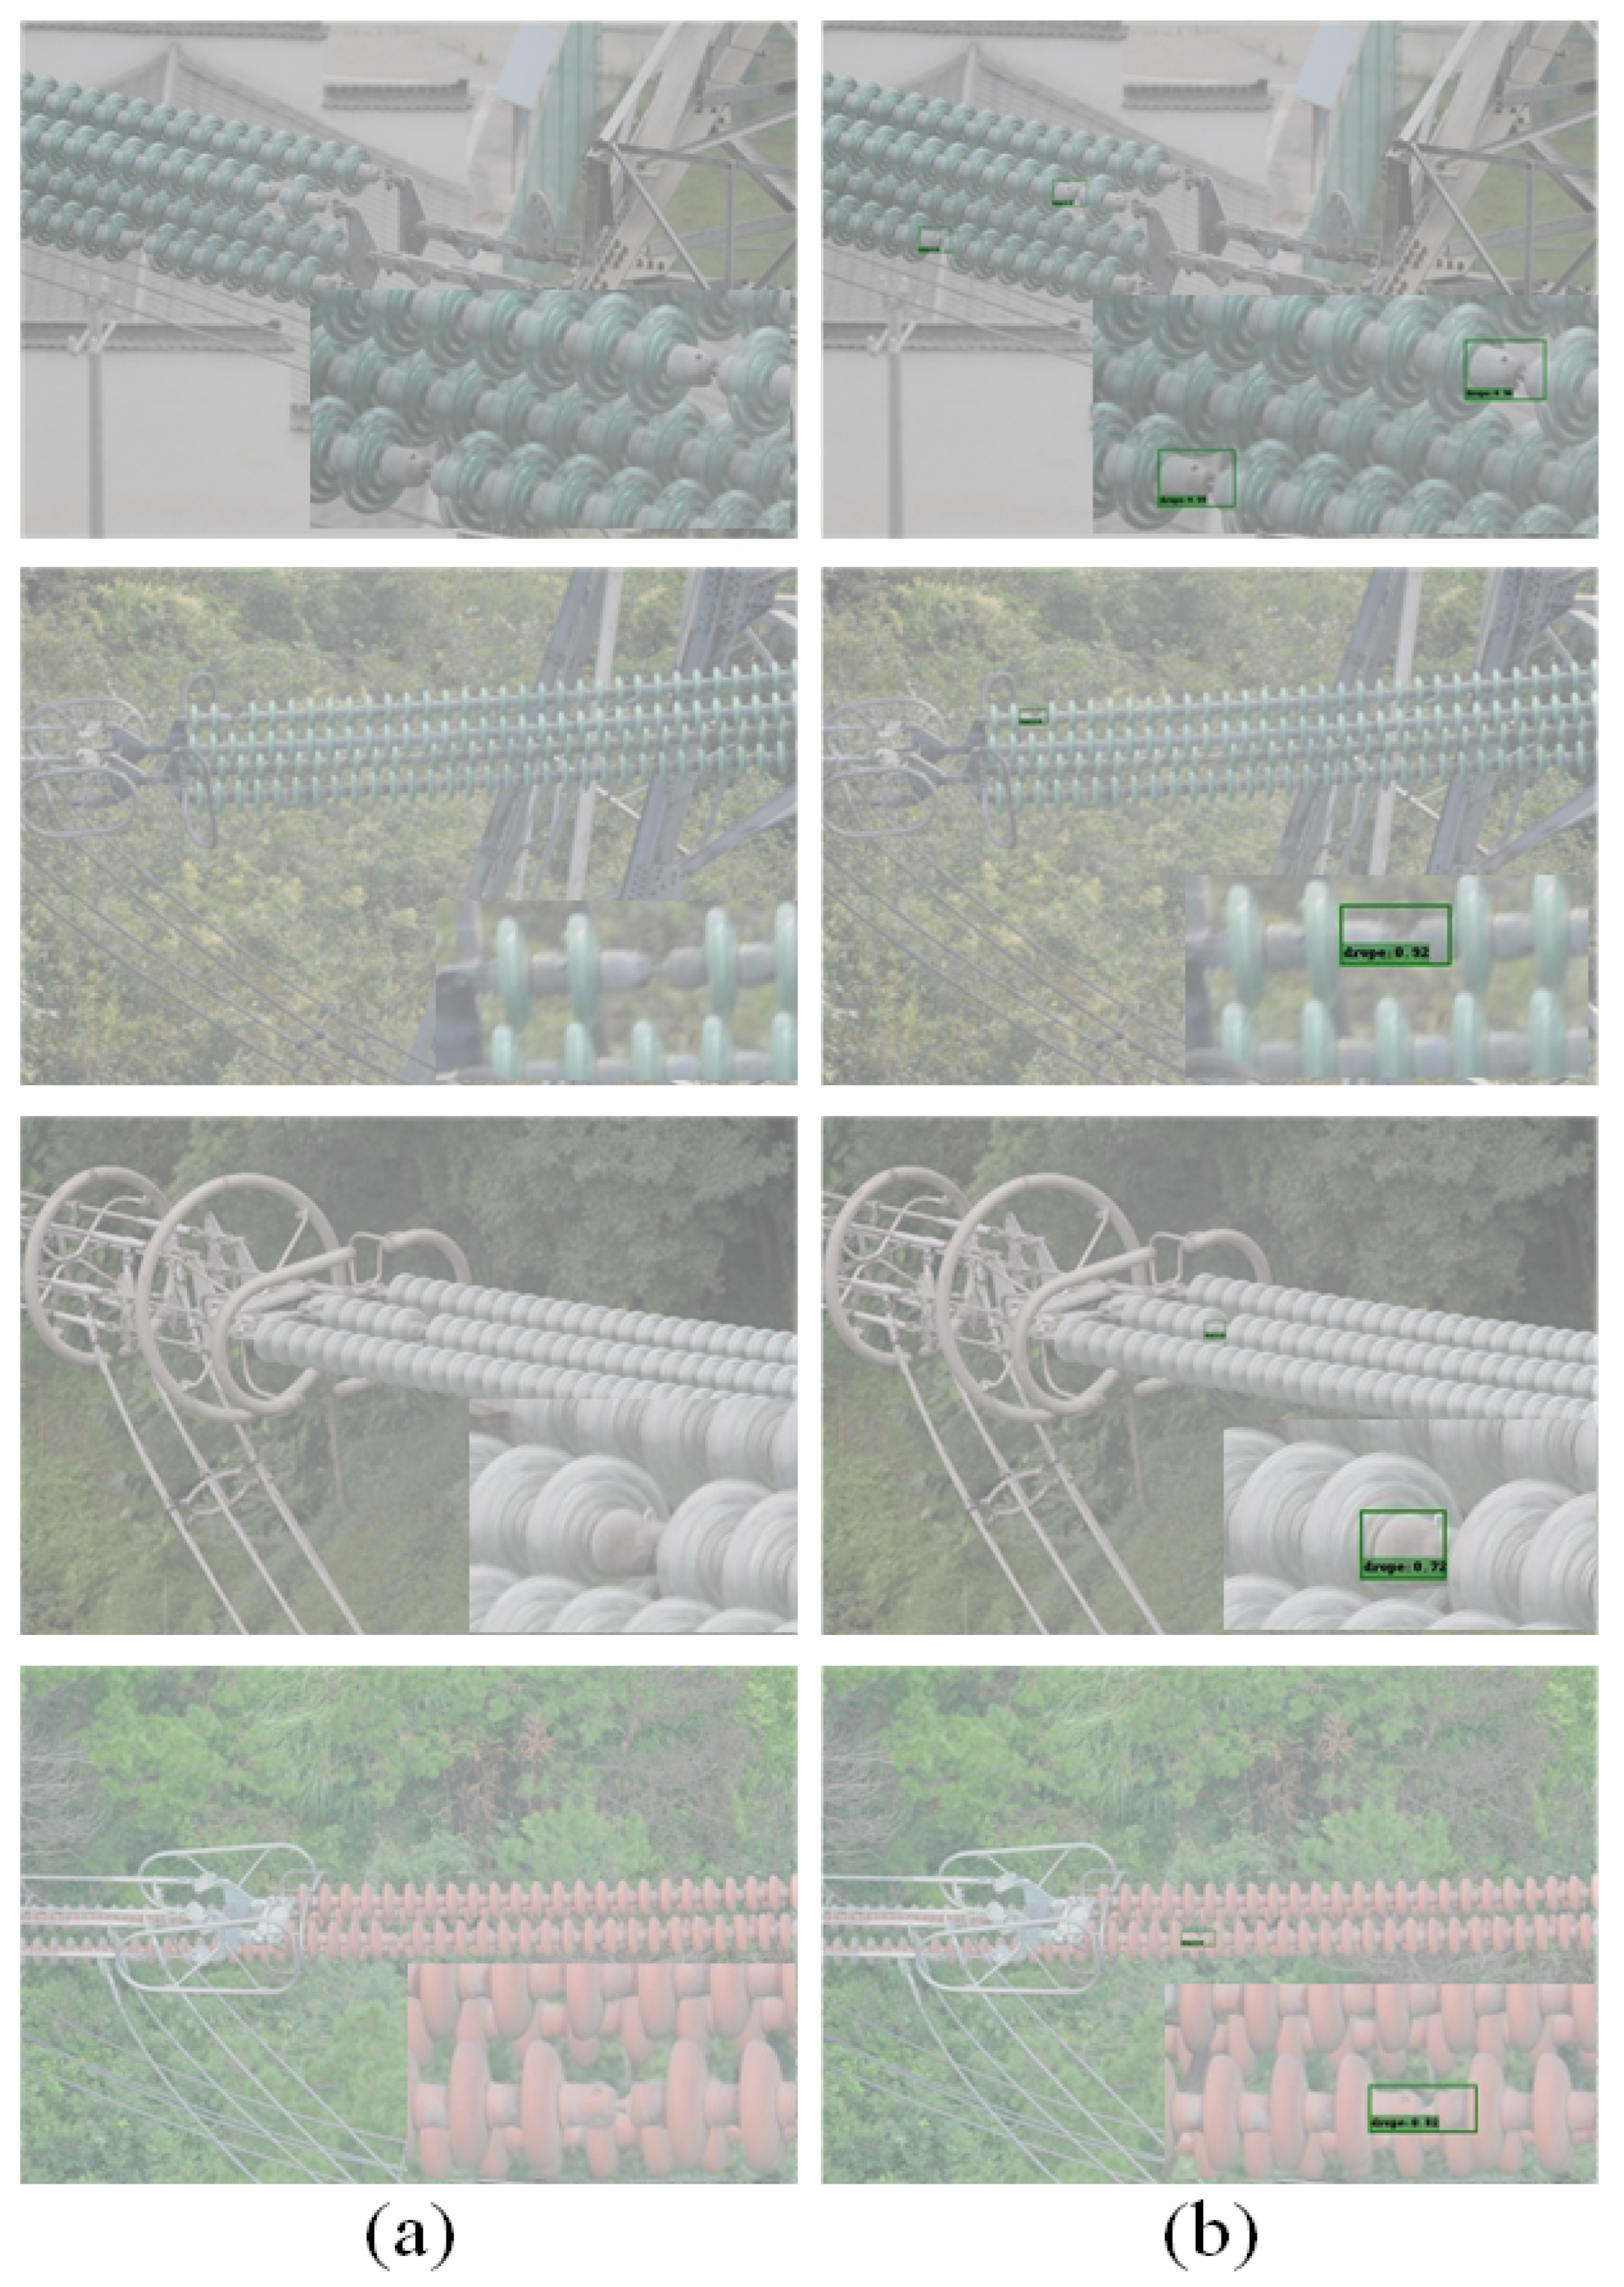
- The FA-SSD model [32] is proposed to improve the accuracy and recall rate of insulator umbrella disc shedding detection.
2. Materials and Methods
2.1. Dehazing Model
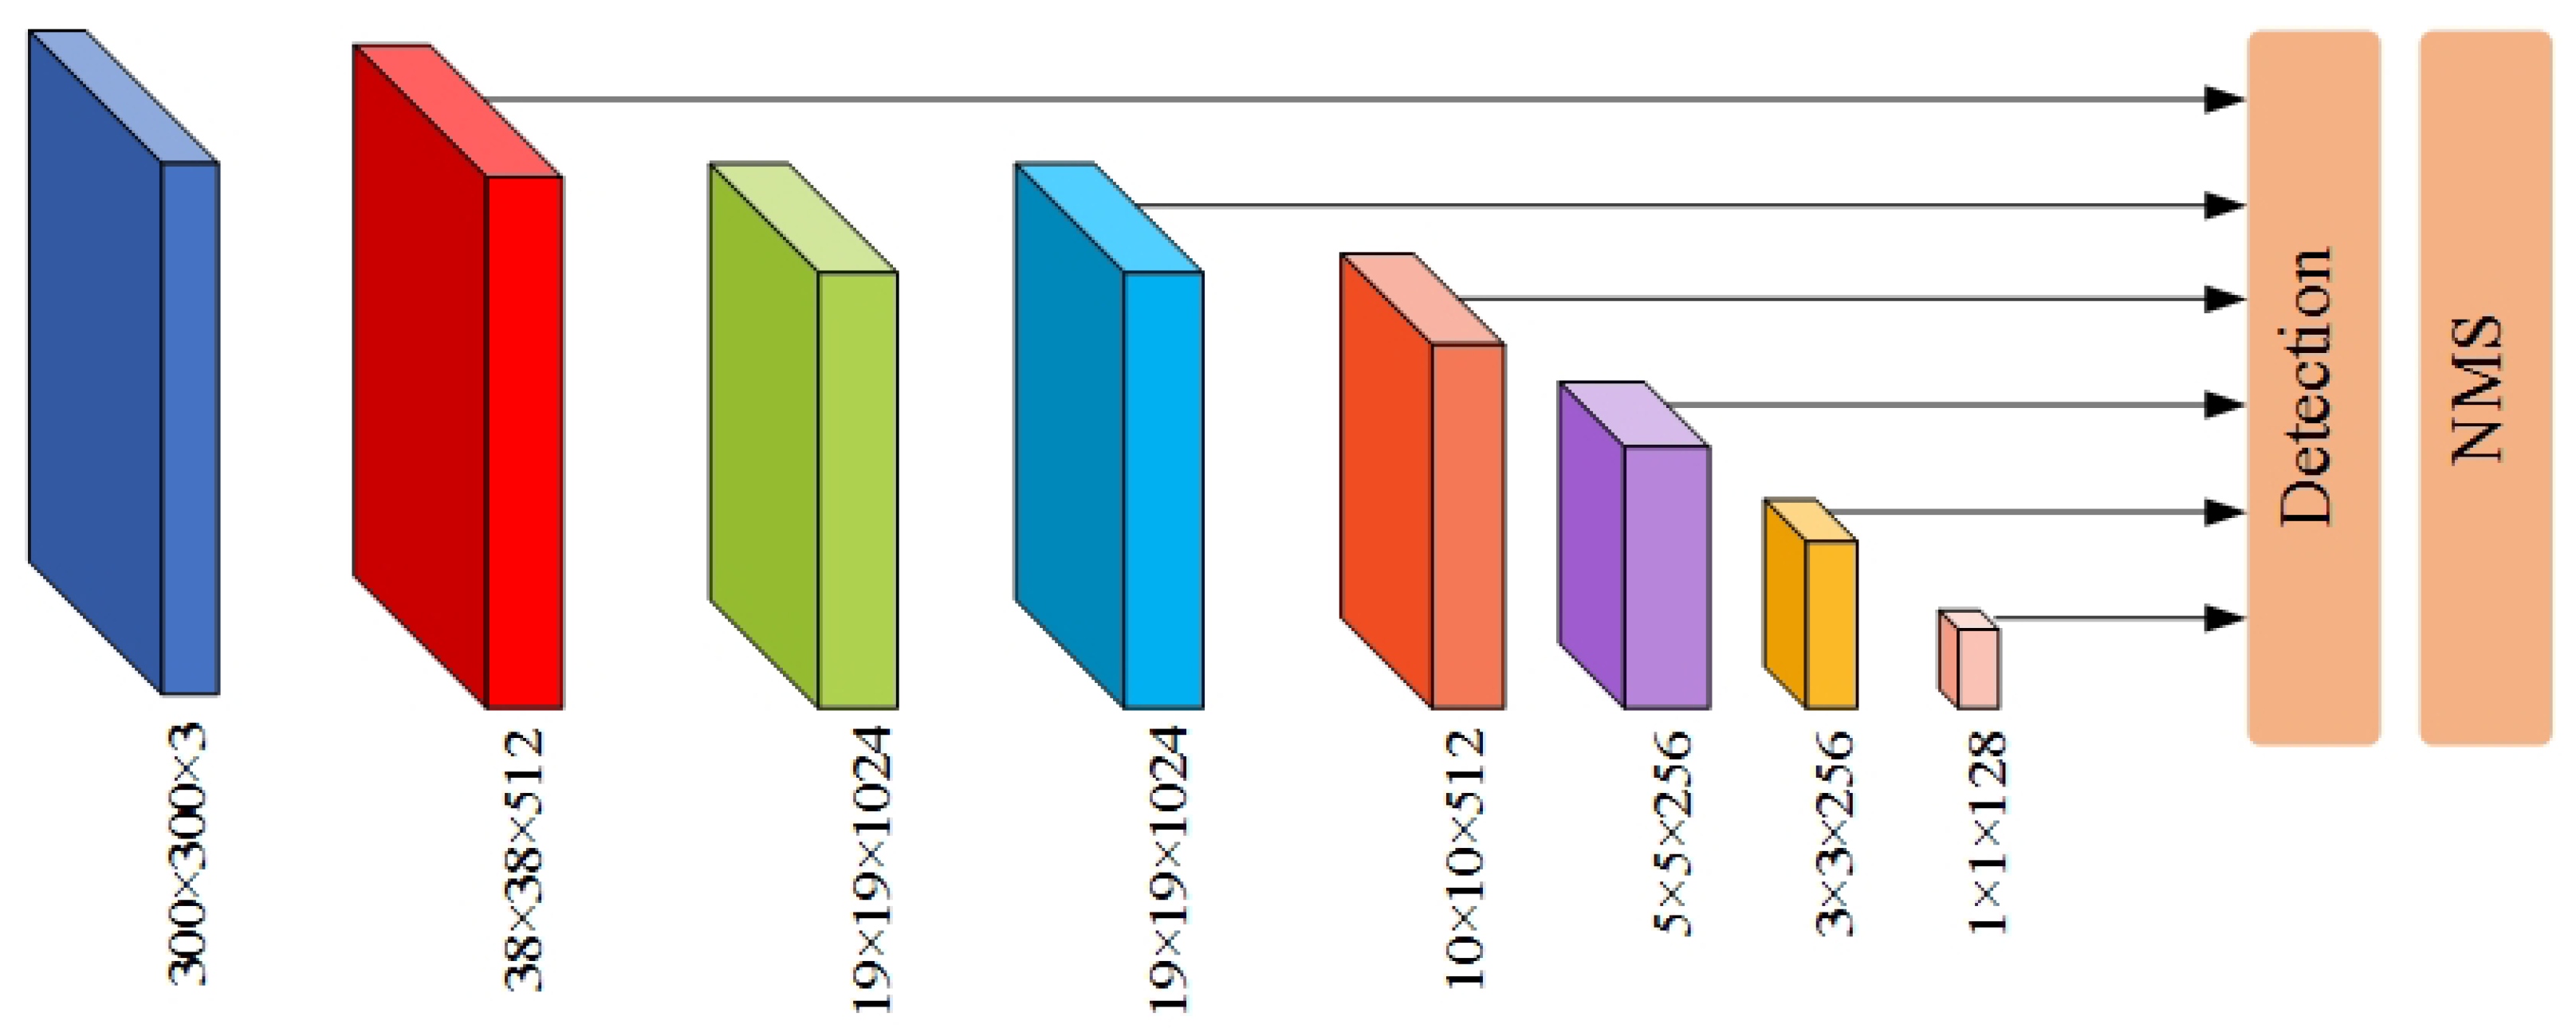
2.2. Fa-Ssd Model
SE Module
- (1)
- We performed convolution pooling and other operations on the input image to obtain a feature map:where and X represent the convolution kernel and the input image, respectively; and represent the convolution kernel and the sth channel of the input image, respectively; and represents the number of channels.
- (2)
- We squeezed and compressed the feature map into one-dimensional features:where H and W represent the width and height of the feature map, respectively.
- (3)
- For excitation, we performed activation operations on multiple channels to extract different features:
- (4)
- We multiplied the obtained weight factor with the corresponding channel feature to obtain a new feature map:
3. Results
3.1. Experimental Environment
3.2. Ablation Experiment of Fa-Ssd Model
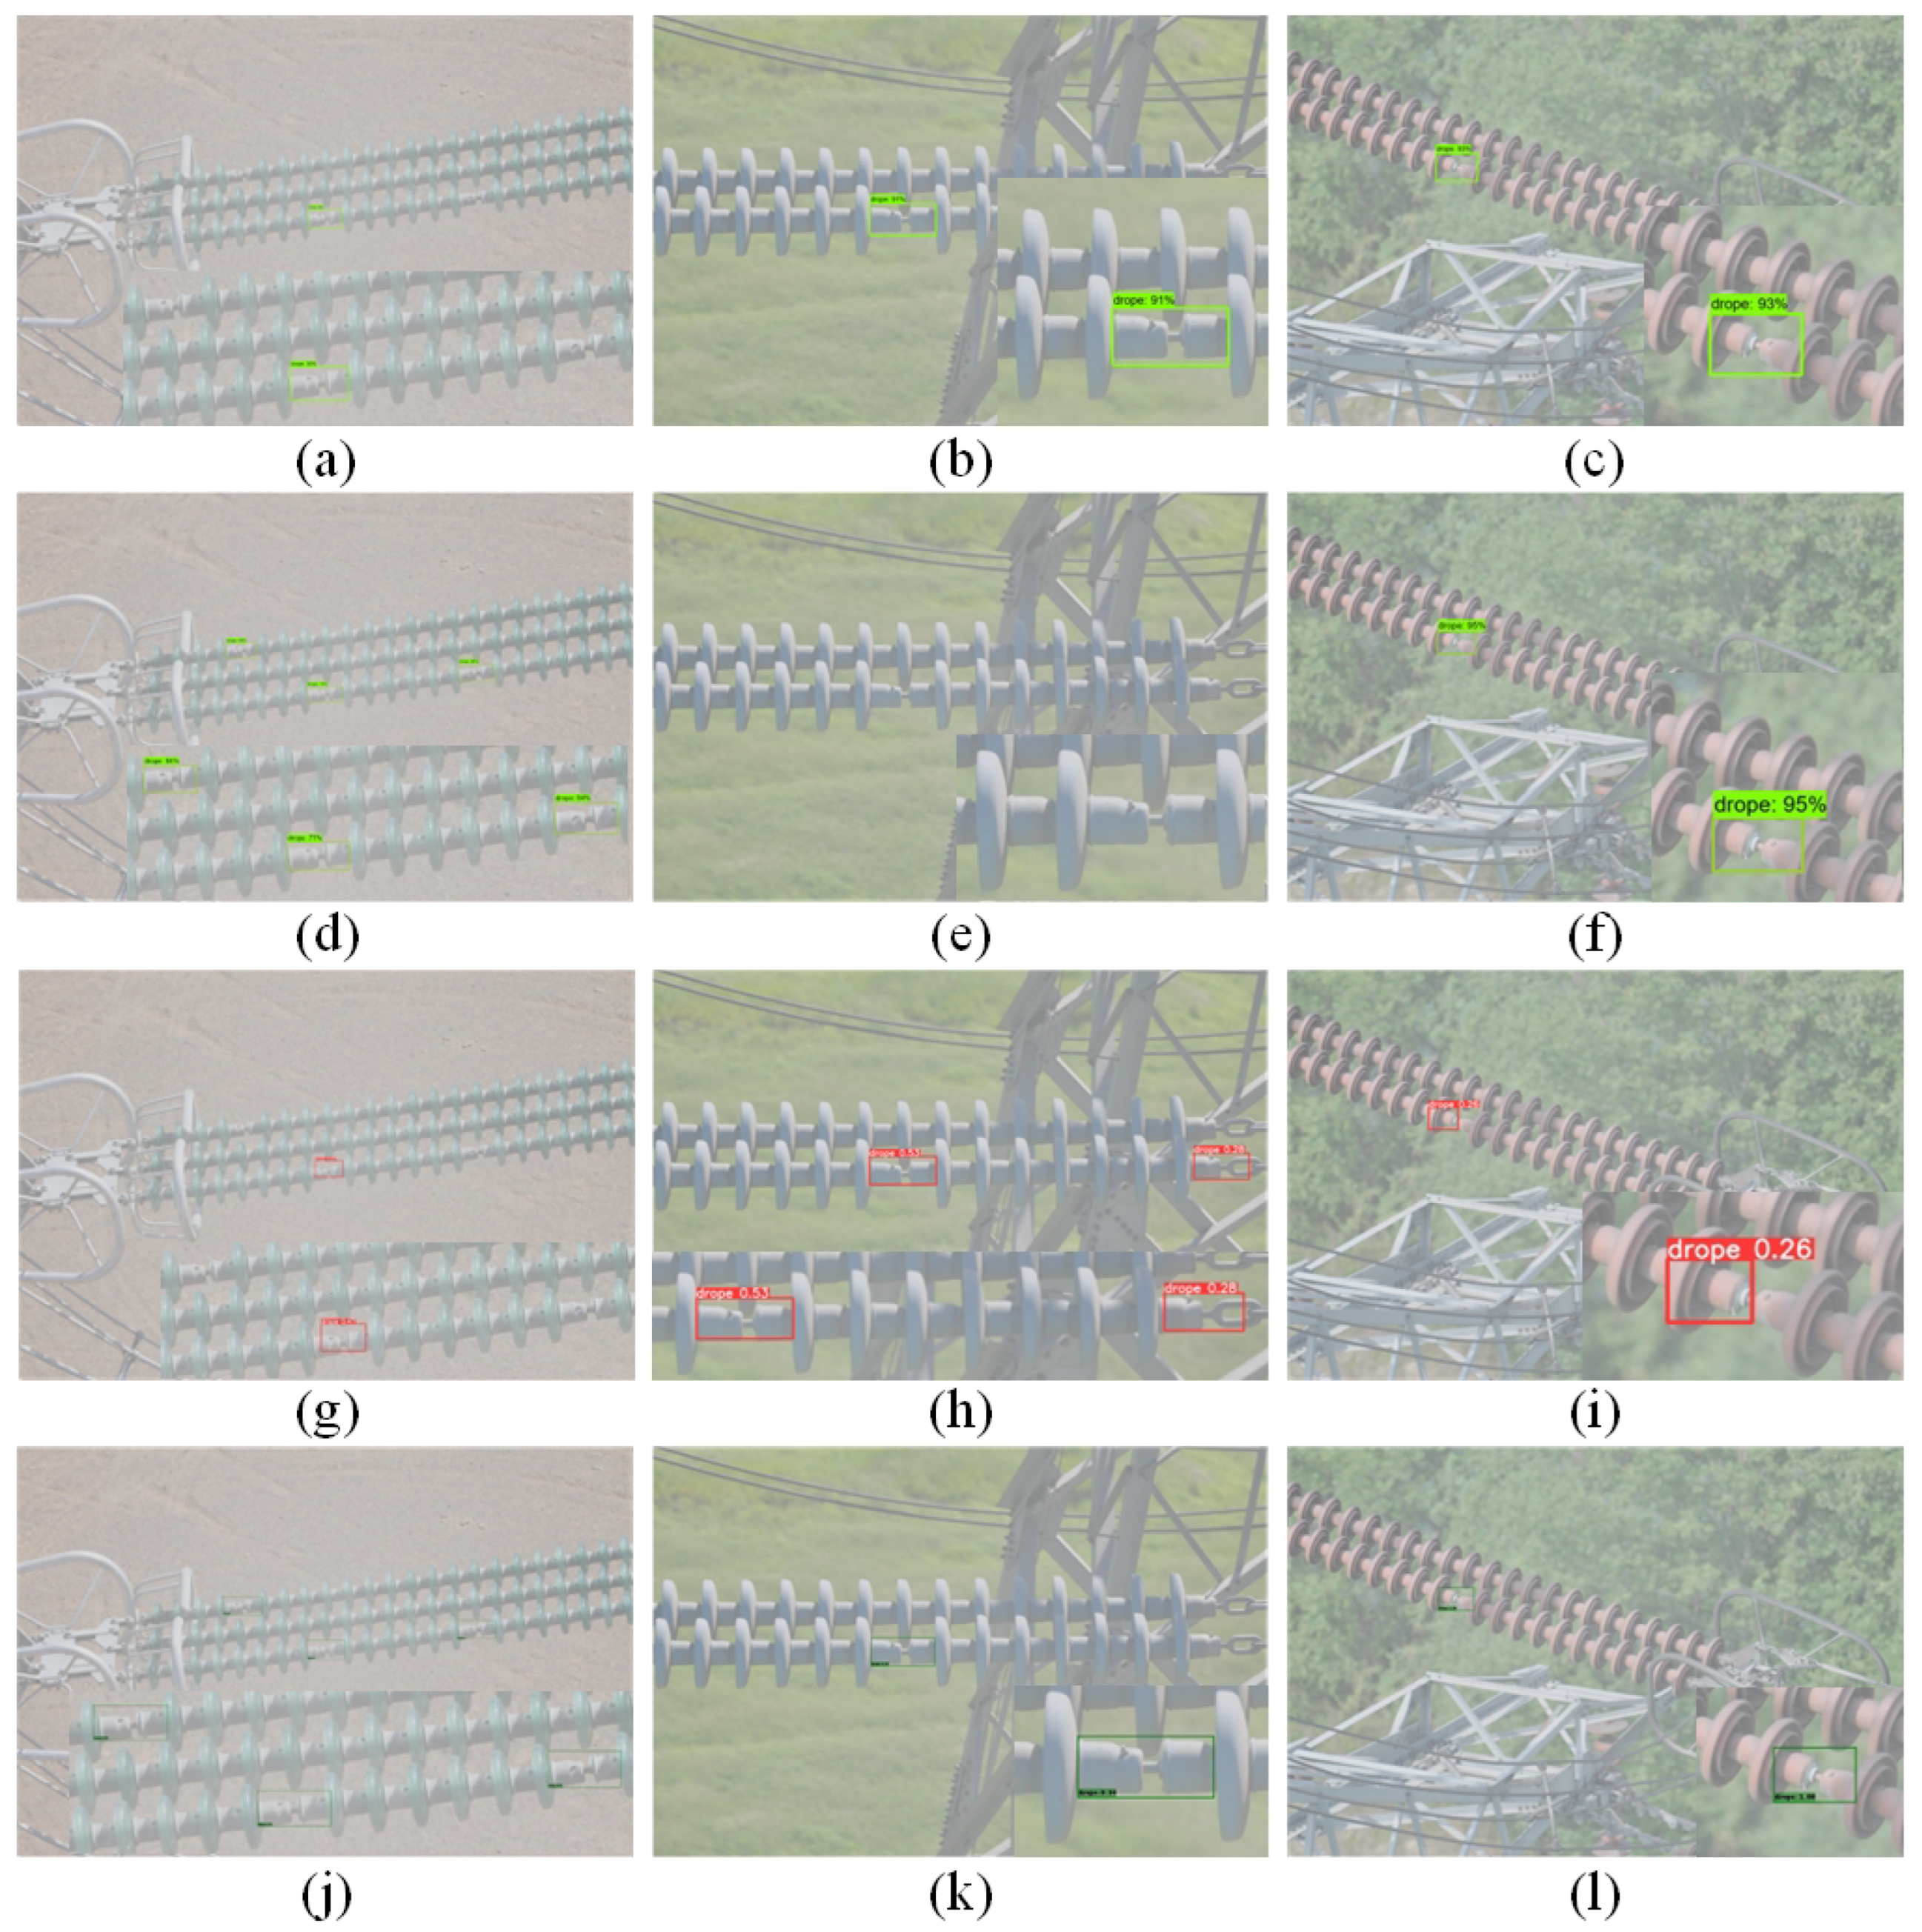
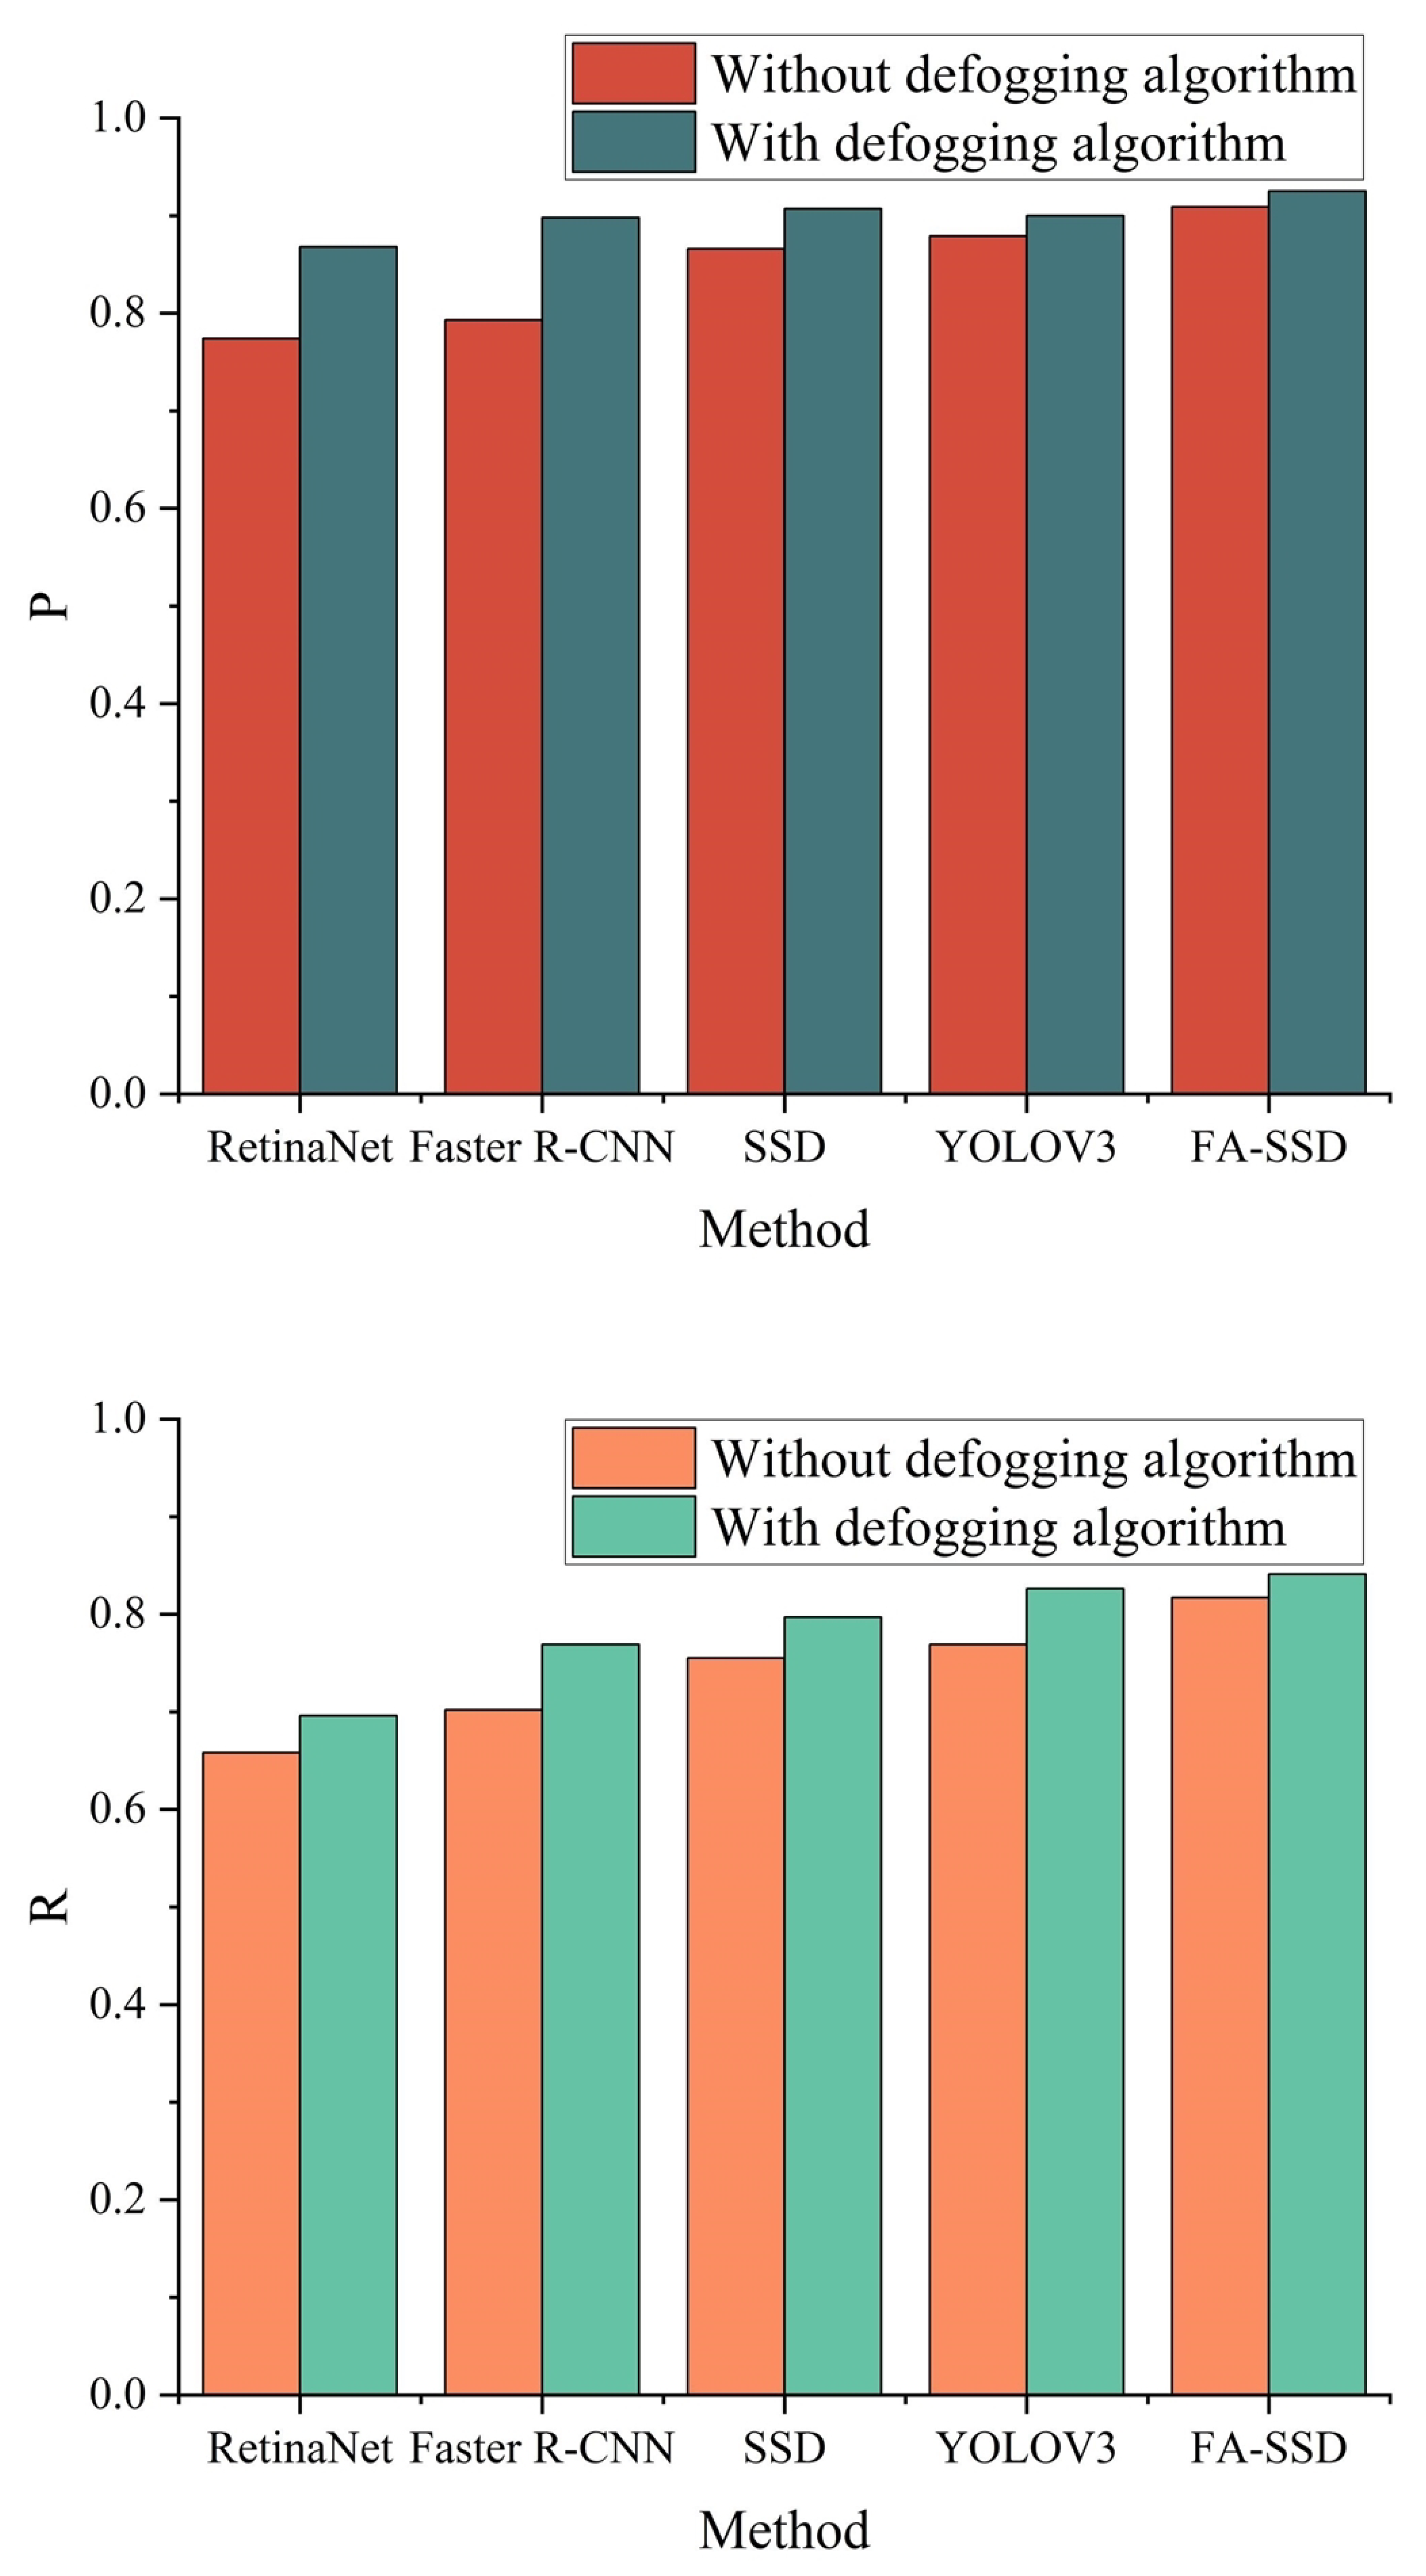
3.3. Compared with Other Methods
3.4. Dehazing Algorithm Experiment
4. Discussion
5. Conclusions
Author Contributions
Funding
Institutional Review Board Statement
Informed Consent Statement
Data Availability Statement
Acknowledgments
Conflicts of Interest
Abbreviations
| 5G | Fifth Generation Mobile Communication Technology |
| AI | Artificial Intelligence |
| HD | High Definition |
| SSD | Single Shot MultiBox Detector |
| NMS | Non-maximum suppression |
| YOLO | You Only Look Once |
| CNN | Convolutional Neural Network |
| FA-SSD | SSD Combining Feature Fusion and Attention Mechanism |
| FPN | Feature Pyramid Network |
| AR | Augmented Reality |
| GPU | Graphics Processing Unit |
| P | Precision |
| R | Recall |
| TP | True Positive |
| FP | False Positive |
| FN | False Negative |
| UAV | Unmanned Aerial Vehicle |
References
- Asprou, M.; Kyriakides, E.; Albu, M.M. Uncertainty bounds of transmission line parameters estimated from synchronized measurements. IEEE Trans. Instrum. Meas. 2018, 68, 2808–2818. [Google Scholar] [CrossRef]
- Zhao, Z.; Qi, H.; Qi, Y.; Zhang, K.; Zhai, Y.; Zhao, W. Detection method based on automatic visual shape clustering for pin-missing defect in transmission lines. IEEE Trans. Instrum. Meas. 2020, 69, 6080–6091. [Google Scholar] [CrossRef] [Green Version]
- Park, K.C.; Motai, Y.; Yoon, J.R. Acoustic fault detection technique for high-power insulators. IEEE Trans. Ind. Electron. 2017, 64, 9699–9708. [Google Scholar] [CrossRef]
- Zhai, Y.; Wang, D.; Zhang, M.; Wang, J.; Guo, F. Fault detection of insulator based on saliency and adaptive morphology. Multimed. Tools Appl. 2017, 76, 12051–12064. [Google Scholar] [CrossRef]
- Xia, H.; Yang, B.; Li, Y.; Wang, B. An Improved CenterNet Model for Insulator Defect Detection Using Aerial Imagery. Sensors 2022, 22, 2850. [Google Scholar] [CrossRef]
- Wen, Q.; Luo, Z.; Chen, R.; Yang, Y.; Li, G. Deep learning approaches on defect detection in high resolution aerial images of insulators. Sensors 2021, 21, 1033. [Google Scholar] [CrossRef]
- Deng, C.; Wang, S.; Huang, Z.; Tan, Z.; Liu, J. Unmanned Aerial Vehicles for Power Line Inspection: A Cooperative Way in Platforms and Communications. J. Commun. 2014, 9, 687–692. [Google Scholar] [CrossRef] [Green Version]
- Zhai, Y.; Yang, X.; Wang, Q.; Zhao, Z.; Zhao, W. Hybrid knowledge r-cnn for transmission line multifitting detection. IEEE Trans. Instrum. Meas. 2021, 70, 1–12. [Google Scholar] [CrossRef]
- Zhang, C.; Ueng, Y.L.; Studer, C.; Burg, A. Artificial intelligence for 5G and beyond 5G: Implementations, algorithms, and optimizations. IEEE J. Emerg. Sel. Top. Circuits Syst. 2020, 10, 149–163. [Google Scholar] [CrossRef]
- Mahmood, A.; Beltramelli, L.; Abedin, S.F.; Zeb, S.; Mowla, N.; Hassan, S.A.; Sisinni, E.; Gidlund, M. Industrial IoT in 5G-and-beyond networks: Vision, architecture, and design trends. IEEE Trans. Ind. Inform. 2021, 18, 4122–4137. [Google Scholar] [CrossRef]
- Liu, X.; Li, Y.; Shuang, F.; Gao, F.; Zhou, X.; Chen, X. Issd: Improved ssd for insulator and spacer online detection based on uav system. Sensors 2020, 20, 6961. [Google Scholar] [CrossRef] [PubMed]
- Stark, J.A. Adaptive image contrast enhancement using generalizations of histogram equalization. IEEE Trans. Image Process. 2000, 9, 889–896. [Google Scholar] [CrossRef] [PubMed] [Green Version]
- Liu, X.; Zhang, H.; Cheung, Y.m.; You, X.; Tang, Y.Y. Efficient single image dehazing and denoising: An efficient multi-scale correlated wavelet approach. Comput. Vis. Image Underst. 2017, 162, 23–33. [Google Scholar] [CrossRef]
- Li, C.; Tang, S.; Kwan, H.K.; Yan, J.; Zhou, T. Color correction based on cfa and enhancement based on retinex with dense pixels for underwater images. IEEE Access 2020, 8, 155732–155741. [Google Scholar] [CrossRef]
- He, K.; Sun, J.; Tang, X. Single image haze removal using dark channel prior. IEEE Trans. Pattern Anal. Mach. Intell. 2010, 33, 2341–2353. [Google Scholar]
- Zhou, F.; Meng, X.; Feng, Y.; Su, Z. SNPD: Semi-Supervised Neural Process Dehazing Network with Asymmetry Pseudo Labels. Symmetry 2022, 14, 806. [Google Scholar] [CrossRef]
- Chen, J.; Yang, G.; Ding, X.; Guo, Z.; Wang, S. Robust detection of dehazed image via dual-stream CNNs with adaptive feature fusion. Comput. Vis. Image Underst. 2022, 217, 103357. [Google Scholar] [CrossRef]
- Zhao, W.; Zhao, Y.; Feng, L.; Tang, J. Attention Enhanced Serial Unet++ Network for Removing Unevenly Distributed Haze. Electronics 2021, 10, 2868. [Google Scholar] [CrossRef]
- Zhou, Z.; Rahman Siddiquee, M.M.; Tajbakhsh, N.; Liang, J. Unet++: A nested u-net architecture for medical image segmentation. In Deep Learning in Medical Image Analysis and Multimodal Learning for Clinical Decision Support; Springer: Berlin/Heidelberg, Germany, 2018; pp. 3–11. [Google Scholar]
- Gao, G.; Cao, J.; Bao, C.; Hao, Q.; Ma, A.; Li, G. A Novel Transformer-Based Attention Network for Image Dehazing. Sensors 2022, 22, 3428. [Google Scholar] [CrossRef]
- Zhang, Z.; Huang, S.; Li, Y.; Li, H.; Hao, H. Image Detection of Insulator Defects Based on Morphological Processing and Deep Learning. Energies 2022, 15, 2465. [Google Scholar] [CrossRef]
- Tao, X.; Zhang, D.; Wang, Z.; Liu, X.; Zhang, H.; Xu, D. Detection of power line insulator defects using aerial images analyzed with convolutional neural networks. IEEE Trans. Syst. Man Cybern. Syst. 2018, 50, 1486–1498. [Google Scholar] [CrossRef]
- She, L.; Fan, Y.; Wang, J.; Cai, L.; Xue, J.; Xu, M. Insulator Surface Breakage Recognition Based on Multiscale Residual Neural Network. IEEE Trans. Instrum. Meas. 2021, 70, 1–9. [Google Scholar] [CrossRef]
- Zhang, X.; Zhang, Y.; Liu, J.; Zhang, C.; Xue, X.; Zhang, H.; Zhang, W. InsuDet: A Fault Detection Method for Insulators of Overhead Transmission Lines Using Convolutional Neural Networks. IEEE Trans. Instrum. Meas. 2021, 70, 1–12. [Google Scholar] [CrossRef]
- Redmon, J.; Farhadi, A. Yolov3: An incremental improvement. arXiv 2018, arXiv:1804.02767. [Google Scholar]
- Zhao, W.; Xu, M.; Cheng, X.; Zhao, Z. An Insulator in Transmission Lines Recognition and Fault Detection Model Based on Improved Faster RCNN. IEEE Trans. Instrum. Meas. 2021, 70, 1–8. [Google Scholar] [CrossRef]
- Ren, S.; He, K.; Girshick, R.; Sun, J. Faster r-cnn: Towards real-time object detection with region proposal networks. Adv. Neural Inf. Process. Syst. 2015, 28. Available online: https://proceedings.neurips.cc/paper/2015/hash/14bfa6bb14875e45bba028a21ed38046-Abstract.html (accessed on 17 May 2022). [CrossRef] [Green Version]
- Lin, T.Y.; Dollár, P.; Girshick, R.; He, K.; Hariharan, B.; Belongie, S. Feature pyramid networks for object detection. Proc. IEEE Conf. Comput. Vis. Pattern Recognit. 2017, 36, 2117–2125. [Google Scholar]
- Liu, W.; Ren, G.; Yu, R.; Guo, S.; Zhu, J.; Zhang, L. Image-Adaptive YOLO for Object Detection in Adverse Weather Conditions. arXiv 2021, arXiv:2112.08088. [Google Scholar]
- He, Y.; Liu, Z. A Feature Fusion Method to Improve the Driving Obstacle Detection Under Foggy Weather. IEEE Trans. Transp. Electrif. 2021, 7, 2505–2515. [Google Scholar] [CrossRef]
- Hassaballah, M.; Kenk, M.A.; Muhammad, K.; Minaee, S. Vehicle detection and tracking in adverse weather using a deep learning framework. IEEE Trans. Intell. Transp. Syst. 2020, 22, 4230–4242. [Google Scholar] [CrossRef]
- Liu, W.; Anguelov, D.; Erhan, D.; Szegedy, C.; Reed, S.; Fu, C.Y.; Berg, A.C. Ssd: Single shot multibox detector. In Proceedings of the European Conference on Computer Vision, Amsterdam, The Netherlands, 8–16 August 2016; Springer: Berlin/Heidelberg, Germany, 2016; pp. 21–37. [Google Scholar]
- Chen, Z.; Wang, Y.; Yang, Y.; Liu, D. PSD: Principled synthetic-to-real dehazing guided by physical priors. In Proceedings of the Proceedings of the IEEE/CVF Conference on Computer Vision and Pattern Recognition, Nashville, TN, USA, 20–25 June 2021; pp. 7180–7189.
- Li, B.; Ren, W.; Fu, D.; Tao, D.; Feng, D.; Zeng, W.; Wang, Z. Benchmarking single-image dehazing and beyond. IEEE Trans. Image Process. 2018, 28, 492–505. [Google Scholar] [CrossRef] [PubMed] [Green Version]
- Li, Z.; Zhou, F. FSSD: Feature fusion single shot multibox detector. arXiv 2017, arXiv:1712.00960. [Google Scholar]
- He, K.; Zhang, X.; Ren, S.; Sun, J. Deep residual learning for image recognition. In Proceedings of the IEEE Conference on Computer Vision and Pattern Recognition, Las Vegas, NV, USA, 27–30 June 2016; pp. 770–778. [Google Scholar]
- Hu, J.; Shen, L.; Sun, G. Squeeze-and-excitation networks. In Proceedings of the IEEE Conference on Computer Vision and Pattern Recognition, Salt Lake City, UT, USA, 18–23 June 2018; pp. 7132–7141. [Google Scholar]
- Lin, T.Y.; Goyal, P.; Girshick, R.; He, K.; Dollár, P. Focal loss for dense object detection. In Proceedings of the IEEE International Conference on Computer Vision, Venice, Italy, 22–29 October 2017; pp. 2980–2988. [Google Scholar]
- Li, Y.; Chang, Y.; Gao, Y.; Yu, C.; Yan, L. Physically Disentangled Intra-and Inter-Domain Adaptation for Varicolored Haze Removal. In Proceedings of the IEEE/CVF Conference on Computer Vision and Pattern Recognition, New Orleans, LA, USA, 21–24 June 2022; pp. 5841–5850. [Google Scholar]
- Yuntong, Y.; Changfeng, Y.; Yi, C.; Lin, Z.; Xile, Z.; Luxin, Y.; Yonghong, T. Unsupervised Deraining: Where Contrastive Learning Meets Self-similarity. arXiv 2022, arXiv:2203.11509. [Google Scholar]
- Li, Y.; Chang, Y.; Yu, C.; Yan, L. Close the Loop: A Unified Bottom-Up and Top-Down Paradigm for Joint Image Deraining and Segmentation. 2022. Available online: https://www.aaai.org/AAAI22Papers/AAAI-678.LiY.pdf (accessed on 17 May 2022).


| Layer Name | Input | Output |
|---|---|---|
| Conv1 | 300 × 300 × 3 | 150 × 150 × 64 |
| Conv2_x | 150 × 150 × 64 | 75 × 75 × 256 |
| Conv3_x | 75 × 75 × 256 | 38 × 38 × 512 |
| Conv4_x | 38 × 38 × 512 | 38 × 38 × 1024 |
| layer1 | 38 × 38 × 1024 | 19 × 19 × 512 |
| layer2 | 19 × 19 × 512 | 10 × 10 × 512 |
| SSD | Feature Fusion | Attention | P | R | |
|---|---|---|---|---|---|
| √ | 0.866 | 0.755 | 0.806 | ||
| √ | √ | 0.899 | 0.769 | 0.828 | |
| √ | √ | 0.877 | 0.793 | 0.832 | |
| √ | √ | √ | 0.909 | 0.817 | 0.860 |
Publisher’s Note: MDPI stays neutral with regard to jurisdictional claims in published maps and institutional affiliations. |
© 2022 by the authors. Licensee MDPI, Basel, Switzerland. This article is an open access article distributed under the terms and conditions of the Creative Commons Attribution (CC BY) license (https://creativecommons.org/licenses/by/4.0/).
Share and Cite
Xin, R.; Chen, X.; Wu, J.; Yang, K.; Wang, X.; Zhai, Y. Insulator Umbrella Disc Shedding Detection in Foggy Weather. Sensors 2022, 22, 4871. https://doi.org/10.3390/s22134871
Xin R, Chen X, Wu J, Yang K, Wang X, Zhai Y. Insulator Umbrella Disc Shedding Detection in Foggy Weather. Sensors. 2022; 22(13):4871. https://doi.org/10.3390/s22134871
Chicago/Turabian StyleXin, Rui, Xi Chen, Junying Wu, Ke Yang, Xinying Wang, and Yongjie Zhai. 2022. "Insulator Umbrella Disc Shedding Detection in Foggy Weather" Sensors 22, no. 13: 4871. https://doi.org/10.3390/s22134871
APA StyleXin, R., Chen, X., Wu, J., Yang, K., Wang, X., & Zhai, Y. (2022). Insulator Umbrella Disc Shedding Detection in Foggy Weather. Sensors, 22(13), 4871. https://doi.org/10.3390/s22134871