1. Introduction
Chlorine gas has been used for various military, industrial, and domestic applications for a very long time. Exposure to this reactive gas can result in a toxic effect on the respiratory system of humans or animals [
1]. Spills in industrial plants can cause major emergencies and evacuation of the affected area [
2]. A compact early chlorine gas warning system is desirable in such emergencies.
There have been some publications covering Cl
2 sensors. The work that has been published so far focuses mainly on the Cl
2 sensor materials. Joshi et al. [
3] discussed polypyrrole (PPy) composite films modified with ZnO nanowires as the sensitive and selective chlorine gas sensor. They achieved high sensitivity at 10 ppm and a fast response time of 55 s.
Baron, Narayanaswamy, and Thorpe [
4] mixed silicone rubber with fluorescent porphyrin H
2TPP to detect Cl
2 at ppm levels. The produced fluorescent emission effect was low. This sensor is also susceptible to other substances, such as hydrogen chloride, nitrogen dioxide, and nitric acid, making it ineffectual as a selective Cl
2 gas sensor.
Rao, Godbole, and Bhagwat [
5] analyzed a sensor composed of palladium-doped nickel ferrite thin films. Pd doping in a NiFe
2O
4 thin film increases the sensitivity to the Cl
2 gas, thus decreasing the operating temperature of the film. Miyata, Kawaguchi, Ishii, and Minami [
6] discussed highly sensitive Cl
2 gas detection using Cu–phthalocyanine thin films and found that the film conductivity is proportional to the amount of Cl
2 gas exposure. High sensor sensitivity was achieved when tested at temperatures of around 400 °C. However, such a high working temperature limits its use. Debnath et al. [
7] used thin cobalt phthalocyanine films grown on sapphire substrates as a Cl
2 sensor. The response time of 18 s is short; however, the linear sensitivity response of the composition is only within the range between 0.005 and 2 ppm.
The optical spectrum absorption of thin porphyrin Langmuir–Blodget coated films was elaborated by George et al. [
8]. They discovered the absorbance at 460 nm of the light spectrum for the presence of Cl
2 gas. An optical type of Cl
2 gas sensor was discussed by Ansari, Karekar, and Aiyer [
9]. They concluded that the optical guide cladded with RbCl and AgCl exhibits good selective chlorine-gas-sensing abilities. However, complex equipment is required to detect the changes in the optical signal.
Zhang et al. [
10] investigated three-dimensional open porous Tin dioxide (SnO
2) structures for Cl
2 sensing properties. They examined a variety of SnO
2 based structures and achieved up to 5 ppm Cl
2 at 160 °C. They associated the performance with the small grain size of the sensing structure. A similar Cl
2 sensitivity performance was reported by Ma et al. [
11] and Chu and Cheng [
12]. They discussed the performance of Indium-based structures. They achieved sensitivity up to 10 ppm chlorine gas at a low operational temperature (160 °C).
The Indium Oxide (In
2O
3)/SnO
2 heterojunction microstructures as Cl
2-gas-sensing structures were analyzed by Wang et al. [
13]; and Li, Fan, and Cai [
14]. They discovered that the In/Sn = 12:1 (molar ratio) sample exhibited a superior response to the chlorine gas and a short recovery time. Furthermore, the p-type semiconductor (Nickel ferrite) was examined by Yang et al. [
15] and Gopal Reddy, Manorama and Rao [
16]. They discovered that this structure detects the lower concentration of Cl
2 (10 ppm).
Based on the literature review, the current findings provided a reason for developing a compact and integrated Cl2 gas sensor with a heating element and primary user interface. This work introduces a small and low-weight chlorine gas sensing system for possible use in commercial applications. The procedure of designing a lightweight substrate heater for the gas sensing material is described in this paper. The size and simplicity of the target system with a simple self-regulating heating function were chosen for integration with the sensor.
The literature review provided a selection of suitable sensitive materials that can detect Cl2 gas in the 1–200 ppm concentration range. The materials, Indium–Tin heterojunction (In-Sn HN), Indium Oxide nanosheets (In2O3 NS), and Nickel Oxide nanoparticles (NiO NP), with operating temperature ranges between 160 and 260 °C, were chosen for further examination. The Ag-based heater with the Ag-based feedback resistor was used to set and control the sensor’s temperature as the novelty in this work. Rare metals, such as Au, Pt, etc., were used in such applications. This paper focuses on designing and assembling the Cl2 gas sensor with a heating element. A resistive feedback component embedded into the ceramic was used to balance the sensor’s working temperature at the required level.
2. Sensor Fabrication and Characterization
Each active material requires a heater substrate to perform its sensing operation. Therefore, the green sheets of a Low-Temperature Cofired Ceramic (LTCC) substrate (Ferro Taiwan) were used to manufacture the chlorine gas-sensor prototypes. The fabrication process was completed as follows: shape design, the formation of blank ceramic layers, screen-printing of silver paste, ultraviolet (UV)-laser etching of prototype designs and internal cutout processes, alignment, hard lamination, and, lastly, the external cutout process and firing of ceramic devices. The fabrication process is illustrated in the flowchart in
Figure 1.
The main heating element (
Figure 2) was designed within the middle of the transducer’s inner section, using a meandering design with 50 µm track/gap features. The substrate heater was designed on a 4 × 4 mm area. The outer section comprises a 500 µm–thick frame for electrode track placement. The rest sections between the frame and inner section were physically cut out for thermal isolation and weight reduction. The design was performed by using CAD software (
Figure 2). The main heating element was designed within the middle of the transducer’s inner section, using a meandering design and 50 µm track/gap features.
The prototype ceramic layers were formed from four 80 µm–thick green sheets (Ferro Taiwan). A mesh-screen printing mask with 200 mesh and the desired pattern was used to print a 15 µm–thick film. A blank screen was used to spread silver (Ag) paste (“Ag conductive paste”, Ferro Taiwan) across the ceramic layer. The device pattern was then etched away using a UV laser engraver (15 W 405 nm pulsed laser, DCT, made in Germany). The internal cutouts for the ceramic layer were also made by using the UV laser engraver with the power setting to 60% at 120 kHz.
The ceramic layers were manually aligned for multi-structure devices based on visually matching the multilayer fiducial. Each layer was taped onto an aluminum backing plate with masking tape to affix its position. Next, hard lamination of the multilayer ceramic device was performed with the iso-static laminator across a two-stage process. The first stage of the process is a soft lamination step, using the following settings: 65 °C, 44.82 bar for 5 min. The second stage maintains the temperature (65 °C) but increases the pressure to 68.94 bar for another 5 min. After the hard lamination process, the unfired ceramic devices were cut out using a long ceramic edge cutting machine (Ceramic Cutter CT08003, Pacific Trans Company, Los Angeles, CA, USA). The final step in fabricating the LTCC ceramic device is to “fire” the devices in a high-temperature furnace. The firing process for the LTCC consists of a 6-step heating cycle that is visualized in
Figure 3: (i) ramp up to 540 °C at a rate of 2 °C/min, (ii) dwell at 540 °C for 4 h, (iii) ramp up to 900 °C at a rate of 5 °C/min, (iv) dwell at 900 °C for 1 h, (v) ramp down to 800 °C at a rate of 3 °C/min, and then (vi) deactivate heating coils/element and cool naturally within furnace or oven for 14 h.
Using a firing temperature of 900 °C, several devices were fabricated with fully functioning substrate heaters and temperature sense layers (
Figure 4). Any successfully fired ceramic device turned a deep green color and shrunk by 18 ± 2% from its original size in line with the manufacturer’s specification. That was taken care of at the CAD design level by increasing the dimensions of the printed layers by 18%.
The next stage is to develop the chlorine gas–sensitive nanomaterials to be placed onto the sensor substrate area (
Figure 2). The sensor was then electrically characterized in air and under varied chlorine gas concentration conditions.
4. Fabrication of Temperature Control System
The functioning prototype aims for good thermal performance, high heating speed, and thermal insulation from the controlling circuitry.
4.1. Concept of Using Two Printed (Embedded into Ceramic) Resistors Design
In contrast to most ceramic sensor platforms, this novel design uses the sintered Ag silver paste for the heating and temperature-sensing elements [
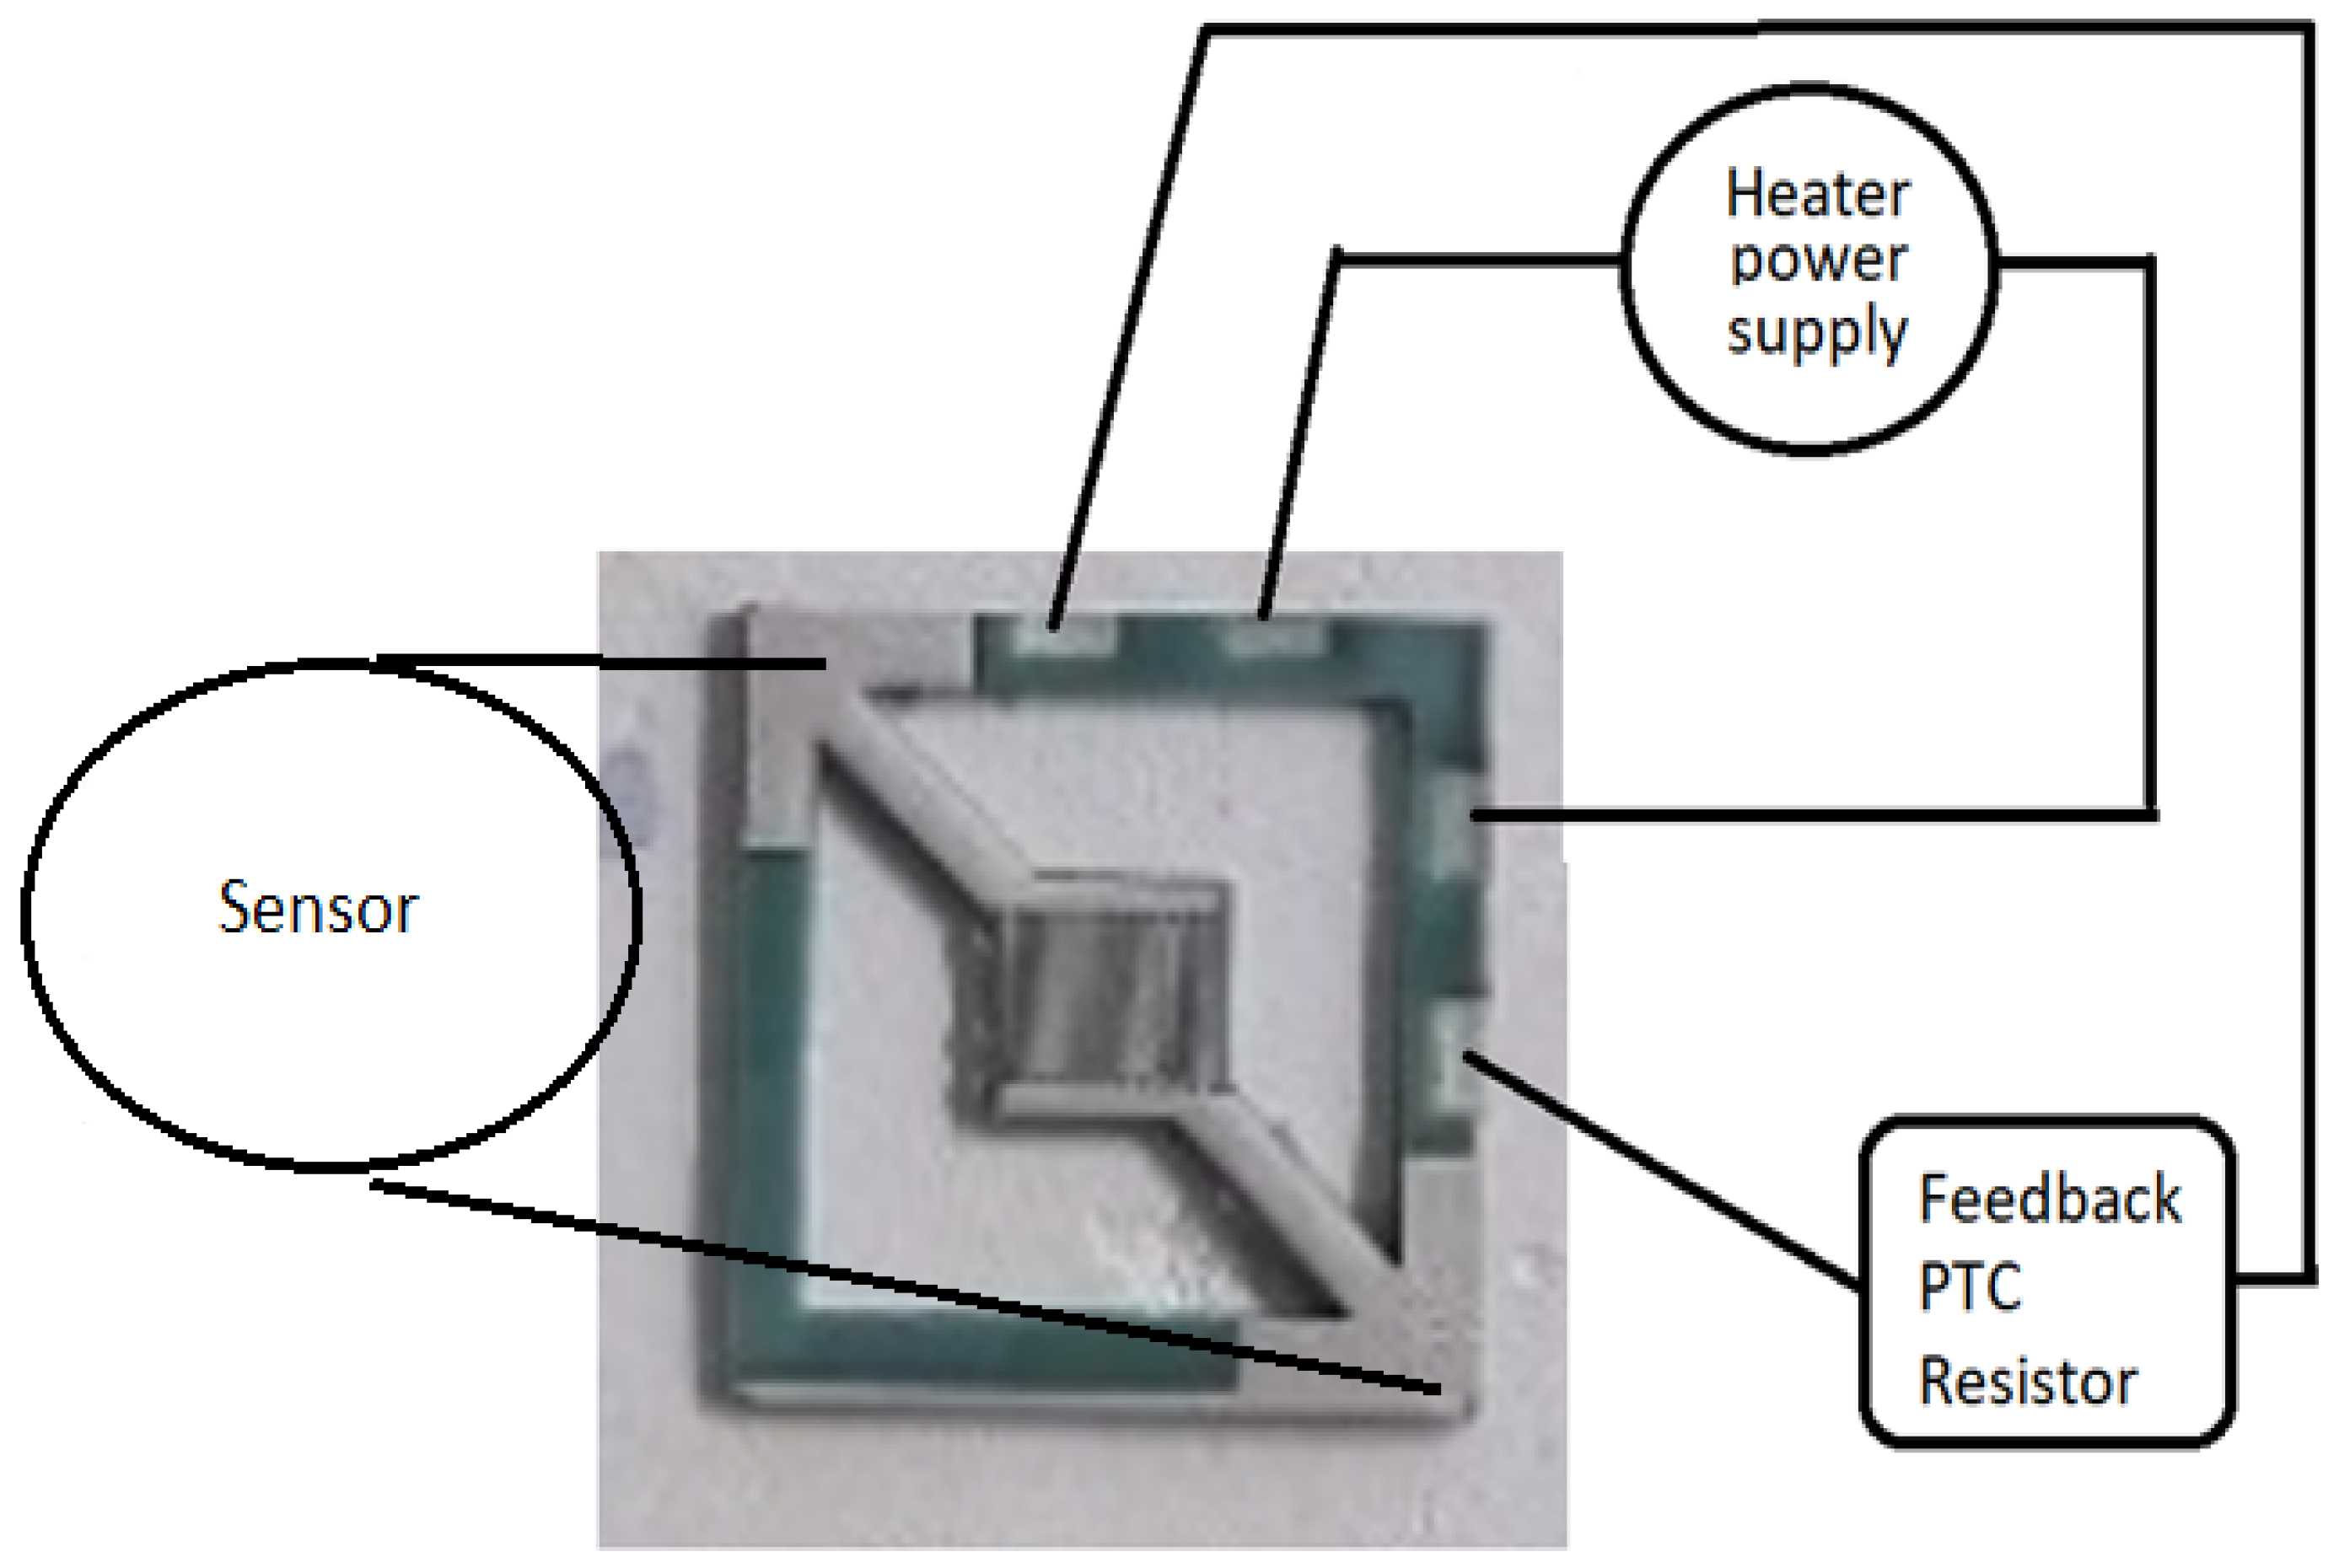
19]. The two-element design involves one resistor laser etched on an additional layer of the ceramic under the sensor as the heating element and another resistor laser etched at the bottom of the assembly as the Positive Temperature Coefficient (PTC) resistor, which provides feedback to the electronic control unit (
Figure 5). The resistance changes were used to supply power to the heater efficiently.
The set of tests conducted used a purposefully built rig containing a Fluke 87 five-digit multimeter measurement of resistance (Rfb) of the temperature sense layer (also referred to as the “feedback resistance”), a Fluke 117 four-digit multimeter for voltage and current measurements, and an HP6235 power supply. Infrared (IR) emission measurement was conducted using a Testo portable InfraRed camera and analyzed by IRsoft by TESTO. Five samples were tested for temperature versus supplied power changes.
4.2. Temperature Control System
A simple temperature-control circuit was embedded in a ceramic PTC resistor. Low-resistance measurement techniques were adopted, including (i) the Voltmeter–Ammeter Method, and (ii) Kelvin’s Double-Bridge Method. A temperature control system used the instrumentation amplifier INA155 (Texas Instruments) and a modified resistor bridge. The feedback-controlled heater is shown in
Figure 6.
The substrate heater is supplied directly from the “Power In” VCC through the power driver Q1 (FDN304). Initially, the maximum power was provided to the heater to speed up the heating of the surface under the sensor. However, the sensor’s temperature changes influence the feedback resistor (Rfb) resistance value. That drives the bridge R1, R2, R3, and R4+R5 out of balance. The differential signal is fed into the INA 155, a high-precision Instrumentation Amplifier that produces voltage levels at the output (6) of the INA155 circuit. The output is fed into input (6) of the comparator LM393 (Texas Instruments). The comparator compares the incoming signal level with the reference voltage corresponding to the designated temperature under the Cl2 sensor. The output circuit of the comparator switches the heater off if the sensor’s temperature exceeds the set level or switches it on when the temperature is too low. Using positive-feedback resistor input and output of the comparator, the hysteresis is established to avoid the jitter of the switching signal, as it may produce electrical interference with other parts of the circuitry. Once manufactured and tested, the polyurethane lacquer protected the circuit against a corrosive environment.
The Cl2 sensor is set up in a bridge configuration. The circuitry uses INA155 to amplify the signal generated by the unbalanced bridge and feed these changes into the analogue-to-digital converter ADS1112 (Texas Instruments). Any microprocessor can process the digital signal with the I2C serial interface.
5. Results and Discussion
The power supplied to the heater is consistent, and it does not significantly vary with the resistance of the heater for all valid devices. The Cl
2 sensing area (4 mm × 4 mm) has unchanged dimensions for the above experiments. The gradient shift in power supplied to the heater shown in
Figure 7a (Device 1, Heater 6.1 Ω) may be explained by the changes in the thickness of the ceramic.
Changes in the value of the feedback resistor (R
fb) are consistent with the sensor’s surface temperature changes (
Figure 7b). Therefore, the R
fb is well suited as the PTC thermal sensor for controlling the Cl
2 sensor’s surface temperature. The relationship between power and the feedback resistor is explained by the physical differences in the thickness of the heater and feedback resistor’s tracks caused by the imperfections of the screen-printing process.
The feedback-controlled heater with the connected sensor weighs 7 g and allows for deployment in portable or deployable systems. The sensor’s temperature was set to 240 °C, and the circuit depicted in
Figure 6 was tested under these conditions. In addition, the IR emission was measured across the sensor’s area, and the results are depicted in
Figure 8.
The temperature shows consistency across the sensing area, with a maximum change of 28 °C between the far edge and the middle part of the sensor. The circuit allows the substrate temperature to be set up to 320 °C. The thermal isolation between the inner sensing area from the external frame was achieved by cutting out the section between the frame and the sensing area.
The prototype samples were loaded into the Linkam stage (
Figure 9). The 10 ppm Cl
2 gas standard and precision multimeter were connected to the testing rig to assess the sensor’s sensitivity and time responsiveness. The heater was set to 260 °C.
As part of the test setup, a data logging unit was connected to the multimeter to record resistance changes associated with the presence of Cl2 gas. The data logging section consists of a custom NI LabVIEW data logging script that logs resistance measured by the multimeter every second. The sensor under test (SUT) was evaluated via the following processes:
- i.
Establishing initial conditions for sensor measurement—The SUT was first exposed to compressed dry air (CA) at a flow rate of 100 SCCM until the temperature of the SUT reached 260 °C.
- ii.
Recording the sensor’s baseline (or reference)—At a temperature of 260 °C, the SUT’s baseline resistance was established by flowing CA at 100 SCCM for around 20 min.
- iii.
Measuring the sensor’s change in response to a toxic gas vapor—The CA was stopped, and 100 SCCM of test gas (10 ppm Cl2 in N2 bal) was applied for 10 min.
This procedure was repeated for In-Sn HN, In
2O
3 NS, and NiO NP. The test results are shown in
Figure 10,
Figure 11 and
Figure 12, where the right-pointing arrow indicates the moment from which the 10 ppm of Cl
2 gas was applied.
The three graphs feature a SUT’s baseline resistance between 0 and 1367 s. That was established by flowing CA at 100 SCCM for more than 20 min. After this, the CA was stopped, and 100 SCCM, the 10 ppm Cl2 gas standard, was introduced to the SUT.
The total resistive change between the baseline and steady state was calculated to evaluate the sensor’s sensitivity. If the sensor did not reach a steady state within the 10 min period, the last data point of the set was used to calculate the sensitivity. The response time measurement was observed via the time taken to reach 90% of the SUT’s steady-state response (or the last data point measured if no steady-state output was reached). The results are shown in
Table 1.
Only one of three tested gas-sensitive materials performed with reasonably responsiveness and sensitivity to 10 ppm Cl
2 gas content. The In
2O
3 NS achieved stability within 142 s, with a resistance value between 103 and 271 Ω. The circuit with a bridge configuration and analogue-to-digital conversion described in
Figure 6 can be used to convert changes in Cl
2 gas concentration to the digital signal for further processing.


