
Cardiovascular Disease Diagnosis from DXA Scan and Retinal Images Using Deep Learning

 , ,
, ,  and
and 
Abstract
:1. Introduction
- We proposed a novel technique that uses retinal images to distinguish CVD group from the control group with over 75% accuracy. To the best of our knowledge, this is a seminal work in CVD diagnosis from retinal images.
- We conducted extensive experiments on DXA scan data and showed that it has reasonable discriminating ability to separate CVD group from the control group yielding over 77% accuracy in the Qatari population.
- We proposed a superior multi-modal approach for CVD diagnosis that fuses both tabular (DXA) and image data (retinal images) to distinguish CVD from the control group with an accuracy of 78.3%. Hence, our study proposes a fast and relatively non-invasive approach to diagnose patients with CVD.
2. Related Work
2.1. Retinal Fundus Images

| Reference | Year | Dataset | Cohort | ML/DL Results | Findings |
|---|---|---|---|---|---|
| Retinal Images Data | |||||
| [37] | 2016 | Retina Images | Images of 79 CVD and 150 Non-CVD patients in Hong Kong | AUC: Model 1 (0.692) Model 2 (0.661) Model 3 (0.775) | The paper evaluated three stepwise logistic regression models to investigate CVD association to retinal information and whether the association is independent from having type 2 diabetes. The findings reveal that information obtained from the retina is independently linked to CVD in type 2 diabetic patients. |
| [29] | 2020 | Retina Images | >70,000 images (Collection from 15 datasets from multiple countries and ethnicities) | N/A | The paper developed a DL system to assess retinal vessel caliber (which measure microvascular structure changes which are correlated with CVD risk factors. Outcome of the DL system was compared with human graders. Later a comparison with associated risk factors was carried out. In addition, DL system was able to predict CVD risk factors better than or comparable to human graders. |
| [26] | 2020 | Retina Images | Retina images of 625 patients from China | Accuracy of 78.7% for hyperglycemia detection, 68.8% for hypertension detection and 66.7% for dyslipidemia detection | The study aimed at predicting hypertension, hyperglycemia, and dyslipidemia, and other CVD risk factors from retinal images. Transfer learning utilized for model development and obtained a good result. |
| [38] | 2020 | Retina Images | 12,000 images from QBB | AUC (sex): 0.97; MAE (age): 2.78 years; MEA (SBP): 8.96 mmHg; MAE (DBP): 6.84 mmHg; MAE (Hb1Ac): 0.61%; MAE (relative mass): 5.68 units); MAE (testosterone): 3.76 nmol/L | The paper investigated the possibility of fundus images in predicting cardiometabolic risk factors such as age, gender, smoking habit, blood pressure, lipid profile, and bioimpedance using DL |
| [39] | 2020 | Retina Images | Images of 2333 participants from QBB | N/A | The study investigated association between cardiometabolic risk factors and mono- and multifractal retinal vessel using retinal images. Fractal metrics were calculated, and then linear regression analysis was carried out. One or more fractals are linked to sex, age, BMI, SBP, DBP, glucose, insulin, HbA1c, albumin, and LDL, according to the findings. |
| DXA Data | |||||
| [40] | 2012 | DXA Data | 409 participants | N/A | The study aims at comparing BMI with direct measure of fat and lean mass to predict CVD and diabetes among buffalo police officers in New York, US. Findings shows a strong correlation of multiple DXA indices of obesity showed with cardiovascular disease. |
| [41] | 2014 | DXA Data | 616 ambulatory patients who were not pregnant women, or had self-reported cardiac failure, had cardiac-pacemaker or undergone limb amputation. | N/A | The researchers looked at how body composition factors affect BMI and if they may be used as markers for metabolic and cardiovascular health in Switzerland. The researchers observed that fat mass and muscle mass were important nutritional status markers, and they broadened their investigation to look at the impact on health outcomes for all BMI categories. The authors also underlined the need of evaluating body composition during medical examinations to predict metabolic and cardiovascular diseases. |
| [42] | 2016 | DXA Data | 117 patients with heart failure with preserved ejection fraction | N/A | The study that was conducted on patients from Germany, England and Slovenia aimed to find out how sarcopenia in individuals with heart failure with preserved ejection fraction is related to exercise ability and muscle strength as well as quality of life. It was found that heart failure has a detrimental effect on appendicular skeletal muscle mass, |
| [43] | 2020 | DXA Data | 570 patients with and without heart failure | N/A | The goal of the study was to see how aging and heart failure treatments affected bone mineral density. Heart failure was observed to be linked to a greater BMD prevalence of osteoporosis. Heart failure exacerbates the loss of mineral bone density that comes with aging. |
| [44] | 2020 | Anthropometric & DXA Data | 558 participants who were not diagnosed with diabetes, hypertension, dyslipidemia or CVD. | N/A | The study, which was based on Qatari population from QBB, aimed at comparing Anthropometric & DXA Data in predicting cardio-metabolic risk factors. randomly healthy participants were selected. The study revealed a more in-depth relationship between DXA-based assessment of adiposity as a cardio metabolic risk predictor in Qatar compared to anthropometric markers. |
| [45] | 2020 | Demographic, Cardio-metabolic and DXA Data | 2802 participants from QBB | N/A | The goal of the study was to find the body fat composition cut-off values to predict metabolic risk in the Qatari population. For Qatari adults of various ages and genders, the study developed cut-off values for body fat measurements that may be used as a reference for assessing obesity-related metabolic risks. According to the findings, there is a substantial link between body fatness and the likelihood of developing metabolic illnesses. |
2.2. Dual-Energy X-ray Absorptiometry (DXA)
2.3. Multi-Modal Approaches
| Ref. | Year | Country | Fused Data | Results | Summary |
|---|---|---|---|---|---|
| [50] | 2019 | USA | Electronic Health Record (EHR) and Genetic data | AUROC: 0.790 AUPRC 0.285 | The study used a 10-year data from HER and genetic data to predict CVD events using random forest, gradient boosting trees, logistic regression, CNN and long short-term memory (LSTM). Chi-squared was used for feature selection on the EMR data. Results show an improved prediction of CVD with AUROC of 0.790 compared to EMR alone (AUC of 0.71) or genetic alone (AUC of 0.698) |
| [51] | 2020 | China | Electrocardiogram (ECG), Phonocardiogram (PCG), Holter monitoring, Echocardiography (ECHO), and biomarker levels (BIO) | Accuracy: 96.67 Sensitivity: 96.67 Specificity: 96.67 F1-score: 96.64 | The study aimed at the detection of coronary artery disease (CAD). Data from ECG and PCG of 62 patients were used. Furthermore, data were also collected from Holter monitoring, ECHO and BIO. Feature selection was applied to attain optimum features and support vector machine was used for classification. Results show best performance when feature were fused from all sources. |
| [52] | 2020 | USA | Sensors (collect blood pressure, oxygen, respiration rate, etc.) and Medical records (history, lab test, etc.) | Results after feature weighting method: Accuracy: 98.5 Recall: 96.4 Precision: 98.2 F1-score: 97.2 RMSE: 0.21 MAE: 0.12 | The study aimed at predicting heart diseases (such as heart attack or stroke) using data gathered from sensors and medical records. Features such as age, height, BMI, respiration rate, and blood pressure were extracted, and then data from both sources were fused. Furthermore, conditional probability is utilized for feature weighting to help in accuracy improvement. An ensemble deep learning is then used for the prediction of heart disease. |
| [53] | 2021 | Greece | Myocardial Perfusion Imaging (MPI) and Clinical data | Accuracy: 78.44 Sensitivity: 77.36 Specificity: 79.25 F1-score: 75.50 AUC: 79.26 | The study aimed at cardiovascular disease diagnosis using MPI and Clinical data. Polar maps were derived from the MPI data and fused with clinical data of 566 patients. Random forest, neural network, and deep learning with Inception V3 were used for classification. Results show a hybrid model of Inception V3 with random forest achieved an accuracy of 78.44% compared to an accuracy of 79.15% achieved by medical experts. |
| [54] | 2021 | USA | Electronic medical records (EMR) and Abdominopelvic CT imaging | AUROC: 0.86 AUCPR: 0.70 | The study aimed at developing a risk assessment model of ischemic heart disease (IHD) using combined information from patientsí EMR and features extracted from abdominopelvic CT imaging. In this study, CNN used to extract features from images and XGBoost was used as the learning algorithm. Results show an improved prediction performance with AUROC of 0.86 and AUCPR of 0.70 |
| [55] | 2021 | USA | Genetic, clinical, Demographic, imaging, and lifestyle. | - | The study aimed at evaluating the ability of machine learning in detecting CAD subgroups using multimodal data. The multimodal data consisted of genetic, clinical, demographic, imaging, and lifestyle data. K-means clustering as well as Generalized low rank Modeling were utilized. Results show that 4 subgroups were uniquely identified. |
3. Materials and Methods
3.1. Ethical Approval
3.2. Data Collection from QBB
3.3. DXA Scan Data Preprocessing
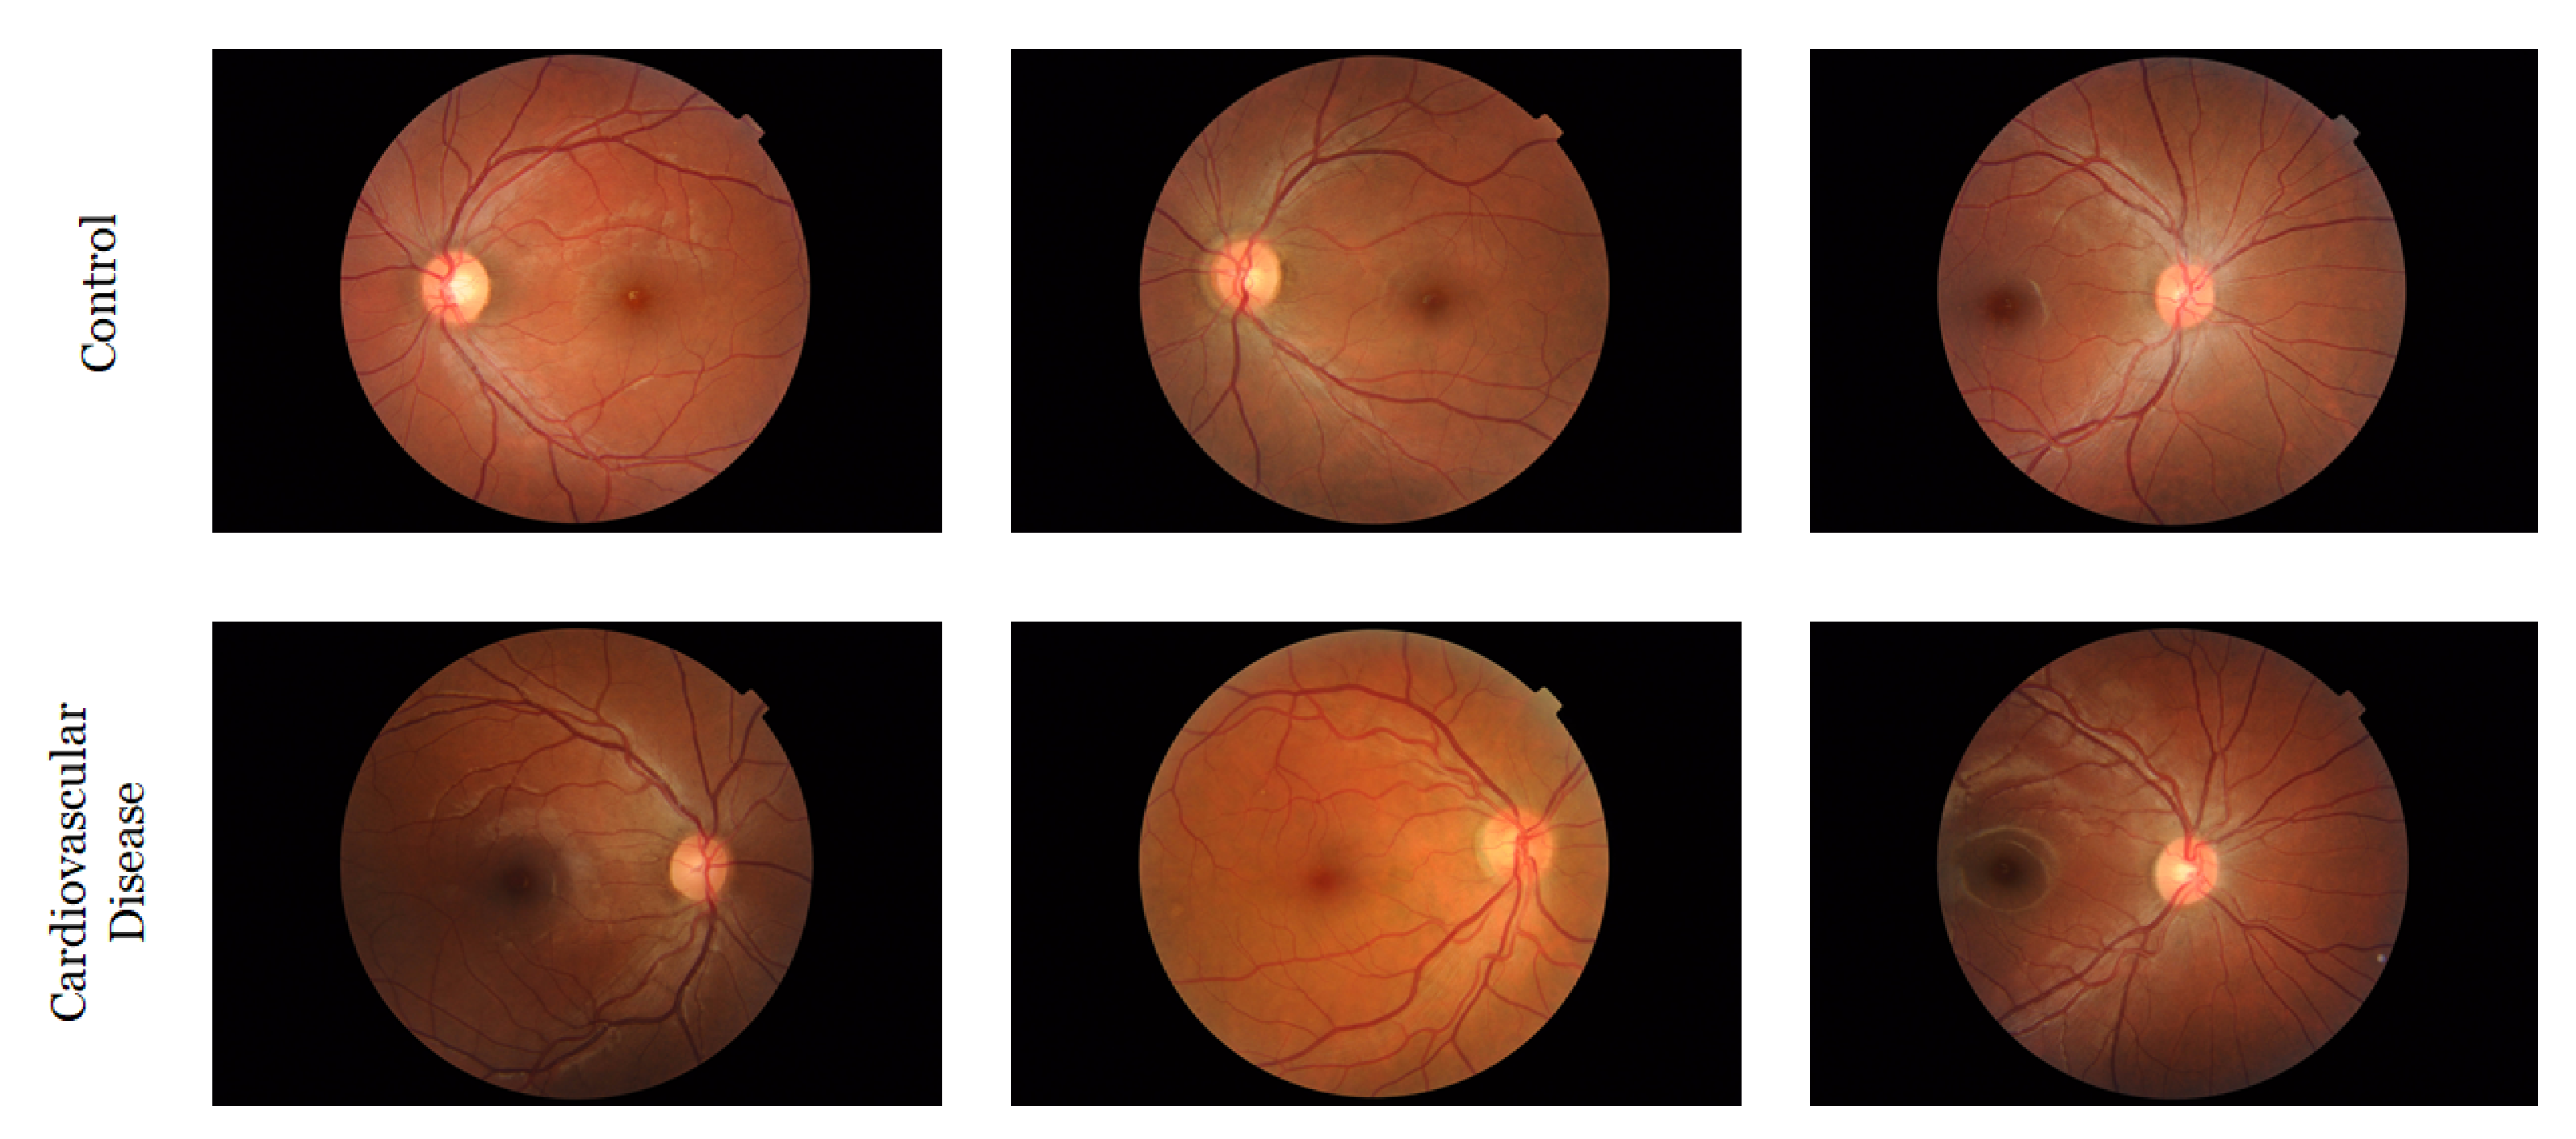
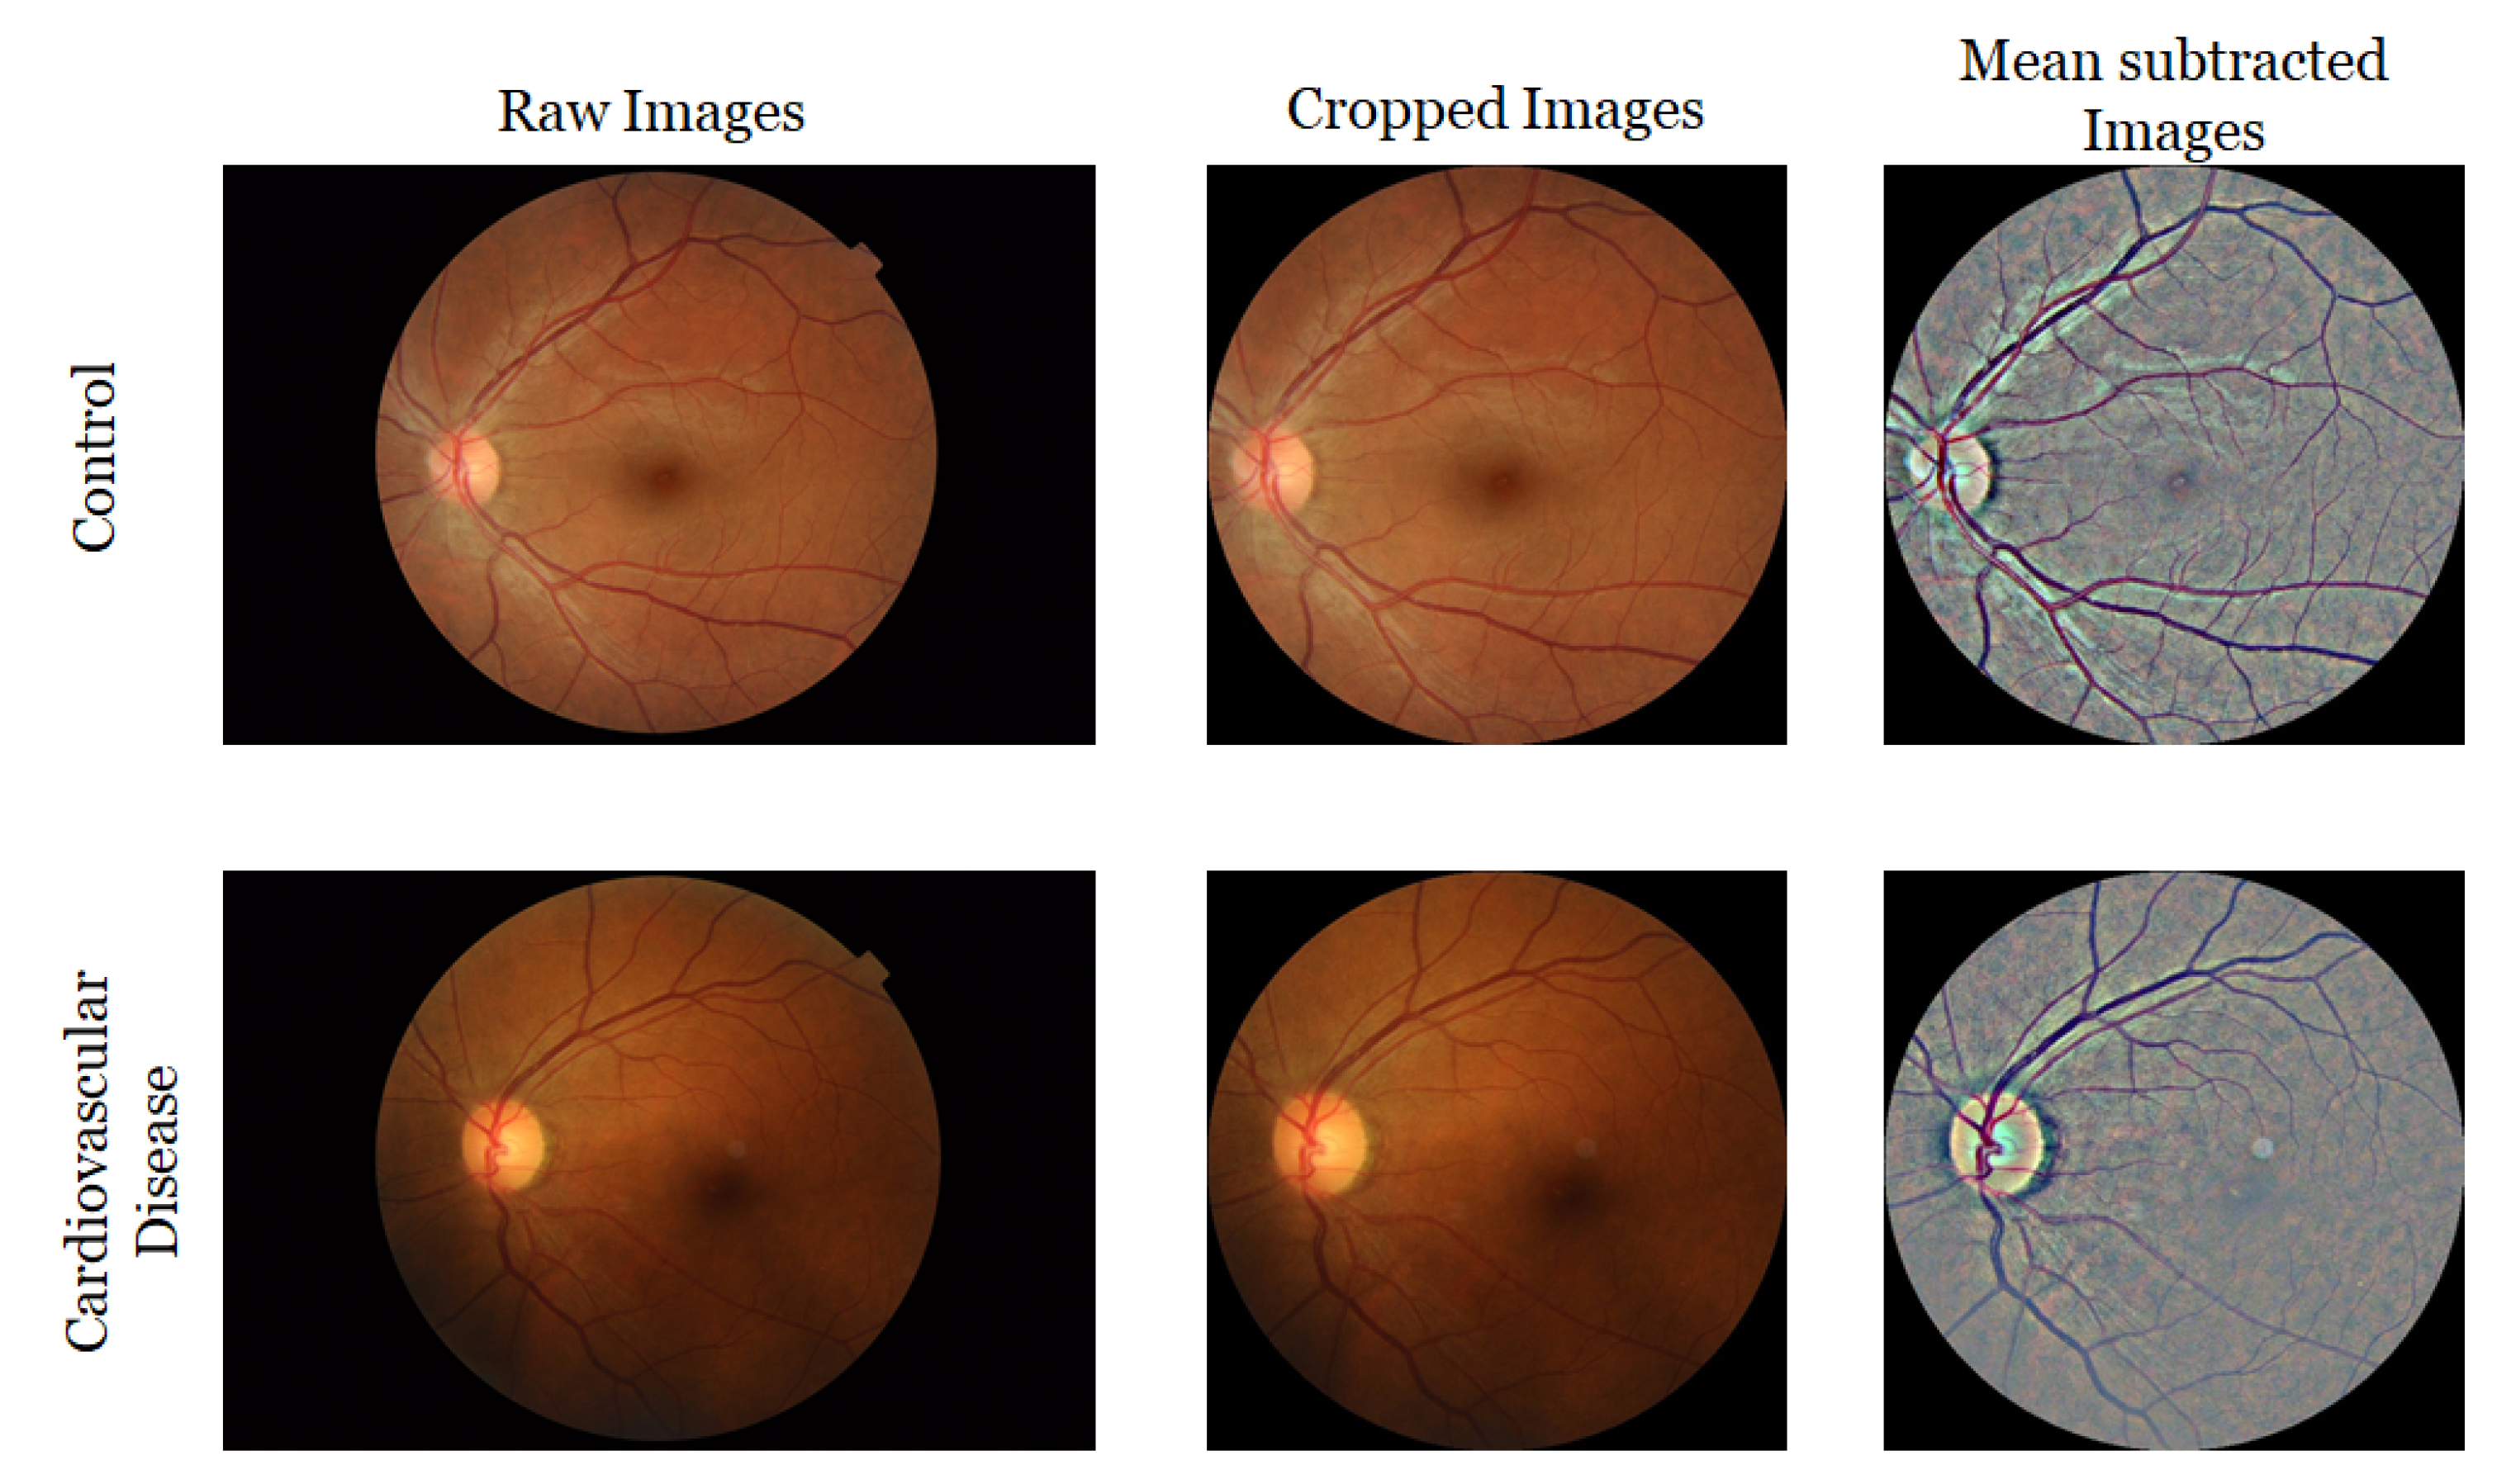
3.4. Retinal Image Collection and Preprocessing
4. Experiment Setup
4.1. DXA Model
4.2. Retinal Image Model
4.3. Hybrid Model
4.4. Performance Evaluation Metrics
5. Results
5.1. Experimental Results from the Machine Learning Models
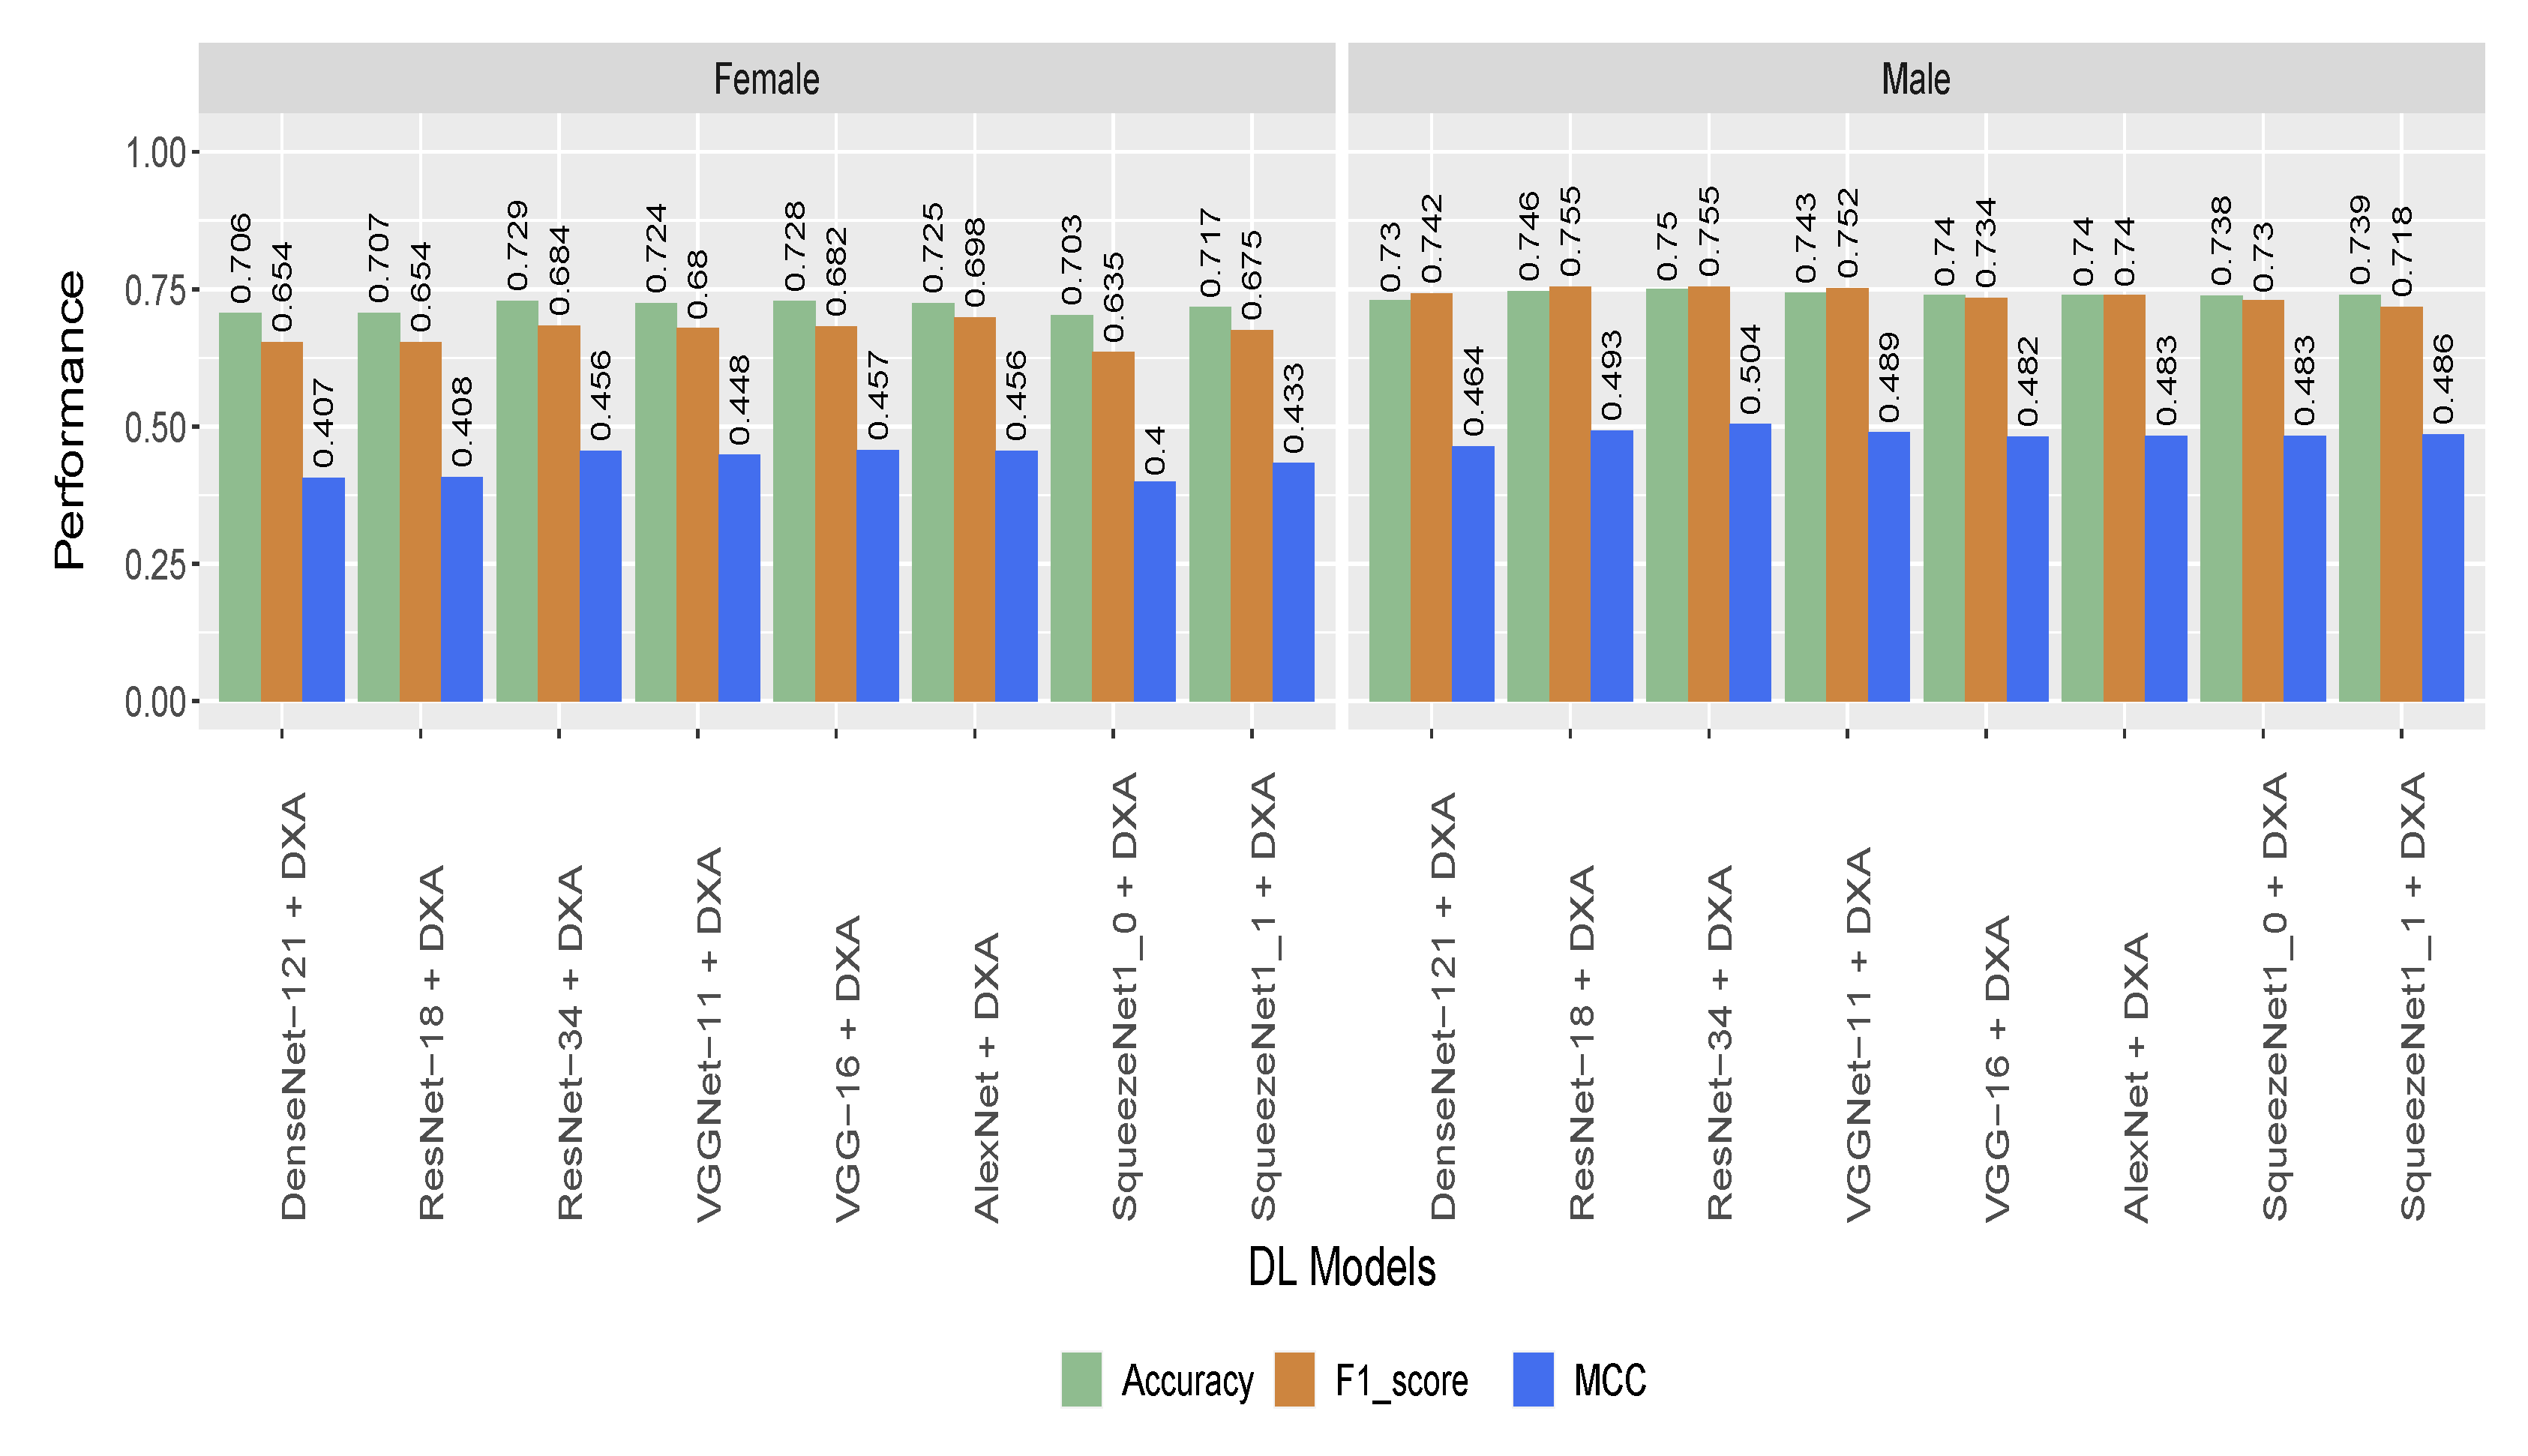
5.2. Performance of the Hybrid Model Based on Gender and Age Stratified Dataset
5.3. Statistical Analysis on DXA Data
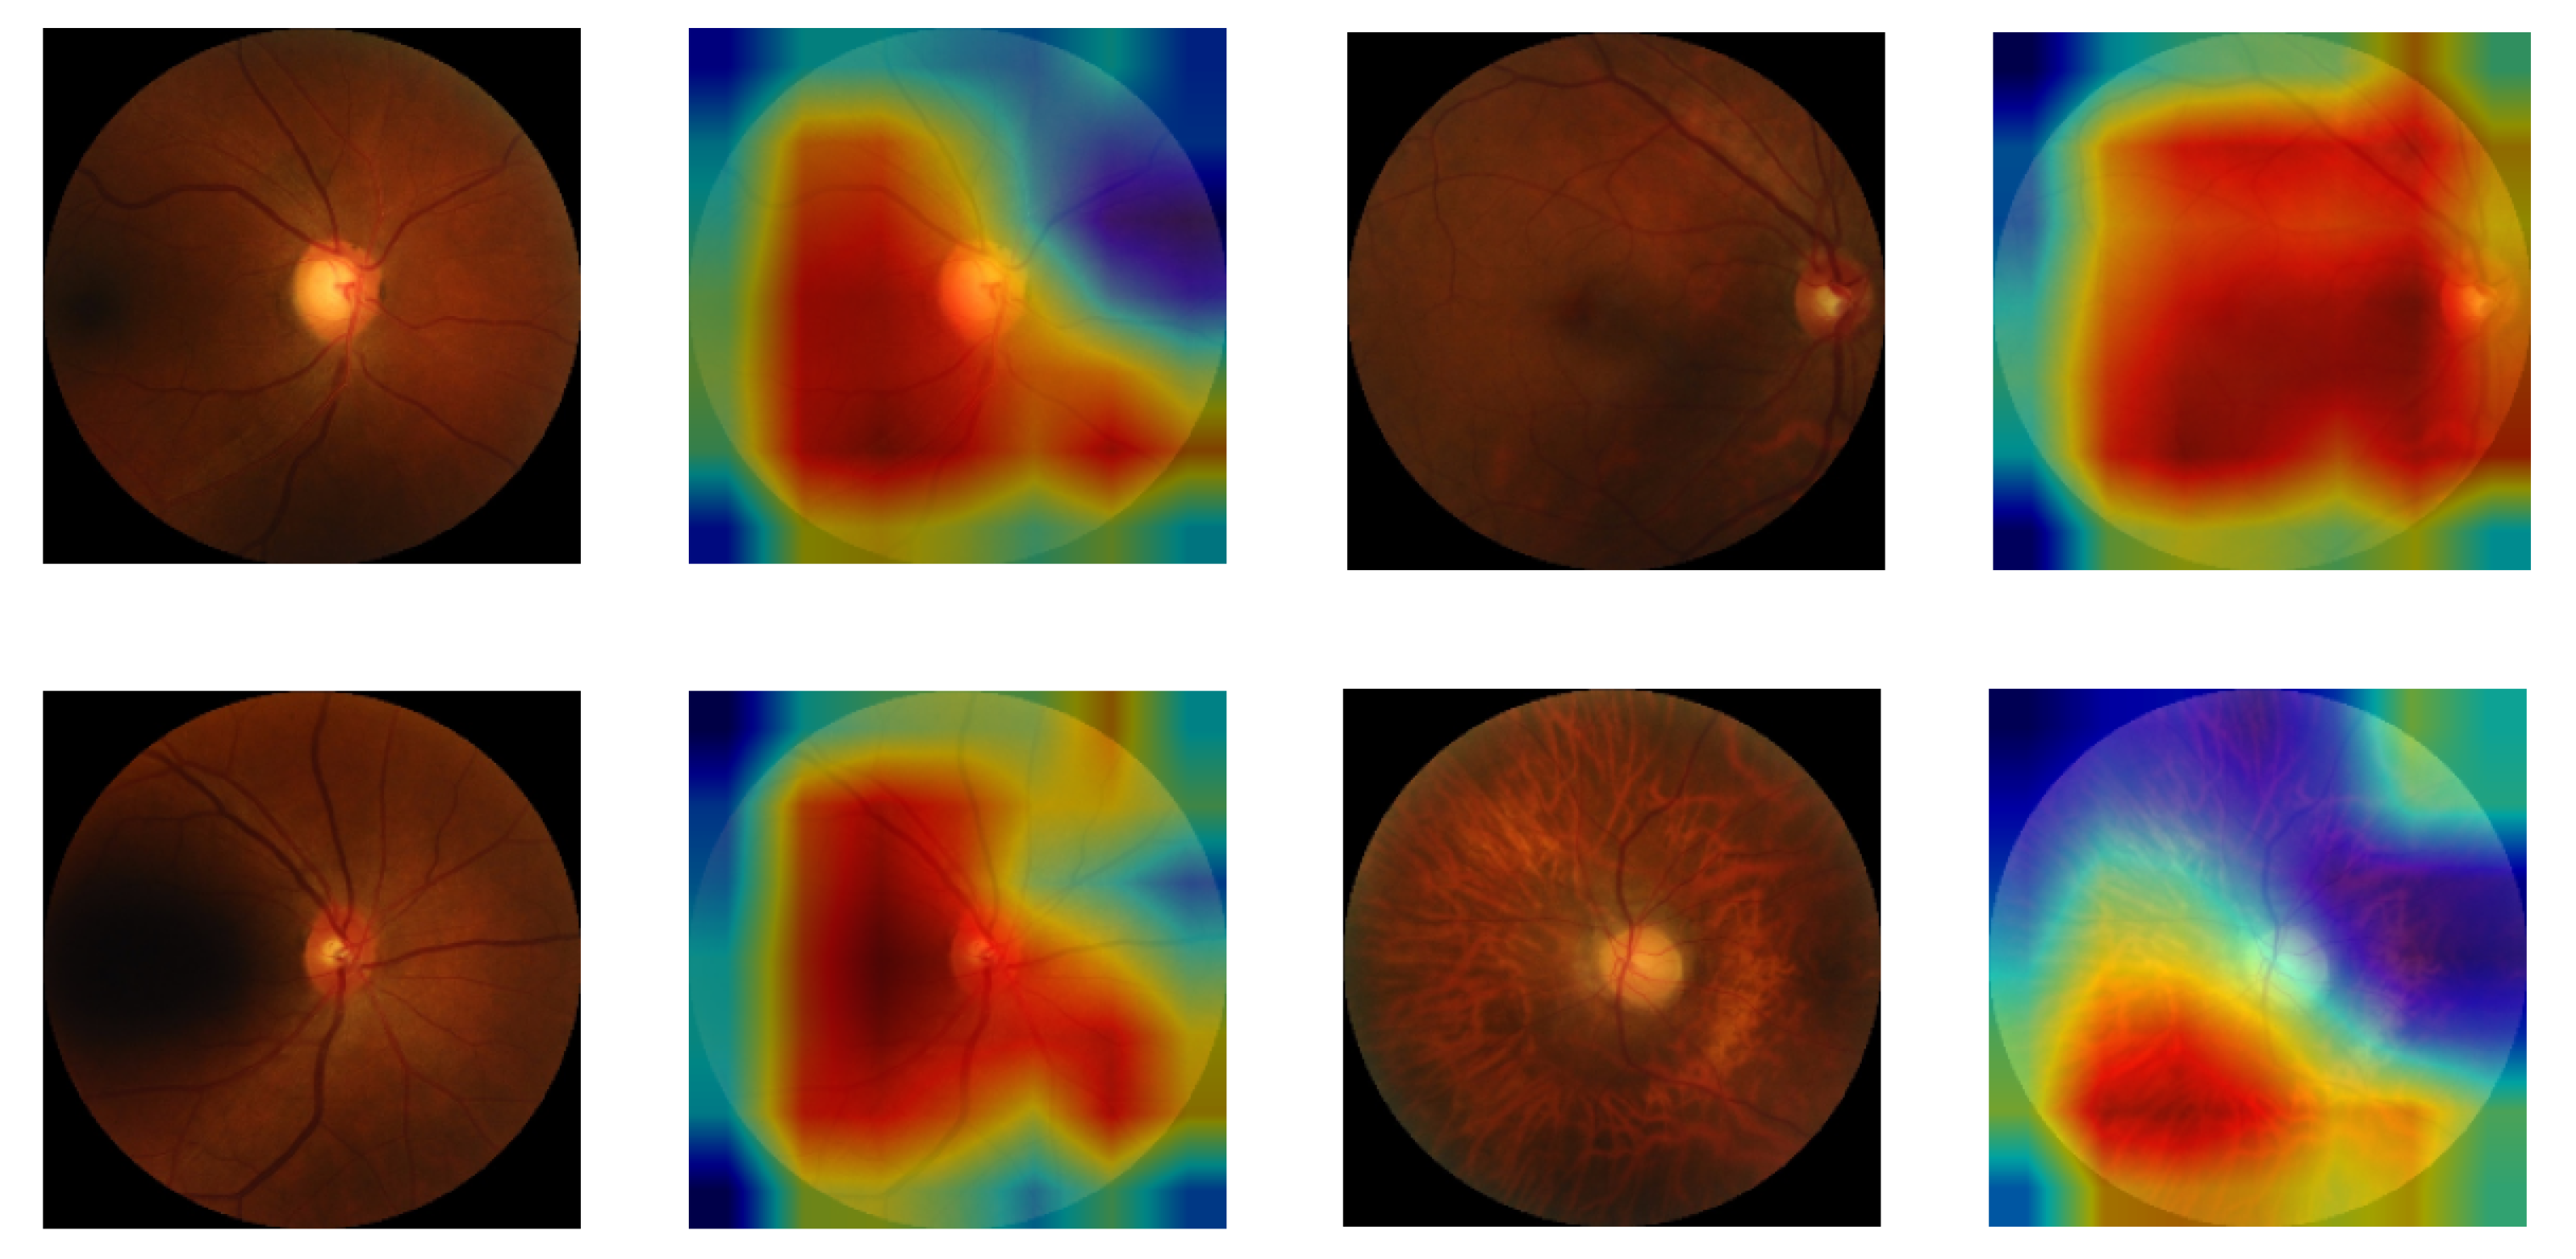
5.4. Class Activation Map for Highlighting the Region of Interest in CVD Patients
6. Discussion
6.1. Principal Findings
6.2. Comparison against Other Tools
6.3. Motivation for Using a Multi-Modal Approach
7. Limitations
8. Conclusions
Supplementary Materials
Author Contributions
Funding
Institutional Review Board Statement
Informed Consent Statement
Data Availability Statement
Acknowledgments
Conflicts of Interest
Abbreviations
| ASCVD | Atherosclerotic Cardiovascular Disease |
| AUC | Area Under the Curve |
| BMI | Body Mass Index |
| BMD | Bone Mineral Density |
| CCTA | Coronary CT Angiography |
| CT | Computed Tomography |
| CVD | Cardiovascular disease |
| DL | Deep Learning |
| DXA | Dual-energy X-ray Absorptiometry |
| ECG | Electrocardiogram |
| ECHO | Echocardiography |
| ML | Machine Learning |
| MPI | Myocardial Perfusion Imaging |
| MRI | Magnetic Resonance Imaging |
| PCG | Phonocardiogram |
| ROC | Receiver Operating Characteristics |
| WHO | World Health Organization |
| WHR | Waist-to-hip Ratio |
References
- Roth, G.A.; Mensah, G.A.; Johnson, C.O.; Addolorato, G.; Ammirati, E.; Baddour, L.M.; Barengo, N.C.; Beaton, A.Z.; Benjamin, E.J.; Benziger, C.P.; et al. Global burden of cardiovascular diseases and risk factors, 1990–2019: Update from the GBD 2019 study. J. Am. Coll. Cardiol. 2020, 76, 2982–3021. [Google Scholar] [CrossRef] [PubMed]
- World Health Organization. Cardiovascular Diseases (CVDs); World Health Organization: Geneva, Switzerland, 2021. [Google Scholar]
- Long, C.P.; Chan, A.X.; Bakhoum, C.Y.; Toomey, C.B.; Madala, S.; Garg, A.K.; Freeman, W.R.; Goldbaum, M.H.; DeMaria, A.N.; Bakhoum, M.F. Prevalence of subclinical retinal ischemia in patients with cardiovascular disease—A hypothesis driven study. EClinicalMedicine 2021, 33, 100775. [Google Scholar] [CrossRef]
- WHO-EMRO. Cardiovascular Diseases; World Health Organization, Regional Office for the Eastern Mediterranean: Cairo, Egypt, 2021. [Google Scholar]
- Planning and Statistics Authority (Qatar). Births & Deaths in the State of Qatar (Review & Analysis). Report 2018. Available online: https://www.psa.gov.qa/en/statistics/Statistical%20Releases/General/StatisticalAbstract/2018/Birth_death_2018_EN.pdf (accessed on 18 September 2021).
- Ghantous, C.M.; Kamareddine, L.; Farhat, R.; Zouein, F.A.; Mondello, S.; Kobeissy, F.; Zeidan, A. Advances in cardiovascular biomarker discovery. Biomedicines 2020, 8, 552. [Google Scholar] [CrossRef] [PubMed]
- Al-Absi, H.R.; Refaee, M.A.; Rehman, A.U.; Islam, M.T.; Belhaouari, S.B.; Alam, T. Risk Factors and Comorbidities Associated to Cardiovascular Disease in Qatar: A Machine Learning Based Case-Control Study. IEEE Access 2021, 9, 29929–29941. [Google Scholar] [CrossRef]
- Rehman, A.U.; Alam, T.; Belhaouari, S.B. Investigating Potential Risk Factors for Cardiovascular Diseases in Adult Qatari Population. In Proceedings of the 2020 IEEE International Conference on Informatics, IoT, and Enabling Technologies (ICIoT), Doha, Qatar, 2–5 February 2020; pp. 267–270. [Google Scholar]
- Wilson, P.W.; D’Agostino, R.B.; Levy, D.; Belanger, A.M.; Silbershatz, H.; Kannel, W.B. Prediction of coronary heart disease using risk factor categories. Circulation 1998, 97, 1837–1847. [Google Scholar] [CrossRef] [Green Version]
- American College of Cardiology. ASCVD Risk Estimator; American College of Cardiology: Washington, DC, USA, 2022; Available online: https://tools.acc.org/ascvd-risk-estimator-plus/ (accessed on 18 September 2021).
- Xu, C.; Xu, L.; Gao, Z.; Zhao, S.; Zhang, H.; Zhang, Y.; Du, X.; Zhao, S.; Ghista, D.; Liu, H.; et al. Direct delineation of myocardial infarction without contrast agents using a joint motion feature learning architecture. Med. Image Anal. 2018, 50, 82–94. [Google Scholar] [CrossRef]
- Sudarshan, V.K.; Acharya, U.R.; Ng, E.; San Tan, R.; Chou, S.M.; Ghista, D.N. An integrated index for automated detection of infarcted myocardium from cross-sectional echocardiograms using texton-based features (Part 1). Comput. Biol. Med. 2016, 71, 231–240. [Google Scholar] [CrossRef]
- Madani, A.; Ong, J.R.; Tibrewal, A.; Mofrad, M.R. Deep echocardiography: Data-efficient supervised and semi-supervised deep learning towards automated diagnosis of cardiac disease. NPJ Digit. Med. 2018, 1, 1–11. [Google Scholar] [CrossRef]
- Vidya, K.S.; Ng, E.; Acharya, U.R.; Chou, S.M.; San Tan, R.; Ghista, D.N. Computer-aided diagnosis of myocardial infarction using ultrasound images with DWT, GLCM and HOS methods: A comparative study. Comput. Biol. Med. 2015, 62, 86–93. [Google Scholar] [CrossRef]
- Larroza, A.; López-Lereu, M.P.; Monmeneu, J.V.; Gavara, J.; Chorro, F.J.; Bodí, V.; Moratal, D. Texture analysis of cardiac cine magnetic resonance imaging to detect nonviable segments in patients with chronic myocardial infarction. Med. Phys. 2018, 45, 1471–1480. [Google Scholar] [CrossRef]
- Snaauw, G.; Gong, D.; Maicas, G.; Van Den Hengel, A.; Niessen, W.J.; Verjans, J.; Carneiro, G. End-to-end diagnosis and segmentation learning from cardiac magnetic resonance imaging. In Proceedings of the 2019 IEEE 16th International Symposium on Biomedical Imaging (ISBI 2019), Venice, Italy, 8–11 April 2019; pp. 802–805. [Google Scholar]
- Baessler, B.; Luecke, C.; Lurz, J.; Klingel, K.; Das, A.; von Roeder, M.; de Waha-Thiele, S.; Besler, C.; Rommel, K.P.; Maintz, D.; et al. Cardiac MRI and texture analysis of myocardial T1 and T2 maps in myocarditis with acute versus chronic symptoms of heart failure. Radiology 2019, 292, 608–617. [Google Scholar] [CrossRef] [PubMed]
- Mannil, M.; von Spiczak, J.; Manka, R.; Alkadhi, H. Texture analysis and machine learning for detecting myocardial infarction in noncontrast low-dose computed tomography: Unveiling the invisible. Investig. Radiol. 2018, 53, 338–343. [Google Scholar] [CrossRef] [PubMed]
- Coenen, A.; Kim, Y.H.; Kruk, M.; Tesche, C.; De Geer, J.; Kurata, A.; Lubbers, M.L.; Daemen, J.; Itu, L.; Rapaka, S.; et al. Diagnostic accuracy of a machine-learning approach to coronary computed tomographic angiography–based fractional flow reserve: Result from the MACHINE consortium. Circ. Cardiovasc. Imaging 2018, 11, e007217. [Google Scholar] [CrossRef] [PubMed] [Green Version]
- Zreik, M.; Van Hamersvelt, R.W.; Wolterink, J.M.; Leiner, T.; Viergever, M.A.; Išgum, I. A recurrent CNN for automatic detection and classification of coronary artery plaque and stenosis in coronary CT angiography. IEEE Trans. Med Imaging 2018, 38, 1588–1598. [Google Scholar] [CrossRef] [Green Version]
- Sacha, J.P.; Goodenday, L.S.; Cios, K.J. Bayesian learning for cardiac SPECT image interpretation. Artif. Intell. Med. 2002, 26, 109–143. [Google Scholar] [CrossRef]
- Shibutani, T.; Nakajima, K.; Wakabayashi, H.; Mori, H.; Matsuo, S.; Yoneyama, H.; Konishi, T.; Okuda, K.; Onoguchi, M.; Kinuya, S. Accuracy of an artificial neural network for detecting a regional abnormality in myocardial perfusion SPECT. Ann. Nucl. Med. 2019, 33, 86–92. [Google Scholar] [CrossRef]
- Liu, C.Y.; Tang, C.X.; Zhang, X.L.; Chen, S.; Xie, Y.; Zhang, X.Y.; Qiao, H.Y.; Zhou, C.S.; Xu, P.P.; Lu, M.J.; et al. Deep learning powered coronary CT angiography for detecting obstructive coronary artery disease: The effect of reader experience, calcification and image quality. Eur. J. Radiol. 2021, 142, 109835. [Google Scholar] [CrossRef]
- Farrah, T.E.; Dhillon, B.; Keane, P.A.; Webb, D.J.; Dhaun, N. The eye, the kidney, and cardiovascular disease: Old concepts, better tools, and new horizons. Kidney Int. 2020, 98, 323–342. [Google Scholar] [CrossRef] [Green Version]
- Wong, T.Y.; Klein, R.; Klein, B.E.; Tielsch, J.M.; Hubbard, L.; Nieto, F.J. Retinal microvascular abnormalities and their relationship with hypertension, cardiovascular disease, and mortality. Surv. Ophthalmol. 2001, 46, 59–80. [Google Scholar] [CrossRef]
- Zhang, L.; Yuan, M.; An, Z.; Zhao, X.; Wu, H.; Li, H.; Wang, Y.; Sun, B.; Li, H.; Ding, S.; et al. Prediction of hypertension, hyperglycemia and dyslipidemia from retinal fundus photographs via deep learning: A cross-sectional study of chronic diseases in central China. PLoS ONE 2020, 15, e0233166. [Google Scholar] [CrossRef]
- Islam, M.T.; Al-Absi, H.R.; Ruagh, E.A.; Alam, T. DiaNet: A deep learning based architecture to diagnose diabetes using retinal images only. IEEE Access 2021, 9, 15686–15695. [Google Scholar] [CrossRef]
- Poplin, R.; Varadarajan, A.V.; Blumer, K.; Liu, Y.; McConnell, M.V.; Corrado, G.S.; Peng, L.; Webster, D.R. Prediction of cardiovascular risk factors from retinal fundus photographs via deep learning. Nat. Biomed. Eng. 2018, 2, 158–164. [Google Scholar] [CrossRef] [PubMed]
- Cheung, C.Y.; Xu, D.; Cheng, C.Y.; Sabanayagam, C.; Tham, Y.C.; Yu, M.; Rim, T.H.; Chai, C.Y.; Gopinath, B.; Mitchell, P.; et al. A deep-learning system for the assessment of cardiovascular disease risk via the measurement of retinal-vessel calibre. Nat. Biomed. Eng. 2021, 5, 498–508. [Google Scholar] [CrossRef] [PubMed]
- Spahillari, A.; Mukamal, K.; DeFilippi, C.; Kizer, J.R.; Gottdiener, J.S.; Djoussé, L.; Lyles, M.F.; Bartz, T.M.; Murthy, V.L.; Shah, R.V. The association of lean and fat mass with all-cause mortality in older adults: The Cardiovascular Health Study. Nutr. Metab. Cardiovasc. Dis. 2016, 26, 1039–1047. [Google Scholar] [CrossRef] [Green Version]
- Chuang, T.L.; Lin, J.W.; Wang, Y.F. Bone Mineral Density as a Predictor of Atherogenic Indexes of Cardiovascular Disease, Especially in Nonobese Adults. Dis. Markers 2019, 2019, 1045098. [Google Scholar] [CrossRef] [Green Version]
- Messina, C.; Albano, D.; Gitto, S.; Tofanelli, L.; Bazzocchi, A.; Ulivieri, F.M.; Guglielmi, G.; Sconfienza, L.M. Body composition with dual energy X-ray absorptiometry: From basics to new tools. Quant. Imaging Med. Surg. 2020, 10, 1687. [Google Scholar] [CrossRef]
- Park, J.; Yoon, Y.E.; Kim, K.M.; Hwang, I.C.; Lee, W.; Cho, G.Y. Prognostic value of lower bone mineral density in predicting adverse cardiovascular disease in Asian women. Heart 2021, 107, 1040–1046. [Google Scholar] [CrossRef]
- Ceniccola, G.D.; Castro, M.G.; Piovacari, S.M.F.; Horie, L.M.; Corrêa, F.G.; Barrere, A.P.N.; Toledo, D.O. Current technologies in body composition assessment: Advantages and disadvantages. Nutrition 2019, 62, 25–31. [Google Scholar] [CrossRef]
- Hansen, A.B.; Sander, B.; Larsen, M.; Kleener, J.; Borch-Johnsen, K.; Klein, R.; Lund-Andersen, H. Screening for diabetic retinopathy using a digital non-mydriatic camera compared with standard 35-mm stereo colour transparencies. Acta Ophthalmol. Scand. 2004, 82, 656–665. [Google Scholar] [CrossRef]
- Oloumi, F.; Rangayyan, R.M.; Ells, A.L. Digital Image Processing for Ophthalmology: Detection and Modeling of Retinal Vascular Architecture. Synth. Lect. Biomed. Eng. 2014, 9, 1–185. [Google Scholar] [CrossRef]
- Guo, V.Y.; Chan, J.C.N.; Chung, H.; Ozaki, R.; So, W.; Luk, A.; Lam, A.; Lee, J.; Zee, B.C.Y. Retinal information is independently associated with cardiovascular disease in patients with type 2 diabetes. Sci. Rep. 2016, 6, 19053. [Google Scholar] [CrossRef] [PubMed] [Green Version]
- Gerrits, N.; Elen, B.; Van Craenendonck, T.; Triantafyllidou, D.; Petropoulos, I.N.; Malik, R.A.; De Boever, P. Age and sex affect deep learning prediction of cardiometabolic risk factors from retinal images. Sci. Rep. 2020, 10, 9432. [Google Scholar] [CrossRef] [PubMed]
- Van Craenendonck, T.; Gerrits, N.; Buelens, B.; Petropoulos, I.N.; Shuaib, A.; Standaert, A.; Malik, R.A.; De Boever, P. Retinal microvascular complexity comparing mono-and multifractal dimensions in relation to cardiometabolic risk factors in a Middle Eastern population. Acta Ophthalmol. 2021, 99, e368–e377. [Google Scholar] [CrossRef] [PubMed]
- Sharp, D.S.; Andrew, M.E.; Burchfiel, C.M.; Violanti, J.M.; Wactawski-Wende, J. Body mass index versus dual energy X-ray absorptiometry-derived indexes: Predictors of cardiovascular and diabetic disease risk factors. Am. J. Hum. Biol. 2012, 24, 400–405. [Google Scholar] [CrossRef] [PubMed]
- Lang, P.O.; Trivalle, C.; Vogel, T.; Proust, J.; Papazian, J.P. Markers of metabolic and cardiovascular health in adults: Comparative analysis of DEXA-based body composition components and BMI categories. J. Cardiol. 2015, 65, 42–49. [Google Scholar] [CrossRef] [Green Version]
- Bekfani, T.; Pellicori, P.; Morris, D.A.; Ebner, N.; Valentova, M.; Steinbeck, L.; Wachter, R.; Elsner, S.; Sliziuk, V.; Schefold, J.C.; et al. Sarcopenia in patients with heart failure with preserved ejection fraction: Impact on muscle strength, exercise capacity and quality of life. Int. J. Cardiol. 2016, 222, 41–46. [Google Scholar] [CrossRef] [Green Version]
- Martens, P.; Ter Maaten, J.M.; Vanhaen, D.; Heeren, E.; Caers, T.; Bovens, B.; Dauw, J.; Dupont, M.; Mullens, W. Heart failure is associated with accelerated age related metabolic bone disease. Acta Cardiol. 2021, 76, 718–726. [Google Scholar] [CrossRef]
- Kerkadi, A.; Suleman, D.; Salah, L.A.; Lotfy, C.; Attieh, G.; Bawadi, H.; Shi, Z. Adiposity indicators as cardio-metabolic risk predictors in adults from country with high burden of obesity. Diabetes Metab. Syndr. Obesity Targets Ther. 2020, 13, 175. [Google Scholar] [CrossRef] [Green Version]
- Bawadi, H.; Hassan, S.; Zadeh, A.S.; Sarv, H.; Kerkadi, A.; Tur, J.A.; Shi, Z. Age and gender specific cut-off points for body fat parameters among adults in Qatar. Nutr. J. 2020, 19, 75. [Google Scholar] [CrossRef]
- Bartl, R.; Bartl, C. Bone densitometry. In The Osteoporosis Manual: Prevention, Diagnosis and Management; Springer International Publishing: Cham, Switzerland, 2019; pp. 67–75. [Google Scholar] [CrossRef]
- Loncar, G.; Cvetinovic, N.; Lainscak, M.; Isaković, A.; von Haehling, S. Bone in heart failure. J. Cachexia Sarcopenia Muscle 2020, 11, 381–393. [Google Scholar] [CrossRef] [Green Version]
- Reid, S.; Schousboe, J.T.; Kimelman, D.; Monchka, B.A.; Jozani, M.J.; Leslie, W.D. Machine learning for automated abdominal aortic calcification scoring of DXA vertebral fracture assessment images: A pilot study. Bone 2021, 148, 115943. [Google Scholar] [CrossRef] [PubMed]
- Bawadi, H.; Abouwatfa, M.; Alsaeed, S.; Kerkadi, A.; Shi, Z. Body shape index is a stronger predictor of diabetes. Nutrients 2019, 11, 1018. [Google Scholar] [CrossRef] [PubMed] [Green Version]
- Zhao, J.; Feng, Q.; Wu, P.; Lupu, R.A.; Wilke, R.A.; Wells, Q.S.; Denny, J.C.; Wei, W.Q. Learning from longitudinal data in electronic health record and genetic data to improve cardiovascular event prediction. Sci. Rep. 2019, 9, 717. [Google Scholar] [CrossRef] [PubMed] [Green Version]
- Zhang, H.; Wang, X.; Liu, C.; Liu, Y.; Li, P.; Yao, L.; Li, H.; Wang, J.; Jiao, Y. Detection of coronary artery disease using multi-modal feature fusion and hybrid feature selection. Physiol. Meas. 2020, 41, 115007. [Google Scholar] [CrossRef] [PubMed]
- Ali, F.; El-Sappagh, S.; Islam, S.R.; Kwak, D.; Ali, A.; Imran, M.; Kwak, K.S. A smart healthcare monitoring system for heart disease prediction based on ensemble deep learning and feature fusion. Inf. Fusion 2020, 63, 208–222. [Google Scholar] [CrossRef]
- Apostolopoulos, I.D.; Apostolopoulos, D.I.; Spyridonidis, T.I.; Papathanasiou, N.D.; Panayiotakis, G.S. Multi-input deep learning approach for cardiovascular disease diagnosis using myocardial perfusion imaging and clinical data. Phys. Medica 2021, 84, 168–177. [Google Scholar] [CrossRef]
- Chaves, J.M.Z.; Chaudhari, A.S.; Wentland, A.L.; Desai, A.D.; Banerjee, I.; Boutin, R.D.; Maron, D.J.; Rodriguez, F.; Sandhu, A.T.; Jeffrey, R.B.; et al. Opportunistic assessment of ischemic heart disease risk using abdominopelvic computed tomography and medical record data: A multimodal explainable artificial intelligence approach. medRxiv 2021. [Google Scholar] [CrossRef]
- Flores, A.M.; Schuler, A.; Eberhard, A.V.; Olin, J.W.; Cooke, J.P.; Leeper, N.J.; Shah, N.H.; Ross, E.G. Unsupervised Learning for Automated Detection of Coronary Artery Disease Subgroups. J. Am. Heart Assoc. 2021, 10, e021976. [Google Scholar] [CrossRef]
- Al Thani, A.; Fthenou, E.; Paparrodopoulos, S.; Al Marri, A.; Shi, Z.; Qafoud, F.; Afifi, N. Qatar biobank cohort study: Study design and first results. Am. J. Epidemiol. 2019, 188, 1420–1433. [Google Scholar] [CrossRef]
- Al Kuwari, H.; Al Thani, A.; Al Marri, A.; Al Kaabi, A.; Abderrahim, H.; Afifi, N.; Qafoud, F.; Chan, Q.; Tzoulaki, I.; Downey, P.; et al. The Qatar Biobank: Background and methods. BMC Public Health 2015, 15, 1–9. [Google Scholar] [CrossRef] [Green Version]
- Jain, Y.K.; Bhandare, S.K. Min max normalization based data perturbation method for privacy protection. Int. J. Comput. Commun. Technol. 2011, 2, 45–50. [Google Scholar] [CrossRef]
- Breiman, L.; Friedman, J.H.; Olshen, R.A.; Stone, C.J. Classification and Regression Trees; Routledge: London, UK, 2017. [Google Scholar]
- Hagan, M.; Demuth, H.; Beale, M. Neural Net and Traditional Classifiers; Lincoln Laboratory: Lexington, MA, USA, 1987. [Google Scholar]
- Breiman, L. Random forests. Mach. Learn. 2001, 45, 5–32. [Google Scholar] [CrossRef] [Green Version]
- Brownlee, J. XGBoost with Python: Gradient Boosted Trees with XGBoost and Scikit-Learn. Machine Learning Mastery 2016. Available online: https://machinelearningmastery.com/xgboost-with-python/ (accessed on 27 October 2021).
- Dorogush, A.V.; Ershov, V.; Gulin, A. CatBoost: Gradient boosting with categorical features support. arXiv 2018, arXiv:1810.11363. [Google Scholar]
- Hoffman, J.I. Biostatistics for Medical and Biomedical Practitioners; Academic Press: Cambridge, MA, USA, 2015. [Google Scholar]
- Cawley, G.C.; Talbot, N.L. On over-fitting in model selection and subsequent selection bias in performance evaluation. J. Mach. Learn. Res. 2010, 11, 2079–2107. [Google Scholar]
- Krizhevsky, A.; Sutskever, I.; Hinton, G.E. Imagenet classification with deep convolutional neural networks. Adv. Neural Inf. Process. Syst. 2012, 25, 1097–1105. [Google Scholar] [CrossRef]
- Simonyan, K.; Zisserman, A. Very deep convolutional networks for large-scale image recognition. arXiv 2014, arXiv:1409.1556. [Google Scholar]
- He, K.; Zhang, X.; Ren, S.; Sun, J. Deep residual learning for image recognition. In Proceedings of the IEEE conference on computer vision and pattern recognition, Las Vegas, NV, USA, 27–30 June 2016; pp. 770–778. [Google Scholar]
- Huang, G.; Liu, Z.; Van Der Maaten, L.; Weinberger, K.Q. Densely connected convolutional networks. In Proceedings of the IEEE conference on computer vision and pattern recognition, Honolulu, HI, USA, 21–26 July 2017; pp. 4700–4708. [Google Scholar]
- Iandola, F.N.; Han, S.; Moskewicz, M.W.; Ashraf, K.; Dally, W.J.; Keutzer, K. SqueezeNet: AlexNet-level accuracy with 50× fewer parameters and< 0.5 MB model size. arXiv 2016, arXiv:1602.07360. [Google Scholar]
- Smith, L.N.; Topin, N. Super-convergence: Very fast training of neural networks using large learning rates. In Proceedings of the Artificial Intelligence and Machine Learning for Multi-Domain Operations Applications, Baltimore, MD, USA, 10 May 2019; Volume 11006, p. 1100612. [Google Scholar]
- Smith, L.N. A disciplined approach to neural network hyper-parameters: Part 1–learning rate, batch size, momentum, and weight decay. arXiv 2018, arXiv:1803.09820. [Google Scholar]
- Nguyen, T.; Kelly, P.; Sambrook, P.; Gilbert, C.; Pocock, N.; Eisman, J. Lifestyle factors and bone density in the elderly: Implications for osteoporosis prevention. J. Bone Miner. Res. 1994, 9, 1339–1346. [Google Scholar] [CrossRef]
- Ngugyen, T.V.; Eisman, J.A.; Kelly, P.J.; Sambroak, P.N. Risk factors for osteoporotic fractures in elderly men. Am. J. Epidemiol. 1996, 144, 255–263. [Google Scholar] [CrossRef] [Green Version]
- Khondaker, M.; Islam, T.; Khan, J.Y.; Refaee, M.A.; Hajj, N.E.; Rahman, M.S.; Alam, T. Obesity in Qatar: A Case-Control Study on the Identification of Associated Risk Factors. Diagnostics 2020, 10, 883. [Google Scholar] [CrossRef] [PubMed]
- Gildenblat, J. PyTorch Library for CAM Methods. Available online: https://github.com/jacobgil/pytorch-grad-cam (accessed on 2 January 2022).
- Wong, T.Y.; Mitchell, P. Hypertensive retinopathy. N. Engl. J. Med. 2004, 351, 2310–2317. [Google Scholar] [CrossRef] [PubMed]
- Kanukollu, V.M.; Ahmad, S.S. Retinal Hemorrhage. StatPearls. 2021. Available online: https://www.ncbi.nlm.nih.gov/books/NBK560777/ (accessed on 16 January 2022).
- Gkastaris, K.; Goulis, D.G.; Potoupnis, M.; Anastasilakis, A.D.; Kapetanos, G. Obesity, osteoporosis and bone metabolism. J. Musculoskelet. Neuronal Interact. 2020, 20, 372. [Google Scholar] [PubMed]


| Layer Name | Output Size | |
|---|---|---|
| MLP Stem | ||
| Linear | 8 | |
| ReLU | 8 | |
| BatchNorm1d | 8 | |
| Dropout | 8 | |
| Linear | 8 | |
| Classification Head | ||
| BatchNorm1d | 264 | |
| Dropout | 264 | |
| Linear | 32 | |
| ReLU | 32 | |
| BatchNorm1d | 32 | |
| Dropout | 32 | |
| Linear | 2 | |
| Property (No of Features) | Evaluation Metric | DT | MLP | RF | LR | CatBoost | XGBoost |
|---|---|---|---|---|---|---|---|
| Bone Mineral Density (55) | Accuracy | 0.620 | 0.682 | 0.686 | 0.732 | 0.710 | 0.726 |
| Sensitivity | 0.617 | 0.574 | 0.647 | 0.678 | 0.635 | 0.672 | |
| Specificity | 0.628 | 0.795 | 0.724 | 0.785 | 0.784 | 0.780 | |
| Precision | 0.624 | 0.740 | 0.701 | 0.758 | 0.746 | 0.758 | |
| F1-score | 0.609 | 0.639 | 0.672 | 0.716 | 0.685 | 0.710 | |
| MCC | 0.250 | 0.382 | 0.373 | 0.466 | 0.424 | 0.456 | |
| p-value | 1.996 × 10 | 1.089 × 10 | 1.664 × 10 | 1.536 × 10 | 6.623 × 10 | 1.332 × 10 | |
| Body Fat Composition (15) | Accuracy | 0.720 | 0.770 | 0.746 | 0.742 | 0.740 | 0.754 |
| Sensitivity | 0.594 | 0.640 | 0.697 | 0.741 | 0.673 | 0.723 | |
| Specificity | 0.832 | 0.902 | 0.789 | 0.749 | 0.806 | 0.787 | |
| Precision | 0.790 | 0.867 | 0.770 | 0.747 | 0.777 | 0.767 | |
| F1-score | 0.669 | 0.734 | 0.731 | 0.741 | 0.720 | 0.743 | |
| MCC | 0.445 | 0.560 | 0.489 | 0.488 | 0.482 | 0.508 | |
| p-value | 1.248 × 10 | 1.175 × 10 | 1.110 × 10 | 1.052 × 10 | 4.975 × 10 | 9.515 × 10 | |
| Lean Mass (7) | Accuracy | 0.576 | 0.652 | 0.690 | 0.634 | 0.668 | 0.702 |
| Sensitivity | 0.556 | 0.652 | 0.674 | 0.613 | 0.702 | 0.669 | |
| Specificity | 0.596 | 0.664 | 0.710 | 0.657 | 0.638 | 0.736 | |
| Precision | 0.582 | 0.717 | 0.699 | 0.641 | 0.661 | 0.716 | |
| F1-score | 0.560 | 0.650 | 0.683 | 0.625 | 0.678 | 0.691 | |
| MCC | 0.156 | 0.329 | 0.386 | 0.270 | 0.342 | 0.406 | |
| p-value | 9.083 × 10 | 6.950 × 10 | 8.326 × 10 | 7.994 × 10 | 3.984 × 10 | 7.402 × 10 | |
| Area Measurements (45) | Accuracy | 0.580 | 0.614 | 0.600 | 0.664 | 0.644 | 0.598 |
| Sensitivity | 0.546 | 0.528 | 0.624 | 0.665 | 0.660 | 0.605 | |
| Specificity | 0.623 | 0.698 | 0.584 | 0.667 | 0.633 | 0.597 | |
| Precision | 0.597 | 0.636 | 0.602 | 0.675 | 0.644 | 0.598 | |
| F1-score | 0.556 | 0.575 | 0.607 | 0.664 | 0.647 | 0.598 | |
| MCC | 0.175 | 0.230 | 0.210 | 0.335 | 0.295 | 0.203 | |
| p-value | 7.138 × 10 | 4.135 × 10 | 6.662 × 10 | 6.447 × 10 | 3.332 × 10 | 6.057 × 10 | |
| All (122) | Accuracy | 0.672 | 0.750 | 0.748 | 0.768 | 0.750 | 0.774 |
| Sensitivity | 0.658 | 0.656 | 0.704 | 0.761 | 0.694 | 0.754 | |
| Specificity | 0.691 | 0.855 | 0.797 | 0.780 | 0.812 | 0.800 | |
| Precision | 0.694 | 0.827 | 0.777 | 0.777 | 0.789 | 0.790 | |
| F1-score | 0.663 | 0.722 | 0.736 | 0.766 | 0.734 | 0.768 | |
| MCC | 0.363 | 0.526 | 0.504 | 0.542 | 0.511 | 0.555 | |
| p-value | 5.879 × 10 | 5.711 × 10 | 5.552 × 10 | 5.402 × 10 | 2.849 × 10 | 5.126 × 10 |
| Type of Images | DL Model | Accuracy | Sensitivity | Specificity | Precision | f1 Score | MCC | p-Value |
|---|---|---|---|---|---|---|---|---|
| Cropped images | DenseNet-121 | 0.756 | 0.753 | 0.758 | 0.74 | 0.746 | 0.511 | 2.023 × 10 |
| Resnet-18 | 0.694 | 0.735 | 0.656 | 0.661 | 0.696 | 0.392 | 1.732 × 10 | |
| ResNet-34 | 0.753 | 0.682 | 0.817 | 0.773 | 0.725 | 0.505 | 8.824 × 10 | |
| VGGNet-11 | 0.744 | 0.712 | 0.774 | 0.742 | 0.727 | 0.487 | 5.529 × 10 | |
| VGGNet-16 | 0.739 | 0.7 | 0.774 | 0.739 | 0.719 | 0.476 | 4.612 × 10 | |
| AlexNet | 0.699 | 0.659 | 0.737 | 0.696 | 0.677 | 0.397 | 3.519 × 10 | |
| SqueezeNet1_0 | 0.719 | 0.665 | 0.769 | 0.724 | 0.693 | 0.436 | 3.130 × 10 | |
| SqueezeNet1_1 | 0.685 | 0.729 | 0.645 | 0.653 | 0.689 | 0.375 | 6.687 × 10 | |
| Mean subtracted images | DenseNet-121 | 0.73 | 0.712 | 0.747 | 0.72 | 0.716 | 0.459 | 3.545 × 10 |
| Resnet-18 | 0.713 | 0.682 | 0.742 | 0.707 | 0.695 | 0.425 | 1.953 × 10 | |
| ResNet 34 | 0.713 | 0.635 | 0.785 | 0.73 | 0.679 | 0.426 | 6.846 × 10 | |
| VGGNet-11 | 0.685 | 0.735 | 0.64 | 0.651 | 0.691 | 0.376 | 5.984 × 10 | |
| VGGNet-16 | 0.725 | 0.724 | 0.726 | 0.707 | 0.715 | 0.449 | 3.542 × 10 | |
| AlexNet | 0.683 | 0.688 | 0.677 | 0.661 | 0.674 | 0.365 | 2.806 × 10 | |
| SqueezeNet1_0 | 0.677 | 0.635 | 0.715 | 0.671 | 0.653 | 0.352 | 2.390 × 10 | |
| SqueezeNet1_1 | 0.669 | 0.612 | 0.72 | 0.667 | 0.638 | 0.334 | 1.390 × 10 |
| Type of Images | DL Model | Accuracy | Sensitivity | Specificity | Precision | f 1 Score | MCC | p-Value |
|---|---|---|---|---|---|---|---|---|
| Cropped images | DenseNet-121 + DXA | 0.74 | 0.688 | 0.793 | 0.771 | 0.719 | 0.492 | 1.371 × 10 |
| ResNet-18 + DXA | 0.756 | 0.666 | 0.842 | 0.802 | 0.725 | 0.519 | 1.255 × 10 | |
| ResNet-34 + DXA | 0.783 | 0.747 | 0.816 | 0.793 | 0.767 | 0.566 | 1.290 × 10 | |
| VGGNet-11 + DXA | 0.752 | 0.691 | 0.812 | 0.784 | 0.729 | 0.512 | 1.297 × 10 | |
| VGGNet-16 + DXA | 0.739 | 0.675 | 0.8 | 0.773 | 0.71 | 0.49 | 1.608 × 10 | |
| AlexNet + DXA | 0.778 | 0.698 | 0.854 | 0.815 | 0.751 | 0.559 | 1.166 × 10 | |
| SqueezeNet1_0 + DXA | 0.748 | 0.653 | 0.836 | 0.786 | 0.713 | 0.498 | 3.795 × 10 | |
| SqueezeNet1_1 + DXA | 0.767 | 0.736 | 0.795 | 0.773 | 0.753 | 0.534 | 1.243 × 10 | |
| Mean subtracted images | DenseNet-121 + DXA | 0.736 | 0.669 | 0.8 | 0.76 | 0.71 | 0.475 | 1.409 × 10 |
| ResNet-18 + DXA | 0.734 | 0.639 | 0.825 | 0.775 | 0.699 | 0.474 | 1.355 × 10 | |
| ResNet-34 + DXA | 0.757 | 0.755 | 0.761 | 0.754 | 0.75 | 0.52 | 1.173 × 10 | |
| VGGNet-11 + DXA | 0.734 | 0.707 | 0.760 | 0.737 | 0.715 | 0.474 | 1.323 × 10 | |
| VGGNet-16 + DXA | 0.723 | 0.702 | 0.746 | 0.727 | 0.705 | 0.456 | 1.608 × 10 | |
| AlexNet + DXA | 0.753 | 0.658 | 0.841 | 0.796 | 0.718 | 0.511 | 1.466 × 10 | |
| SqueezeNet1_0 + DXA | 0.754 | 0.673 | 0.829 | 0.789 | 0.725 | 0.511 | 1.241 × 10 | |
| SqueezeNet1_1 + DXA | 0.770 | 0.732 | 0.804 | 0.780 | 0.754 | 0.540 | 1.464 × 10 |
| Class | Age Group (18–39) | Age Group (40 and Above) | ||
|---|---|---|---|---|
| Participants | Images | Participants | Images | |
| CVD | 115 | 440 | 118 | 434 |
| Control | 210 | 782 | 40 | 140 |
Publisher’s Note: MDPI stays neutral with regard to jurisdictional claims in published maps and institutional affiliations. |
© 2022 by the authors. Licensee MDPI, Basel, Switzerland. This article is an open access article distributed under the terms and conditions of the Creative Commons Attribution (CC BY) license (https://creativecommons.org/licenses/by/4.0/).
Share and Cite
Al-Absi, H.R.H.; Islam, M.T.; Refaee, M.A.; Chowdhury, M.E.H.; Alam, T. Cardiovascular Disease Diagnosis from DXA Scan and Retinal Images Using Deep Learning. Sensors 2022, 22, 4310. https://doi.org/10.3390/s22124310
Al-Absi HRH, Islam MT, Refaee MA, Chowdhury MEH, Alam T. Cardiovascular Disease Diagnosis from DXA Scan and Retinal Images Using Deep Learning. Sensors. 2022; 22(12):4310. https://doi.org/10.3390/s22124310
Chicago/Turabian StyleAl-Absi, Hamada R. H., Mohammad Tariqul Islam, Mahmoud Ahmed Refaee, Muhammad E. H. Chowdhury, and Tanvir Alam. 2022. "Cardiovascular Disease Diagnosis from DXA Scan and Retinal Images Using Deep Learning" Sensors 22, no. 12: 4310. https://doi.org/10.3390/s22124310
APA StyleAl-Absi, H. R. H., Islam, M. T., Refaee, M. A., Chowdhury, M. E. H., & Alam, T. (2022). Cardiovascular Disease Diagnosis from DXA Scan and Retinal Images Using Deep Learning. Sensors, 22(12), 4310. https://doi.org/10.3390/s22124310