
Tire Speckle Interference Bubble Defect Detection Based on Improved Faster RCNN-FPN


Abstract
:1. Introduction
2. Background and Related Work
3. Improved Network Algorithm Based on Faster RCNN-FPN
3.1. Detection Process and Image Characteristics of Tire Crown Speckle Interference Bubble Defect Image
- Tire speckle interference images have low contrast and low brightness;
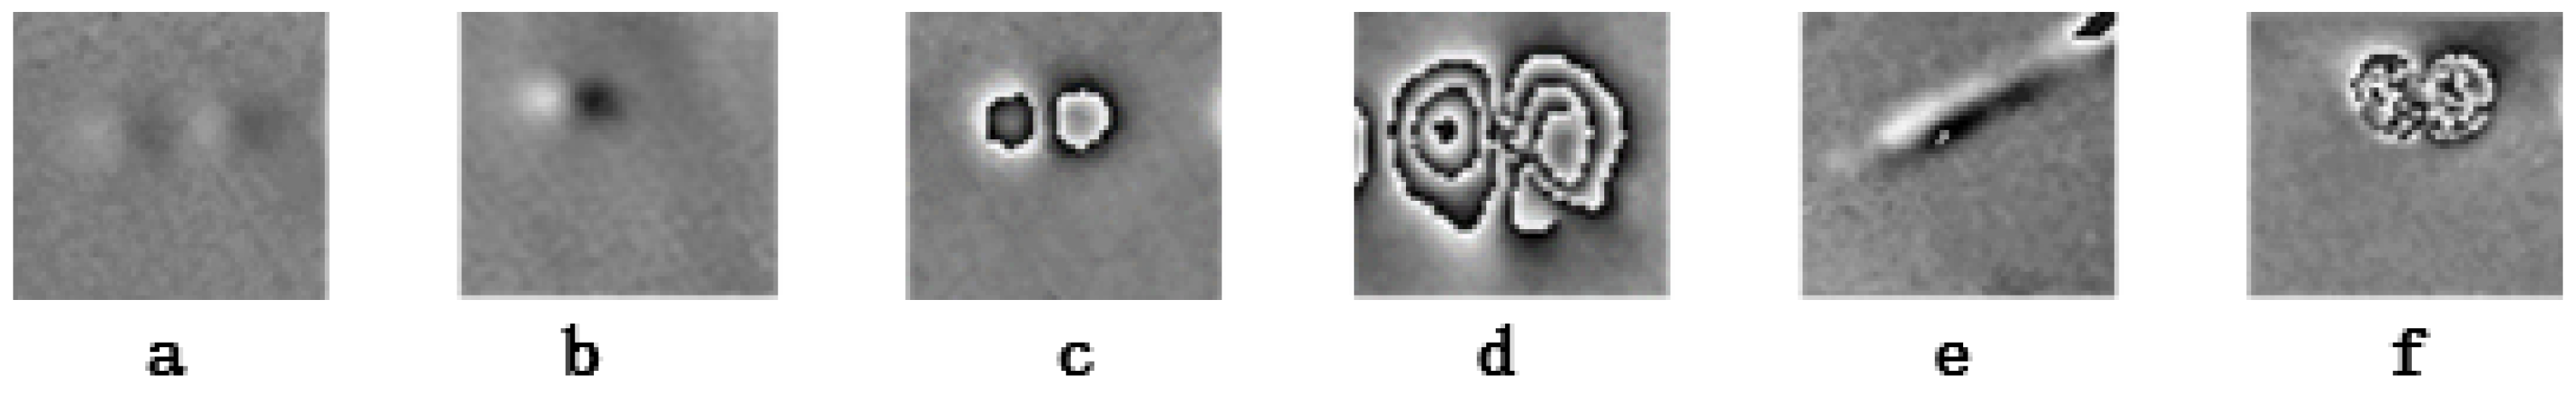
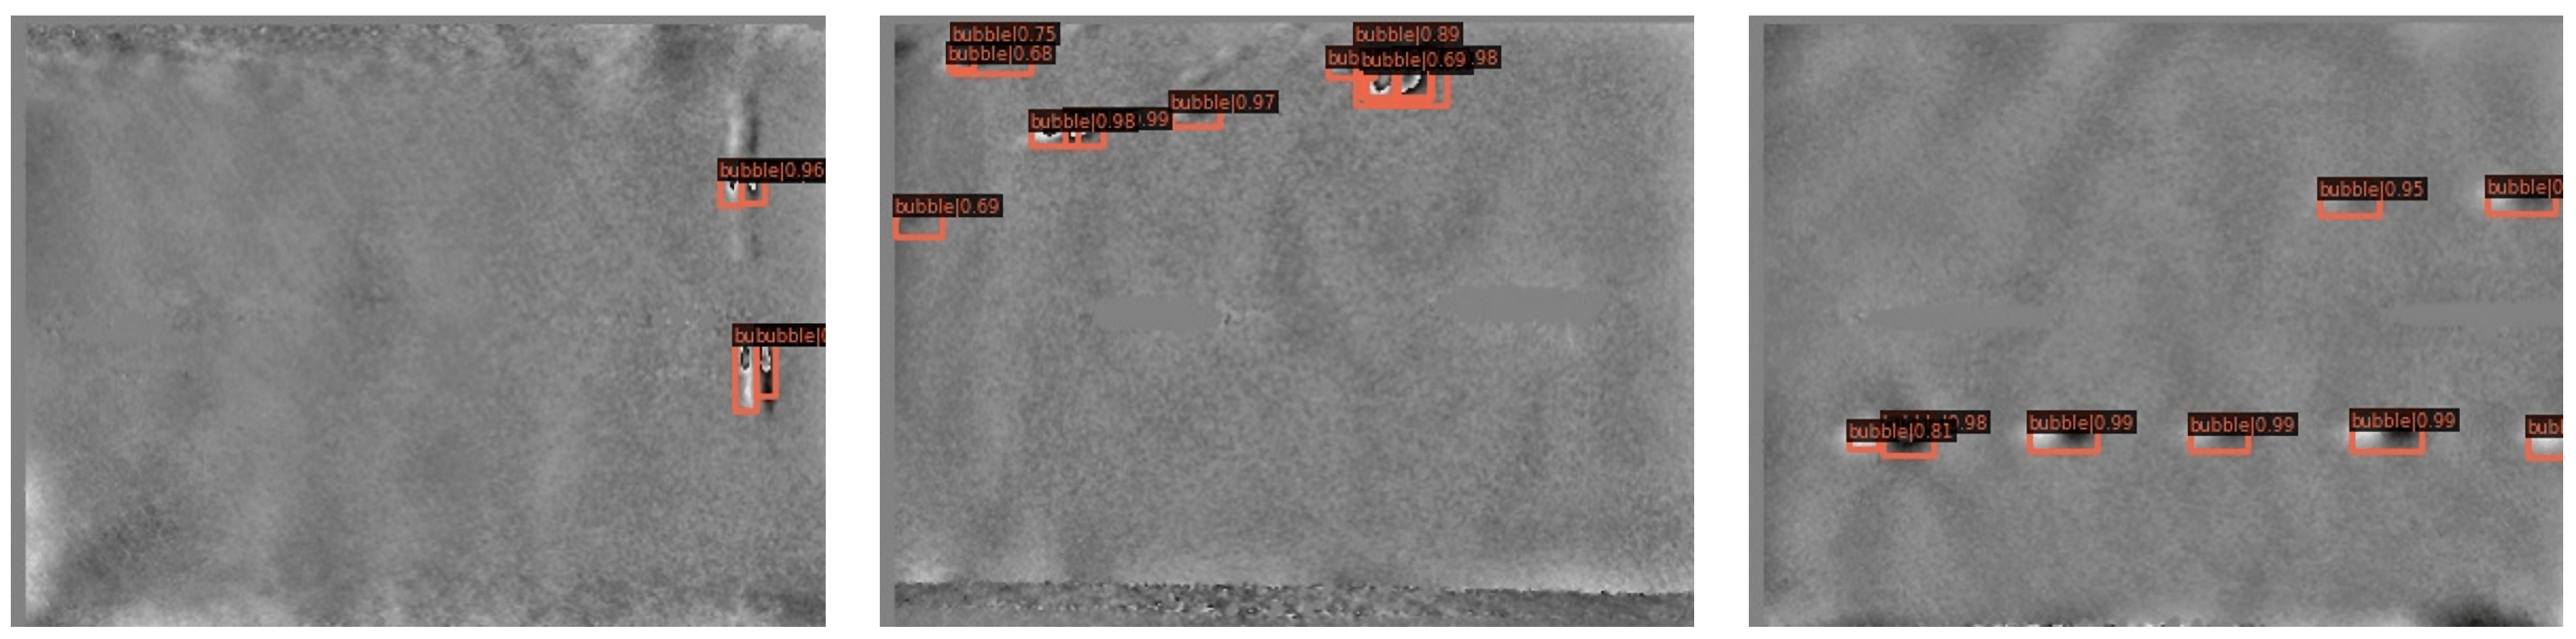
- Tire crown bubble defects vary widely: There are many styles of bubble defects;
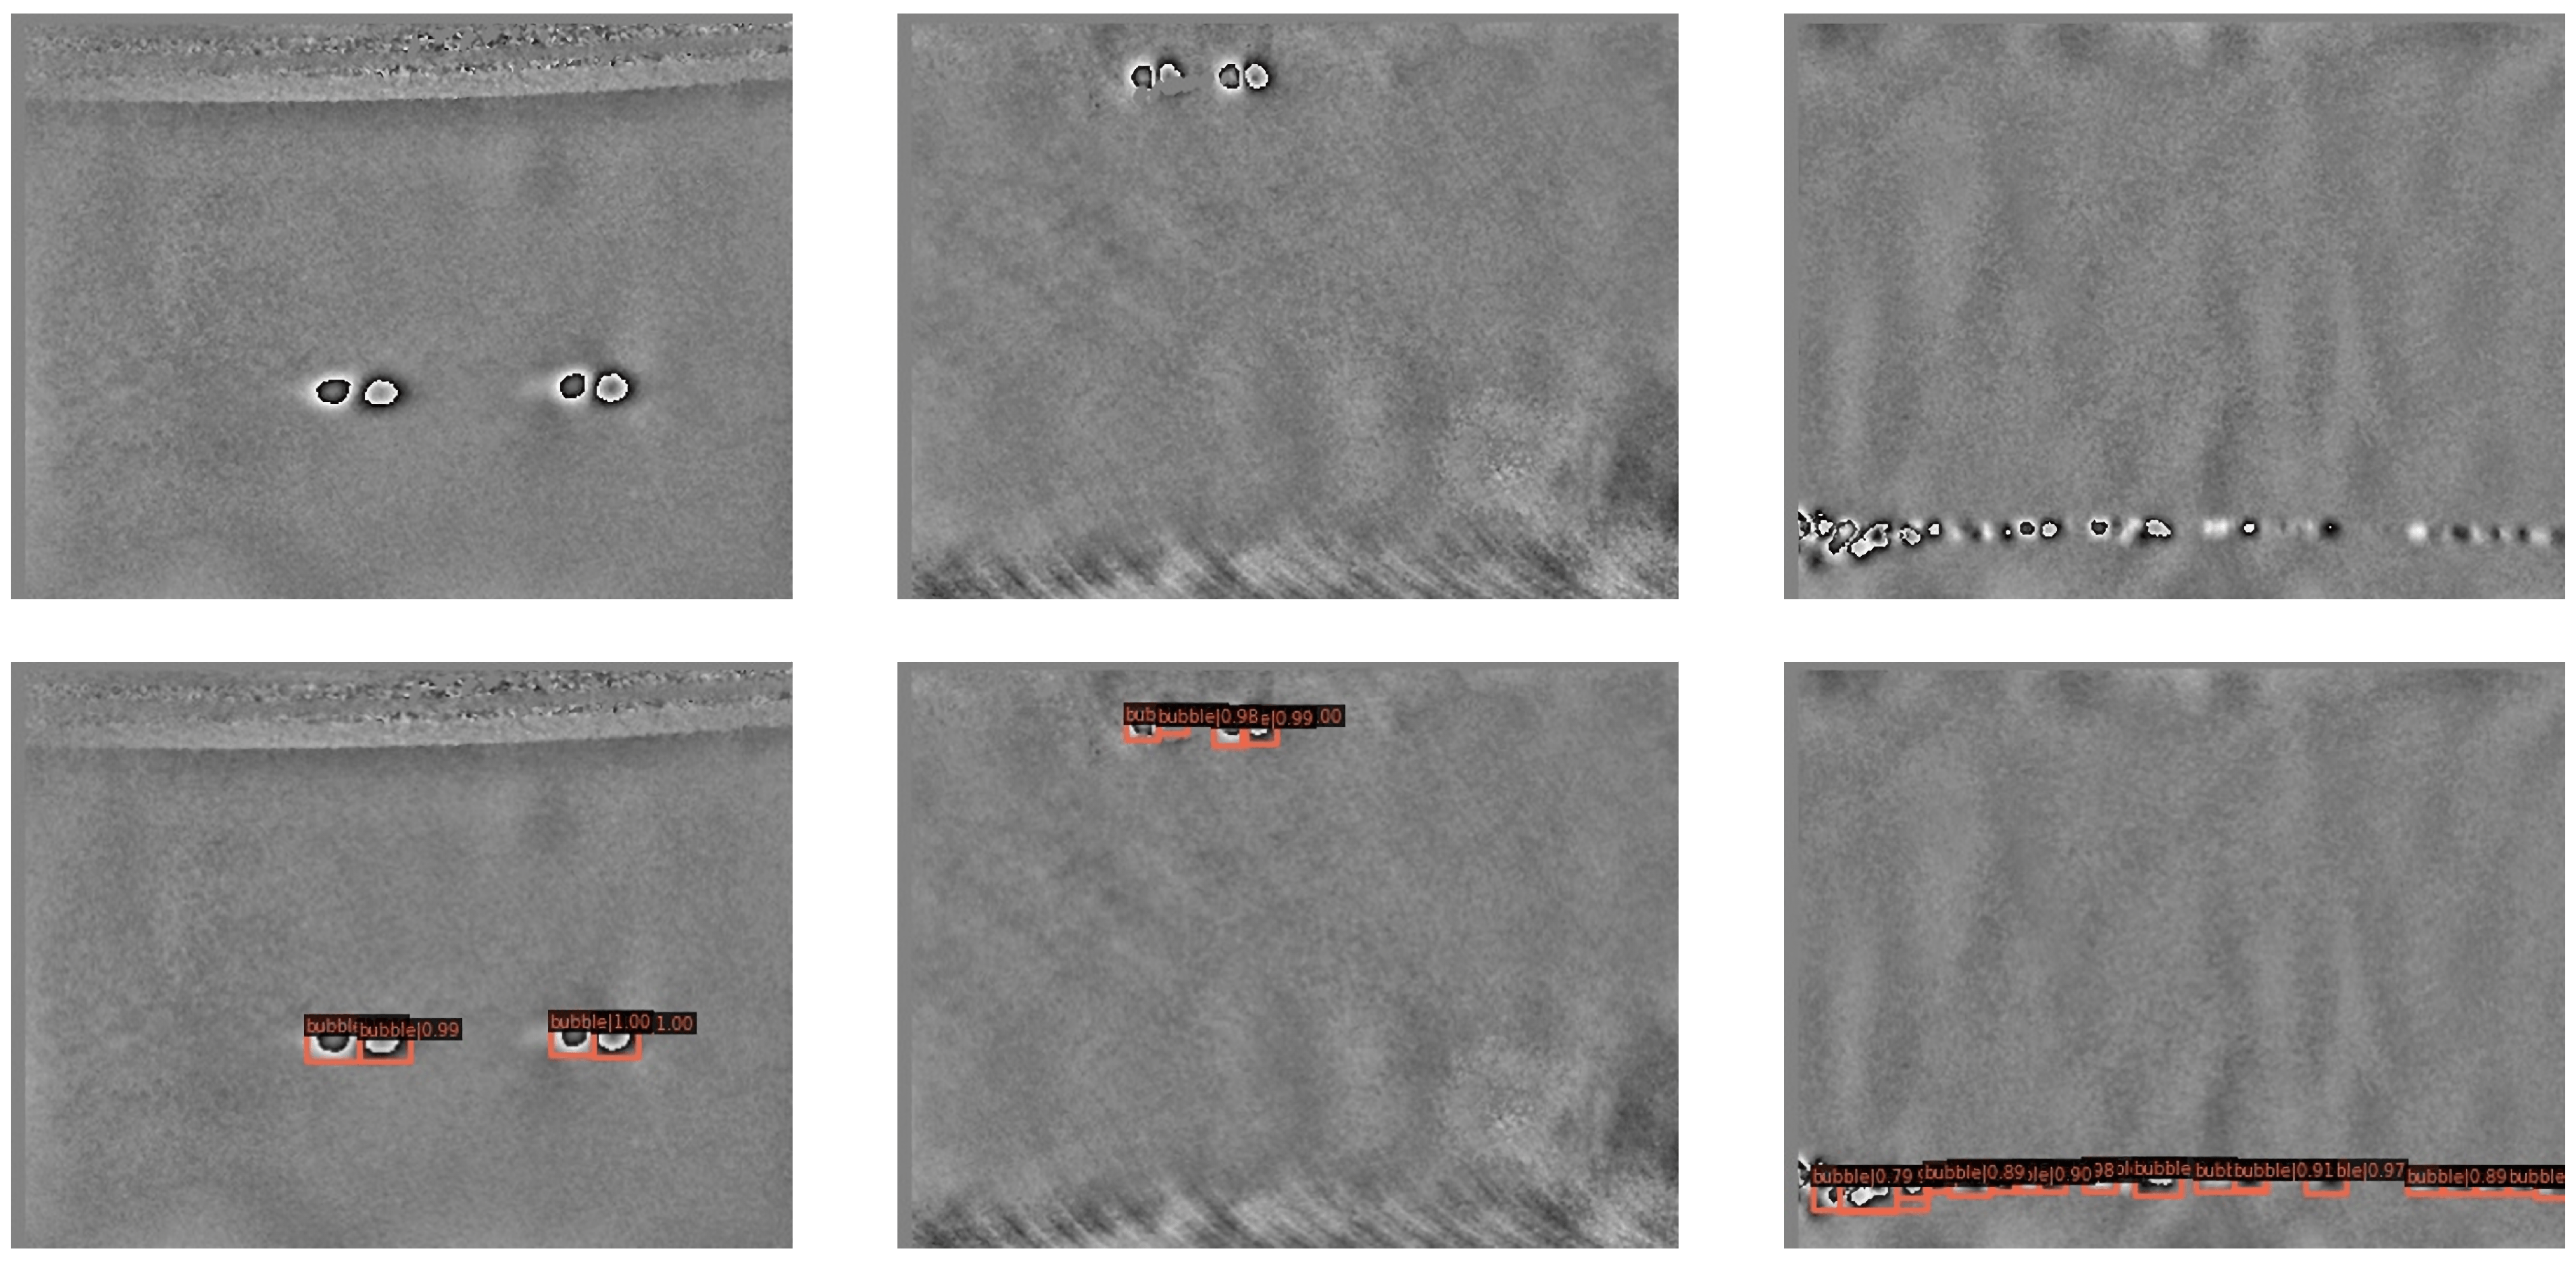
- As shown in Figure 1f, the bubble defects are fully manifested and the uncorrelated effect obviously destroys the conditions of speckle interference, making the phase values appear chaotic fringes;
- On the whole, tire bubble defects are often small objects, and the small scale of small objects makes the feature pixels easy to weaken or even disappear after multiple pooling in the neural network.
3.2. Improved Network Algorithm
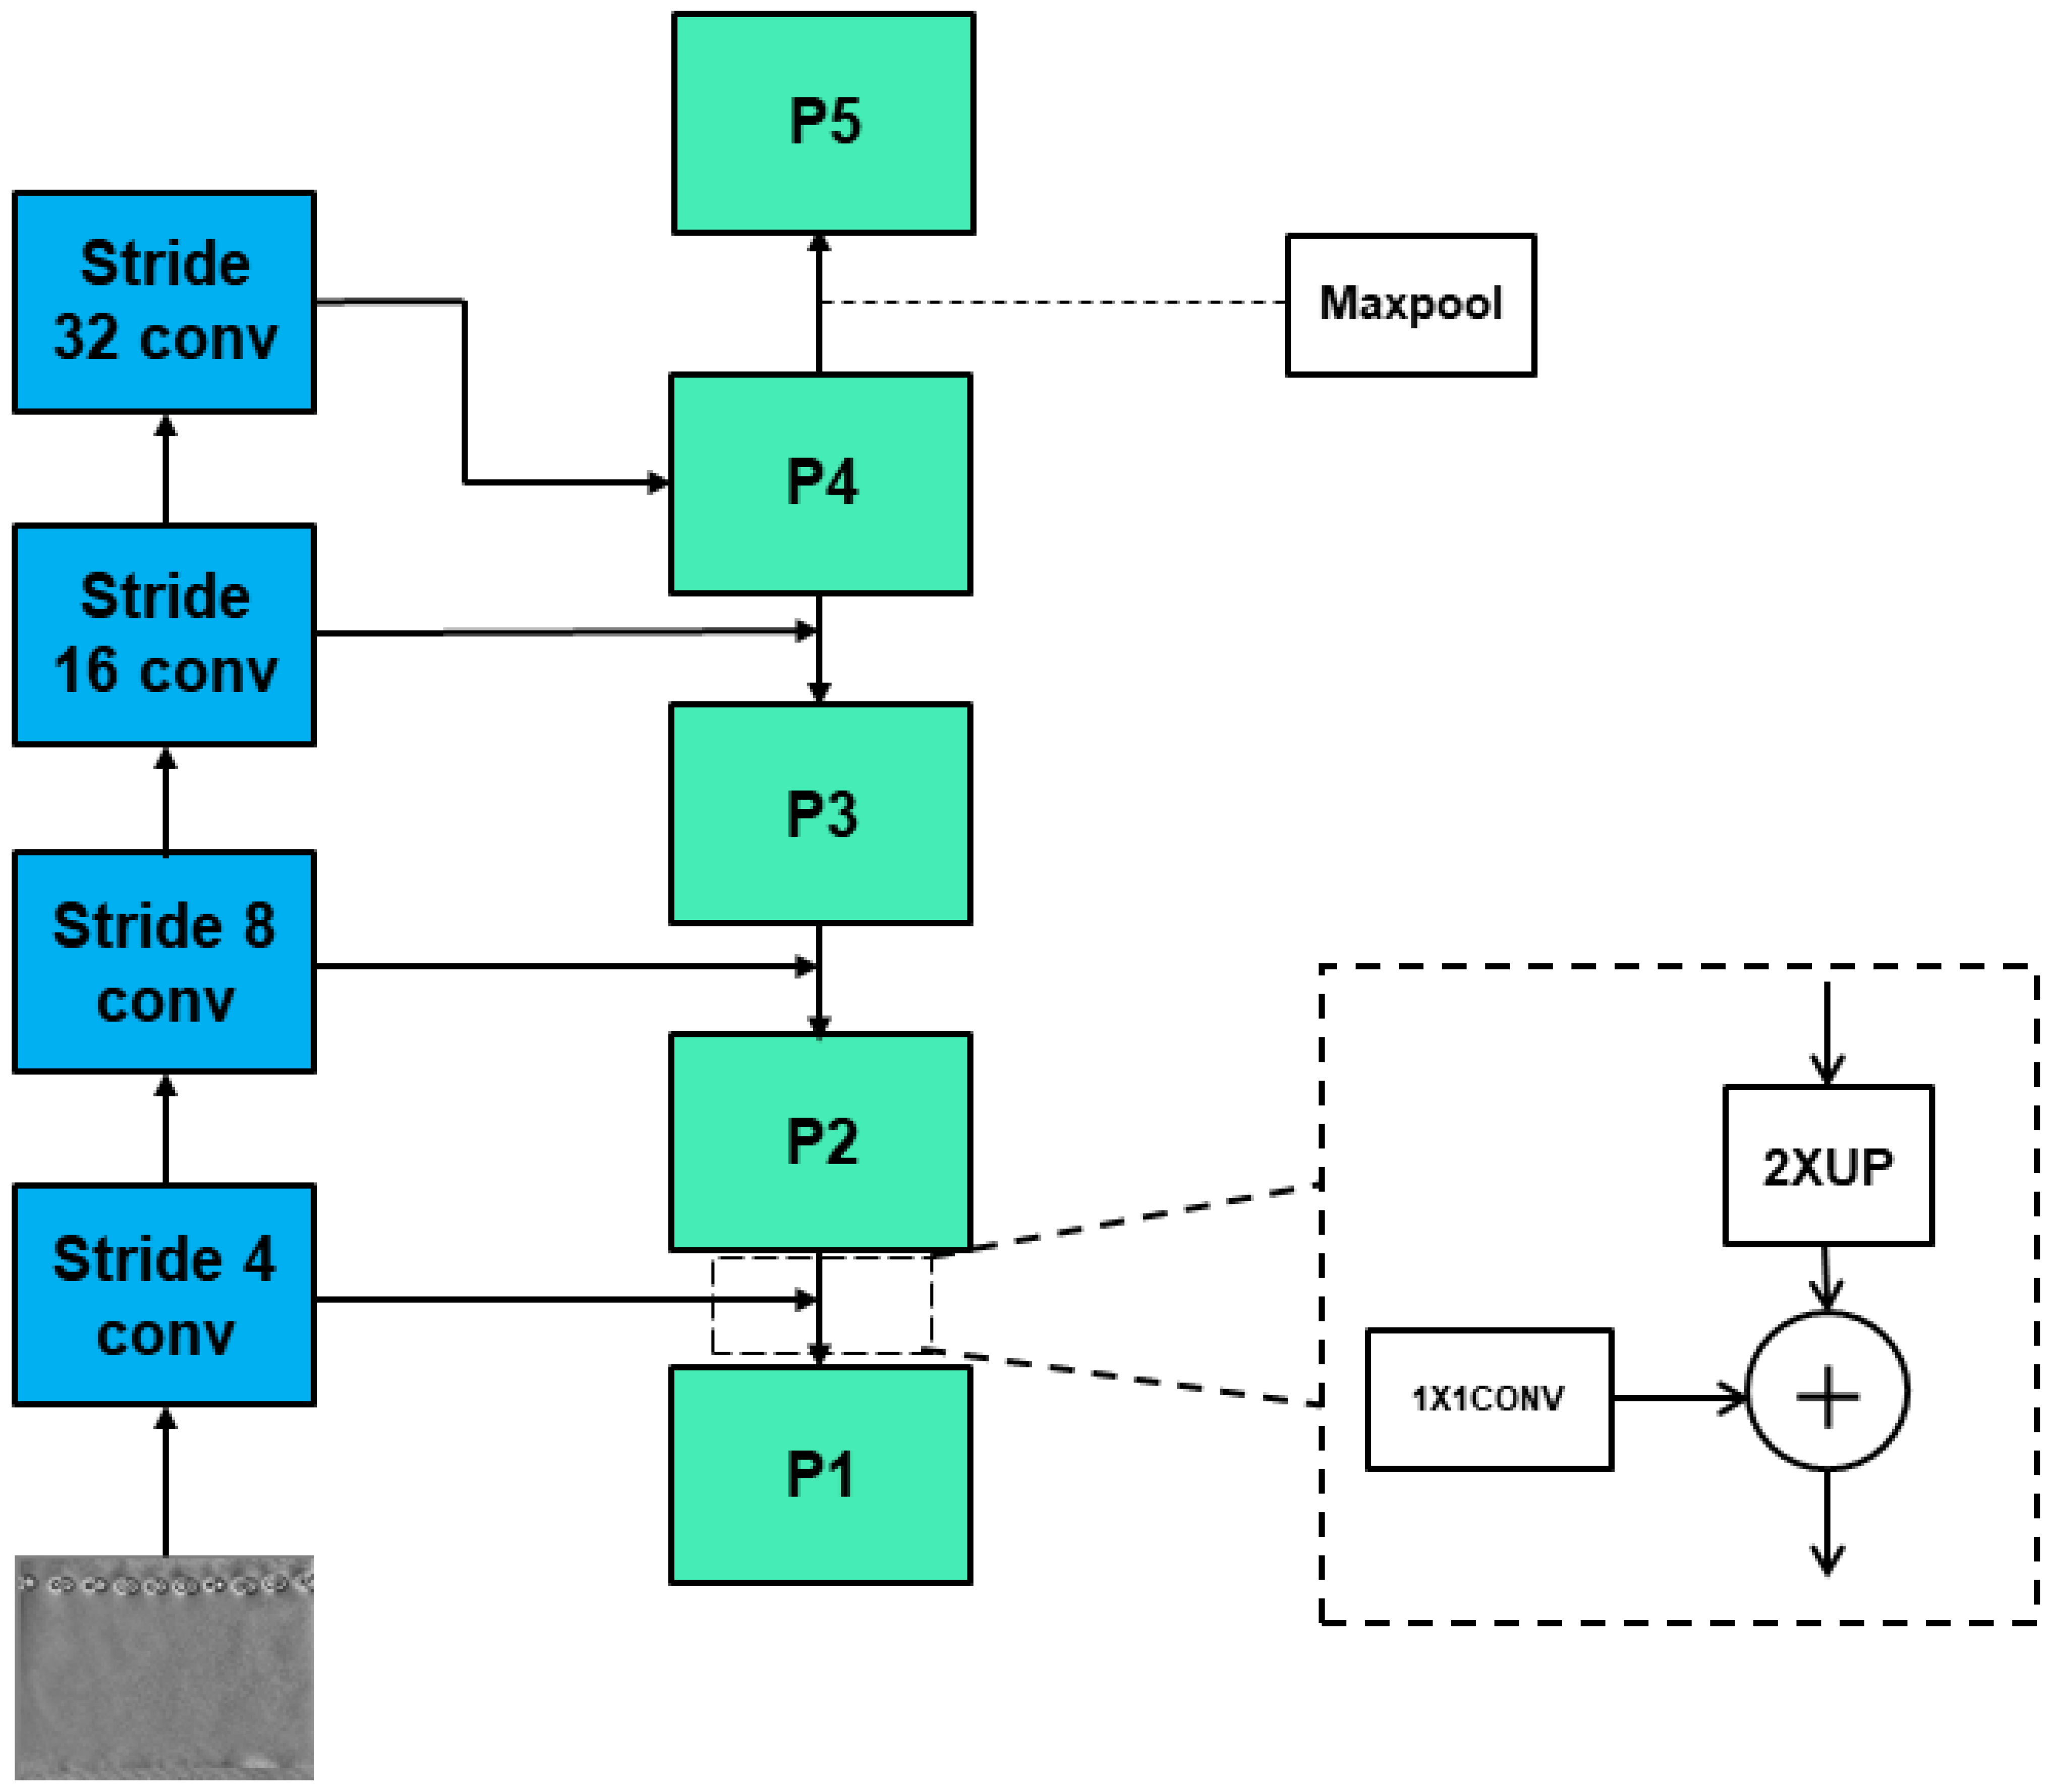
- The high-level feature map of FPN only adds and fuses the adjacent feature maps downward, without upward or cross-scale fusion. Therefore, the high-level feature map does not make full use of the location information of small objects in the low-level feature map. There is still room for improvement in small objects’ detection;
- For the tire crown bubble defect dataset, the defects belong to the detection range of small objects, and we do not need to consider large objects’ detection. Therefore, more low-level feature map information can be fused into high-level feature maps.
3.3. TYFPN: Multi-Directional Fusion Feature Pyramid Network
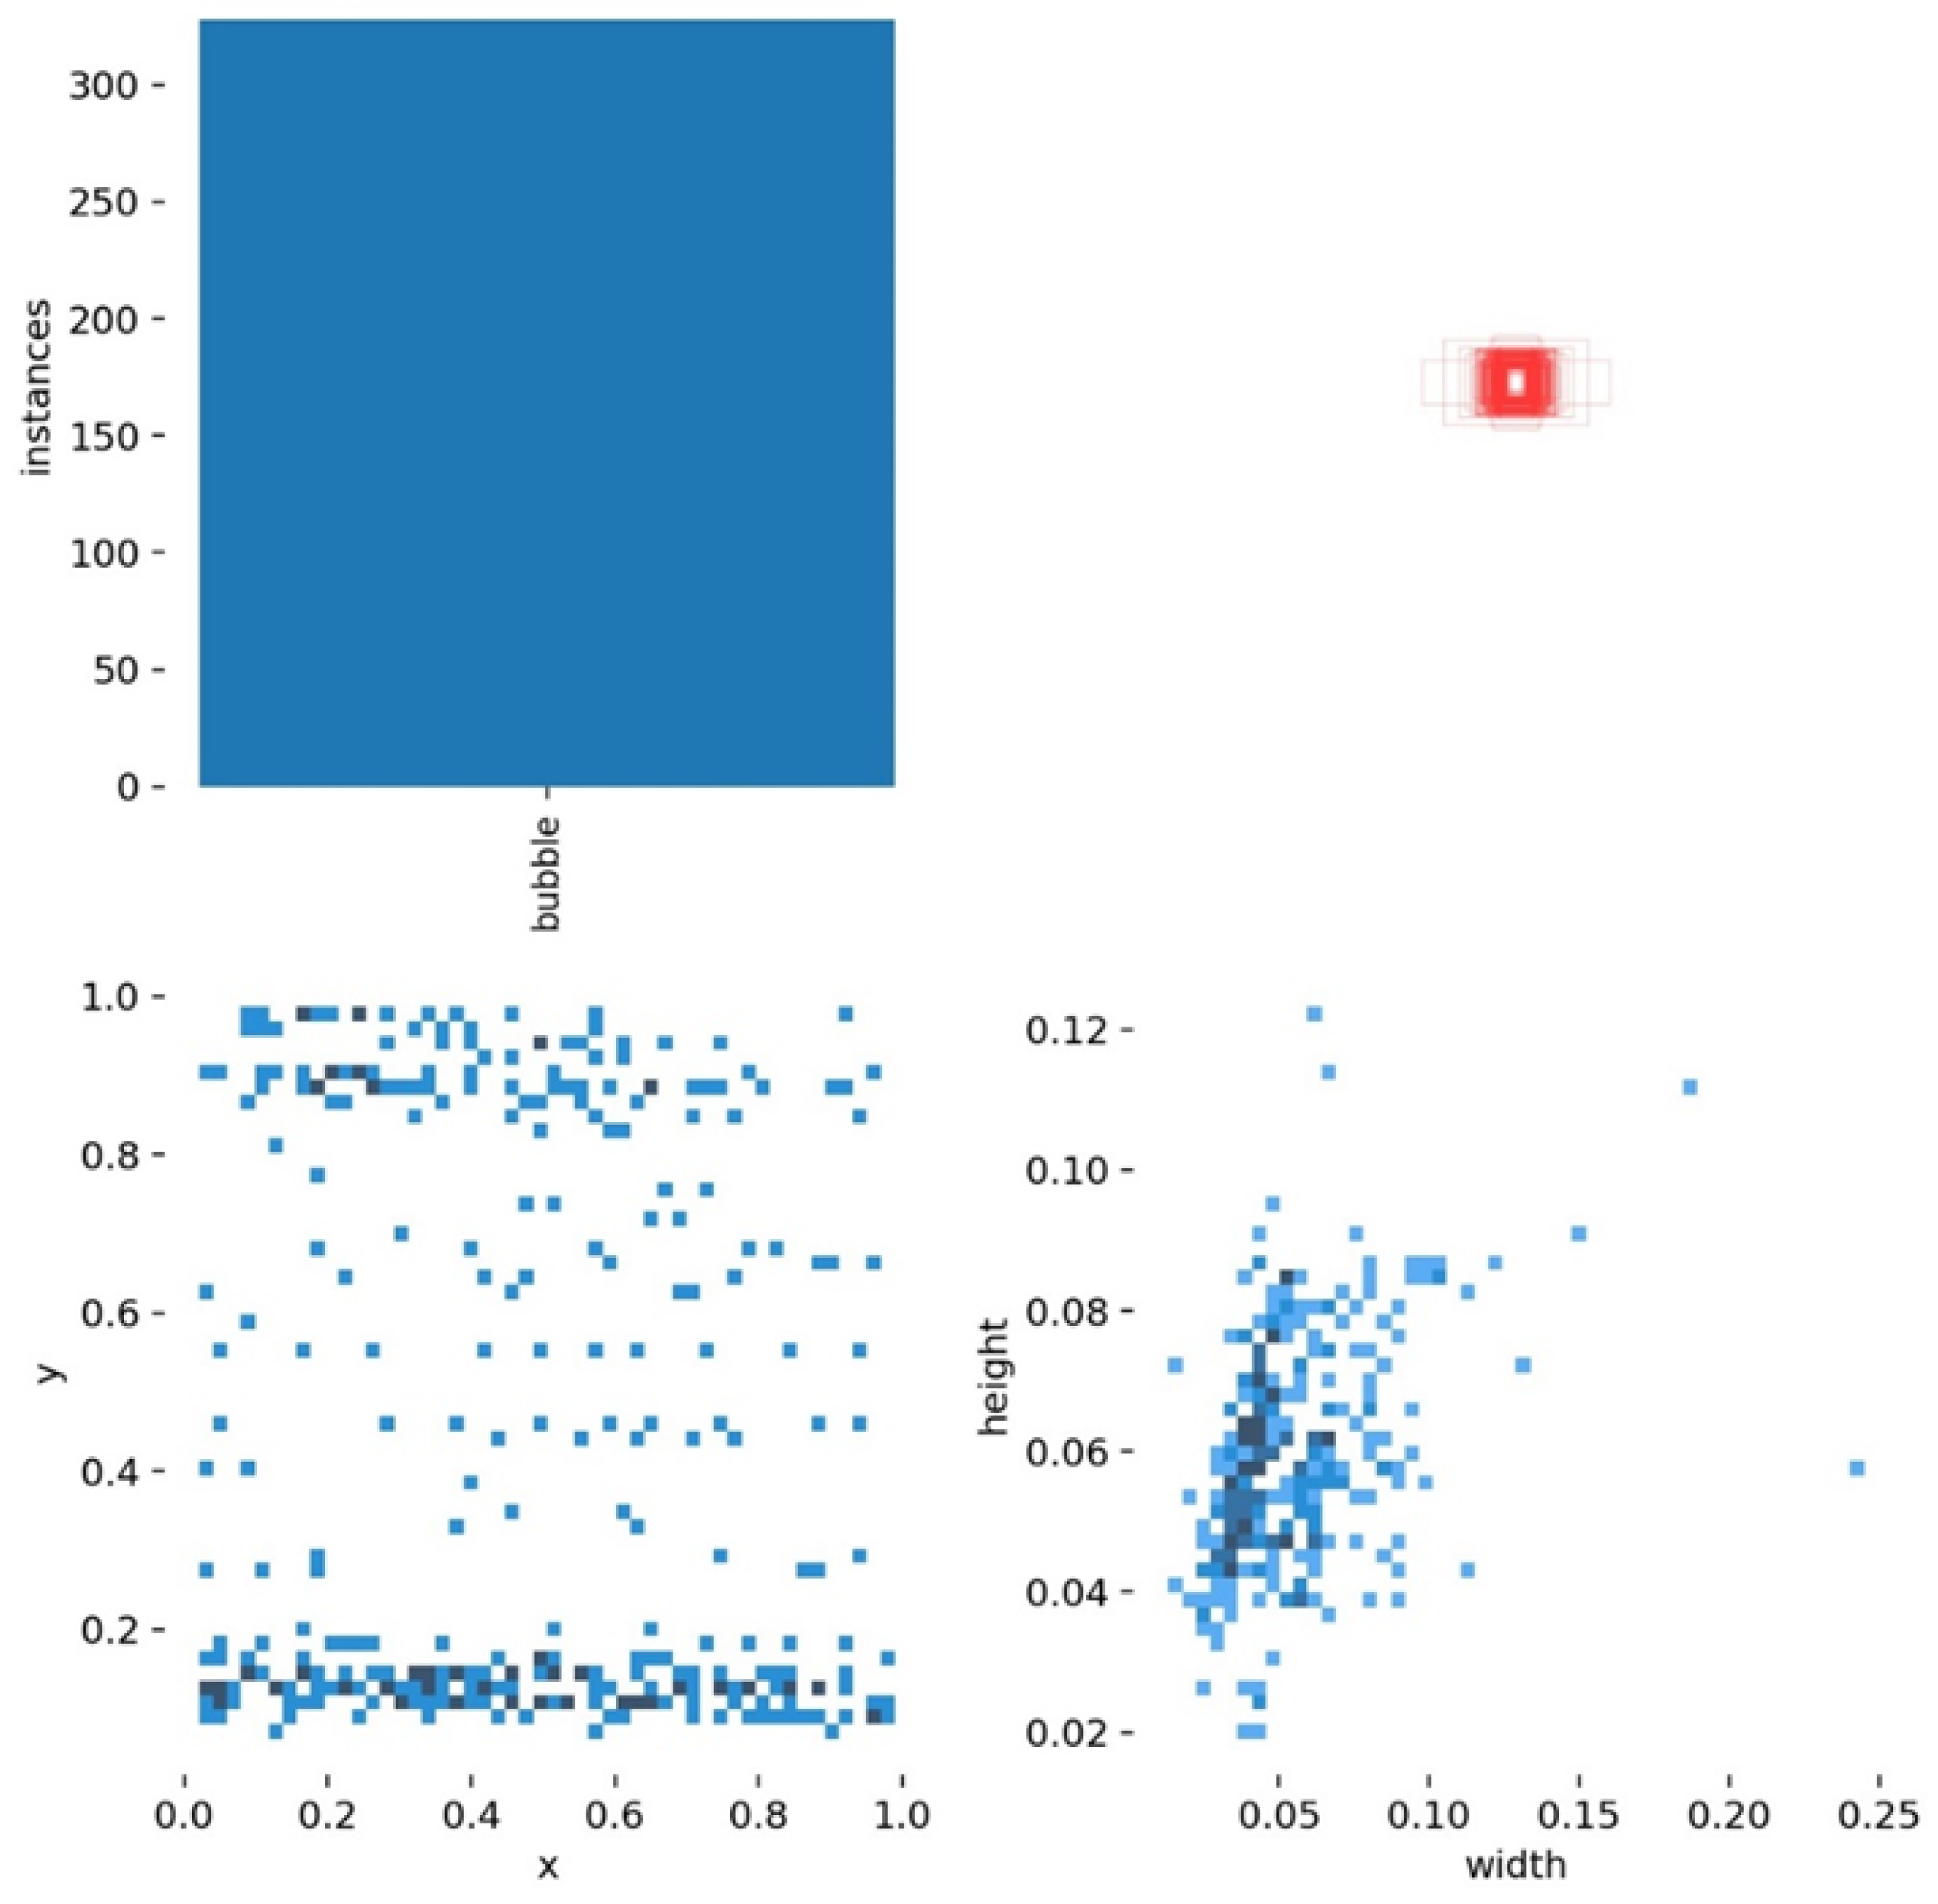
3.4. Anchor Box Setting and Sample Balance
- Step 1
- Set each anchor’s mask to −1, indicating that the anchor is neither a positive sample (objects) nor a negative sample (background);
- Step 2
- Set anchors’ mask to 0, if maximum IoU with all ground-truths is less than 0.3, indicating negative samples;
- Step 3
- Set anchors’ mask to 1, if max IoU with all ground-truths more than 0.7, indicating a positive sample;
- Step 4
- Some ground-truths are not assigned to find the anchor with the largest IoU. If the IoU is greater than 0.3, set this anchor as a positive sample;
- Step 5
- Limit the number of training samples, balance positive and negative samples, and set the ratio of positive and negative samples to 1:1, for a total of 256 samples;
- Step 6
- If the number of positive samples is less than 128, they are filled with negative samples.
3.5. Loss Function
4. Experiment and Analysis
4.1. Experimental Setup
4.2. Bubble Defect Detection Results with Different Algorithms Based on FPN
4.3. Ablation Studies
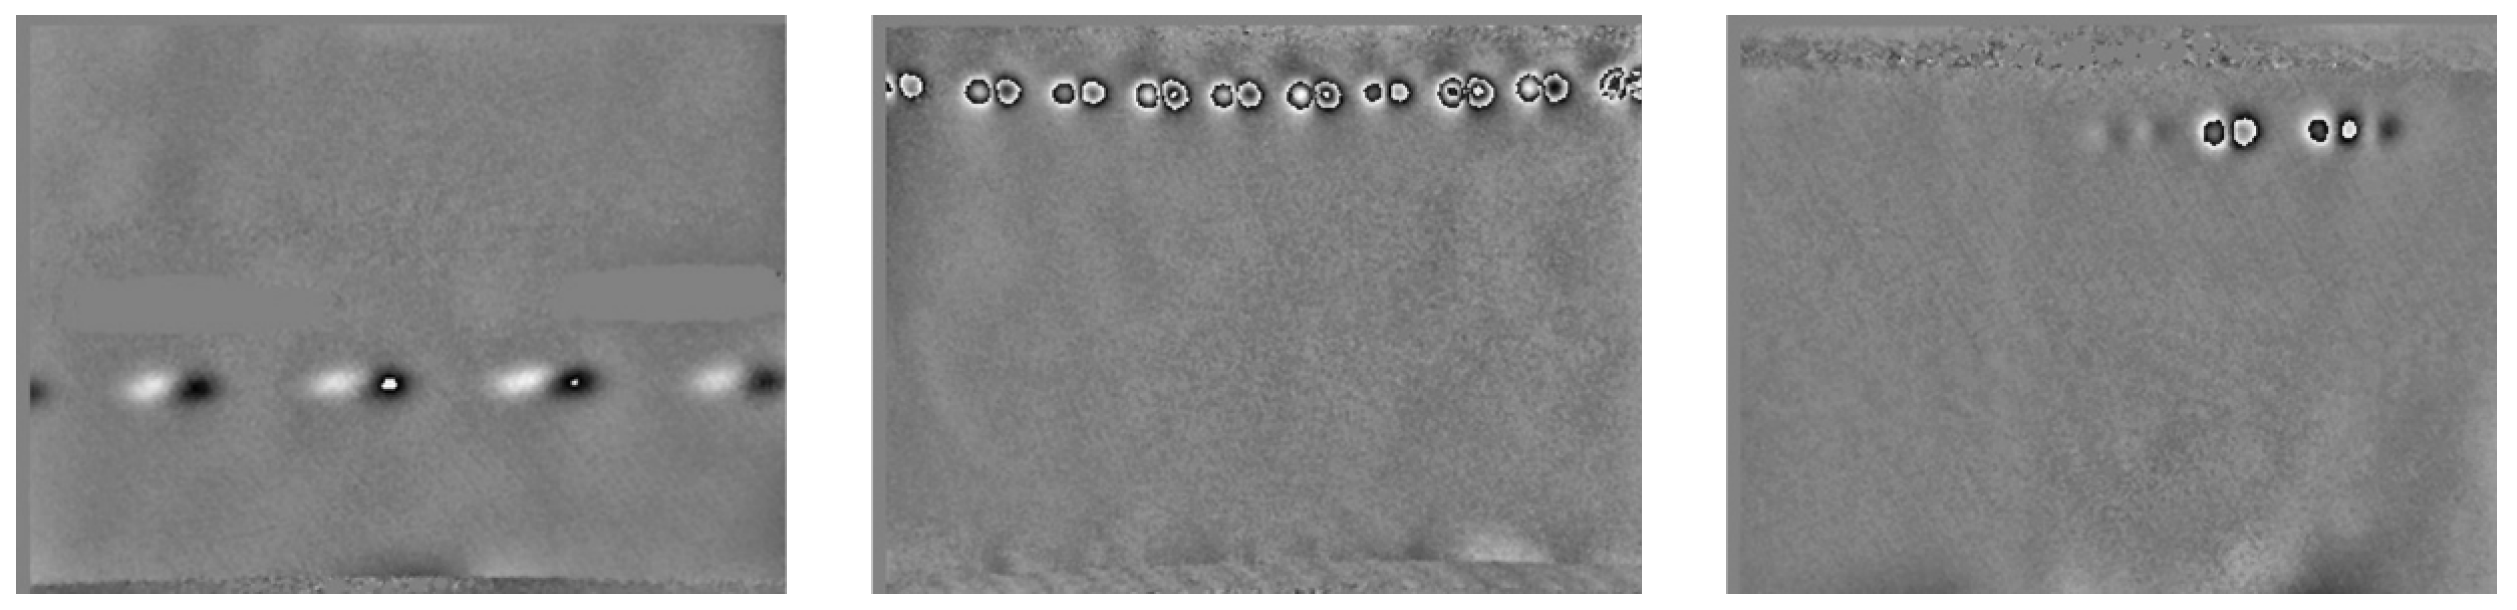
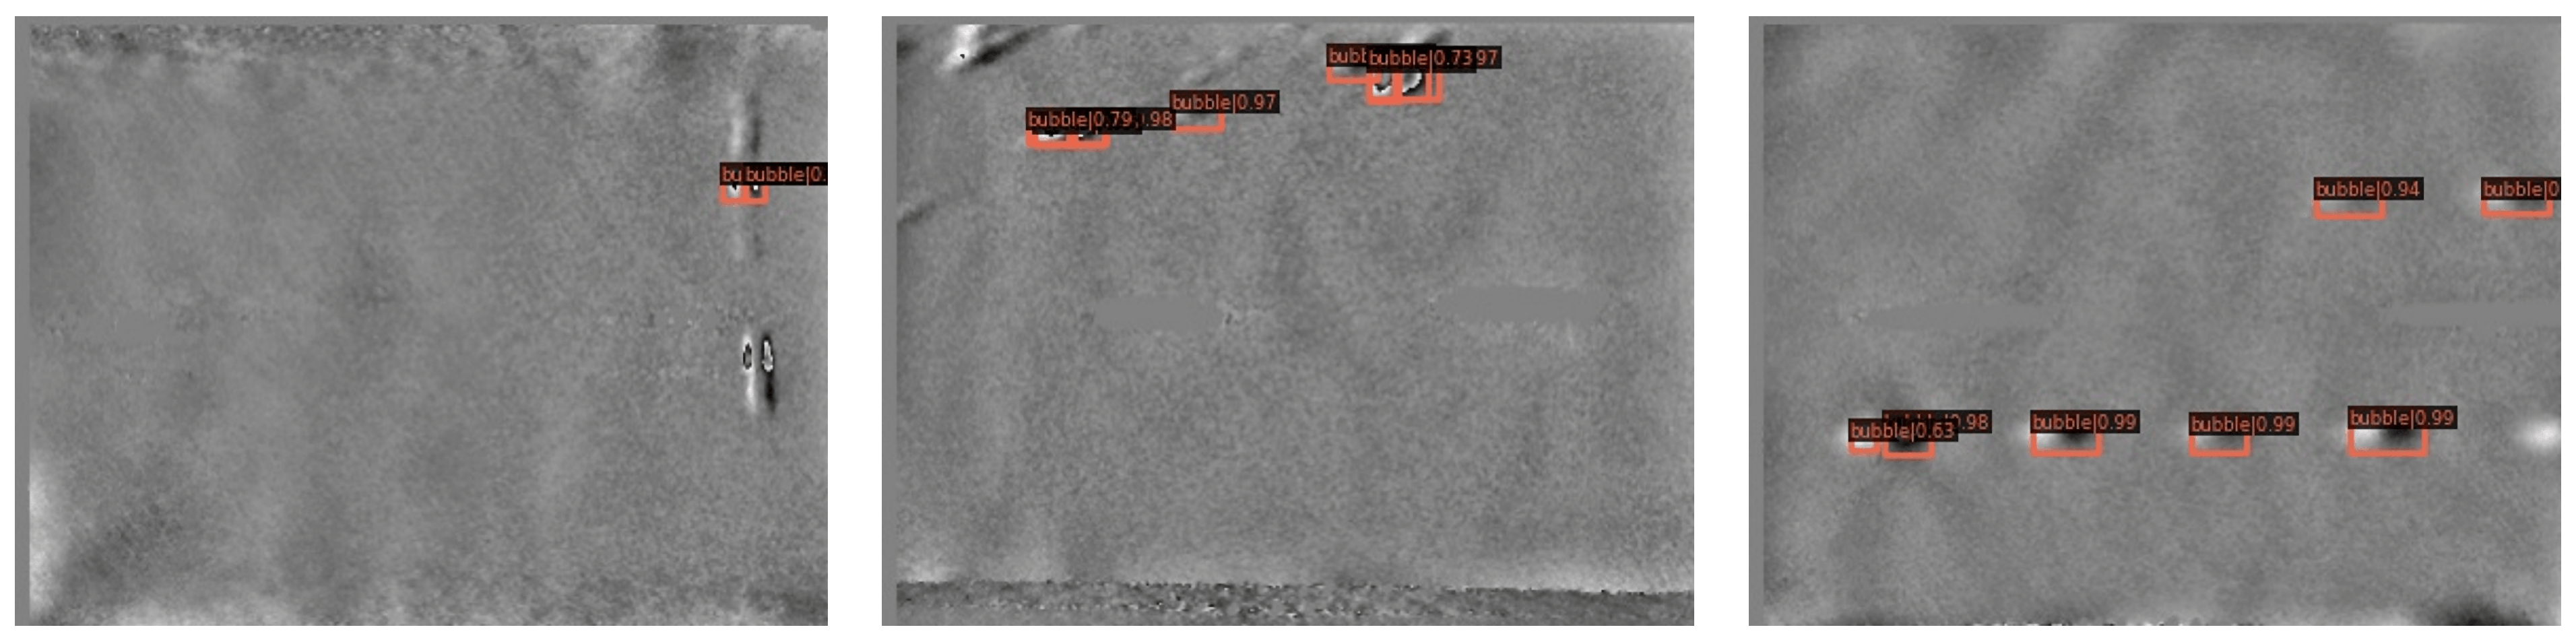
4.4. Study on the Image of Inspection Results
5. Discussion
- Increase the proportion of defect types with low frequency in the dataset, increase the sensitivity of the neural network to it, and reduce the missed detection rate;
- The equipment and environment need to be consistent, and the image sources for training and detection should be the same, such as the same camera and the same tire types, improving the detection stability of neural network;
- Continuously tune and improve neural networks to improve precision and generalization ability.
6. Conclusions
Author Contributions
Funding
Institutional Review Board Statement
Informed Consent Statement
Data Availability Statement
Conflicts of Interest
References
- Erdogan, S. Explorative spatial analysis of traffic accident statistics and road mortality among the provinces of Turkey. J. Saf. Res. 2009, 40, 341–351. [Google Scholar] [CrossRef] [PubMed]
- Guo, Z.; Qin, S.L. High-Precision Detection of Defects of Tire Texture Through X-ray Imaging Based on Local Inverse Difference Moment Features. Sensors 2018, 18, 2524. [Google Scholar] [CrossRef] [PubMed] [Green Version]
- Xiang, Y.; Zhang, C.; Qiang, G. A dictionary-based method for tire defect detection. In Proceedings of the IEEE International Conference on Information and Automation (ICIA), Hailar, China, 28–30 July 2014; pp. 519–523. [Google Scholar]
- Psuj, G. Multi-Sensor Data Integration Using Deep Learning for Characterization of Defects in Steel Elements. Sensors 2018, 18, 292. [Google Scholar] [CrossRef] [PubMed] [Green Version]
- Mei, S.; Wang, Y.; Wen, G. Automatic Fabric Defect Detection with a Multi-Scale Convolutional Denoising Autoencoder Network Model. Sensors 2018, 18, 1064. [Google Scholar] [CrossRef] [PubMed] [Green Version]
- Tsai, D.M.; Wu, S.C.; Chiu, W.Y. Defect Detection in Solar Modules Using ICA Basis Images. IEEE Trans. Ind. Inf. 2013, 9, 122–131. [Google Scholar] [CrossRef]
- Aleksendric, D.; Barton, D.C. Neural network prediction of disc brake performance. Tribol. Int. 2009, 42, 7. [Google Scholar] [CrossRef]
- Acosta, M.; Kanarachos, S. Tire lateral force estimation and grip potential identification using Neural Networks, Extended Kalman Filter, and Recursive Least Squares. Neural Comput. Appl. 2018, 30, 3445–3465. [Google Scholar] [CrossRef]
- Bonini, F.; Manduchi, G.; Mancinelli, N.; Martini, A. Estimation of the braking torque for MotoGP class motorcycles with carbon braking systems through machine learning algorithms. In Proceedings of the 2021 IEEE International Workshop on Metrology for Automotive (MetroAutomotive), Bologna, Italy, 1–2 July 2021; pp. 1–6. [Google Scholar]
- Zheng, Z.; Zhang, S.; Yu, B.; Li, Q.; Zhang, Y. Defect Inspection in Tire Radiographic Image Using Concise Semantic Segmentation. IEEE Access 2020, 8, 112674–112687. [Google Scholar] [CrossRef]
- Wang, R.; Guo, Q.; Lu, S.; Zhang, C. Tire Defect Detection Using Fully Convolutional Network. IEEE Access 2019, 7, 43502–43510. [Google Scholar] [CrossRef]
- Zhu, Q.; Ai, X. The Defect Detection Algorithm for Tire X-Ray Images Based on Deep Learning. In Proceedings of the IEEE 3rd International Conference on Image, Vision and Computing (ICIVC), Chongqing, China, 27–29 June 2018. [Google Scholar]
- Ren, S.; He, K.; Girshick, R.; Sun, J. Faster R-CNN: Towards Real-Time Object Detection with Region Proposal Networks. IEEE Trans. Pattern Anal. 2017, 39, 1137–1149. [Google Scholar] [CrossRef] [PubMed] [Green Version]
- Uijlings, J.R.R.; Van De Sande, K.E.A.; Gevers, T.; Smeulders, A.W.M. Selective Search for Object Recognition. Int. J. Comput. Vison 2013, 104, 154–171. [Google Scholar] [CrossRef] [Green Version]
- Lin, T.Y.; Dollar, P.; Girshick, R.; He, K.; Hariharan, B.; Belongie, S. Feature Pyramid Networks for Object Detection. In Proceedings of the IEEE Conference on Computer Vision and Pattern Recognition (CVPR), Honolulu, HI, USA, 21–26 July 2017. [Google Scholar]
- Liu, S.; Qi, L.; Qin, H.; Shi, J.; Jia, J. Path aggregation network for instance segmentation. In Proceedings of the IEEE Conference on Computer Vision and Pattern Recognition (CVPR), Salt Lake City, UT, USA, 18–23 June 2018; pp. 8759–8768. [Google Scholar]
- Pang, J.; Chen, K.; Shi, J.; Feng, H.; Ouyang, W.; Lin, D. Libra r-cnn: Towards balanced learning for object detection. In Proceedings of the IEEE/CVF Conference on Computer Vision and Pattern Recognition (CVPR), Long Beach, CA, USA, 15–20 June 2019; pp. 821–830. [Google Scholar]
- Liu, S.; Huang, D.; Wang, Y. Learning Spatial Fusion for Single-Shot Object Detection. arXiv 2019, arXiv:1911.09516. [Google Scholar]
- Liu, S.; Huang, D.; Wang, Y. NAS-FPN: Learning Scalable Feature Pyramid Architecture for Object Detection. In Proceedings of the IEEE/CVF Conference on Computer Vision and Pattern Recognition (CVPR), Long Beach, CA, USA, 16–20 June 2019. [Google Scholar]
- Chen, K.; Cao, Y.; Loy, C.C.; Lin, D.; Feichtenhofer, C. Feature Pyramid Grids. arXiv 2020, arXiv:2004.03580. [Google Scholar]
- Guo, P.L.; Chen, J.S.; Lu, J.G.; Dai, B.J.; Shi, D.Y.; Sun, H.L. Research on the Improvement Faster R-CNN Algorithm for Tire X-ray Image Defect Detection. Autom. Panorama 2020, 8, 94–98. [Google Scholar]
- Cui, X.H. Research On Nondestructive Tire Defect Detection and Classifcation Using Deep Learning Technology. J. Saf. Res. 2009, 40, 341–351. [Google Scholar]
- Zhu, M. Phase-Shifting and Shearing Speckle Pattern Interferometry Used in Tire Bubble Detection. Ph.D. Thesis, Tianjin University, Tianjin, China, 2011. [Google Scholar]
- He, K.; Zhang, X.; Ren, S.; Sun, J. Deep residual learning for image recognition. In Proceedings of the IEEE Conference on Computer Vision and Pattern Recognition (CVPR), Las Vegas, NV, USA, 27–30 June 2016. [Google Scholar]
- Hong, M.; Li, S.; Yang, Y.; Zhu, F.; Zhao, Q.; Lu, L. SSPNet: Scale selection pyramid network for tiny person detection from UAV images. IEEE Geosci. Remote Sci. 2021, 19, 1–5. [Google Scholar] [CrossRef]
- Ge, Z.; Liu, S.; Wang, F.; Li, Z.; Sun, J. Yolox: Exceeding yolo series in 2021. arXiv 2021, arXiv:2107.08430. [Google Scholar]
- He, K.; Zhang, X.; Ren, S.; Sun, J. Designing network design spaces. In Proceedings of the IEEE/CVF Conference on Computer Vision and Pattern Recognition (CVPR), Seattle, WA, USA, 13–19 June 2020; pp. 10428–10436. [Google Scholar]
- Zhang, H.; Wu, C.; Zhang, Z.; Zhu, Y.; Lin, H.; Zhang, Z.; Sun, Y.; He, T.; Mueller, J.; Manmatha, R.; et al. ResNeSt: Split-Attention Networks. arXiv 2020, arXiv:2004.08955. [Google Scholar]
- Xie, S.; Girshick, R.; Dollár, P.; Tu, Z.; He, K. Aggregated residual transformations for deep neural networks. In Proceedings of the IEEE Conference on Computer Vision and Pattern Recognition (CVPR), Honolulu, HI, USA, 21–26 July 2017; pp. 1492–1500. [Google Scholar]
- Gao, S.-H.; Cheng, M.-M.; Zhao, K.; Zhang, X.-Y.; Yang, M.-H.; Torr, P. Res2net: A new multi-scale backbone architecture. IEEE Trans. Pattern. Anal. 2019, 43, 652–662. [Google Scholar] [CrossRef] [PubMed] [Green Version]
- Dobes, M.; Andoga, R.; Fozo, L. Sensory integration in deep neural networks. Acta Polytech. Hung. 2021, 18, 245–254. [Google Scholar] [CrossRef]
- Explainable AI: Peering inside the Deep Learning Black Box. Available online: https://www.infoworld.com/article/3315748/explainable-ai-peering-inside-the-deep-learning-black-box.html (accessed on 17 April 2022).


| Optimizer | Stochastic Gradient Descent with Momentum |
| Batchsize | 2 |
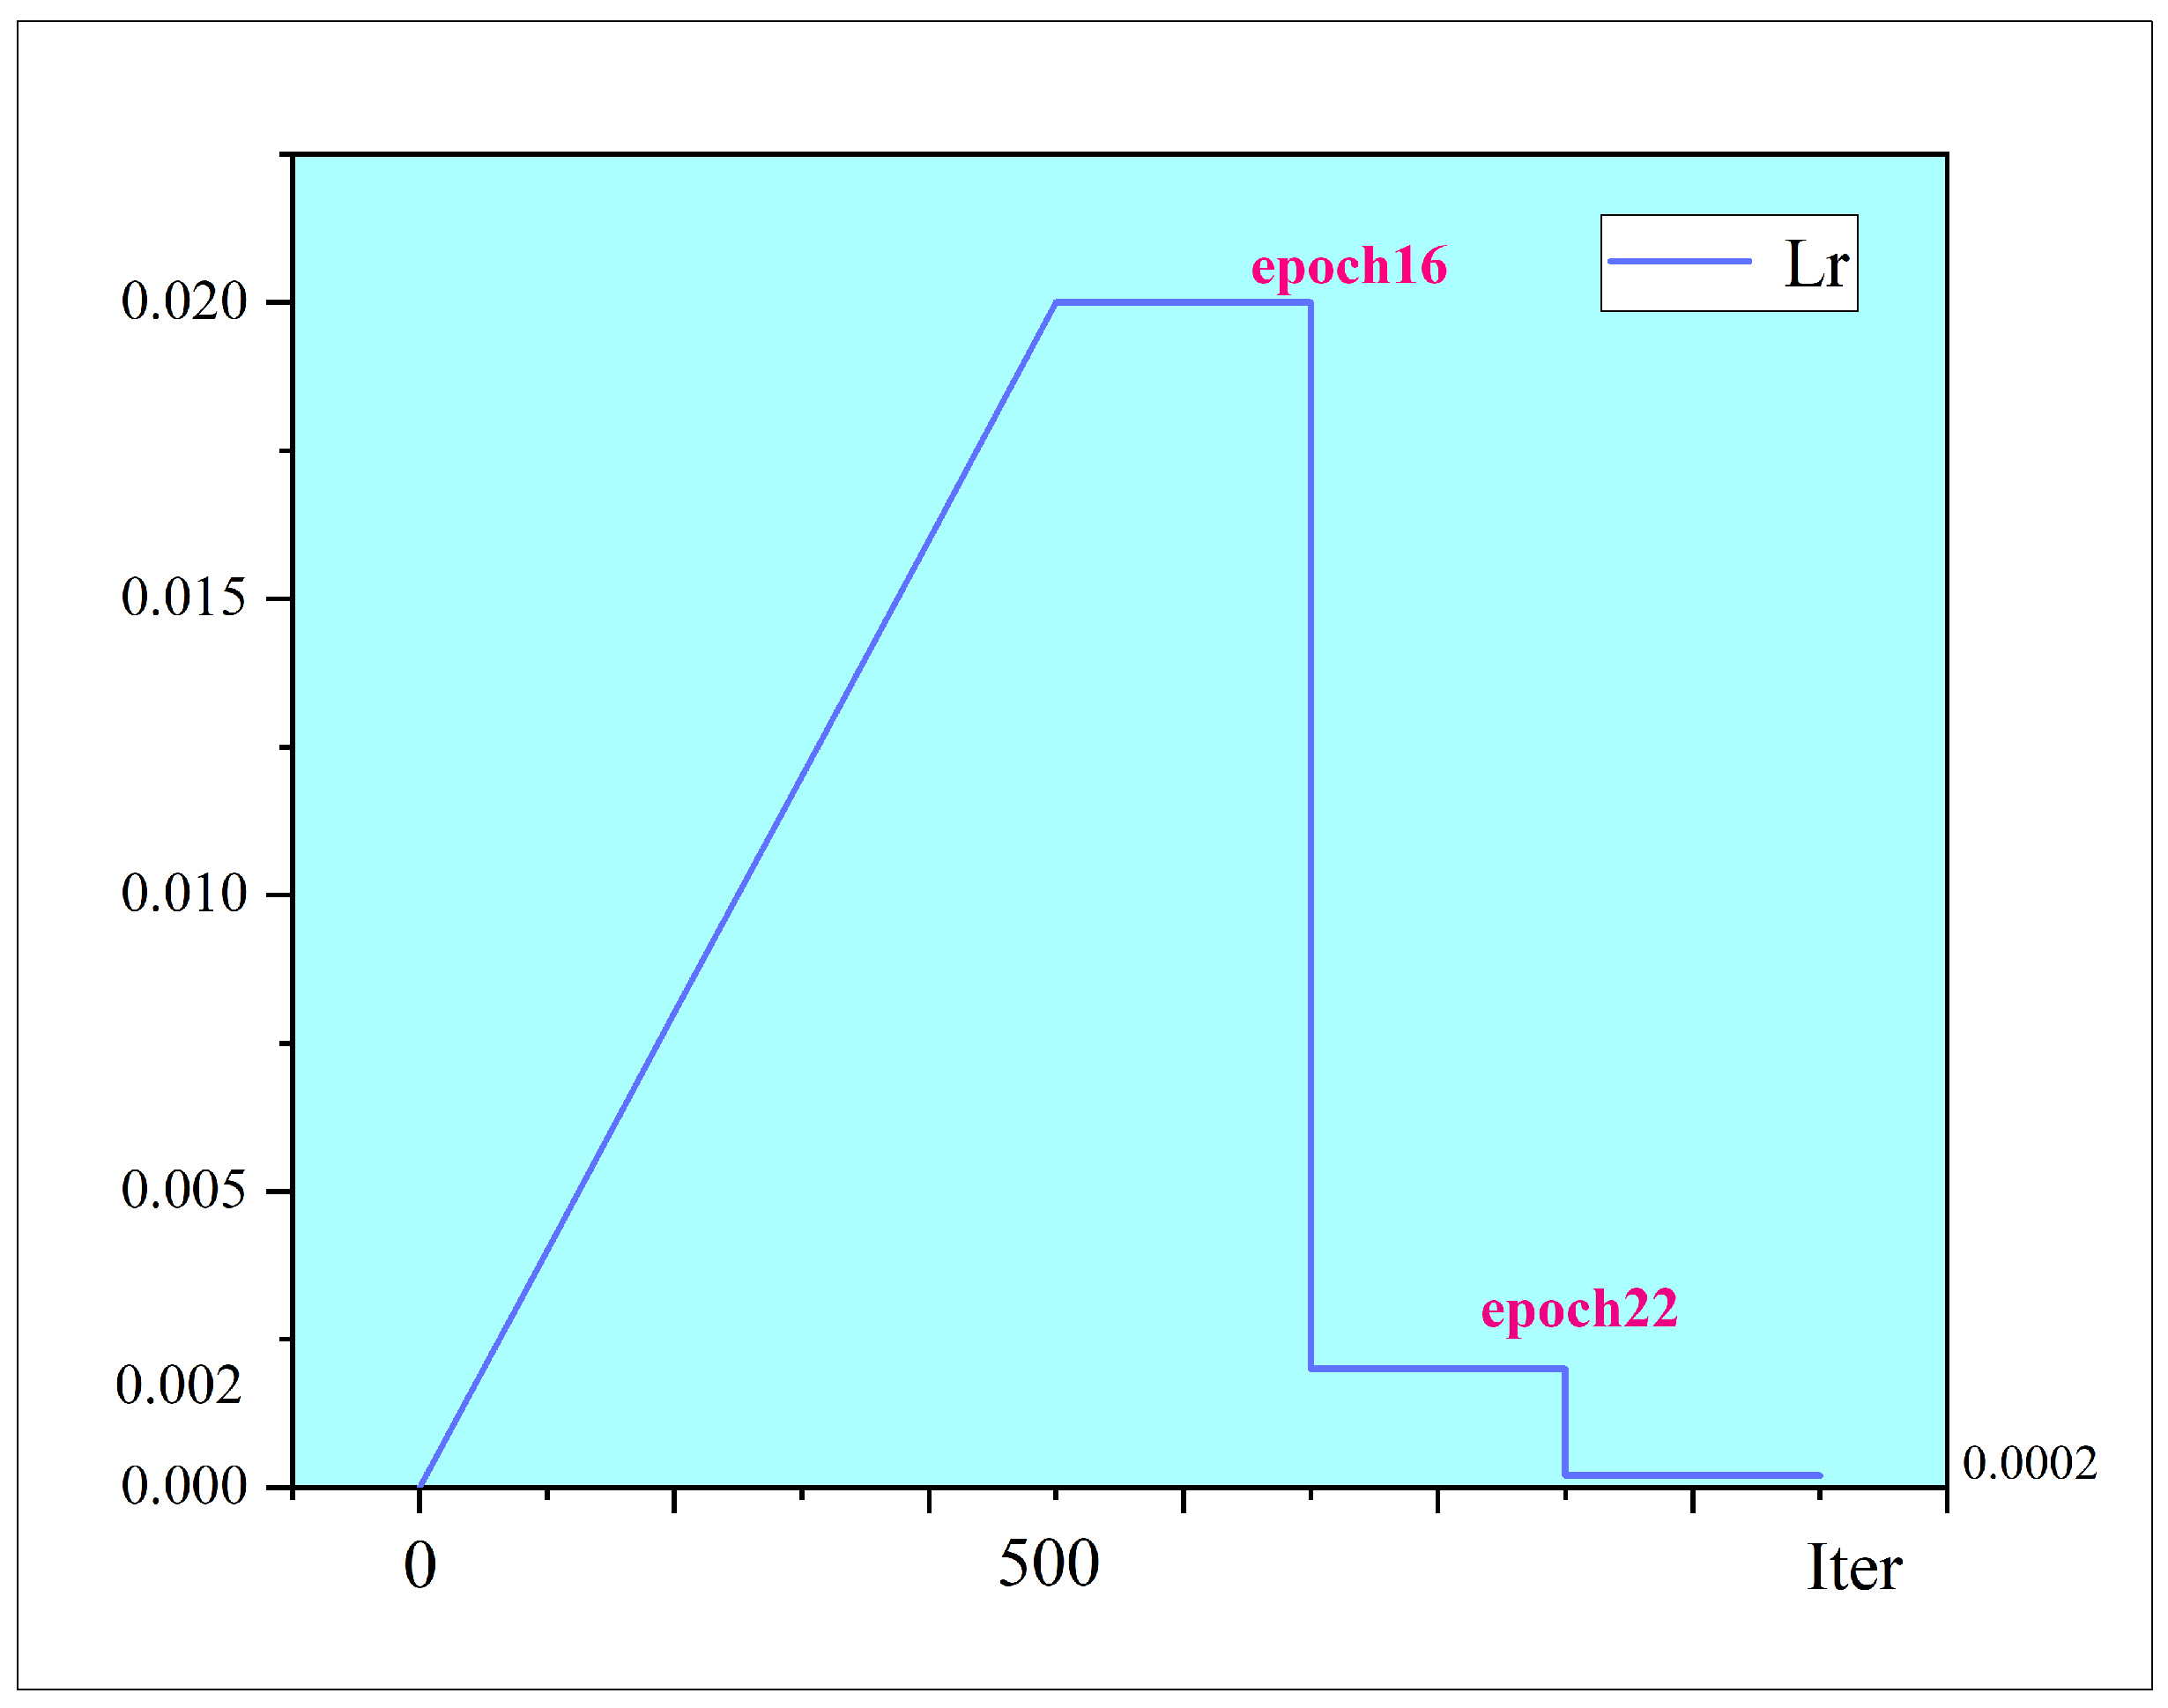
| Max epochs | 24 |
| Environment | Ubuntu20.04 PyTorch1.6 cuda11.1 |
| Frame | MMdetectin2.18 |
| Equipment | GeForce RTX 3080 Intel-croe 11th i7 |
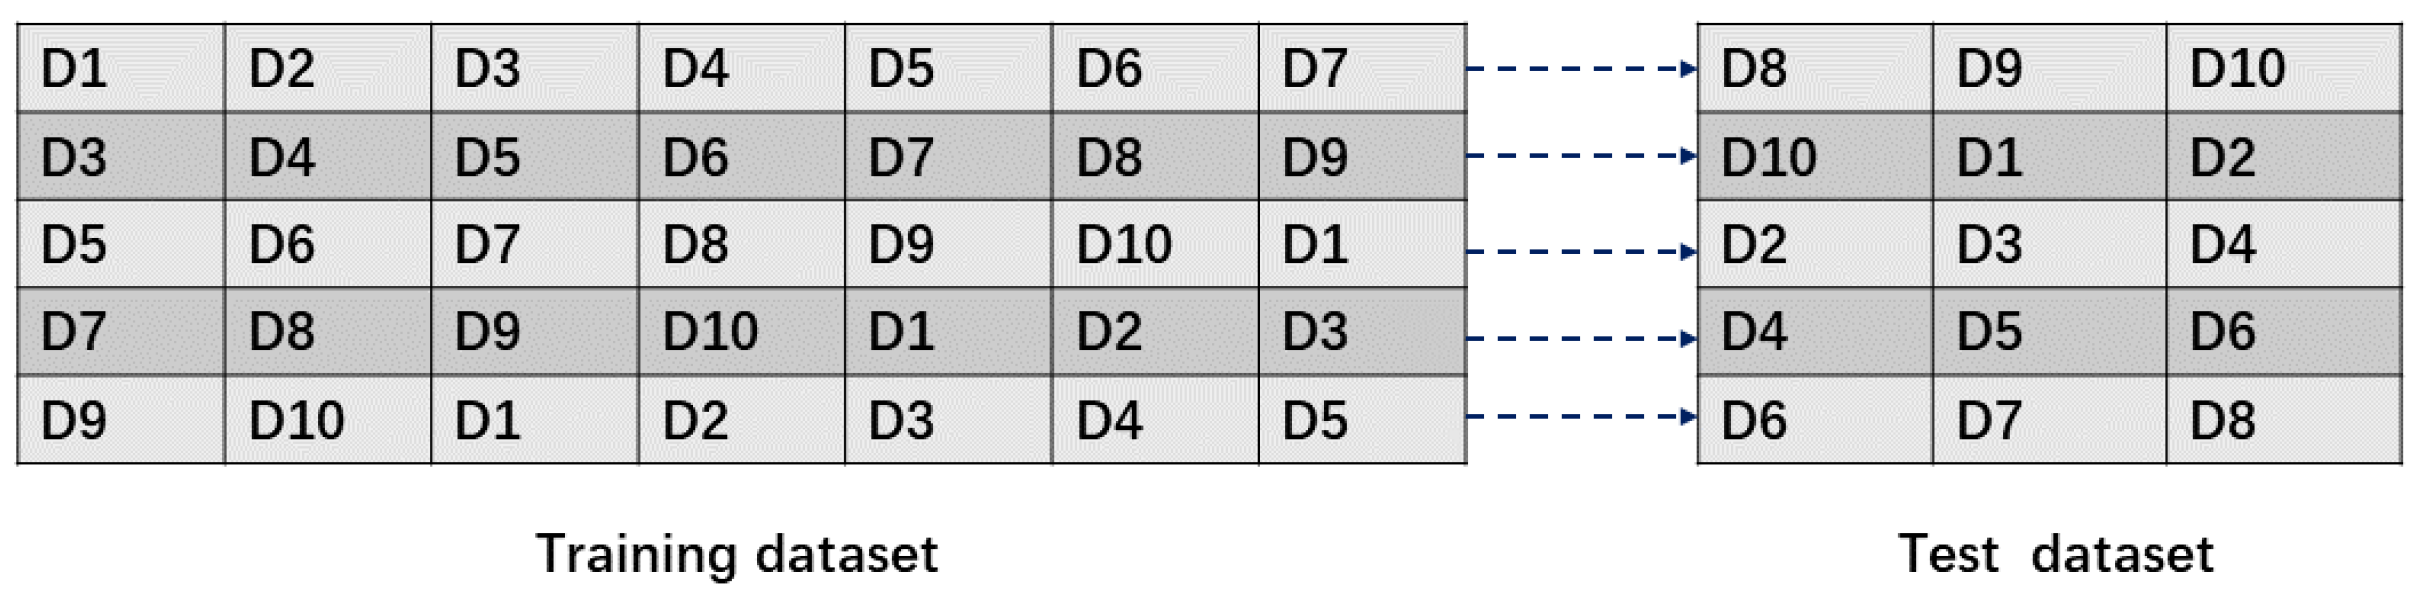
| Dataset type | COCO Dataset |
| Algorithm | mAP [0.5:0.95]% | ||||
|---|---|---|---|---|---|
| 1 | 2 | 3 | 4 | 5 | |
| FasterRCNN-FPN | 50.6 | 50.6 | 48.9 | 50.4 | 48.4 |
| FasterRCNN-FPG | 50.6 | 50.6 | 49.6 | 51.6 | 47.3 |
| FasterRCNN-PAFPN | 50.5 | 50.4 | 50.0 | 52.0 | 47.8 |
| LibraRCNN(BFP) | 51.2 | 50.6 | 48.8 | 52.4 | 47.9 |
| Yolox [26] | 47.4 | 50.3 | 44.3 | 52.0 | 47.8 |
| FasterRCNN-TYFPN | 52.6↑ | 52.8↑ | 51.0↑ | 53.7↑ | 49.2↑ |
| Algorithm | AP0.5% | ||||
|---|---|---|---|---|---|
| 1 | 2 | 3 | 4 | 5 | |
| FasterRCNN-FPN | 92.2 | 91.7 | 89.5 | 93.8 | 89.7 |
| FasterRCNN-FPG | 94.6 | 93.5 | 90.5 | 92.8 | 88.1 |
| FasterCNN-PAFPN | 94.9 | 91.4 | 90.8 | 94.8 | 89.4 |
| LibraRCNN(BFP) | 94.9 | 92.6 | 90.0 | 94.9 | 88.1 |
| Yolox | 89.9 | 91.4 | 86.3 | 94.8 | 89.4 |
| FasterRCNN-TYFPN | 95.1↑ | 94.2↑ | 94.4↑ | 94.7↑ | 90.5↑ |
| Algorithm | mAP [0.5:0.95]% | AP0.5% |
|---|---|---|
| FasterRCNN-FPN | 49.78 | 91.38 |
| FasterRCNN-FPG | 49.94 | 91.90 |
| FasterCNN-PAFPN | 50.14 | 92.26 |
| LibraRCNN(BFP) | 50.18 | 92.10 |
| Yolox | 48.36 | 90.36 |
| FasterRCNN-TYFPN | 51.86 ↑ | 93.78 ↑ |
| Algorithm | mAP [0.5:0.95]% | AP0.5% |
|---|---|---|
| RegNet50 [27] + FPN | 48.84 | 91.20 |
| RegNet50 + TYFPN | 49.58 | 91.36 |
| ResNeSt50 [28] + FPN | 46.92 | 88.4 |
| ResNeSt50 + TYFPN | 49.94 | 91.82 |
| ResNeXt50 [29] + FPN | 48.9 | 91.46 |
| ResNeXt50 + TYFPN | 50.8 | 92.76 |
| Res2Net50 [30] + FPN | 49.16 | 91.48 |
| Res2Net50 + TYFPN | 51.14 | 93.08 |
| ResNet101 + FPN | 49.42 | 91.16 |
| ResNet101 + TYFPN | 51.84 | 93.40 |
| ResNet50 + FPN | 49.78 | 91.38 |
| ResNet50 + TYFPN | 51.86 | 93.78 |
| Algorithm | Speed ms/img |
|---|---|
| FPN | 19.25 |
| TYFPN | 31.25 |
Publisher’s Note: MDPI stays neutral with regard to jurisdictional claims in published maps and institutional affiliations. |
© 2022 by the authors. Licensee MDPI, Basel, Switzerland. This article is an open access article distributed under the terms and conditions of the Creative Commons Attribution (CC BY) license (https://creativecommons.org/licenses/by/4.0/).
Share and Cite
Yang, S.; Jiao, D.; Wang, T.; He, Y. Tire Speckle Interference Bubble Defect Detection Based on Improved Faster RCNN-FPN. Sensors 2022, 22, 3907. https://doi.org/10.3390/s22103907
Yang S, Jiao D, Wang T, He Y. Tire Speckle Interference Bubble Defect Detection Based on Improved Faster RCNN-FPN. Sensors. 2022; 22(10):3907. https://doi.org/10.3390/s22103907
Chicago/Turabian StyleYang, Shihao, Dongmei Jiao, Tongkun Wang, and Yan He. 2022. "Tire Speckle Interference Bubble Defect Detection Based on Improved Faster RCNN-FPN" Sensors 22, no. 10: 3907. https://doi.org/10.3390/s22103907
APA StyleYang, S., Jiao, D., Wang, T., & He, Y. (2022). Tire Speckle Interference Bubble Defect Detection Based on Improved Faster RCNN-FPN. Sensors, 22(10), 3907. https://doi.org/10.3390/s22103907