Abstract
Like smart phones, the recent years have seen an increased usage of internet of things (IoT) technology. IoT devices, being resource constrained due to smaller size, are vulnerable to various security threats. Recently, many distributed denial of service (DDoS) attacks generated with the help of IoT botnets affected the services of many websites. The destructive botnets need to be detected at the early stage of infection. Machine-learning models can be utilized for early detection of botnets. This paper proposes one-class classifier-based machine-learning solution for the detection of IoT botnets in a heterogeneous environment. The proposed one-class classifier, which is based on one-class KNN, can detect the IoT botnets at the early stage with high accuracy. The proposed machine-learning-based model is a lightweight solution that works by selecting the best features leveraging well-known filter and wrapper methods for feature selection. The proposed strategy is evaluated over different datasets collected from varying network scenarios. The experimental results reveal that the proposed technique shows improved performance, consistent across three different datasets used for evaluation.
1. Introduction
Internet of things (IoT) is an evolving technology that offers a platform for different gadgets to automate activities in various areas. The idea of the “Internet of Things” (IoT) is utilized in numerous fields of data and communication designing. According to a recent study presented in Ref. [1], the market size of worldwide IoT can reach USD 1567 billion by 2025. The ubiquitous nature and ease of use enables IoT devices to sense and transmit data for numerous advanced applications. It is anticipated that the number of IoT gadgets will reach 75 billion by 2030 [2].
IoT devices transmit data via communication mediums, which makes them vulnerable to various security attacks [3]. Traditional network security models designed for conventional networks become inefficient for IoT-based systems due to their low computational and storage capacities and inability to install frequent security updates.
Botnet is a threat that takes advantage of the security lapses of IoT. More precisely, botnets are networks consisting of nodes that were infected by malware, which turned them into bots that can attack any system as a response to orders of a botmaster. Many destructive DDoS attacks have been launched using IoT botnets; Mirai is one notable example. Mirai compromised 100,000 IoT devices in the span of just a few months and created a large botnet out of them. Mirai botnet was then used to generate the highest rated DDoS attacks of almost 1.2 Tbps causing Twitter and GitHub to go offline for their users [1].
With increasing number of threats and inability of IoT devices to enhance security, users cannot depend just on updates for each security vulnerability. Therefore, more consideration should be given to investigate security vulnerabilities, their identification, classification and recovery of IoT devices after the attacks. This makes an intrusion detection system (IDS) essential for IoT.
Network traffic generated from IoT devices follows specific patterns of variable nature depending upon the application and scenario. The traffic data can be given input to various machine-learning (ML) algorithms to perform traffic prediction [4]. Moreover, ML can be used as one of the most efficient computational models to be effectively used in the IoT gadgets for threat prediction and detection without human supervision [5,6].
The viability of machine-learning methods has empowered research scientists to utilize learning models in IoT domains to improve detection and identification among IoT gadgets. In Ref. [7], two machine-learning models were used to guard IoT sites against DDoS attacks. The proposed technique can identify as well as classify the attacks. For reaching a productive solution utilizing a machine-learning algorithm, an appropriate real-world dataset is exceptionally fundamental along with a feature selection method [8,9]. Although, a lot of work has been performed, there is still a need for an efficient feature selection technique based on an algorithm that can be trained on consumer IoT devices to effectively recognize IoT botnet attacks with an increased detection rate and reduced false alarms.
This paper proposes a model that offers a lightweight solution to detect anomalous behavior in resource-constrained IoT devices. The proposed solution makes use of the one-class K-nearest neighbor (KNN), which does not need anomalous data to train a model. One-class KNN is a specific machine-learning strategy in which, rather than grouping an instance in one of the different pre-characterized patterns, the instance is modeled as a single pattern and used to perceive whether a new sample belongs to that pattern or not. For reduction in computation power and ML decision time, feature selection (consisting of wrapper and filter method) is used along with one-class KNN, which has shown the best performance among one-class classifiers [10]. For gaining deep insight into features, a customized script of feature extraction is used. Feature space of datasets was reduced by almost 72%; only important features that had an impact on performance were chosen. This technique shows a satisfactory performance by achieving an F1-score of 98% to 99% on different IoT datasets.
2. Related Work
ML approaches are known to be efficient in securing IoT networks when used with appropriate datasets [11,12]. Many researchers used different supervised and unsupervised approaches for detecting and blocking attacks in IoT networks. In utilizing ML algorithms for the security of IoT networks, researchers have used synthetically generated datasets, e.g., CIDDS-001, UNSWNB15 and NSL-KDD [13], to name a few. A significant problem is finding appropriate datasets, as well as a proper feature selection method [1].
Authors in Ref. [14] used a combination of machine-learning strategies and parallel data processing for detecting IoT botnet attacks. For reducing the size of training data, preprocessing was applied to clean the raw data. Because of high computational cost, the proposed work could only be applied on high-energy nodes. Researchers in Ref. [15] developed a solution for the detection of IoT botnet using deep learning. Autoencoder was used to detect the malicious communication, which is computationally expensive. The suggested solution detected the IoT botnet with zero false positive rate (FPR). A total of 115 features were used to train the algorithms, causing an overhead on resources. In Ref. [16], the researchers suggested a framework based on ML to detect the IoT botnet in large networks with an accuracy of 94%. The multiclass algorithm was trained with the selected features. However, the specific details of the features were not provided. In Ref. [17], the authors suggested an IoT botnet detection framework based on host features. A machine-learning algorithm was trained using the synthetic dataset, making the solution less reliable. Moreover, feature selection was also not used; rather, the machine-learning algorithm was trained with numerous features. The dataset diversity was not taken into account, which is important to check the scalability of the system.
The authors in Ref. [18] used a supervised learning algorithm to secure a smart home by detecting intrusions. The proposed framework considered three cases. First, the IoT devices were grouped based on their conduct in ordinary scenarios. Second, during an attack, the malicious packets were distinguished based on their characteristics. Finally, the attack was classified based on its nature. In Ref. [19], the authors proposed a technique to secure a smart home by using a supervised algorithm (support vector machine) to distinguish between normal and abnormal behavior. In Ref. [20], the security of an IoT domain was provided by constantly monitoring network traffic. A total of 28 different gadgets were used to attain normal traffic behavior, and then, a classification algorithm was used to classify normal and abnormal traffic attributes.
In Ref. [21], the detection of different attacks, e.g., DDoS, data type probing, etc. was performed with the help of machine-learning algorithms. The performance of various algorithms was also assessed, and random forest was found to be effective. In Ref. [22], the proposed scheme used the dataset NSL-KDD, which is a generic dataset, not related to the IoT environments. Moreover, an ineffective feature selection method was used to reduce the redundancy of data. The authors in Ref. [7] designed a framework called flow guard, which can be used for the defense against IoT botnet DDoS attacks. Variation in traffic volume was used to detect a DDoS attack generated by the IoT botnet. Long short-term memory algorithm was used for the detection. The classification accuracy was about 99%.
Researchers in Ref. [23] proposed a deep-learning-based botnet detection in IoT for highly imbalanced datasets. For the improvement of the imbalanced class, additional samples of that class were generated. A real-world IoT dataset was used to train a deep recurrent neural network [24]. The proposed solution was able to detect the IoT botnet with a 99% of F1-score. The complexity due to deep-learning methods creates a deployment problem in IoT networks, as the devices are resource constrained. In Ref. [25], the authors proposed a decision-tree-based machine-learning approach to detect IoT botnets. A dimensionality reduction method was introduced to enhance the machine-learning performance. Results indicated that the decision tree combined with random projection was able to detect the IoT botnet with 100% accuracy. However, the dimensionality reduction process results in some amount of data loss. To optimize the detection accuracy of IoT botnets, ensemble learning was introduced by the researchers in Ref. [26]. The algorithms from supervised, unsupervised and regression learning were chosen to enhance accuracy and reduce the number of features at the time of training. Ensemble learning requires high computation power, as multiple models need to be built.
Most of the above-discussed techniques provided good solutions with an accuracy of more than 90%. However, they are either computationally expensive due to employing costly machine-learning models, or the selected dataset is generic and not specific to IoT environments. Moreover, selecting a large number of features affects the detection efficiency of an algorithm in IoT environments. Therefore, in the proposed technique, we present an efficient feature selection mechanism that renders it a lightweight solution for IoT devices. Moreover, to reduce the computational overhead, we utilized a one-class classifier to obtain a satisfactory detection rate along with low false-alarm rates.
3. Proposed Methodology
In the proposed work, we considered datasets generated in three different labs as mentioned in Refs [27,28,29]. A real consumer IoT gadget network was utilized to produce traffic in these labs, where real-time data of normal and malware traffic were captured. Three types of IoT botnets, Mirai, Bash lite and Torii, were deployed in the network. These three datasets are made publicly available by the researchers and are provided in PCAP formats. The PCAP formats are typically related to network analyzer programs, such as Wireshark. They generally contain the information extracted from packets within a network. The PCAP files can be analyzed to discover the network running state and can be used to detect any problem that occurred in the network. Moreover, the PCAP files can be utilized to search for the information transmitted between the hosts inside or outside of the network. The system architecture is shown in Figure 1, which represents the overall model of the proposed solution. The mechanism of the proposed solution is outlined in Algorithm 1. The methodology of the proposed work is divided into the following stages.
| Algorithm 1: Botnet detection using one-class KNN | |
| Input: datasets d1, d2, d3 | |
| 1. | Convert datasets d1, d2, d3 into PCAP format |
| 2. | Apply filtering based on source and destination IP |
| 3. | |
| 4. | Data preprocessing to eliminate missing, infinite, NAN and HEX values |
| 5. | Perform feature selection using |
| 6. | Filter method |
| 7. | Wrapper method |
| 8. | End feature selection |
| 9. | For each dataset d1, d2, d3 apply one-class KNN |
| 10. | Load the training dataset |
| 11. | Choose the value of k |
| 12. | Train the model |
| 13. | Load the test dataset |
| 14. | For each point in the test data until point = NULL |
| 15. | Find Euclidian distance d to all training data points |
| 16. | Store d in a list L and sort it |
| 17. | Choose the first k points |
| 18. | Assign class to the test points |
| 19. | End For |
| 20. | End For |
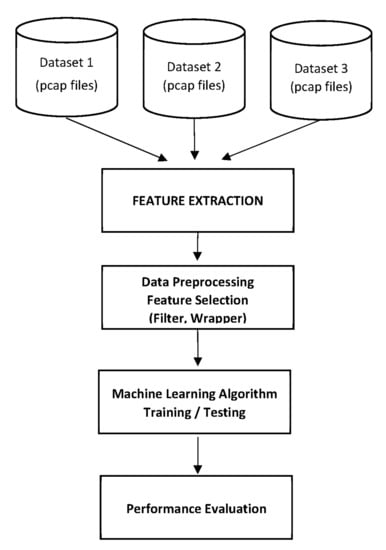
Figure 1.
System architecture model.
3.1. Data Assortment
A real-time IoT device network traffic dataset was obtained from three different IoT labs [27,28,29] that contained benign and malicious traffic. Consumer IoT devices were used by the labs to generate the dataset. All the datasets were in PCAP file format, which gave us the ability to thoroughly analyze the data at the packet and frame level. The three datasets were labeled by their source, which helped in distinguishing the generated results for each dataset.
3.2. PCAP Filtering
PCAP filtering is a method to filter out specific packets. If the source IP is of interest, the source IP filter can be applied, and the packets will be shown with that source IP. PCAP files of each IoT device were filtered based on some specific filters. For this purpose, the broadly utilized network monitoring tool Wireshark was used. Wireshark is a free and open-source tool used to analyze network traffic. It captures the traffic progressively and stores it in a PCAP file for later examination. PCAP files are the files in which all IoT gadgets’ captured traffic is available. Once the PCAP file is loaded in Wireshark, it is reviewed for protocols and fields. The IP addresses of IoT gadgets are available in each dataset, so it was convenient to separate PCAP files for each IoT gadget. To separate traffic for an IoT gadget, a filter based on source and destination IP was applied. Steps for filtering PCAP files are shown in Figure 2.
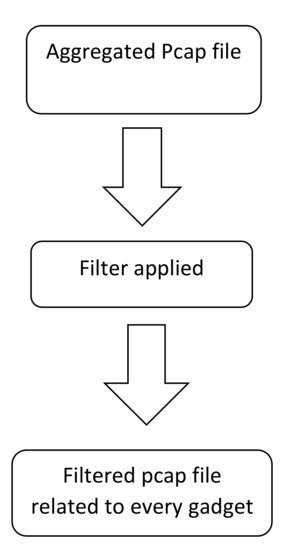
Figure 2.
PCAP filtering missing value strategy.
3.3. Feature Extraction
The most basic and significant phase of this work was the extraction of features from PCAP files, which were filtered and labeled according to the gadget. These input features have a significant role in output variable prediction.
3.4. Shark Script
A bash script, named a Shark script, was programed for the purpose of feature extraction from PCAP files so that the network transmission characteristics and properties could be studied. The developed script was able to extract 46 features from a PCAP file using Tshark [30], which is a command line [31] version of Wireshark that can capture live traffic or investigate packets from PCAP files. It writes its output in a file using various kinds of filters that can be applied to assess a particular packet.
When a PCAP file was given as input to the Shark script, it produced a CSV file containing 46 predictor variables as shown in Table 1. The feature extraction process is shown in Figure 3.

Table 1.
Extracted features.
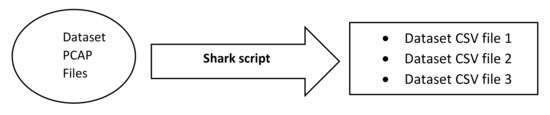
Figure 3.
Feature extraction.
3.5. Data Preprocessing
Data preprocessing is applied for cleaning and making the data suitable for the training of the ML classifier. Frequently, data contain some missing, invalid and infinite variables. These values should be removed or treated to make data available for an algorithm that can be trained on the data. The dataset available in CSV is passed through the data preprocessing phase as shown in Figure 4.
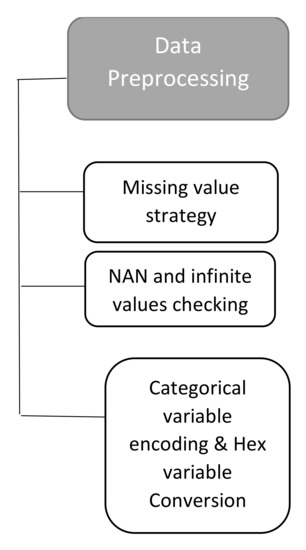
Figure 4.
Data preprocessing.
The dataset of each gadget present in the CSV file contains some missing values. The missing variable can be managed through various techniques. We substituted the missing values with a numeric zero by utilizing the Pandas library’s function [32].
3.5.1. NaN and Infinite Value Checking
All the datasets were checked for the NaN and infinite values, as these contribute negatively to ML training. The Pandas library was utilized to address this issue.
3.5.2. Categorical Values
Those variables, which have non-numeric values and are divided into groups, are called categorical variables. Most of the ML classifiers require input variables to be in numeric or number format. For this reason, categorical variables are converted into numerical values by utilizing encoding. In this paper, the “one-hot encoding” was utilized to convert all categorical values into numeric ones [33]. The “Get_dummies method” of Pandas was utilized for this purpose [34]. When the CSV dataset was inspected for categorical values, the source and destination IPs addresses were considered as categorical. These two were converted into numerical values utilizing the aforementioned library.
3.5.3. Hex Values
The dataset present in CSV files contains a property ip.flags that is in hex format. All the features other than ip.flags are in the decimal number system. So, to keep all the features in the same number system, ip.flags feature was converted using Pandas library from hex to decimal number system so that it could be easily recognized by the classifier.
3.6. Feature Selection
After implementing feature extraction with the help of Shark script, 46 features were extracted from each dataset. Then, the feature selection process was applied to reduce the number of independent variables, thereby reducing the computational overhead. Feature selection process allows keeping only those variables that greatly affect the response variable and eliminates irrelevant or repetitive features. Training ML classifiers with a high number of independent variables not only increases the training time and memory utilization but also affects the performance of the algorithm. In our work, we applied the filter and wrapper methods of feature selection, as discussed below.
3.6.1. Filter Method
Filter method uses statistical thresholds by which the features are dropped or kept. Filter method can be further split up into two primary classes: univariate filter method and multivariate filter method, as discussed in the subsequent text.
Univariate Filter
In the univariate filter strategy, single features are kept or dropped by measurable test by utilizing a threshold. The univariate filter strategy began with maximum features and, by applying diverse thresholds and filters, the number of features was dropped down. The univariate filter method was implemented by using the following steps:
- First, Jupyter Notebook was set up, and essential libraries were imported.
- Datasets that contained benign and malicious files were imported.
- Each feature was examined for missing value so that there should be no feature with a missing value in the dataset.
- Constant features were examined by setting the variance threshold equivalent to zero. A total of 14 features were found with constant values, and those features were discarded.
- Quasi-constant features were examined by adjusting the variance threshold to 0.1. A total of five features not meeting the criteria were deleted.
- Dataset was examined for repeated columns, and duplicate columns were deleted to make them distinct.
- At the end of the univariate filter method, the remaining features number 27.
Multivariate Filter
The multivariate filter method looks for a relationship among variables and eliminates repetitive features.
- After implementing the univariate filter method, the remaining 27 features were inspected for correlation utilizing Pearson’s correlation coefficient using library phik_matrix [35].
- For visualizing the correlation score, a heatmap was plotted as shown in Figure 5.
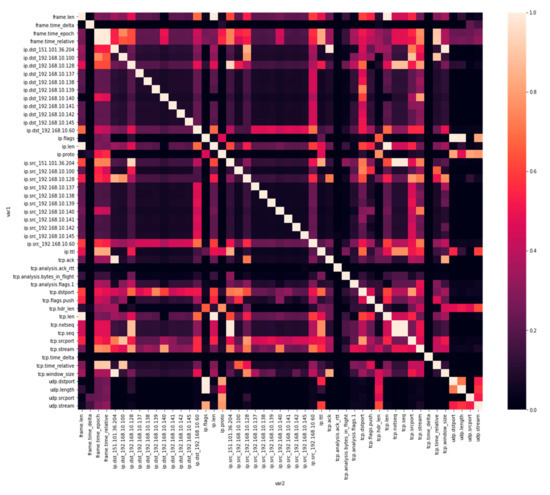 Figure 5. Heatmap showing correlation score.
 - Features with a score correlation value greater than 0.95 were filtered. As a result, 5 more features were dropped, leaving the feature count at 22.
- Resulting data frame comprised 22 features and was saved as CSV for additional utilization and filtering through the wrapper method.
3.6.2. Wrapper Method
In the wrapper method, the feature selection cycle depended on a particular ML algorithm that we attempted to fit on a given dataset. Moreover, in the wrapper method, we attempted to utilize a subset of features and train a model over those. Considering the derivations that we drew from the previous model, we applied the wrapper method to further add or eliminate features from our subset. The forward and backward phases of the wrapper method are discussed below.
Forward Feature Selection
This technique begins with no element and then adds a single feature in each turn.
Backward Feature Elimination
This technique begins with all features and eliminates one feature in each turn.
- In the first step, we imported machine-learning libraries, loaded the dataset and split it into training and testing sets.
- We performed the forward feature selection method in Python. Random forest classifier was used for feature selection.
- All 22 features were input to random forest that assigned a score to each feature using the mean decrease accuracy measure.
- Among the features, 13 features were selected based on their importance. These features produced the highest accuracy with random forest.
- The selected features were then used to train our algorithm as shown in Table 2.
Table 2. Features finalized after selection process.
- We then utilized the selected features to construct a full model utilizing our training and test datasets and then evaluated the accuracies.
4. Experiments with One-Class KNN
The traffic of IoT devices is usually very specific and does not experience frequent fluctuations. For instance, a smart fan’s only task is to sense the temperature or some other on–off operation. This is why the benign network traffic behavior of IoT devices is predictable and does not change over time. The one-class KNN algorithm was chosen, as it generates a classification model that can be easily explained, allowing a better interpretation of the classification result and making the model a lightweight solution [36].
One-class KNN is a classification algorithm that takes a single class for training, and based on that training, it predicts whether the future dataset is normal or malicious. The single-class KNN classifier has various parameters that might be changed. For example, the quantity of neighbors can be changed. Therefore, the distances of normal k to the first k neighbors are determined. The threshold value for obtaining outlier classes can be changed. Likewise, the distance metric can be changed. The one-class KNN is formulated as follows. The distance between two samples, x and y, can be found by the following distance functions.
In the proposed research work, 80,000 (80K) instances of benign and malicious datasets were used, out of which 60K were benign and 20K were malicious. The benign instances were split by 80–20% ratio to train and test the algorithm performance. Because of recognizing whether a packet is malicious or normal, the classification is evaluated comparatively with the training dataset, generating four outputs:
4.1. True Positive
Packets are benign and are predicted benign.
4.2. False Positive
Packets are malicious but predicted benign.
4.3. True Negative
Packets are malicious and are predicted malicious.
4.4. False Negative
Packets are benign and are predicted malicious.
To test the classification performance, we utilized commonly used measures, which are accuracy, F-measure, precision and recall.
4.5. Precision
Precision (P) measures the total amount of anomalous packet recognition that was correct.
4.6. Recall
Recall estimates what number of anomalous packets were recognized correctly.
4.7. F-Measure
The F-measure is a proportion of a test’s accuracy. It is determined from the precision and recall of the test.
The performance of one-class KNN classifier is analyzed based on F1-score. F1-score is appropriate for an imbalanced dataset and due to skewness property in class dispersing in the dataset [37], in which one class is dominating, and in our situation, the benign class was dominating.
5. Results and Analysis
Two different feature selection methods were used, filter and wrapper methods, which carry out operations to eliminate features that do not have any impact on performance in terms of reducing the classification time. Machine-learning models can be investigated utilizing more than one performance metric. As our dataset was imbalanced and asymmetric, it was suitable, in this situation, to utilize the F1-score as a performance metric.
5.1. Dataset Description
Three types of datasets were used that were collected from three different IoT labs as mentioned previously. The description of IoT devices is shown below in Table 3. For the MedBiot [24] dataset collection, 83 IoT devices were connected in the lab environment. Data were collected for both benign and malicious traffic. For malicious traffic, IoT botnets, such as Mirai, BashLite and Torii, were deployed. The dataset [25] consists of a labeled dataset, which included botnet activity and DDoS attacks.
Table 3.
Dataset description.
A lab environment consisting of an IoT smart camera was set up. Benign and malicious traffic for the IoT camera was captured. HCRL lab [26] generated an academic purpose dataset, where benign dataset was captured for smart home devices, such as smart speakers. A malicious dataset was also collected after infecting the devices with IoT botnet binaries, such as Mirai.
5.2. Accuracy, Precision and Recall
Accuracy, precision and recall of different datasets are shown in Figure 6, Figure 7 and Figure 8 when these are trained and tested using one-class KNN. It can be seen that the proposed model outperforms the counterparts in terms of accuracy, precision, recall and F-measure by reducing the feature space. Additionally, the outcomes show that the proposed model is adaptable and exhibits consistent behavior in various IoT environments, as it was tested on three different datasets from different IoT domains. Previous researchers disregarded the significance of feature selection methods, which can decrease the number of features for the training phase. Therefore, in our case, the training with a smaller set of features decreases the training time and utilizes less computation power.
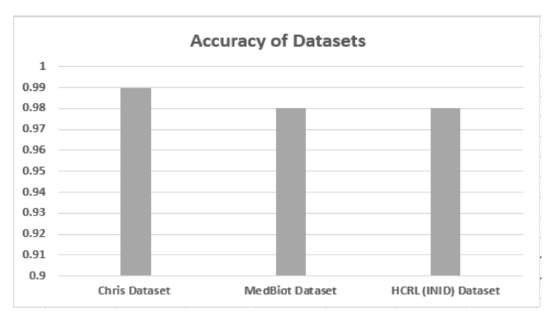
Figure 6.
Accuracy of different datasets.
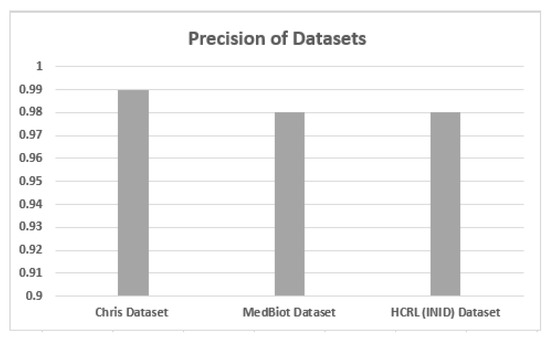
Figure 7.
Precision of different datasets.
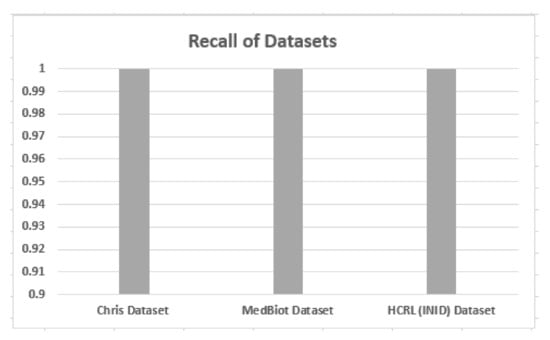
Figure 8.
Recall of different datasets.
5.3. F1-Score on Different Datasets
F1-score against different datasets is shown in Figure 9. From the results, it can be analyzed that the proposed solution provides a consistent F1-score across three different IoT datasets. Thus, the proposed solution is able to detect the malicious pattern without the dependency on the environment.
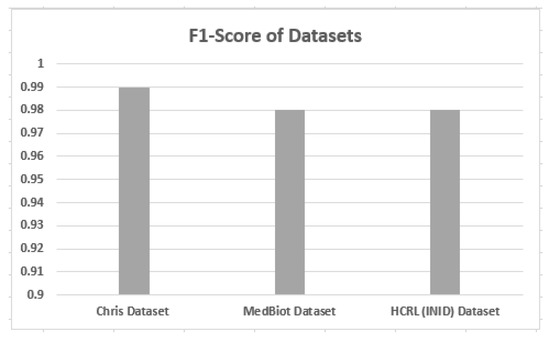
Figure 9.
F1-score of different datasets.
5.4. Effect of Feature Selection
Feature selection methods are applied to reduce the features and shortlist those features that affect the performance of the machine-learning model. The following Table 4 shows the effect of feature selection on the F1-score.
Table 4.
Effect of feature selection.
Those features that have a lesser effect on performance are removed. After the filtering method, the wrapper method is applied, which selects top features for machine-learning training purposes, and this also improves the F1-score.
5.5. Comparison with Recent Research Works
The proposed solution is compared with the research [17,18], and results are shown in Table 5, which used different ML algorithms for evaluating botnet detection.
Table 5.
Comparison with current research works.
As shown in Table 5, the proposed solution has a good performance, attaining a mean F1-score of 99%, also shown in Figure 10, Figure 11, Figure 12 and Figure 13. The methods of feature selection (filter and wrapper) reduced the feature space and improved the performance of classifiers, which were not used in the existing research work. Moreover, feature extraction was performed using a shark Script that was able to extract 46 features out a PCAP file, which represents all the behavior of communication.
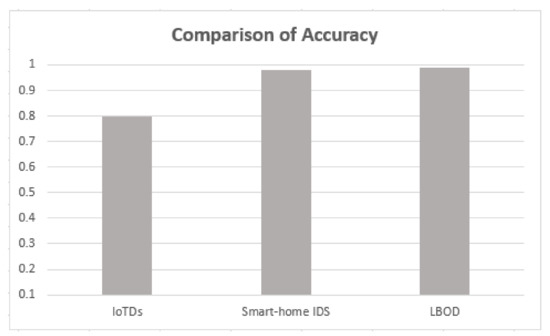
Figure 10.
Comparison of accuracy.
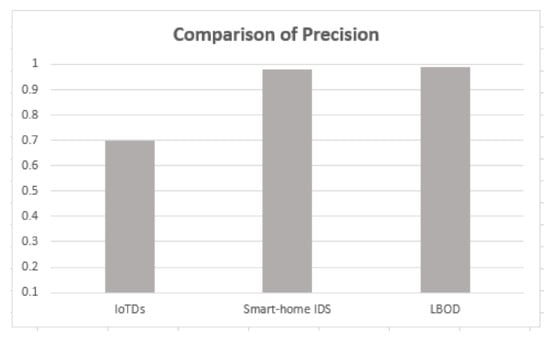
Figure 11.
Comparison of precision.
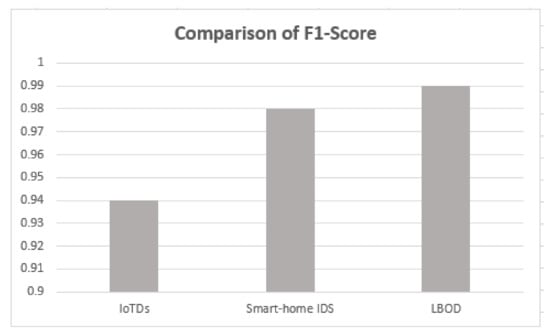
Figure 12.
Comparison of F1-score.
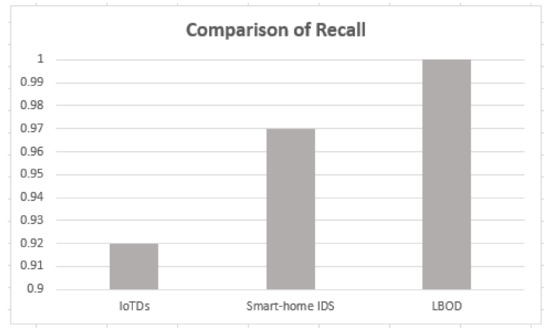
Figure 13.
Comparison of recall.
The combination of the Shark script dataset and the one-class KNN method gives the highest F1-score. The feature selection methods of filter and wrapper decreased the feature space by up to approx. 72%.
5.6. Comparison of Training Time before and after Feature Selection
It is shown in Table 6 that training and prediction time after applying feature selection was reduced, which shows the proposed model is a lightweight strategy.
Table 6.
Comparison of training and prediction time. FS: feature selection.
6. Conclusions
In this paper, one-class KNN was deployed to detect deleterious IoT botnet in a heterogeneous environment. To overcome the computation power limitation, the lightweight solution was derived. Feature selection methods, such as filter and wrapper methods, were used to select the best features that had an impact on machine-learning classifier performance. Using the filter and wrapper methods, feature space was reduced by up to approx. 72% for different datasets. The suggested solution was environment independent, as it was tested in three different IoT environments that were using different IoT devices. The proposed solution was able to detect IoT botnet with an F1-score of 98% to 99% for different IoT botnet datasets. The solution was able to detect the unknown malicious traffic of IoT in different IoT environments.
As future work, we would like to detect other network malicious behaviors of IoT devices, such as man in the middle (MITM) and replay attacks. We would like to simulate a smart home environment to collect the dataset for benign as well as malicious traffic.
Author Contributions
Conceptualization, F.R. and T.M.; Formal analysis, S.M. and O.K.; Funding acquisition, A.A.; Investigation, K.M. and S.M.; Methodology, K.M.; Resources, S.M.; Software, K.M.; Supervision, F.R.; Writing—original draft, K.M. and F.R.; Writing—review & editing, T.M., O.K. and A.A. All authors have read and agreed to the published version of the manuscript.
Funding
Part of this research work has been financially supported by University Malaysia Sabah and the APC was funded by University Malaysia Sabah.
Institutional Review Board Statement
Not applicable.
Informed Consent Statement
Not applicable.
Conflicts of Interest
The authors declare no conflict of interest.
References
- Sahu, N.K.; Mukherjee, I. Machine Learning based anomaly detection for IoT Network:(Anomaly detection in IoT Network). In Proceedings of the 2020 4th International Conference on Trends in Electronics and Informatics (ICOEI)(48184), Tirunelveli, India, 15–17 June 2020; pp. 787–794. [Google Scholar]
- IDC Forecasts Worldwide Spending on the Internet of Things to Reach $772 Billion in 2018. Available online: https://www.idc.com/getdoc.jsp?containerId=prUS43295217 (accessed on 22 August 2020).
- Liu, X.; Liu, Y.; Liu, A.; Yang, L.T. Defending ON–OFF attacks using light probing messages in smart sensors for industrial communication systems. IEEE Trans. Ind. Inform. 2018, 14, 3801–3811. [Google Scholar] [CrossRef]
- Shahid, M.R.; Blanc, G.; Zhang, Z.; Debar, H. Anomalous communications detection in IoT networks using sparse autoencoders. In Proceedings of the 2019 IEEE 18th International Symposium on Network Computing and Applications (NCA), Cambridge, MA, USA, 26–28 September 2019; pp. 1–5. [Google Scholar]
- Mahdavinejad, M.S.; Rezvan, M.; Barekatain, M.; Adibi, P.; Barnaghi, P.; Sheth, A.P. Machine learning for Internet of Things data analysis: A survey. Digit. Commun. Netw. 2018, 4, 161–175. [Google Scholar] [CrossRef]
- Aboueata, N.; Alrasbi, S.; Erbad, A.; Kassler, A.; Bhamare, D. Supervised machine learning techniques for efficient network intrusion detection. In Proceedings of the 2019 28th International Conference on Computer Communication and Networks (ICCCN), Valencia, Spain, 29 July–1 August 2019; pp. 1–8. [Google Scholar]
- Jia, Y.; Zhong, F.; Alrawais, A.; Gong, B.; Cheng, X. FlowGuard: An Intelligent Edge Defense Mechanism Against IoT DDoS Attacks. IEEE Internet Things J. 2020, 7, 9552–9562. [Google Scholar] [CrossRef]
- Timčenko, V.; Gajin, S. Machine learning based network anomaly detection for IoT environments. In Proceedings of the ICIST 2018: 24th International Conference on Information and Software Technologies, Vilnius, Lithuania, 4–5 October 2018. [Google Scholar]
- Doshi, R.; Apthorpe, N.; Feamster, N. Machine learning ddos detection for consumer internet of things devices. In Proceedings of the 2018 IEEE Security and Privacy Workshops (SPW), San Francisco, CA, USA, 24 May 2018; pp. 29–35. [Google Scholar]
- Swersky, L.; Marques, H.O.; Sander, J.; Campello, R.J.; Zimek, A. On the evaluation of outlier detection and one-class classification methods. In Proceedings of the 2016 IEEE international conference on data science and advanced analytics (DSAA), Montreal, QC, Canada, 17–19 October 2016; pp. 1–10. [Google Scholar]
- Cui, L.; Yang, S.; Chen, F.; Ming, Z.; Lu, N.; Qin, J. A survey on application of machine learning for Internet of Things. Int. J. Mach. Learn. Cybern. 2018, 9, 1399–1417. [Google Scholar] [CrossRef]
- Hussain, F.; Hussain, R.; Hassan, S.A.; Hossain, E. Machine learning in IoT security: Current solutions and future challenges. IEEE Commun. Surv. Tutor. 2020, 22, 1686–1721. [Google Scholar] [CrossRef] [Green Version]
- Verma, A.; Ranga, V. Machine learning based intrusion detection systems for IoT applications. Wirel. Pers. Commun. 2020, 111, 2287–2310. [Google Scholar] [CrossRef]
- Branitskiy, A.; Kotenko, I.; Saenko, I.B. Applying Machine Learning and Parallel Data Processing for Attack Detection in IoT. IEEE Trans. Emerg. Top. Comput. 2020, 9, 1642–1653. [Google Scholar] [CrossRef]
- Meidan, Y.; Bohadana, M.; Mathov, Y.; Mirsky, Y.; Shabtai, A.; Breitenbacher, D.; Elovici, Y. N-baiot—Network-based detection of iot botnet attacks using deep autoencoders. IEEE Pervas. Comput. 2018, 17, 12–22. [Google Scholar] [CrossRef] [Green Version]
- Kumar, A.; Lim, T.J. EDIMA: Early detection of IoT malware network activity using machine learning techniques. In Proceedings of the 2019 IEEE 5th World Forum on Internet of Things (WF-IoT), Limerick, Ireland, 15–18 April 2019; pp. 289–294. [Google Scholar]
- Bezerra, V.H.; da Costa, V.G.T.; Junior, S.B.; Miani, R.S.; Zarpelão, B.B. IoTDS: A one-class classification approach to detect botnets in Internet of Things devices. Sensors 2019, 19, 3188. [Google Scholar] [CrossRef] [PubMed] [Green Version]
- Anthi, E.; Williams, L.; Słowińska, M.; Theodorakopoulos, G.; Burnap, P. A supervised intrusion detection system for smart home IoT devices. IEEE Internet Things J. 2019, 6, 9042–9053. [Google Scholar] [CrossRef]
- Hsu, H.-T.; Jong, G.-J.; Chen, J.-H.; Jhe, C.-G. Improve Iot Security System of Smart-Home by Using Support Vector Machine. In Proceedings of the 2019 IEEE 4th International Conference on Computer and Communication Systems (ICCCS), Singapore, 23–25 February 2019; pp. 674–677. [Google Scholar]
- Sivanathan, A.; Gharakheili, H.H.; Loi, F.; Radford, A.; Wijenayake, C.; Vishwanath, A.; Sivaraman, V. Classifying IoT devices in smart environments using network traffic characteristics. IEEE Trans. Mob. Comput. 2018, 18, 1745–1759. [Google Scholar] [CrossRef]
- Hasan, M.; Islam, M.M.; Zarif, M.I.I.; Hashem, M. Attack and anomaly detection in IoT sensors in IoT sites using machine learning approaches. Internet Things 2019, 7, 100059. [Google Scholar] [CrossRef]
- Vikram, A. Anomaly detection in Network Traffic Using Unsupervised Machine learning Approach. In Proceedings of the 2020 5th International Conference on Communication and Electronics Systems (ICCES), Coimbatore, India, 10–12 June 2020; pp. 476–479. [Google Scholar]
- Popoola, S.I.; Adebisi, B.; Ande, R.; Hammoudeh, M.; Anoh, K.; Atayero, A.A. smote-drnn: A deep learning algorithm for botnet detection in the internet-of-things networks. Sensors 2021, 21, 2985. [Google Scholar] [CrossRef] [PubMed]
- Almiani, M.; AbuGhazleh, A.; Al-Rahayfeh, A.; Atiewi, S.; Razaque, A. Deep recurrent neural network for IoT intrusion detection system. Simul. Model. Pract. Theory 2020, 101, 102031. [Google Scholar] [CrossRef]
- Stiawan, D.; Arifin, M.A.S.; Rejito, J.; Idris, M.Y.; Budiarto, R. A Dimensionality Reduction Approach for Machine Learning Based IoT Botnet Detection. In Proceedings of the 2021 8th International Conference on Electrical Engineering, Computer Science and Informatics (EECSI), Semarang, Indonesia, 20–21 October 2021; pp. 26–30. [Google Scholar]
- Rezaei, A. Using Ensemble Learning Technique for Detecting Botnet on IoT. SN Comput. Sci. 2021, 2, 148. [Google Scholar] [CrossRef]
- Guerra-Manzanares, A.; Medina-Galindo, J.; Bahsi, H.; Nõmm, S. MedBIoT: Generation of an IoT Botnet Dataset in a Medium-sized IoT Network. In Proceedings of the 6th International Conference on Information Systems Security and Privacy, ICISSP 2020, Valletta, Malta, 25–27 February 2020; pp. 207–218. [Google Scholar]
- McDermott, C.D.; Haynes, W.; Petrovksi, A.V. Threat Detection and Analysis in the Internet of Things using Deep Packet Inspection. IJCSA 2018, 3, 61–83. [Google Scholar] [CrossRef] [Green Version]
- Kang, H.; Ahn, D.; Lee, G.; Yoo, J.; Park, K.; Kim, H.; IoT network intrusion dataset. IEEE Dataport 2019. Available online: https://ieee-dataport.org/open-access/iot-network-intrusion-dataset (accessed on 15 March 2022).
- Kuang, C.; Hou, D.; Zhang, Q.; Zhao, K.; Li, W. A Network Traffic Collection System for Space Information Networks Emulation Platform. In Proceedings of the International Conference on Wireless and Satellite Systems, Nanjing, China, 17–18 September 2021; Springer: Berlin/Heidelberg, Germany, 2021; pp. 217–225. [Google Scholar]
- Bash Terminal Scripting. Available online: https://www.gnu.org/software/bash/manual/html_node/What-is-Bash_003f.html (accessed on 22 August 2020).
- McKinney, W. Pandas: A foundational Python library for data analysis and statistics. Python High Perform. Sci. Comput. 2011, 14, 1–9. [Google Scholar]
- Seger, C. An Investigation of Categorical Variable Encoding Techniques in Machine Learning: Binary Versus One-Hot and Feature Hashing. 2018, p. 34. Available online: https://www.diva-portal.org/smash/record.jsf?pid=diva2%3A1259073&dswid=-7789 (accessed on 15 March 2022).
- Khadka, N. General Machine Learning Practices Using Python. Bachelor’s Thesis, Oulu University of Applied Sciences, Oulu, Finland, 2019. [Google Scholar]
- Güner, M. Retail Data Predictive Analysis Using Machine Learning Models; MEF Üniversitesi Fen Bilimleri Enstitüsü: İstanbul, Türkiye, 2020. [Google Scholar]
- Khan, S.S.; Madden, M.G. One-class classification: Taxonomy of study and review of techniques. Knowl. Eng. Rev. 2014, 29, 345–374. [Google Scholar] [CrossRef] [Green Version]
- Davis, J.; Goadrich, M. The relationship between Precision-Recall and ROC curves. In Proceedings of the 23rd international conference on Machine learning, Pittsburgh, PA, USA, 25–29 June 2006; pp. 233–240. [Google Scholar]
Publisher’s Note: MDPI stays neutral with regard to jurisdictional claims in published maps and institutional affiliations. |
© 2022 by the authors. Licensee MDPI, Basel, Switzerland. This article is an open access article distributed under the terms and conditions of the Creative Commons Attribution (CC BY) license (https://creativecommons.org/licenses/by/4.0/).