
User Experience Estimation in Multi-Service Scenario of Cellular Network


Abstract
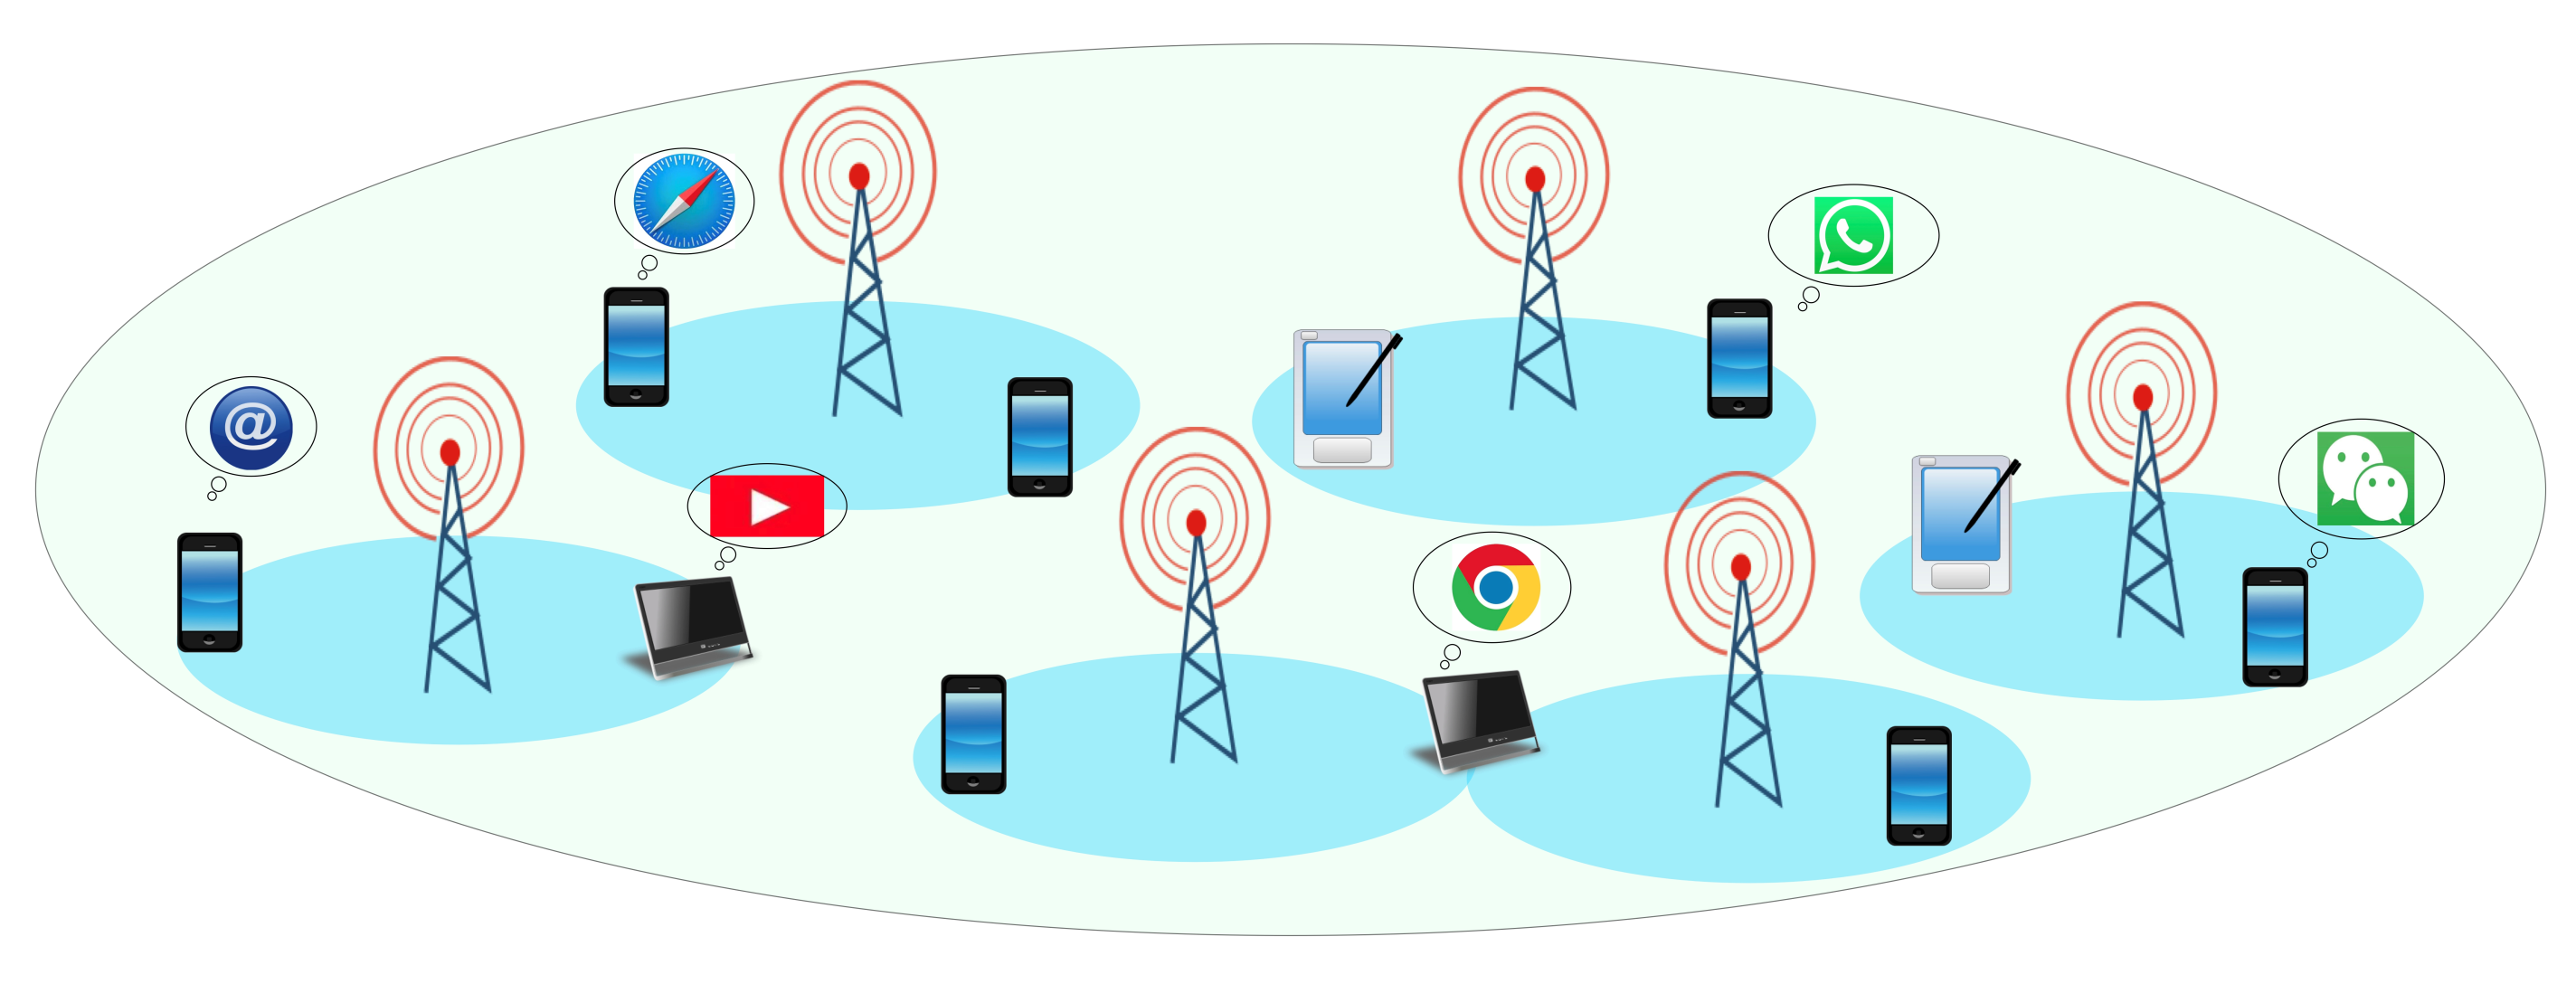
:1. Introduction
2. Related Works
3. Materials and Methods
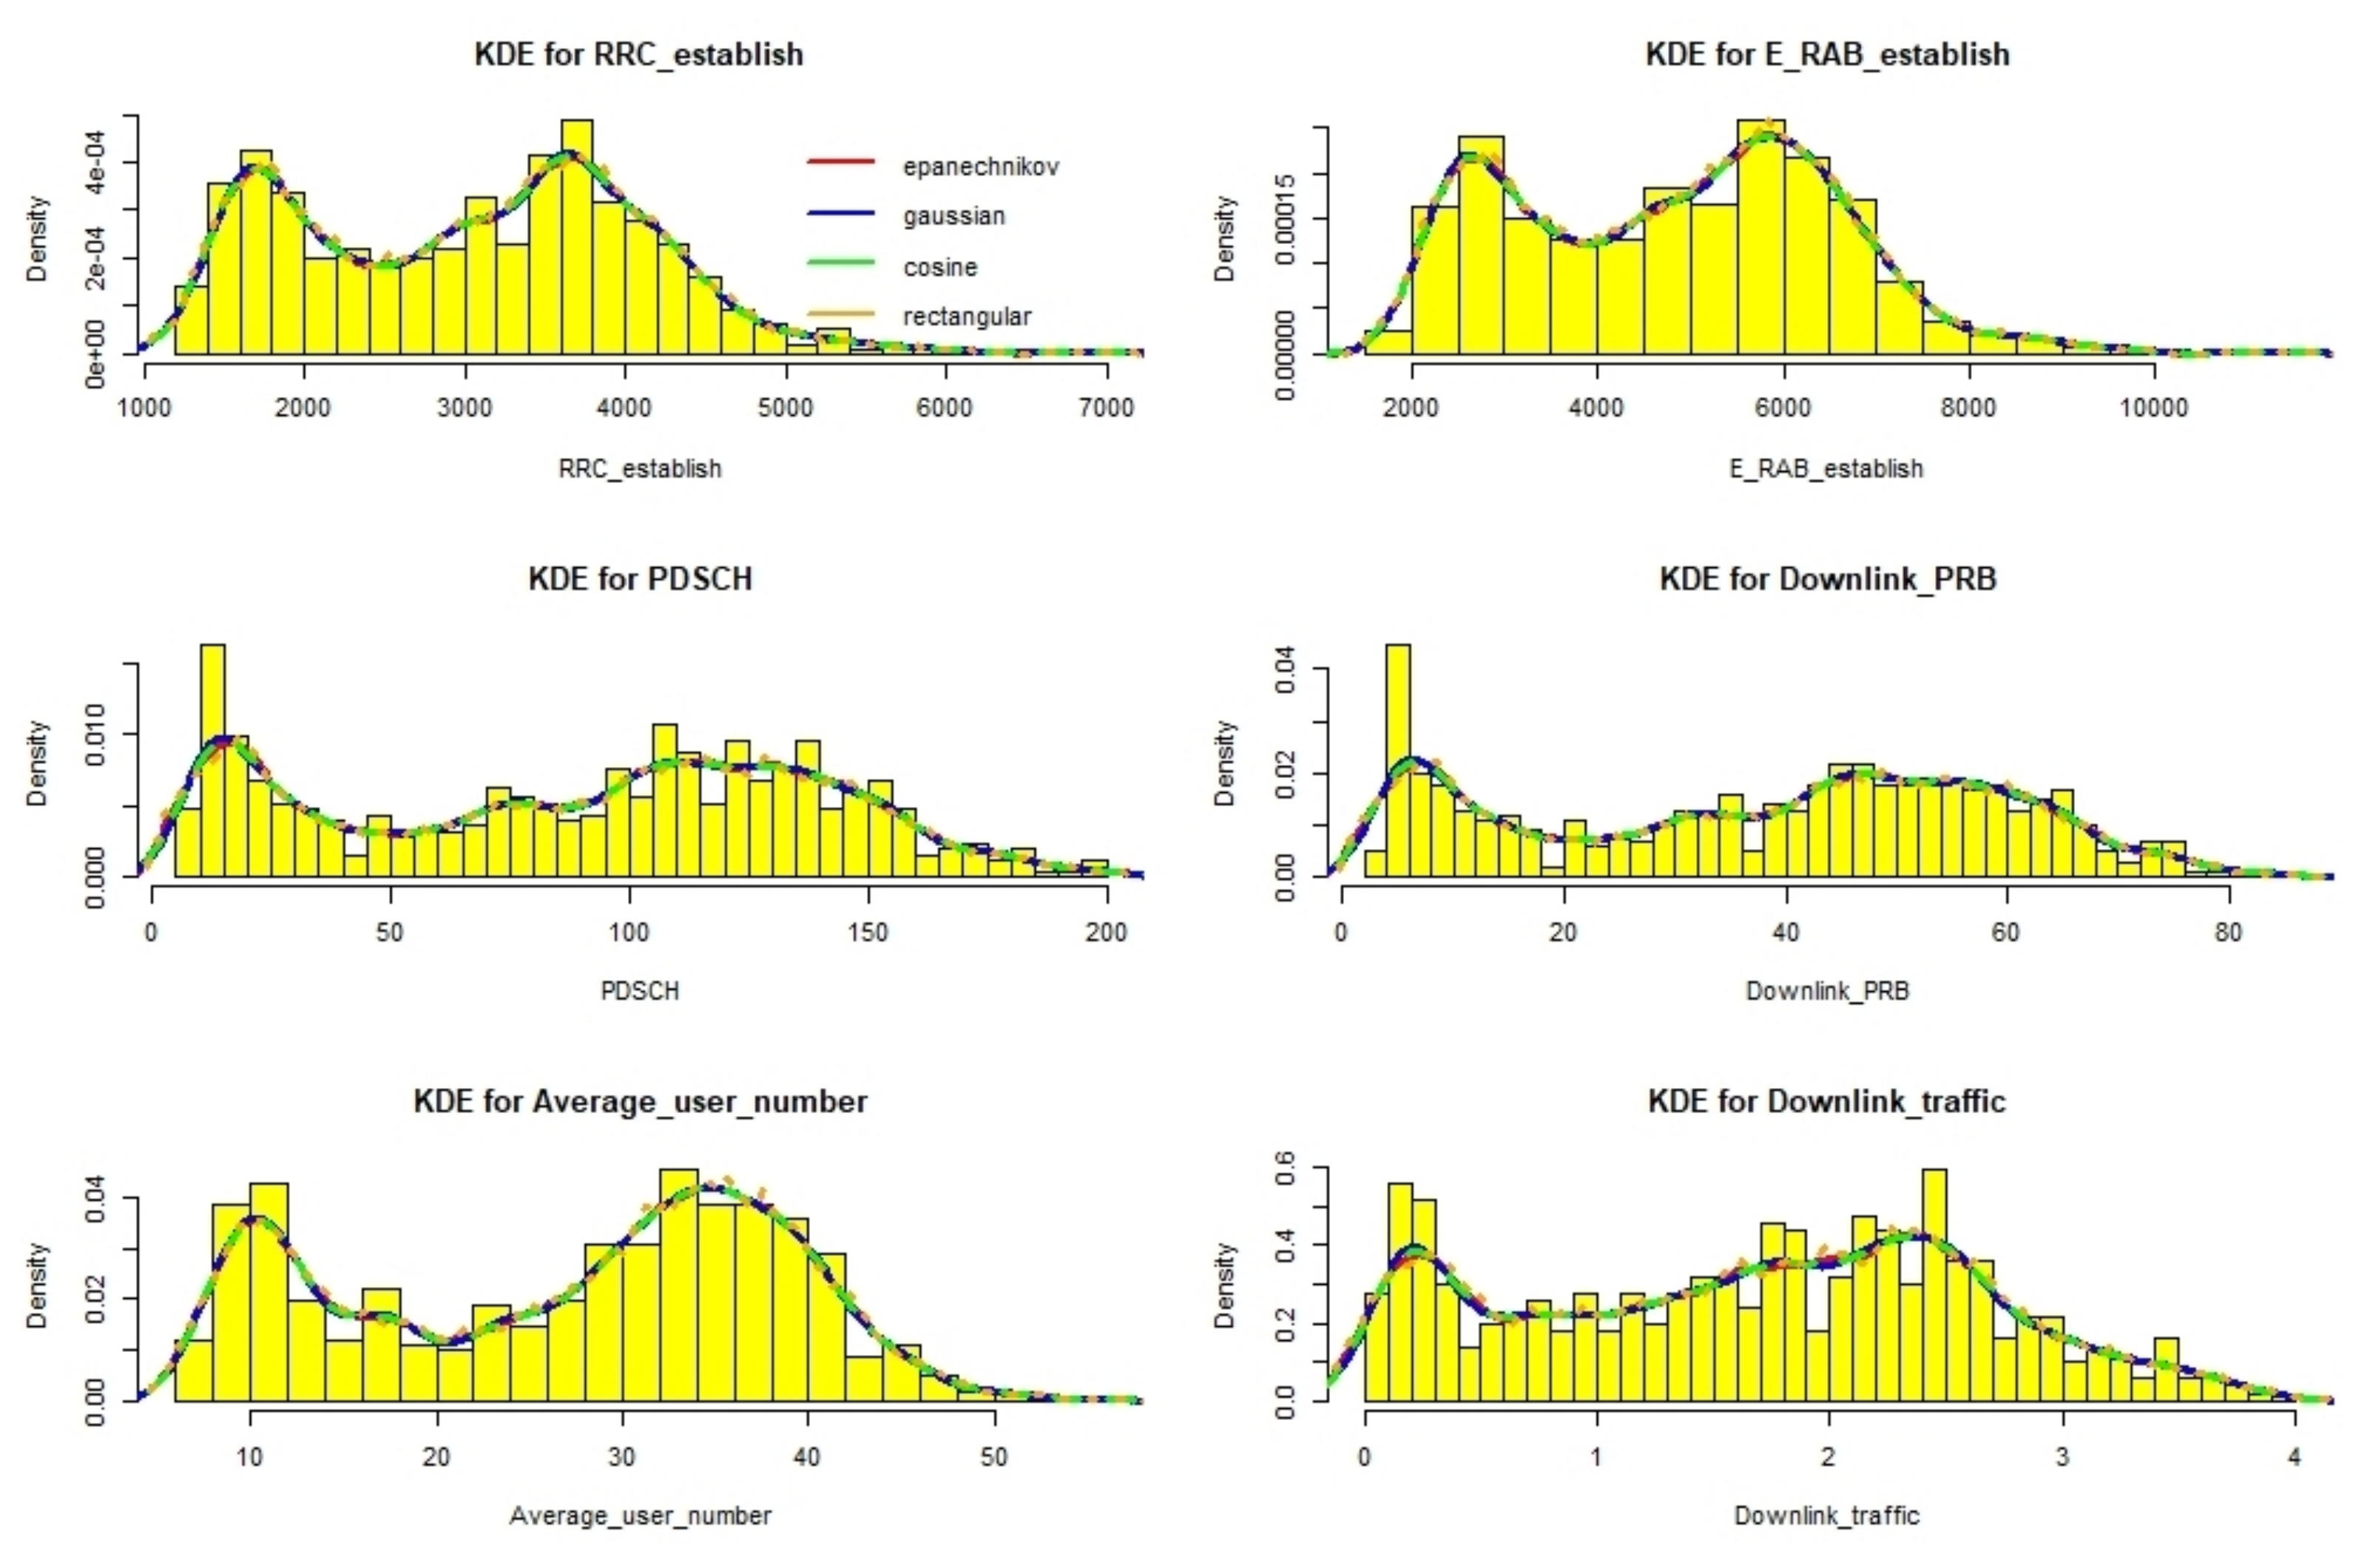
3.1. Data Description
3.2. Methods
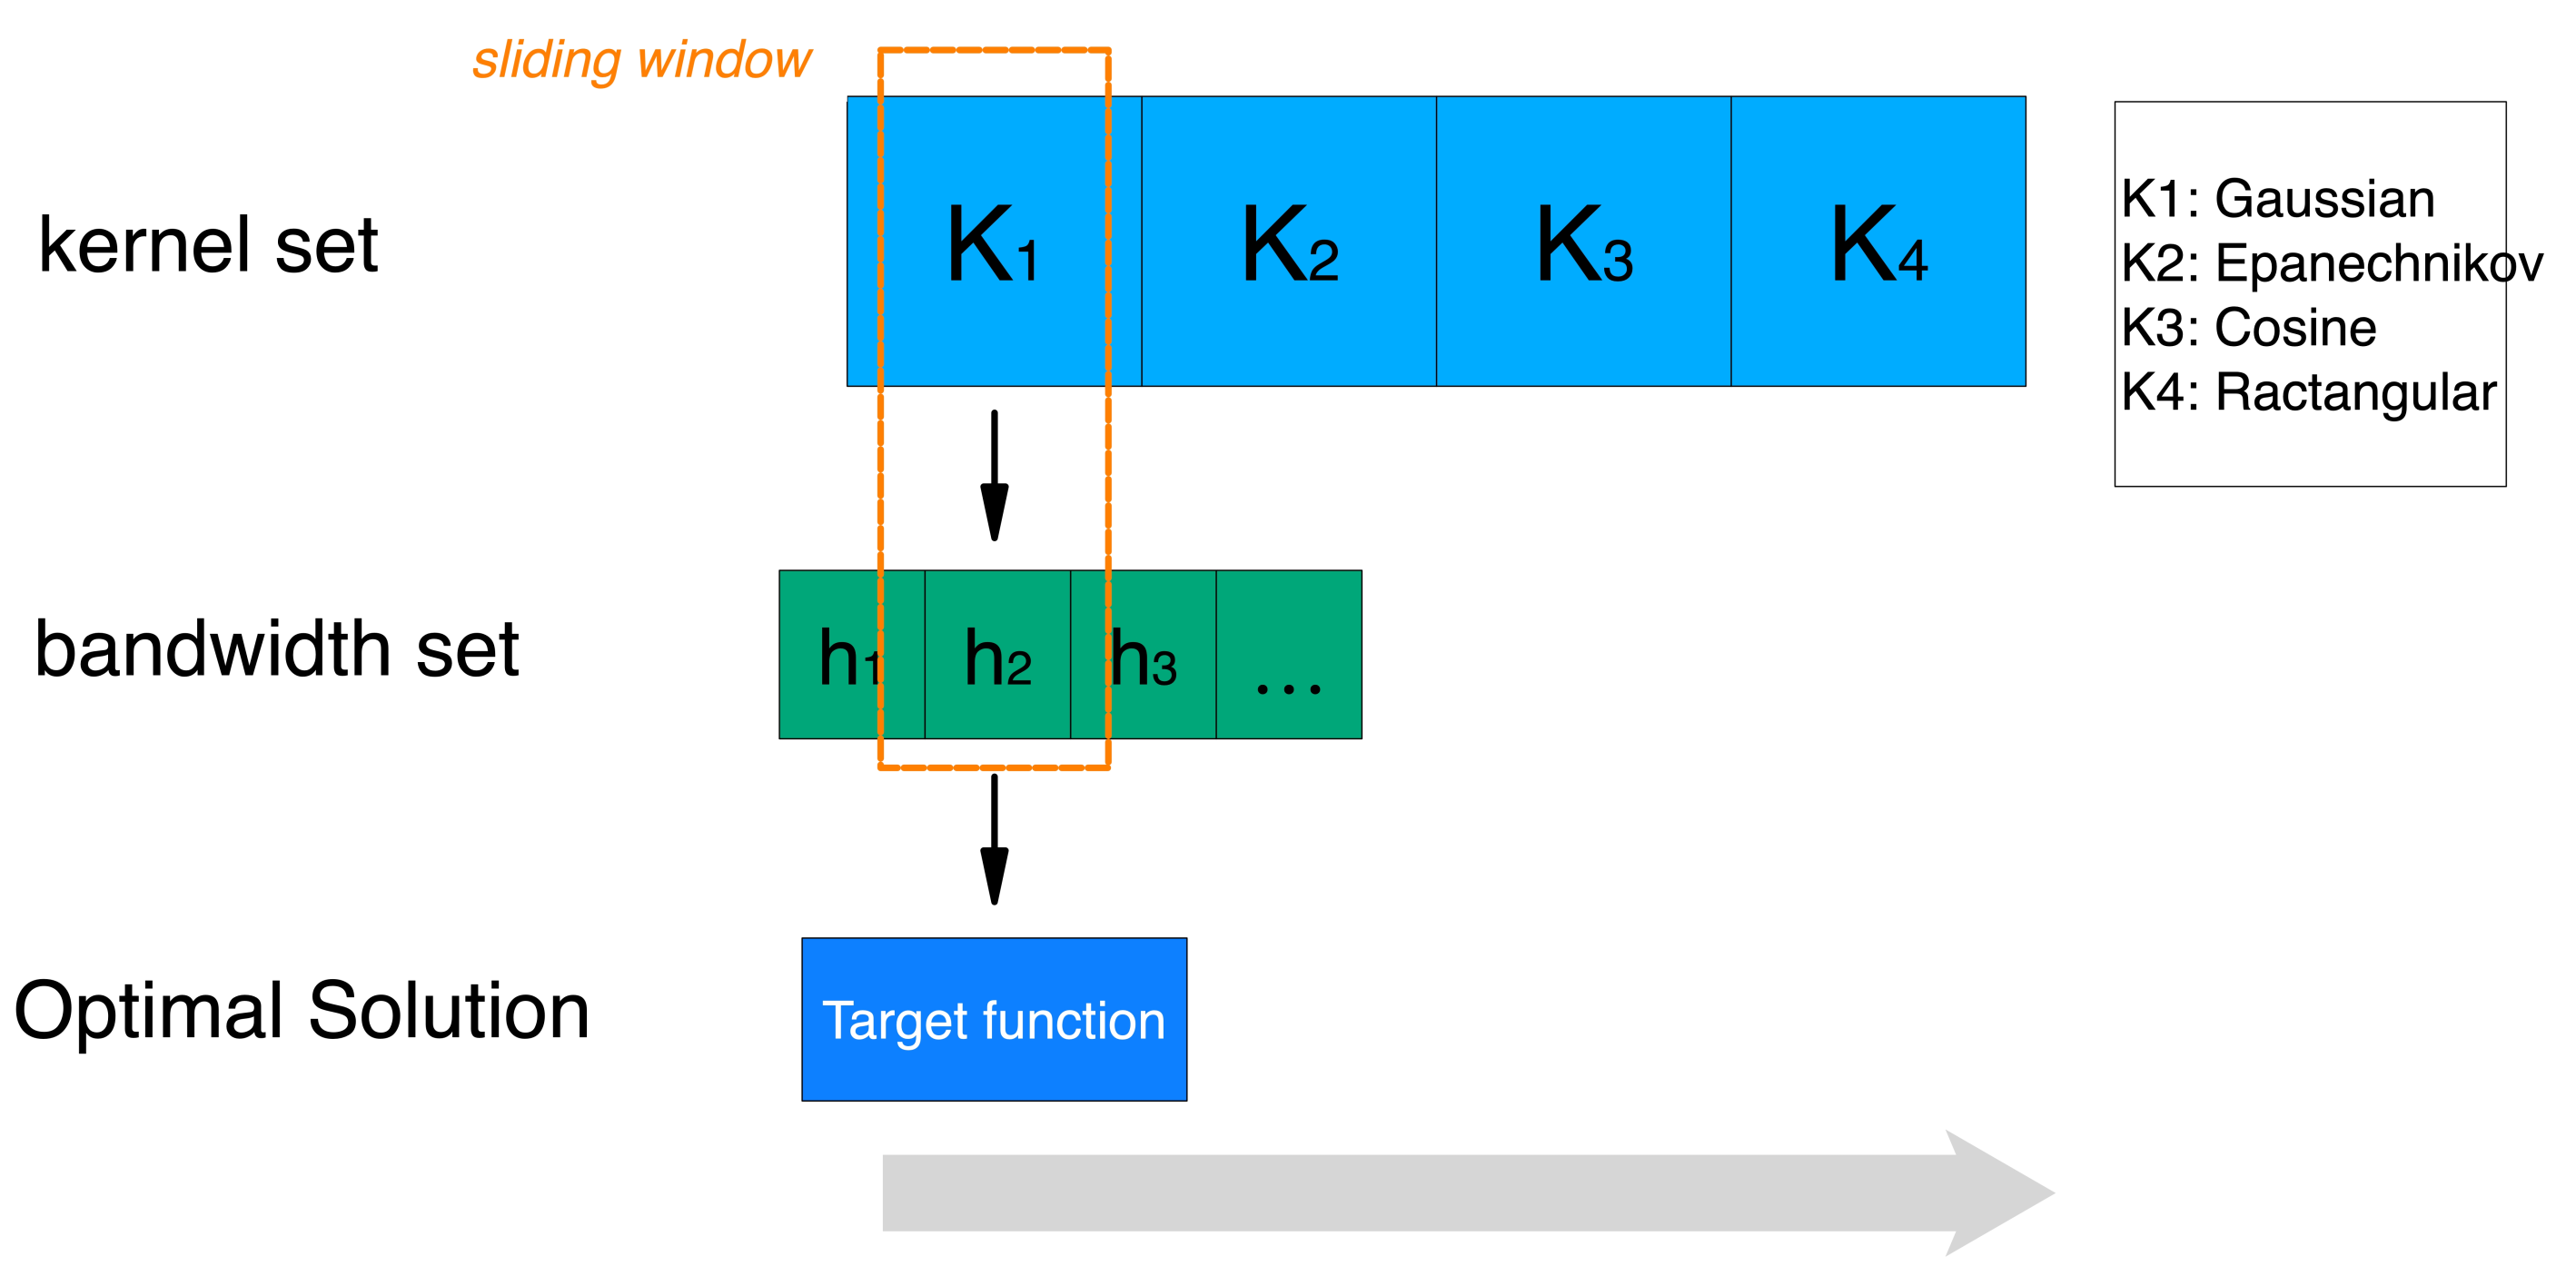
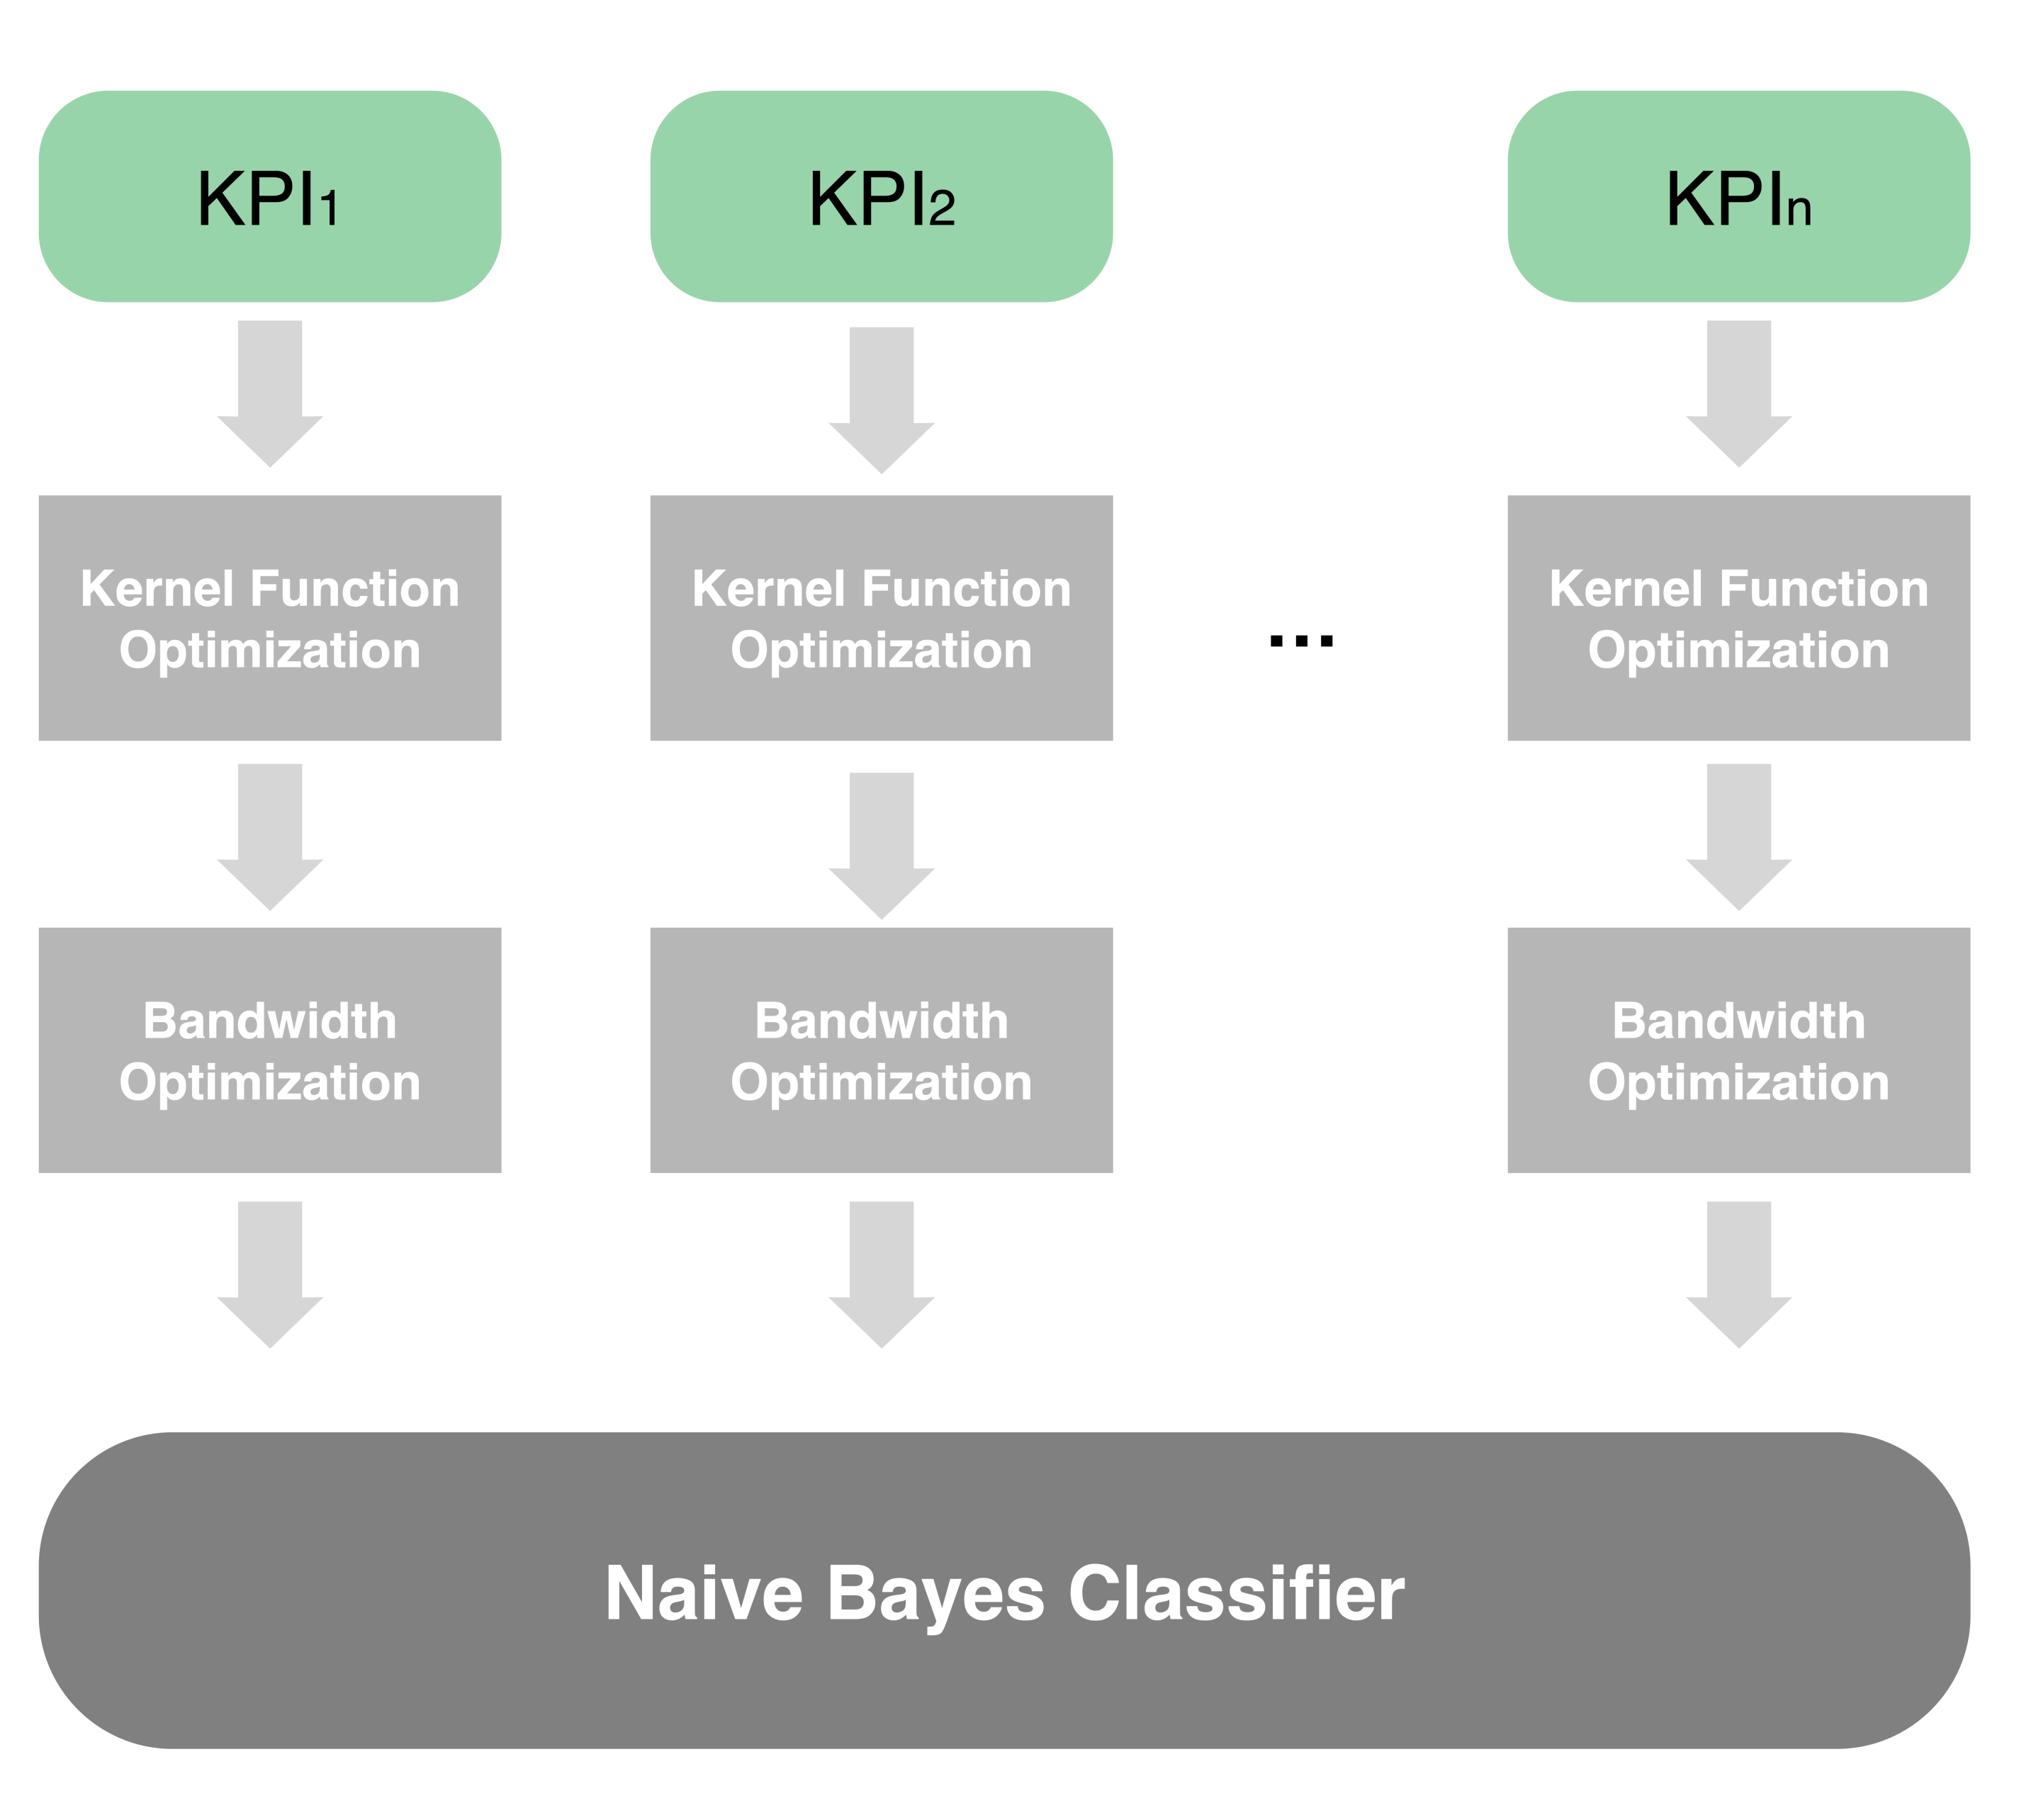
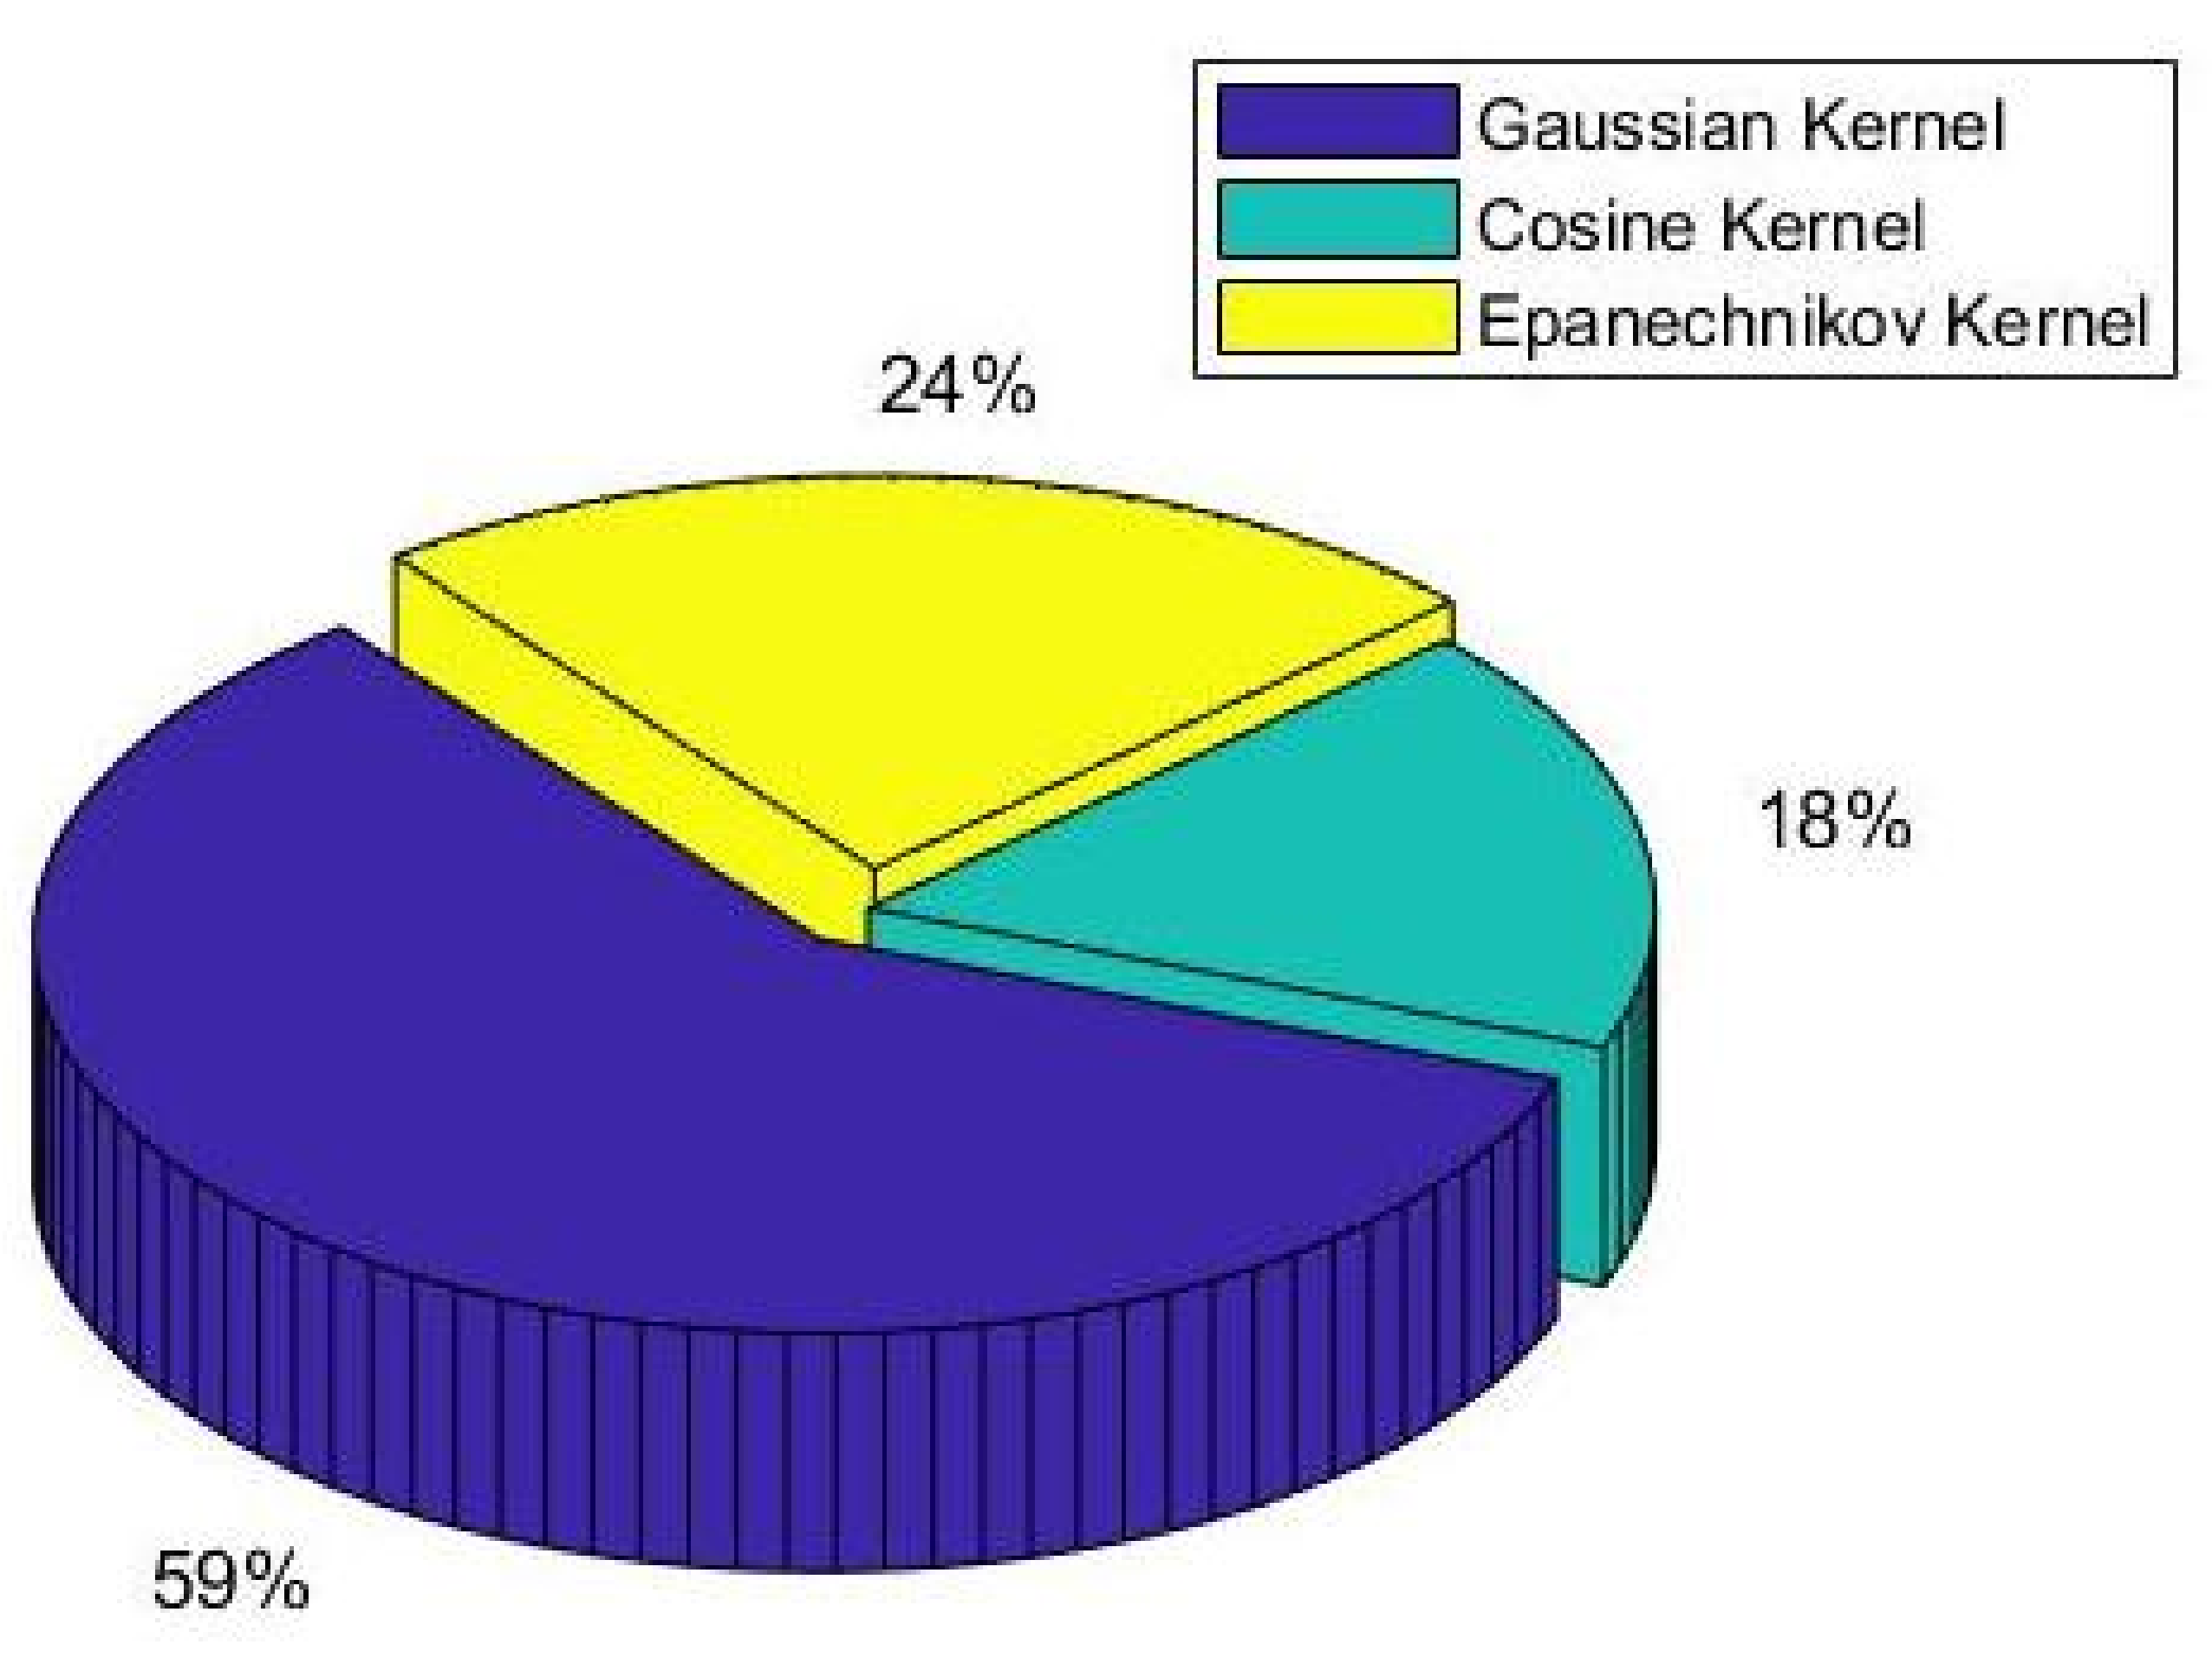
3.2.1. Adaptive Kernel Density Estimation
| Algorithm 1 Two-step optimization in kernel density estimation. |
Require: K: Kernel function set; S: KPI set; Ensure: optimal ; optimal 1: Initial and h; 2: Calculation of average value and standard deviation for each attribute in S; 3: repeat 4: Kernel function selection; 5: repeat 6: Bandwidth calculation; 7: until Based on current kernel function, the optimal bandwidth is found 8: until The optimal kernel function and optimal bandwidth are obtained |
3.2.2. Naive Bayes Classifier
3.2.3. Voting Mechanism
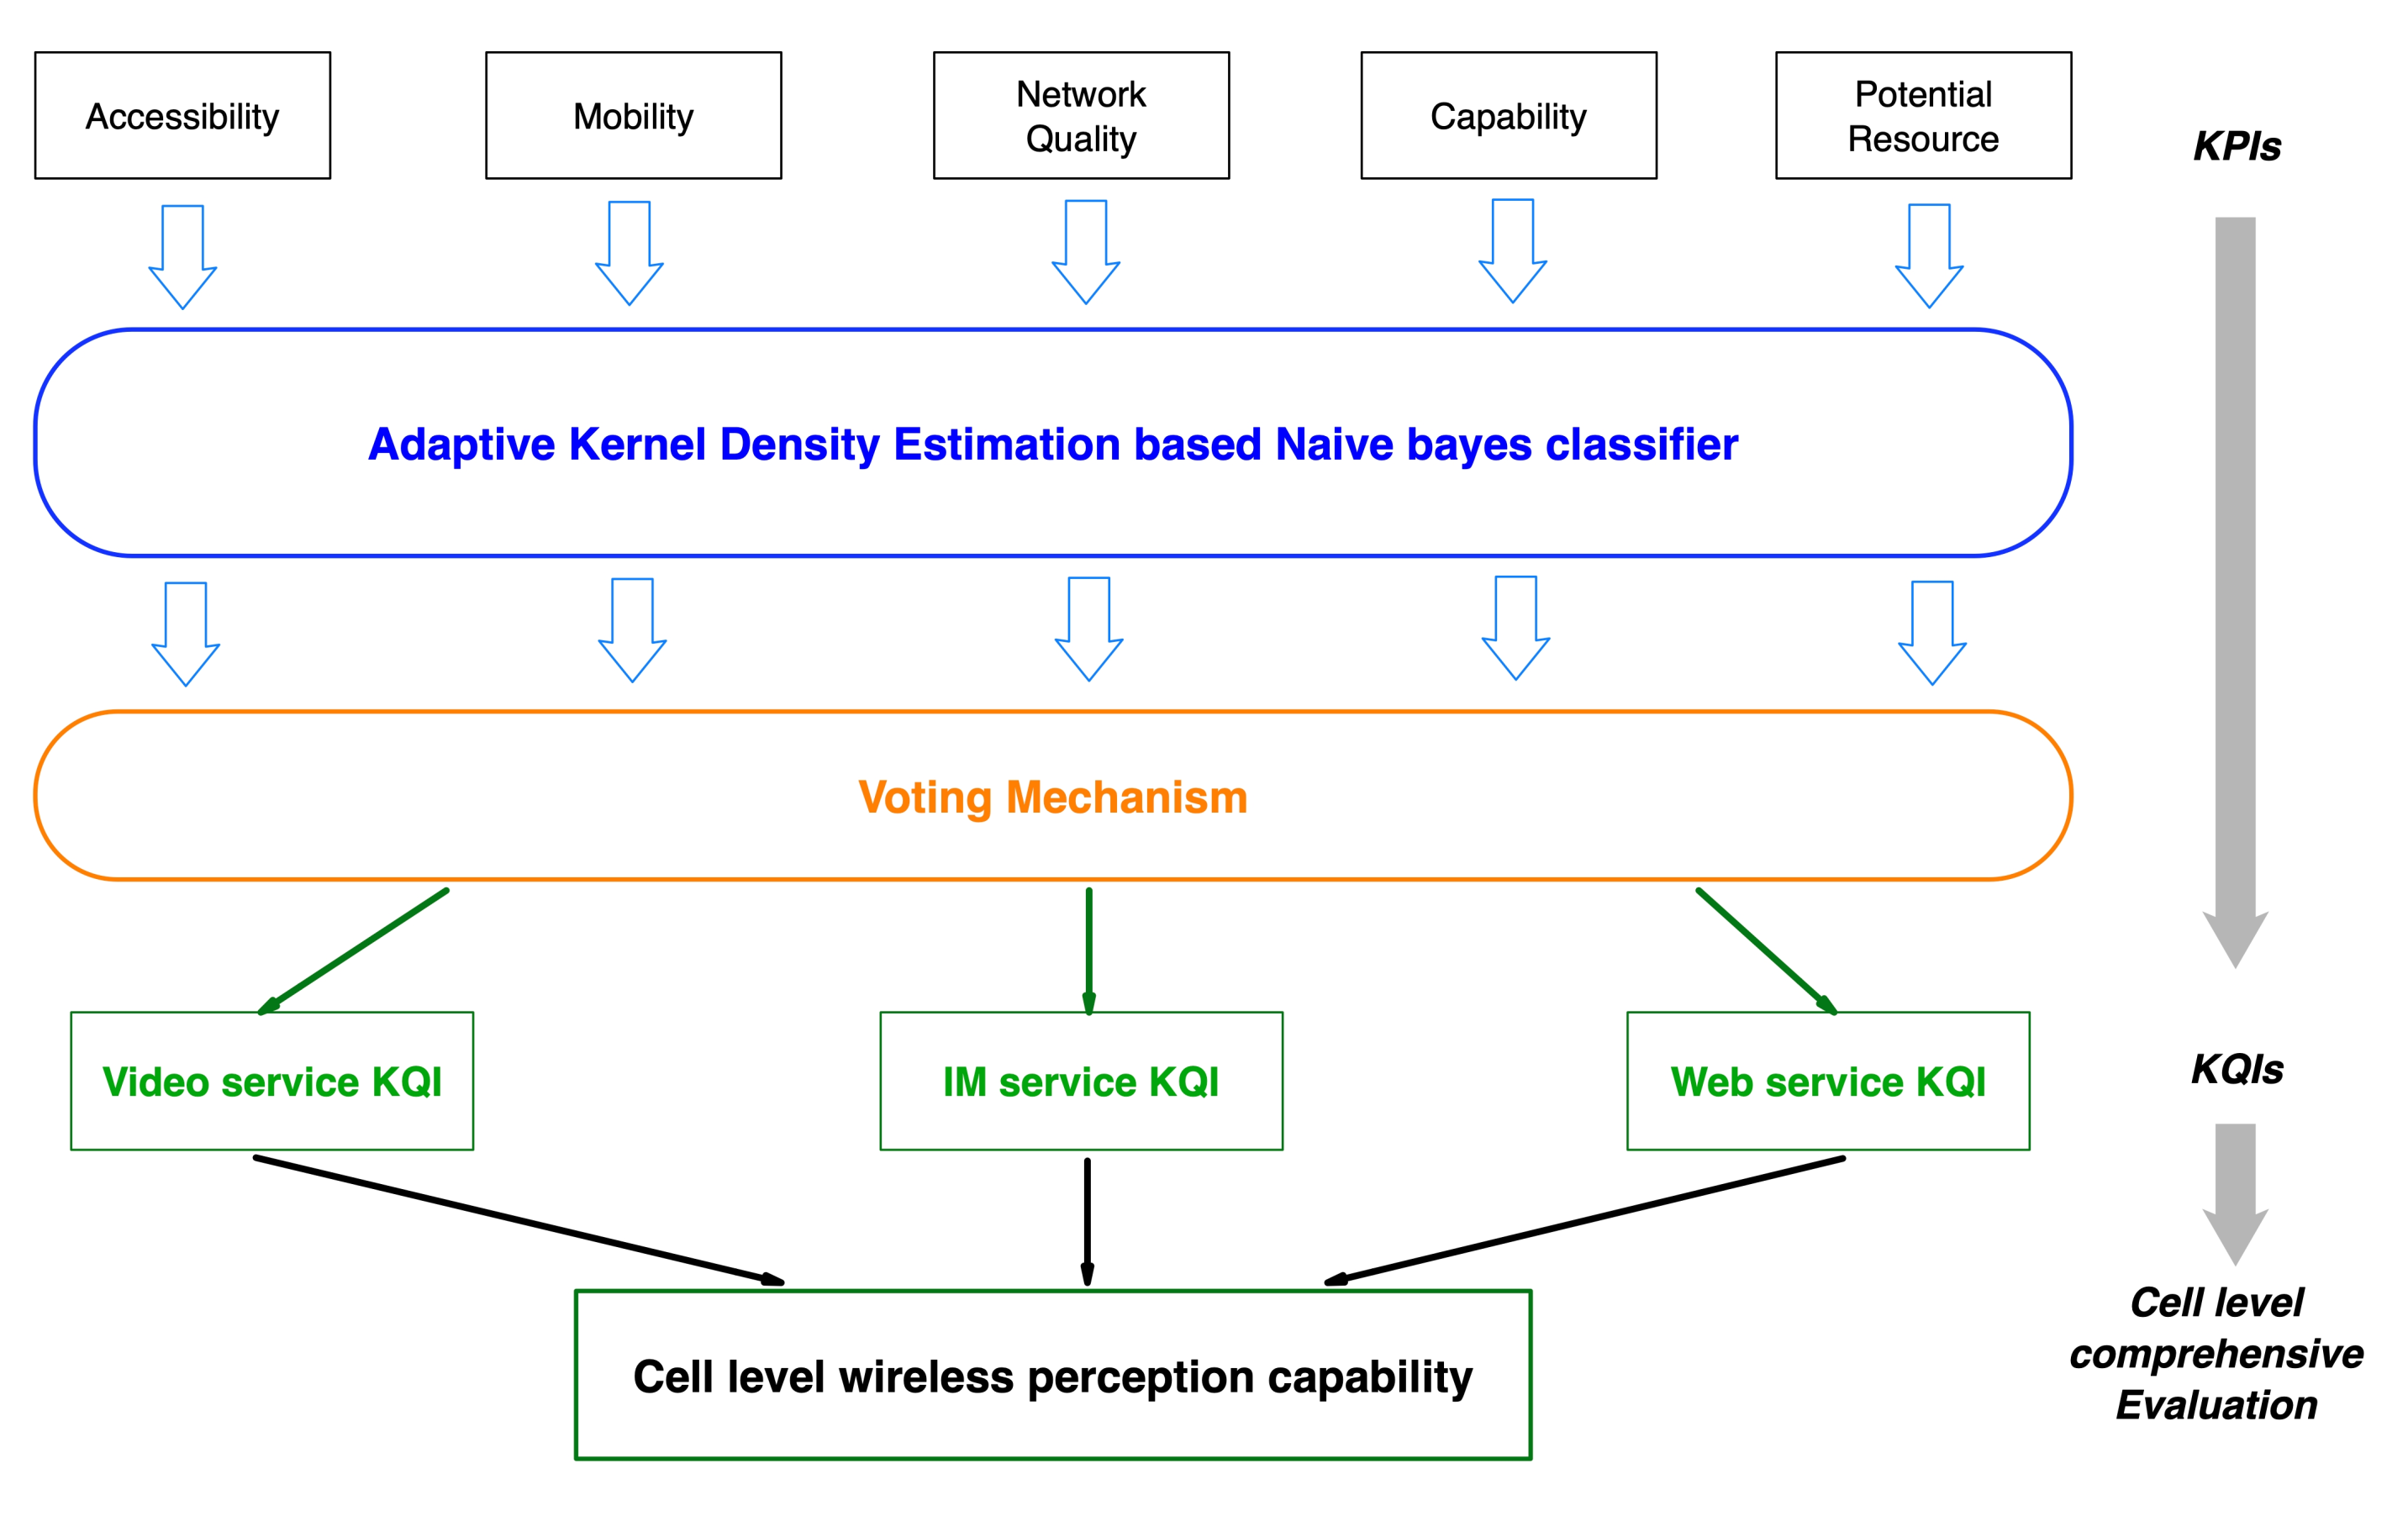
3.2.4. Service Perception Capability in Cell-Level Wireless Networks
4. Results
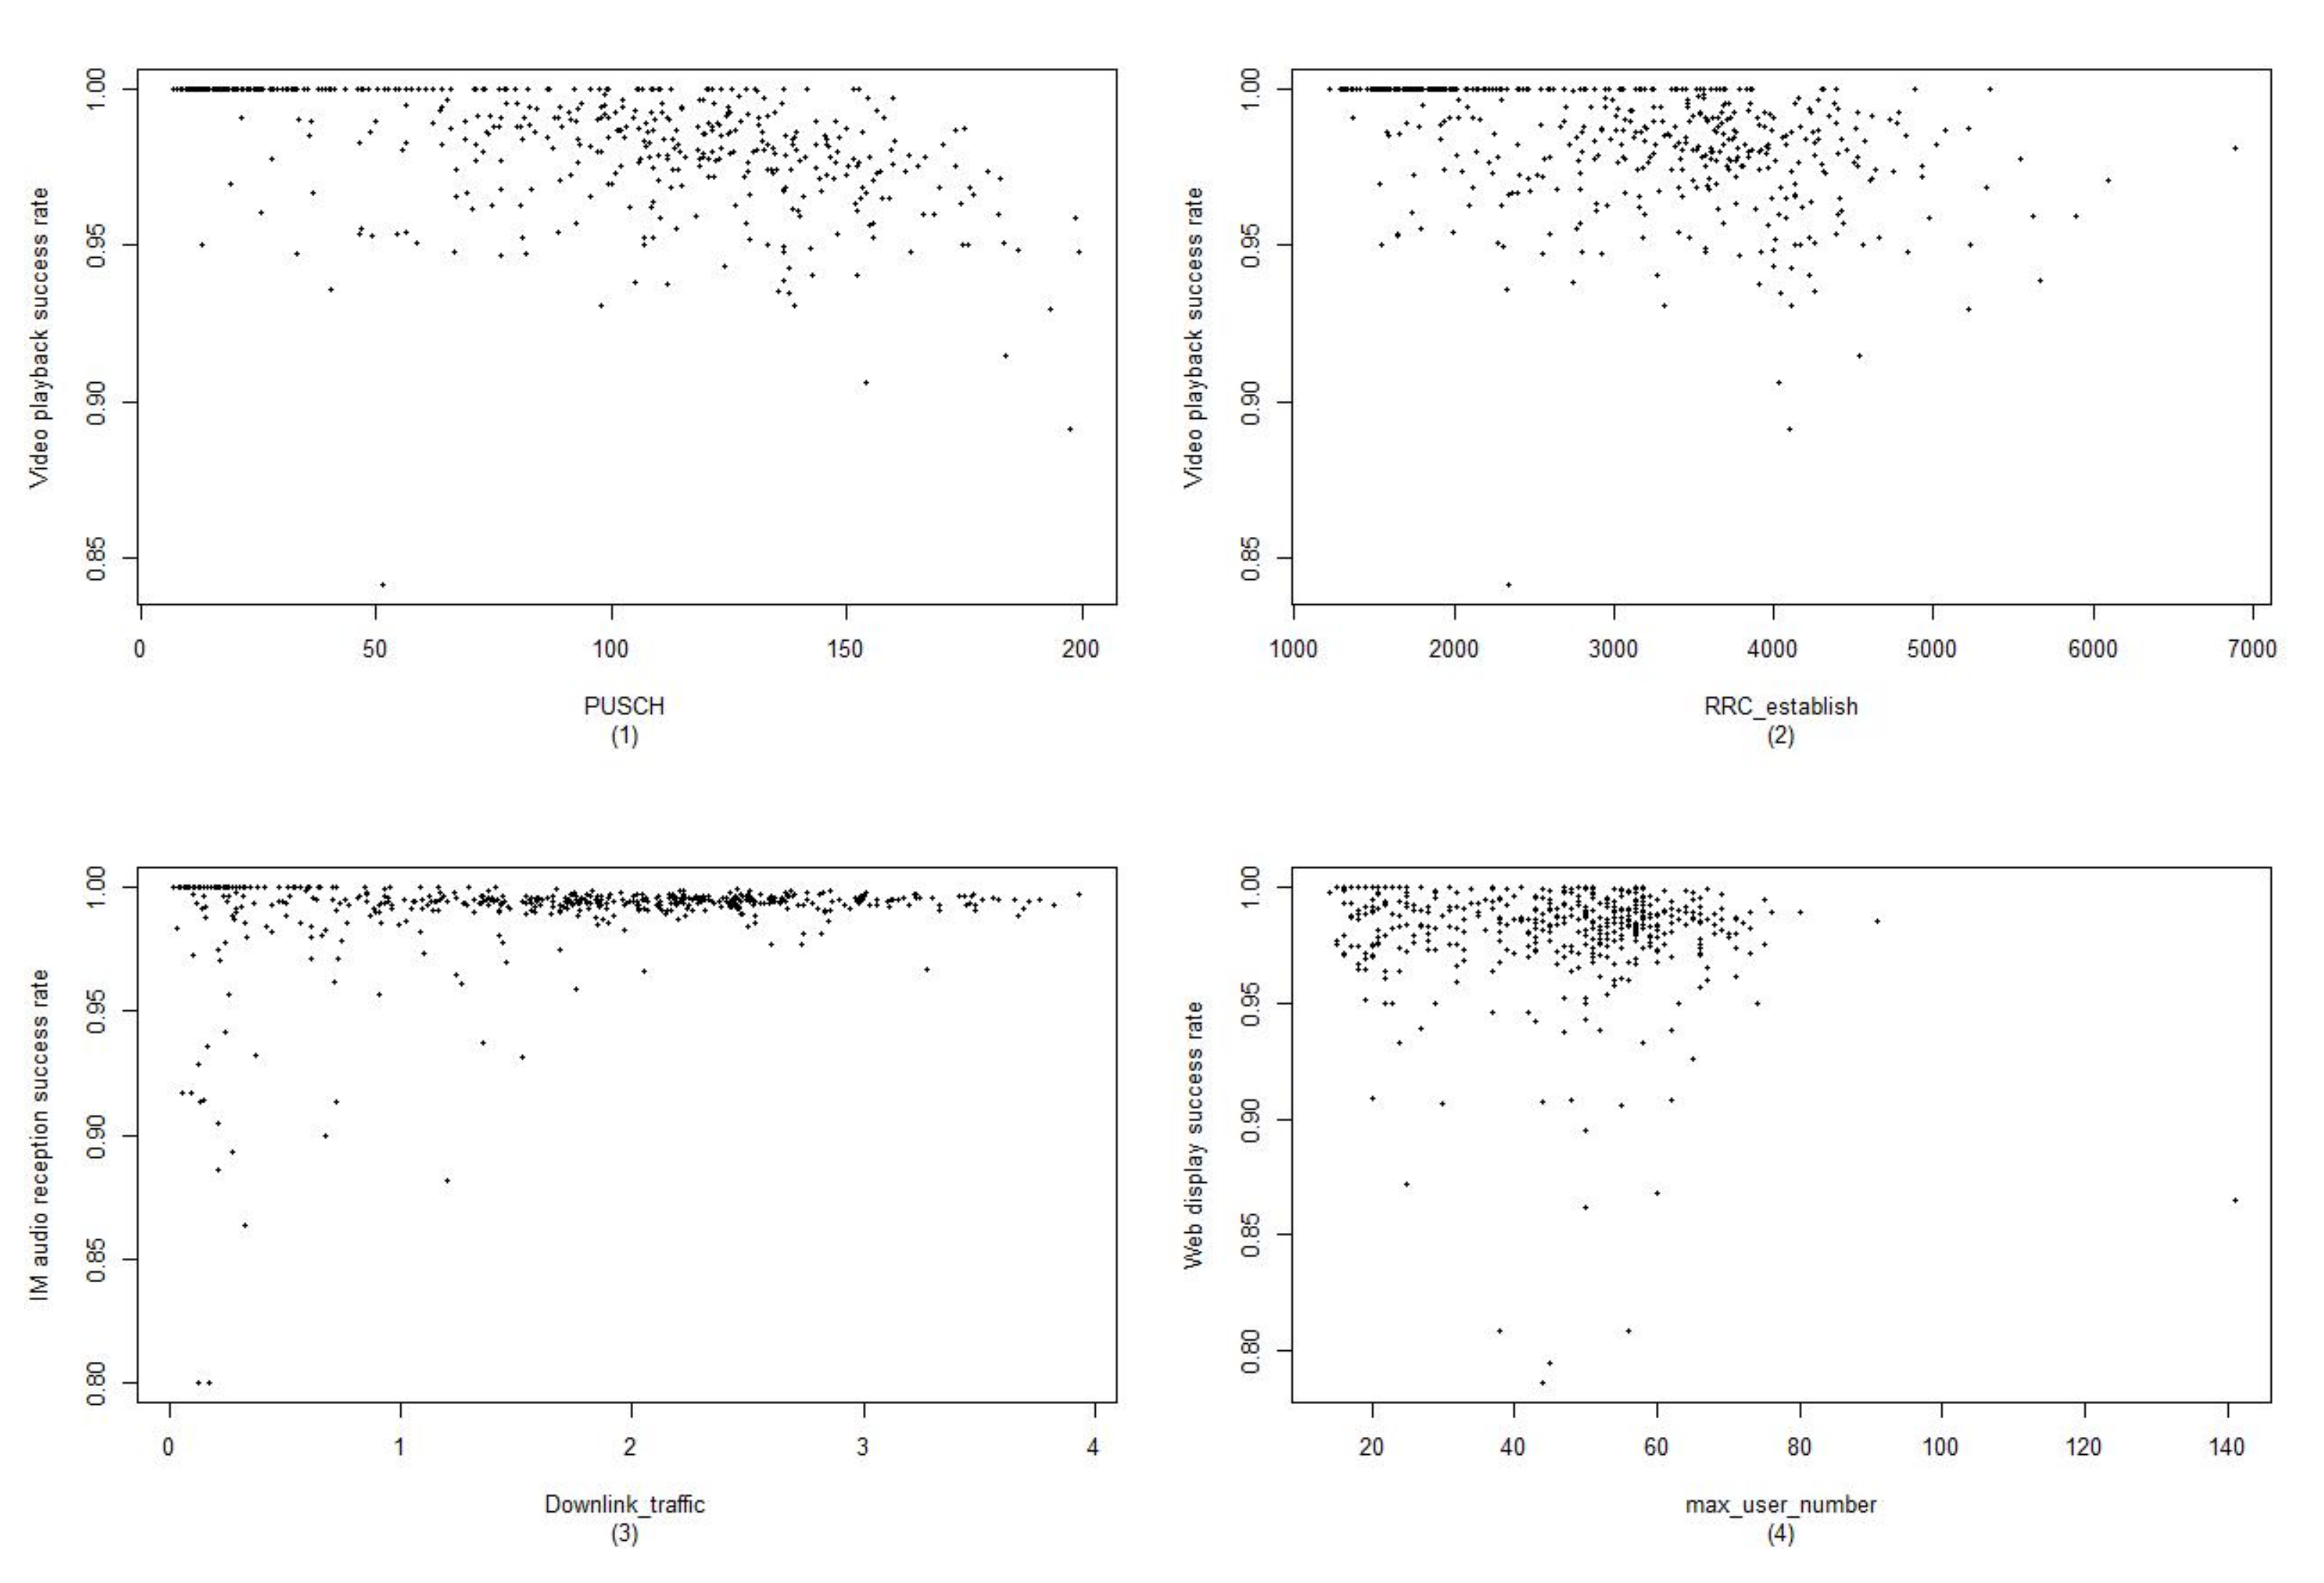
4.1. Evaluation of the Adaptive KDE Naive Bayes Classifier
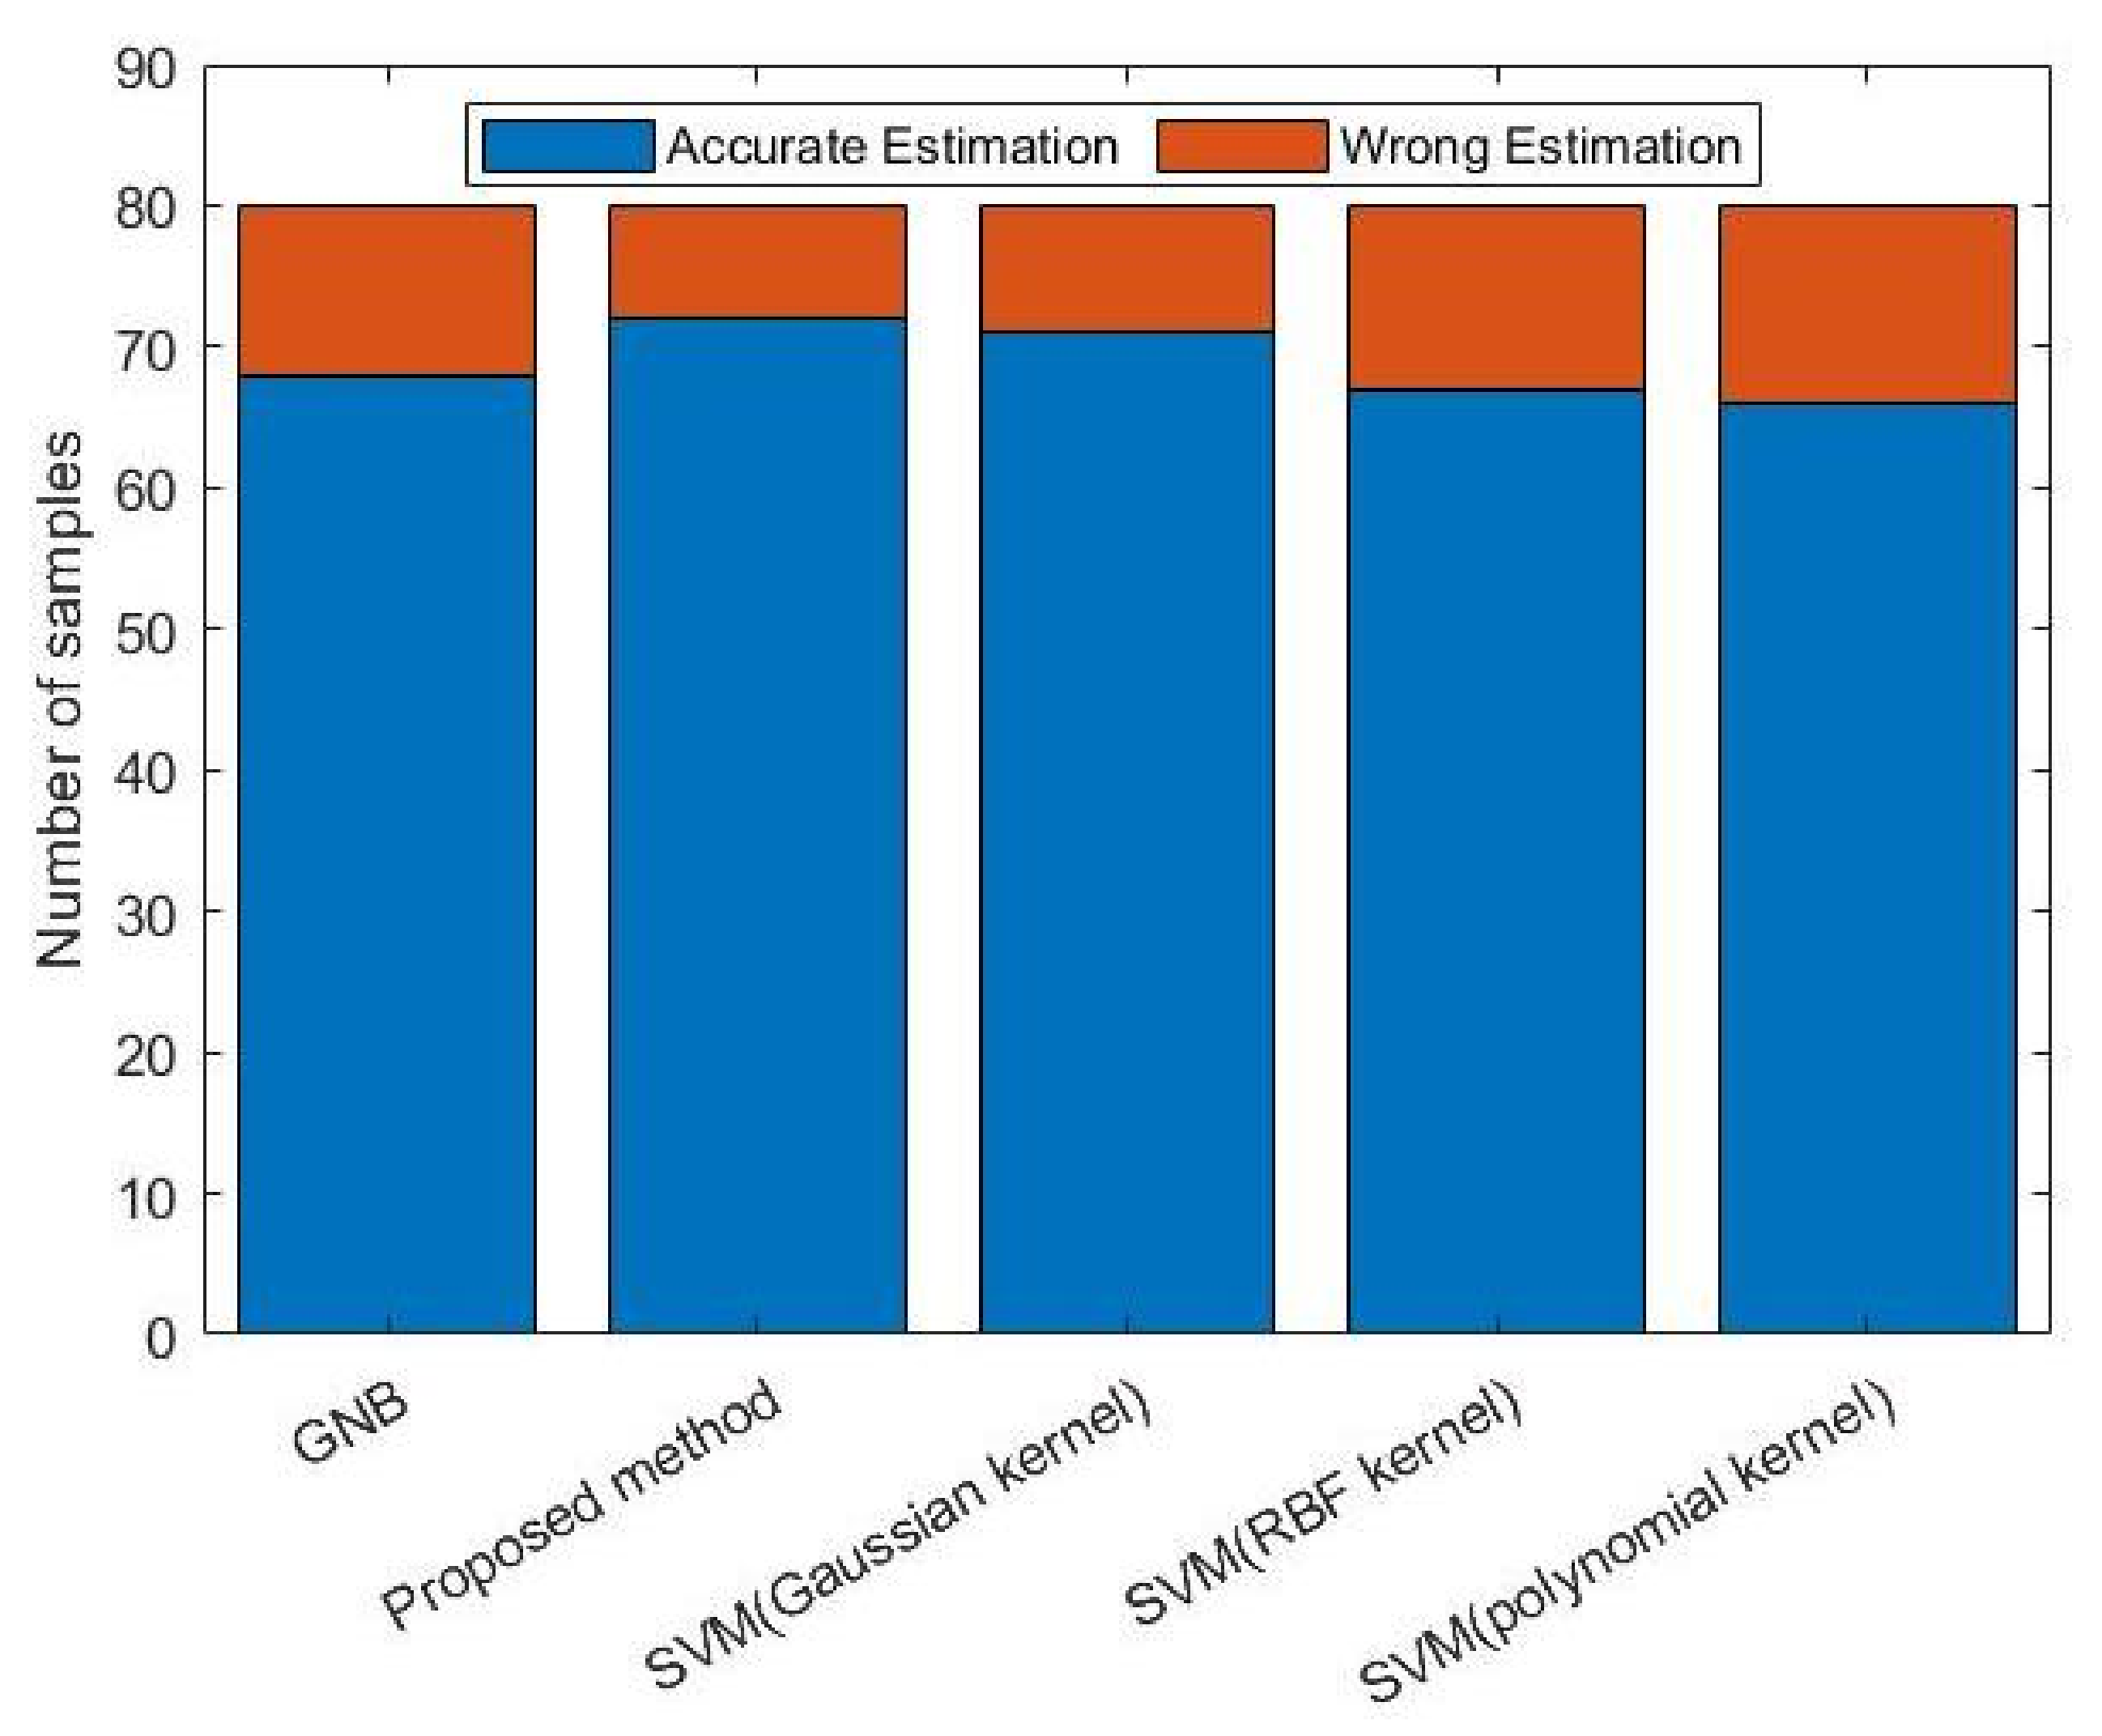
4.2. Evaluation of the Combination of Classifiers with the Voting Mechanism
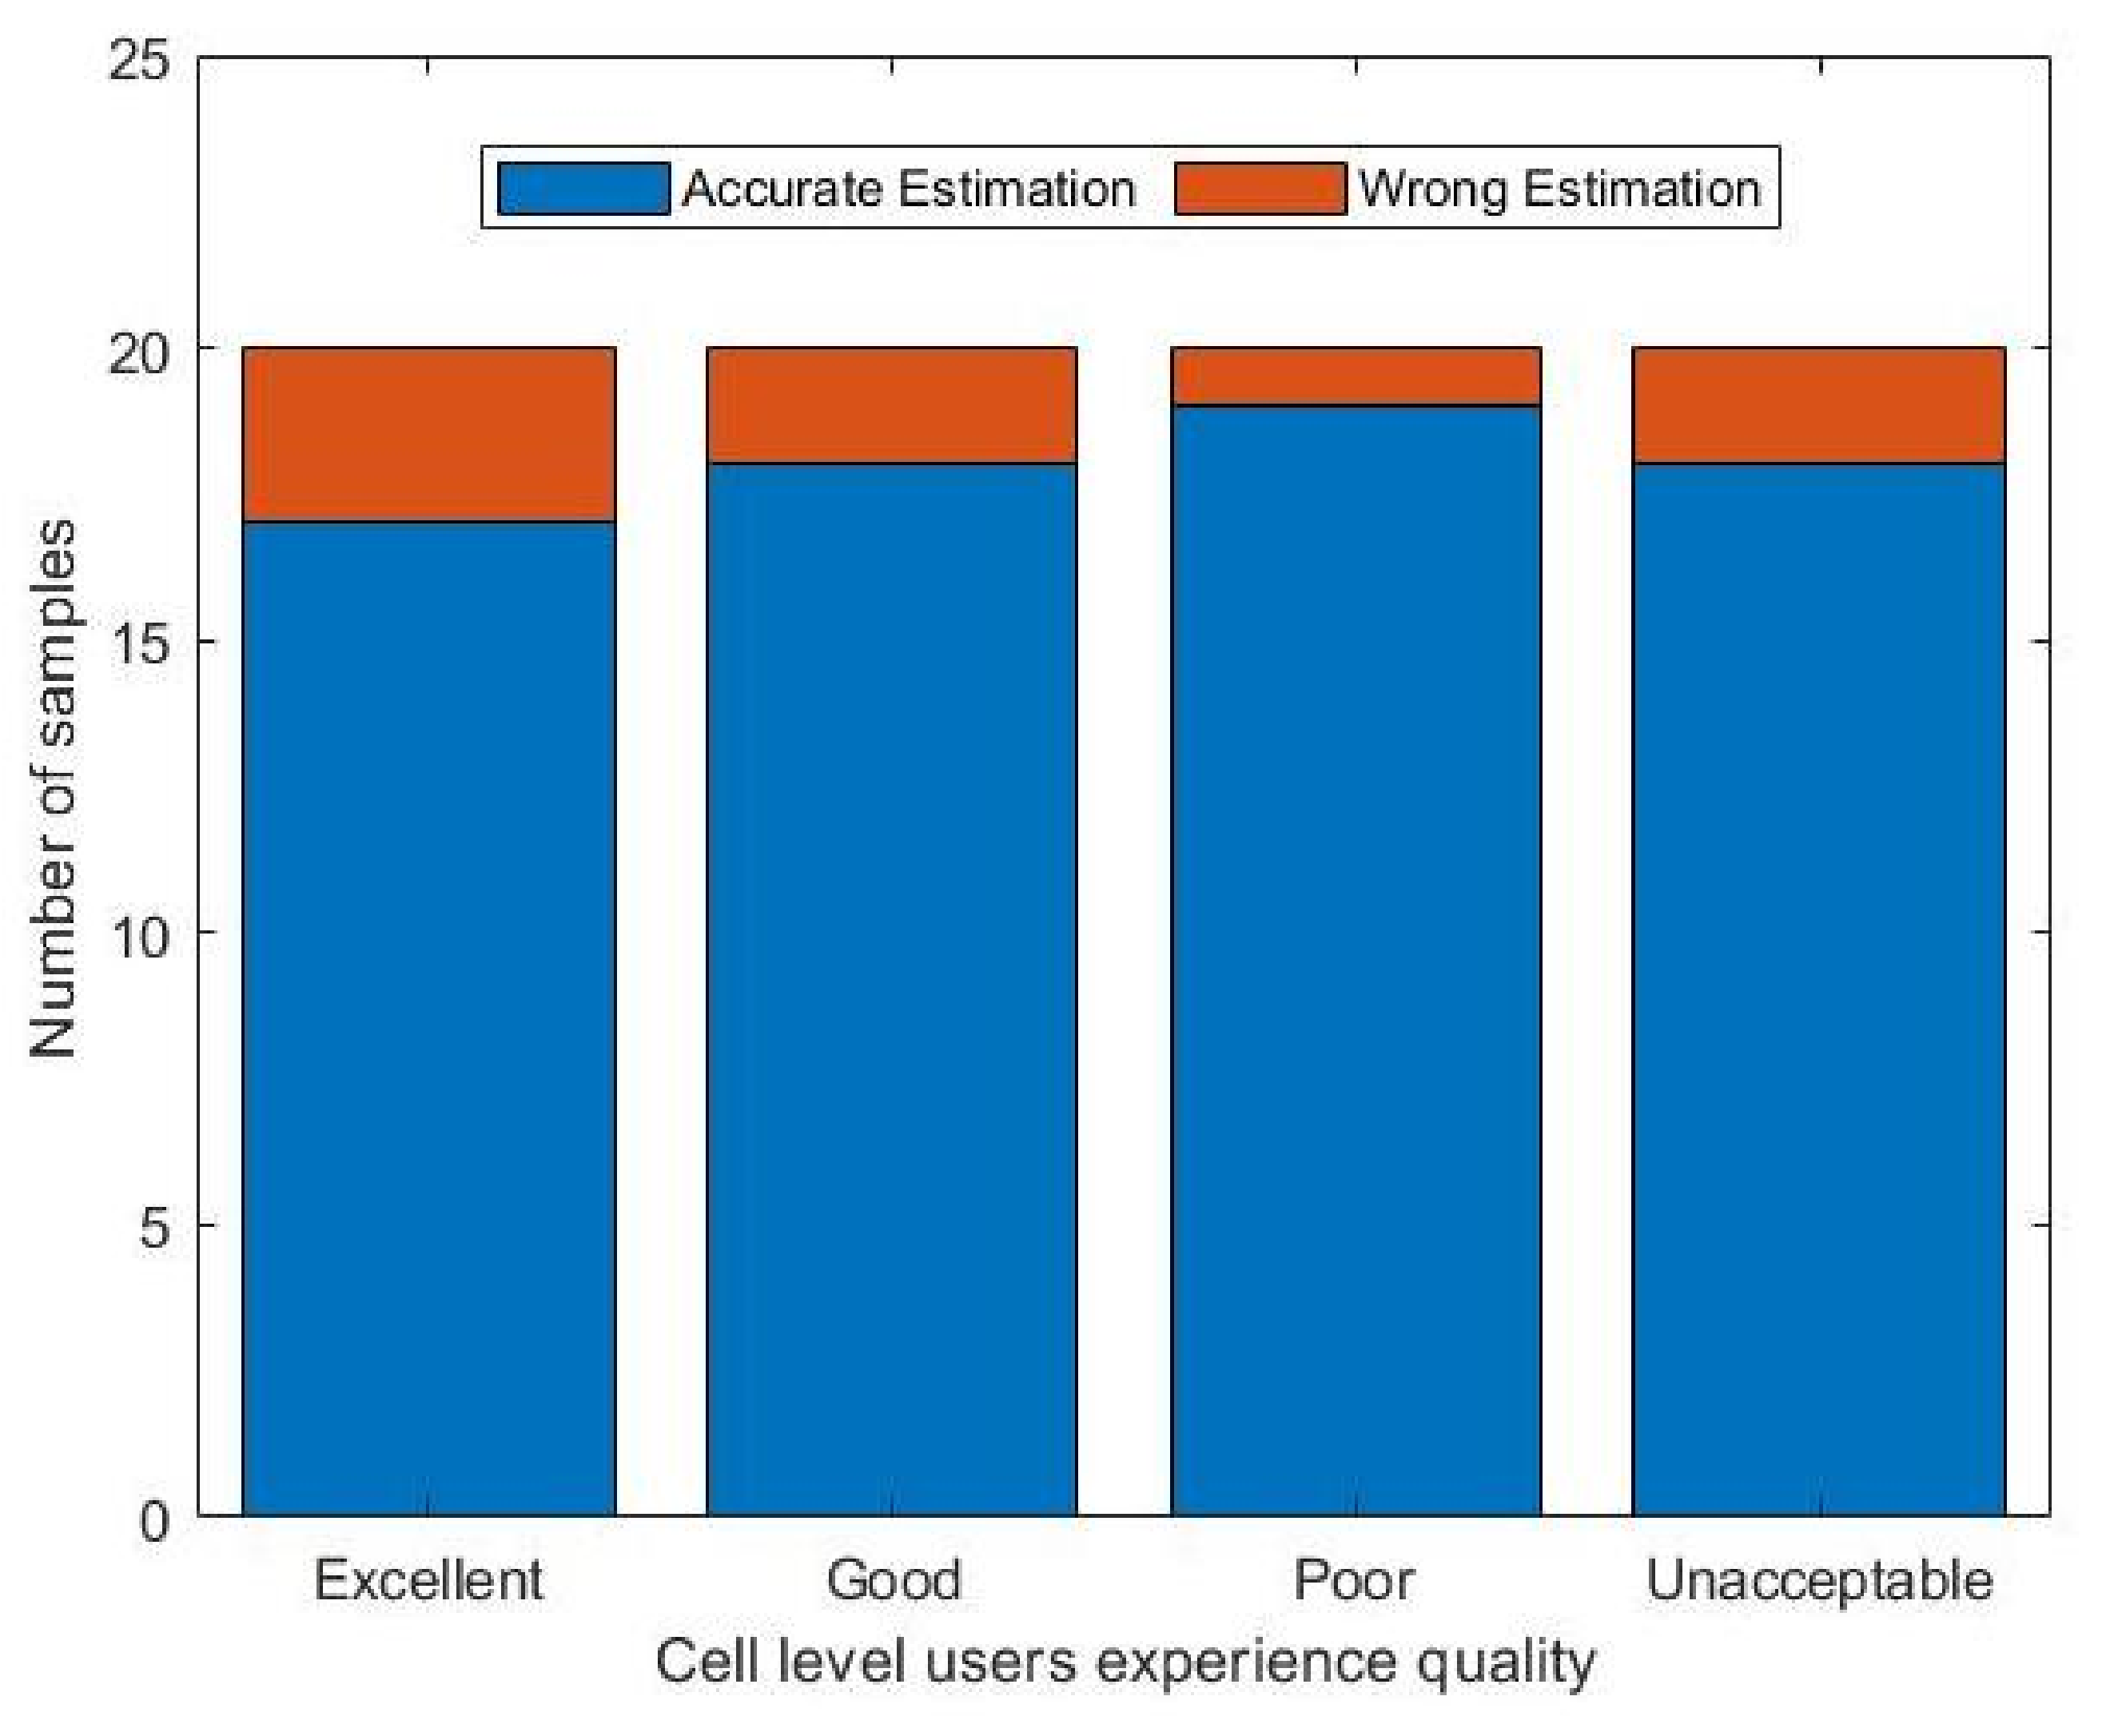
4.3. Cell-Level Multi-Service Perception
5. Discussion
6. Conclusions
Author Contributions
Funding
Institutional Review Board Statement
Informed Consent Statement
Data Availability Statement
Conflicts of Interest
Abbreviations
| KPI | Key performance indicators |
| KQI | Key quality indicators |
| QoS | Quality of service |
| QoE | Quality of experience |
| KDE | Kernel density estimation |
| GNB | Gaussian naive Bayes |
| AKNB | Adaptive kernel-density-estimation-based naive Bayes |
| E-RAB | Evolved radio access bearer |
| RRC | Radio resource control |
| UE | Users |
| eNB | Evolved Node B |
References
- Banovic-curguz, N.; Ilisevic, D. Mapping of QoS/QoE in 5G Networks. In Proceedings of the 42nd International Convention on Information and Communication Technology, Electronics and Microelectronics (MIPRO), Opatija, Croatia, 20–24 May 2019; pp. 404–408. [Google Scholar]
- Anchuen, P.; Uthansakul, P.; Uthansakul, M. QOE model in cellular networks based on QOS measurements using Neural Network approach. In Proceedings of the 13th International Conference on Electrical Engineering/Electronics, Computer, Telecommunications and Information Technology (ECTI-CON), Chiang Mai, Thailand, 28 June–1 July 2016; pp. 1–5. [Google Scholar]
- Vaser, M.; Forconi, S. QoS KPI and QoE KQI Relationship for LTE VIdeo Streaming and VoLTE Services. In Proceedings of the 9th International Conference on Next Generation Mobile Applications, Services and Technologies, Cardiff, UK, 16–19 September 2015; pp. 318–323. [Google Scholar]
- Hobfeld, T.; Fiedler, M.; Gustafsson, J. Betas: Deriving quantiles from MOS-QoS relations of IQX models for QoE management. In Proceedings of the IFIP/IEEE Symposium on Integrated Network and Service Management (IM), Lisbon, Portugal, 8–12 May 2017; pp. 1011–1016. [Google Scholar]
- Ramezani, P.; Jamalipour, A. Toward the Evolution of Wireless Powered Communication Networks for the Future Internet of Things. IEEE Netw. 2017, 31, 62–69. [Google Scholar] [CrossRef]
- Agiwal, M.; Roy, A.; Saxena, N. Next Generation 5G Wireless Networks: A Comprehensive Survey. IEEE Commun. Surv. Tutor. 2016, 18, 1617–1655. [Google Scholar] [CrossRef]
- Bouraqia, K.; Sabir, E.; Sadik, M.; Ladid, L. Quality of Experience for Streaming Services: Measurements, Challenges and Insights. IEEE Access 2020, 8, 13341–13361. [Google Scholar] [CrossRef]
- Zhao, T.; Liu, Q.; Chen, C.W. QoE in video transmission: A user experience-driven strategy. IEEE Commun. Surv. Tutor. 2017, 19, 285–302. [Google Scholar] [CrossRef]
- Laghari, K.R.; Connelly, K. Toward total quality of experience: A QoE model in a communication ecosystem. IEEE Commun. Magzine 2012, 50, 58–65. [Google Scholar] [CrossRef]
- Amour, L.; Boulabiar, M.I.; Souihi, S.; Mellouk, A. An improved QoE estimation method based on QoS and affective computing. In Proceedings of the International Symposium on Programming and Systems (ISPS), Algiers, Algeria, 24–26 April 2018; pp. 1–6. [Google Scholar]
- Garcia, A.C.; Casas, S. Mobile QoE exploration: An unsupervised field study in an Argentine Patagonian city. In Proceedings of the 39th International Conference of the Chilean Computer Science Society (SCCC), Coquimbo, Chile, 16–20 November 2020; pp. 1–7. [Google Scholar]
- Begluk, T.; Husic, J.B.; Barakovic, S. Machine learning-based QoE prediction for video streaming over LTE network. In Proceedings of the 17th International Symposium INFOTEH-JAHORINA (INFOTEH), East Sarajevo, Herzegovina, 21–23 March 2018; pp. 1–5. [Google Scholar]
- Tasaka, S. Bayesian Hierarchical Regression Models for QoE Estimation and Prediction in Audiovisual Communications. IEEE Trans. Multimed. 2017, 19, 1195–1208. [Google Scholar] [CrossRef]
- Gu, H.; Dong, Y.; Cao, T. Data Driven QoE-QoS Association Modeling of Conversational Video. In Proceedings of the IEEE Global Conference on Signal and Information Processing (GlobalSIP), Ottawa, ON, Canada, 11–14 November 2019. [Google Scholar]
- El-Ezzi, Z.Q.; Al-Dulaimi, A.M.; Ibrahim, A.A. Personalized Quality of Experience (QOE) Management using Data Driven Architecture in 5G Wireless Networks. In Proceedings of the 4th International Symposium on Multidisciplinary Studies and Innovative Technologies (ISMSIT), Istanbul, Turkey, 22–24 October 2020; pp. 1–10. [Google Scholar]
- Altozano, M.L.M.; Toril, M.; Luna-Ramírez, S.; Gijon, C. A Self-Tuning Algorithm for Optimal QoE-Driven Traffic Steering in LTE. IEEE Access 2020, 8, 156707–156717. [Google Scholar] [CrossRef]
- Uthansakul, P.; Anchuen, P.; Uthansakul, M.; Ahmad Khan, A. Estimating and Synthesizing QoE Based on QoS Measurement for Improving Multimedia Services on Cellular Networks Using ANN Method. IEEE Trans. Netw. Serv. Manag. 2020, 17, 389–402. [Google Scholar] [CrossRef]
- Chen, J.; Wang, Y.; Li, Y.; Wang, E. QoE-Aware Intelligent Vertical Handoff Scheme Over Heterogeneous Wireless Access Networks. IEEE Access 2018, 6, 38285–38293. [Google Scholar] [CrossRef]
- Pierucci, L.; Micheli, D. A Neural Network for Quality of Experience Estimation in Mobile Communications. IEEE Multimed. 2016, 23, 42–49. [Google Scholar] [CrossRef]
- Ahmad, N.; Wahab, A.; Schormans, J. Importance of Cross-Correlation of QoS metrics in Network Emulators to Evaluate QoE of Video Streaming Applications. In Proceedings of the 11th International Conference on Network of the Future (NoF), Bordeaux, France, 12–14 October 2020; pp. 43–47. [Google Scholar]
- Fan, G.; Shi, W.; Guo, L.; Zeng, J.; Zhang, K.; Gui, G. Machine Learning Based Quantitative Association Rule Mining Method for Evaluating Cellular Network Performance. IEEE Access 2019, 7, 166815–166822. [Google Scholar] [CrossRef]
- Tego, E.; Matera, F. Correlation among QoE/QoS and Network Degradations for Automatic Performance Recovery in a Wide Area Network Test Bed. In Proceedings of the 10th International Conference on Networks of the Future (NoF), Rome, Italy, 1–3 October 2019; pp. 118–121. [Google Scholar]
- Hobfeld, T.; Heegaard, P.E.; Varela, M.; Skorin Kapov, L.; Fiedler, M. From QoS Distributions to QoE Distributions a System’s Perspective. In Proceedings of the 6th IEEE Conference on Network Softwarization (NetSoft), Ghent, Belgium, 29 June–3 July 2020; pp. 51–56. [Google Scholar]
- Youssef, Y.B.; Afif, M.; Ksantini, R.; Tabbane, S. A Novel Online QoE Prediction Model Based on Multiclass Incremental Support Vector Machine. In Proceedings of the IEEE 32nd International Conference on Advanced Information Networking and Applications (AINA), Krakow, Poland, 16–18 May 2018; pp. 334–341. [Google Scholar]
- Qian, L.; Chen, H.; Xie, L. SVM-based QoE estimation model for video streaming service over wireless networks. In Proceedings of the International Conference on Wireless Communications and Signal Processing (WCSP), Nanjing, China, 15–17 October 2015. [Google Scholar]
- Elwerghemmi, R.; Heni, M.; Ksantini, R.; Bouallegue, R. Online QoE Prediction Model Based on Stacked Multiclass Incremental Support Vector Machine. In Proceedings of the 8th International Conference on Modeling Simulation and Applied Optimization (ICMSAO), Manama, Bahrain, 15–17 April 2019. [Google Scholar]
- Eckert-Gallup, A.; Martin, N. Kernel density estimation (KDE) with adaptive bandwidth selection for environmental contours of extreme sea states. In Proceedings of the OCEANS 2016 MTS/IEEE Monterey, Monterey, CA, USA, 19–23 September 2016. [Google Scholar]
- Shitara, Y.; Yamazaki, T.; Yamori, K.; Miyoshi, T. Congestion field detection for Service Quality improvement using Kernel density estimation. In Proceedings of the 18th Asia-Pacific Network Operations and Management Symposium (APNOMS), Kanazawa, Japan, 5–7 October 2016. [Google Scholar]
- Kinoshita, T.; Yamamoto, T. Design of a Data-Driven Control System Based on the Abnormality Using Kernel Density Estimation. In Proceedings of the 57th Annual Conference of the Society of Instrument and Control Engineers of Japan (SICE), Nara, Japan, 11–14 September 2018; pp. 196–201. [Google Scholar]
- Shimazaki, H.; Shinomoto, S. Kernel bandwidth optimization in spike rate estimation. J. Comput. Neurosci. 2009, 29, 171–182. [Google Scholar] [CrossRef] [PubMed] [Green Version]
- Sasongko, T.B.; Arifin, O.; Al Fatta, H. Optimization of Hyper Parameter Bandwidth on Naïve Bayes Kernel Density Estimation for the Breast Cancer Classification. In Proceedings of the International Conference on Information and Communications Technology (ICOIACT), Yogyakarta, Indonesia, 24–25 July 2019; pp. 226–231. [Google Scholar]
- Denton, A.; Perrizo, W. A Kernel-Based Semi-Naive Bayesian Classifier Using P-Trees. In Proceedings of the 2004 SIAM International Conference on Data Mining, Lake Buena Vista, FL, USA, 22–24 April 2004; pp. 404–408. [Google Scholar]
- Yildirim, P.; Birant, D. Naive Bayes classifier for continuous variables using novel method (NBC4D) and distributions. In Proceedings of the IEEE International Symposium on Innovations in Intelligent Systems and Applications (INISTA) Proceedings, Alberobello, Italy, 23–25 June 2014; pp. 110–115. [Google Scholar]
- Zhang, X. LTE Optimization Engineering Handbook, 1st ed.; Wiley-IEEE Press: Hoboken, NJ, USA, 2017. [Google Scholar]
- Chun-Sheng, Z.; Yan, L. Extension of local association rules mining algorithm based on a priori algorithm. In Proceedings of the IEEE 5th International Conference on Software Engineering and Service Science, Beijing, China, 27–29 June 2014; pp. 340–343. [Google Scholar]
- Fan, G.; Wang, J.; Zhang, K.; Zeng, J.; Gui, G. Cellular Network Performance using Machine Learning based Quantitative Association Rule Mining Method. In Proceedings of the IEEE 91st Vehicular Technology Conference (VTC), Antwerp, Belgium, 25–28 May 2020; pp. 1–5. [Google Scholar]
- Sheather, S.J.; Jones, M.C. A reliable data-based bandwidth selection method for kernel density estimation. J. R. Stat. Soc. 1991, 53, 683–690. [Google Scholar] [CrossRef]
- Simonoff, J.S. Smoothing Methods in Statistics, 1st ed.; Springer: Berlin/Heidelberg, Germany, 1996. [Google Scholar]
- Ma, T.M.; Yamamori, K.; Thida, A. A Comparative Approach to Nave Bayes Classifier and Support Vector Machine for Email Spam Classification. In Proceedings of the IEEE 9th Global Conference on Consumer Electronics (GCCE), Kobe, Japan, 13–16 October 2020. [Google Scholar]


| KPIs Types | KPIs |
|---|---|
| Accessibility | RRC_establish, E-RAB_establish |
| Mobility | Intra/inter_frequency_handover, Intra/inter_eNB_handover |
| Network Quality | Uplink_MAC_block_error, Downlink_MAC_block_error |
| Capacity | Uplink/Downlink PRB, PUSCH, PDSCH |
| Potential Resource | Average user, Max user, Uplink/Downlink traffic |
| KQIs Types | KQI |
|---|---|
| Web service | Response_success_rate |
| IM (Instant messaging) service | Receiving_success_rate |
| Video service | Playback_success_rate |
| KPIs Types | Cause of Failure |
|---|---|
| Accessibility | Interference and congestion wireless environment |
| Mobility | Handover parameter configuration and base station identification configuration |
| Network Quality | Hardware failure and strong interference |
| Capacity | Base station failure and weak coverage |
| Potential Resource | Capacity expansion and resource allocation for different services |
| Cell Level Users Experience Quality | IM | Video | Web Browsing |
|---|---|---|---|
| Unacceptable | Abnormal | Abnormal | Abnormal |
| Abnormal | Abnormal | Normal | |
| Poor | Normal | Abnormal | Abnormal |
| Abnormal | Normal | Abnormal | |
| Abnormal | Normal | Normal | |
| Good | Normal | Abnormal | Normal |
| Normal | Normal | Abnormal | |
| Excellent | Normal | Normal | Normal |
| KQI Types | KPI Types | AKNB | GNB | KNN |
|---|---|---|---|---|
| Accessibility | 0.7845 | 0.744 | 0.6528 | |
| Mobility | 0.8193 | 0.7957 | 0.6436 | |
| Video | Network Quality | 0.8254 | 0.8088 | 0.7822 |
| Capacity | 0.8091 | 0.8095 | 0.8614 | |
| Potential Resource | 0.8079 | 0.8053 | 0.8119 | |
| Accessibility | 0.7989 | 0.7475 | 0.7873 | |
| Mobility | 0.7847 | 0.7254 | 0.7019 | |
| IM | Network Quality | 0.8413 | 0.8413 | 0.8515 |
| Capacity | 0.8543 | 0.6782 | 0.7183 | |
| Potential Resource | 0.7554 | 0.6881 | 0.8465 | |
| Accessibility | 0.8132 | 0.7843 | 0.7962 | |
| Mobility | 0.7925 | 0.7854 | 0.8114 | |
| Web | Network Quality | 0.8819 | 0.861 | 0.8713 |
| Capacity | 0.831 | 0.8517 | 0.7908 | |
| Potential Resource | 0.9009 | 0.8502 | 0.8631 |
| Video Service | Accuracy | Sensitivity | Specificity | Complexity |
|---|---|---|---|---|
| KNN | 0.7567 | 0.7526 | 0.7977 | O (nd) |
| SVM polynomial | 0.791 | 0.7724 | 0.8352 | O (dn) |
| SVM RBF | 0.7967 | 0.798 | 0.7043 | O (dn) |
| SVM Gaussian | 0.8106 | 0.8212 | 0.8178 | O (dn) |
| Proposed method | 0.8073 | 0.8149 | 0.8237 | O (nd) |
| Excellent | Good | Poor | Unacceptable | ||||
|---|---|---|---|---|---|---|---|
| Accurate | Wrong | Accurate | Wrong | Accurate | Wrong | Accurate | Wrong |
| 17 | 3 | 18 | 2 | 19 | 1 | 18 | 2 |
Publisher’s Note: MDPI stays neutral with regard to jurisdictional claims in published maps and institutional affiliations. |
© 2021 by the authors. Licensee MDPI, Basel, Switzerland. This article is an open access article distributed under the terms and conditions of the Creative Commons Attribution (CC BY) license (https://creativecommons.org/licenses/by/4.0/).
Share and Cite
Zhang, K.; Chuai, G.; Maimaiti, S.; Liu, Q. User Experience Estimation in Multi-Service Scenario of Cellular Network. Sensors 2022, 22, 89. https://doi.org/10.3390/s22010089
Zhang K, Chuai G, Maimaiti S, Liu Q. User Experience Estimation in Multi-Service Scenario of Cellular Network. Sensors. 2022; 22(1):89. https://doi.org/10.3390/s22010089
Chicago/Turabian StyleZhang, Kaisa, Gang Chuai, Saidiwaerdi Maimaiti, and Qian Liu. 2022. "User Experience Estimation in Multi-Service Scenario of Cellular Network" Sensors 22, no. 1: 89. https://doi.org/10.3390/s22010089
APA StyleZhang, K., Chuai, G., Maimaiti, S., & Liu, Q. (2022). User Experience Estimation in Multi-Service Scenario of Cellular Network. Sensors, 22(1), 89. https://doi.org/10.3390/s22010089