
Detection of Motion on a Trampoline with a Smartwatch

Abstract
:1. Introduction
2. Related Works
2.1. Systems for Promoting Trampoline Exercise
2.2. Motion Sensor-Based Human Activity Recognition
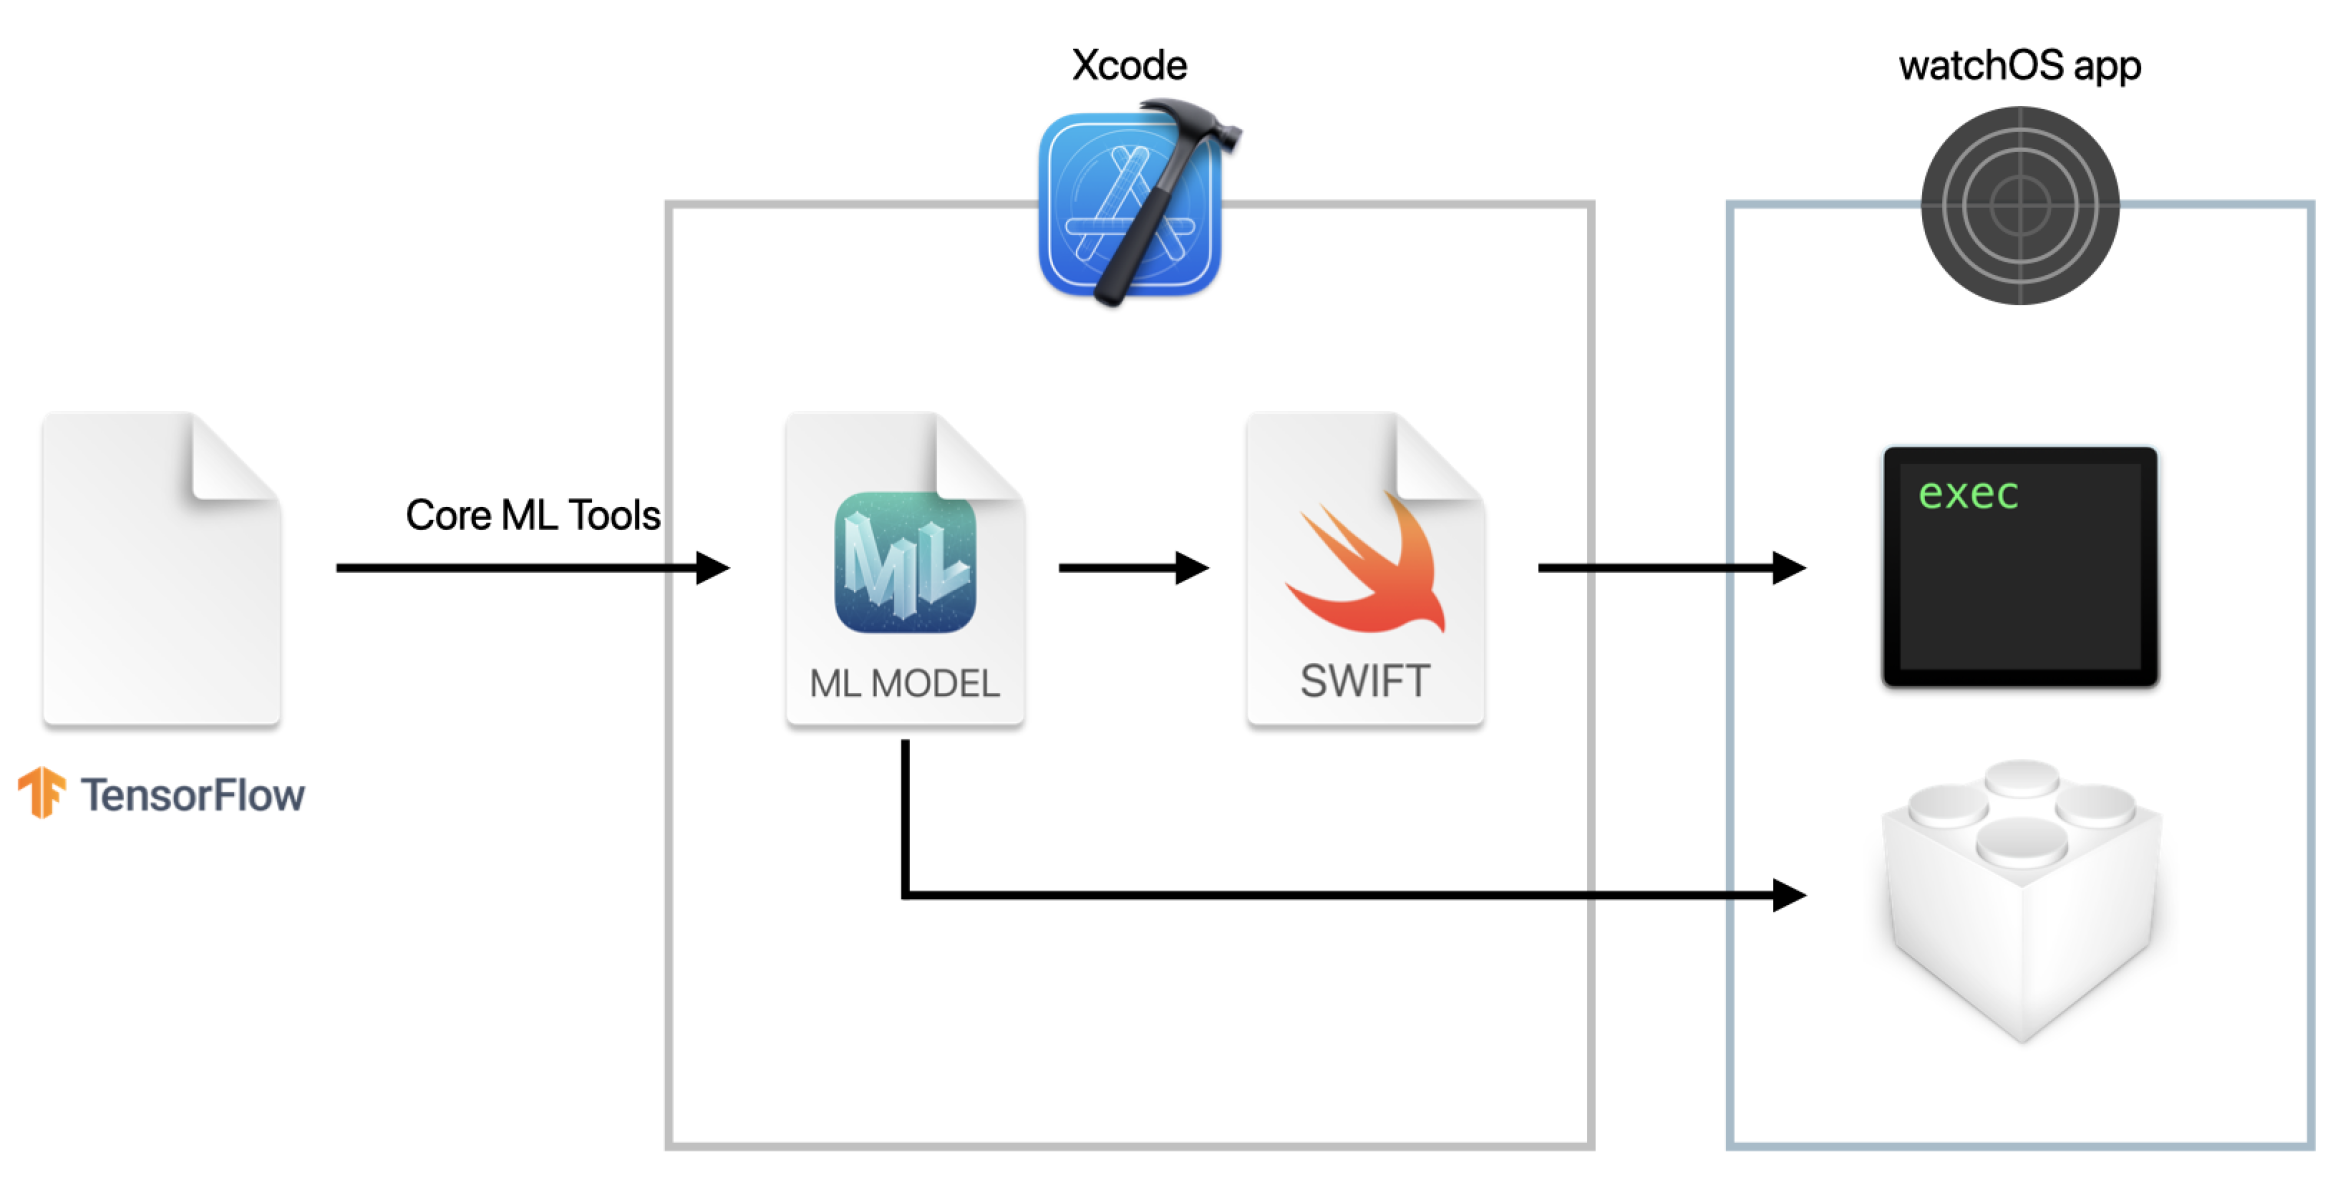
2.3. On-Device Deep Learning
2.4. Contributions of the Study
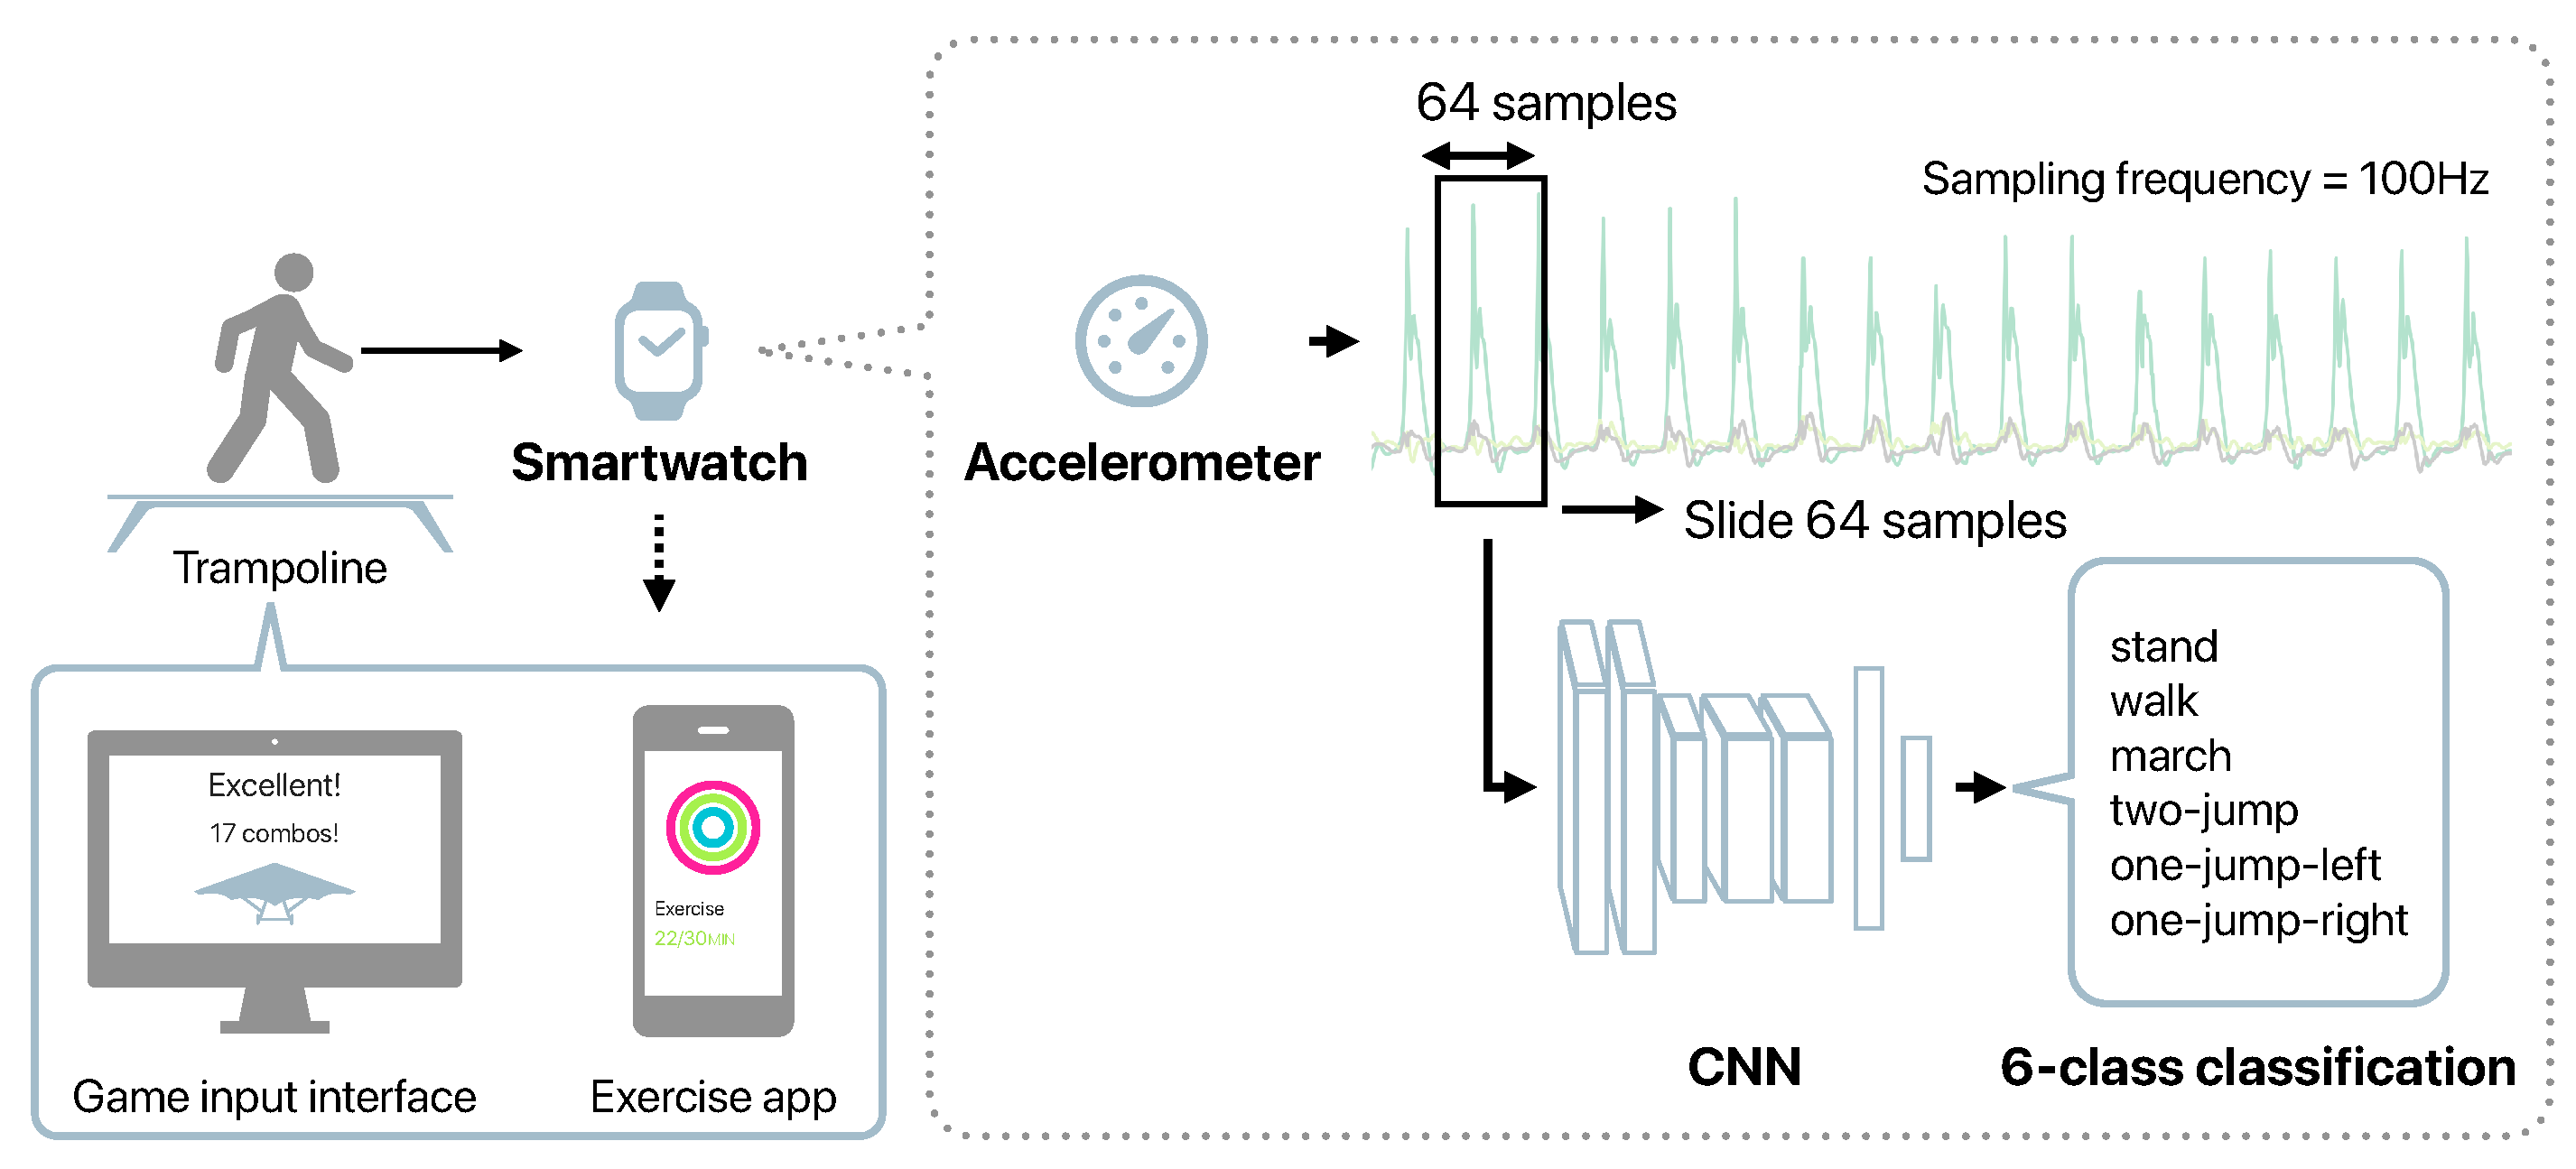
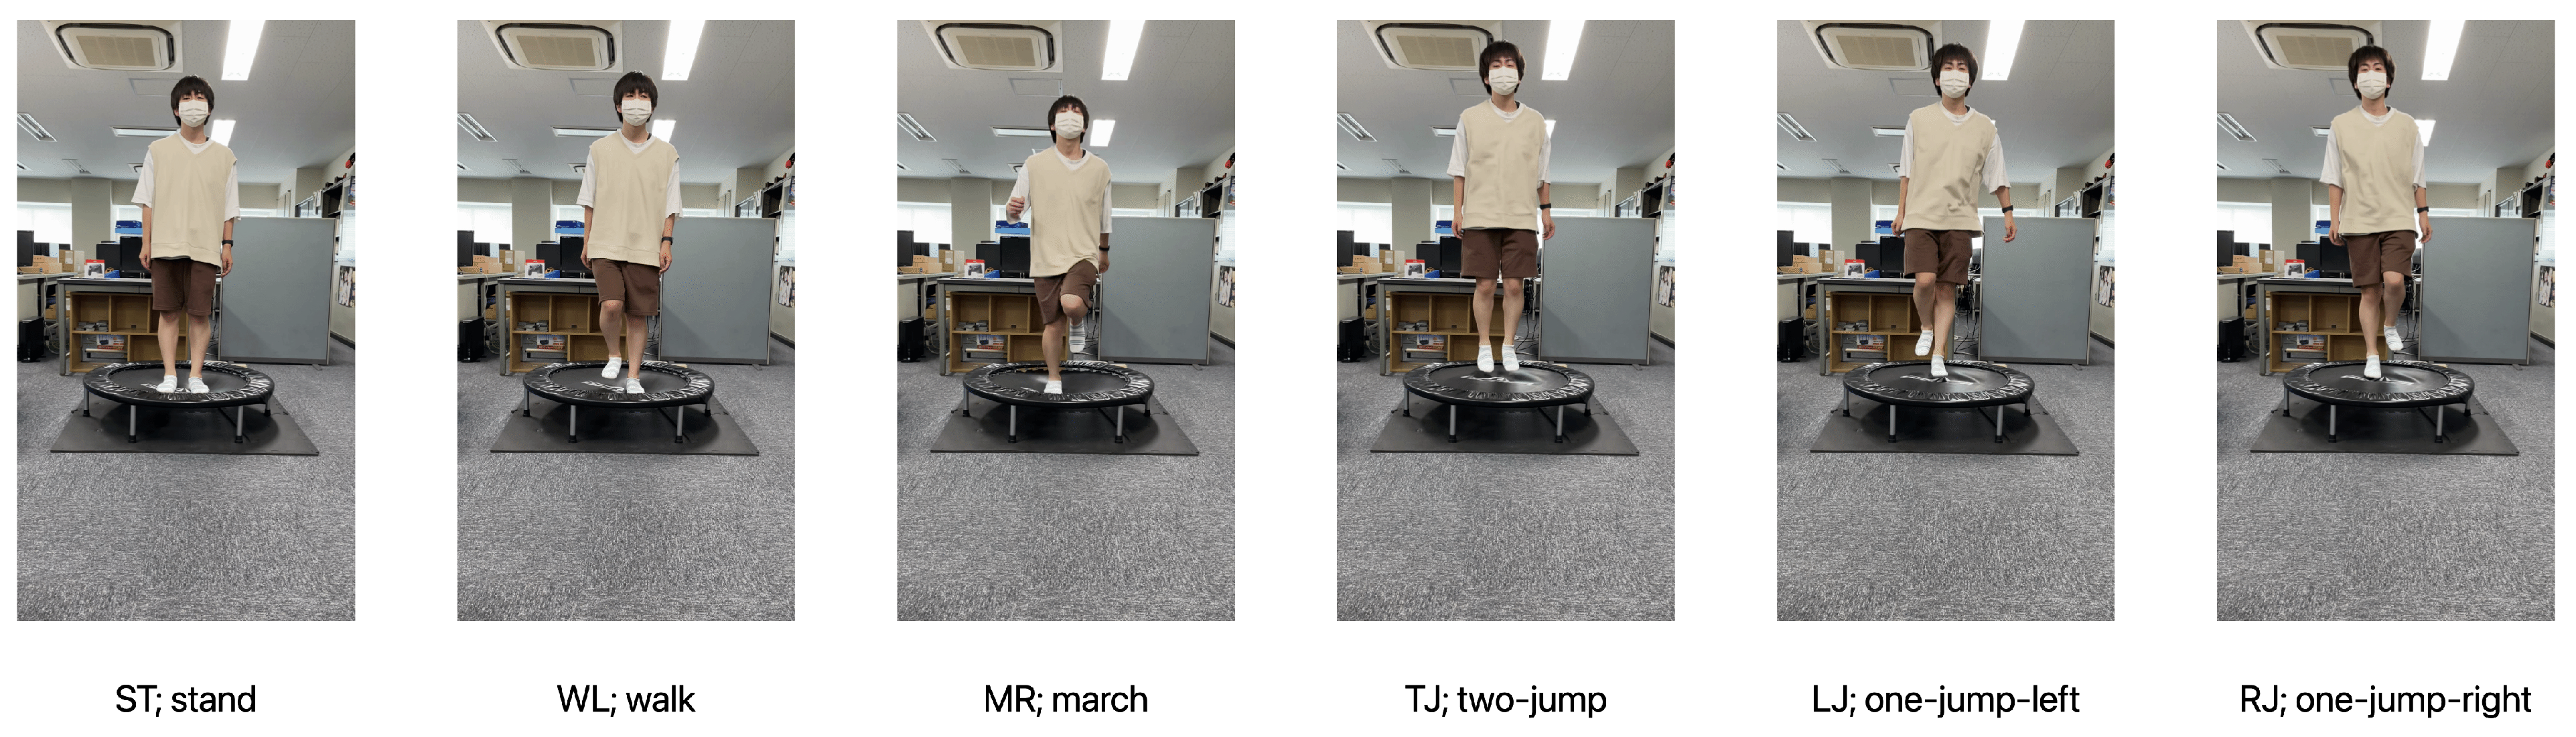
- We propose a method for detecting the motions on a trampoline using a smartwatch.
- We investigate how detailed the motion detection on the trampoline can be estimated from the acceleration data obtained from the smartwatch.
- We implement our method as an application that runs on a smartwatch, and evaluate its effectiveness in terms of the prediction time and the battery consumption.
3. Method of Detecting Motions on a Trampoline with a Smartwatch
4. Experiments for Evaluating the Classification Performance
4.1. Data Collection
4.2. Baseline
4.3. Evaluation Method
5. Results
5.1. Estimation Accuracy
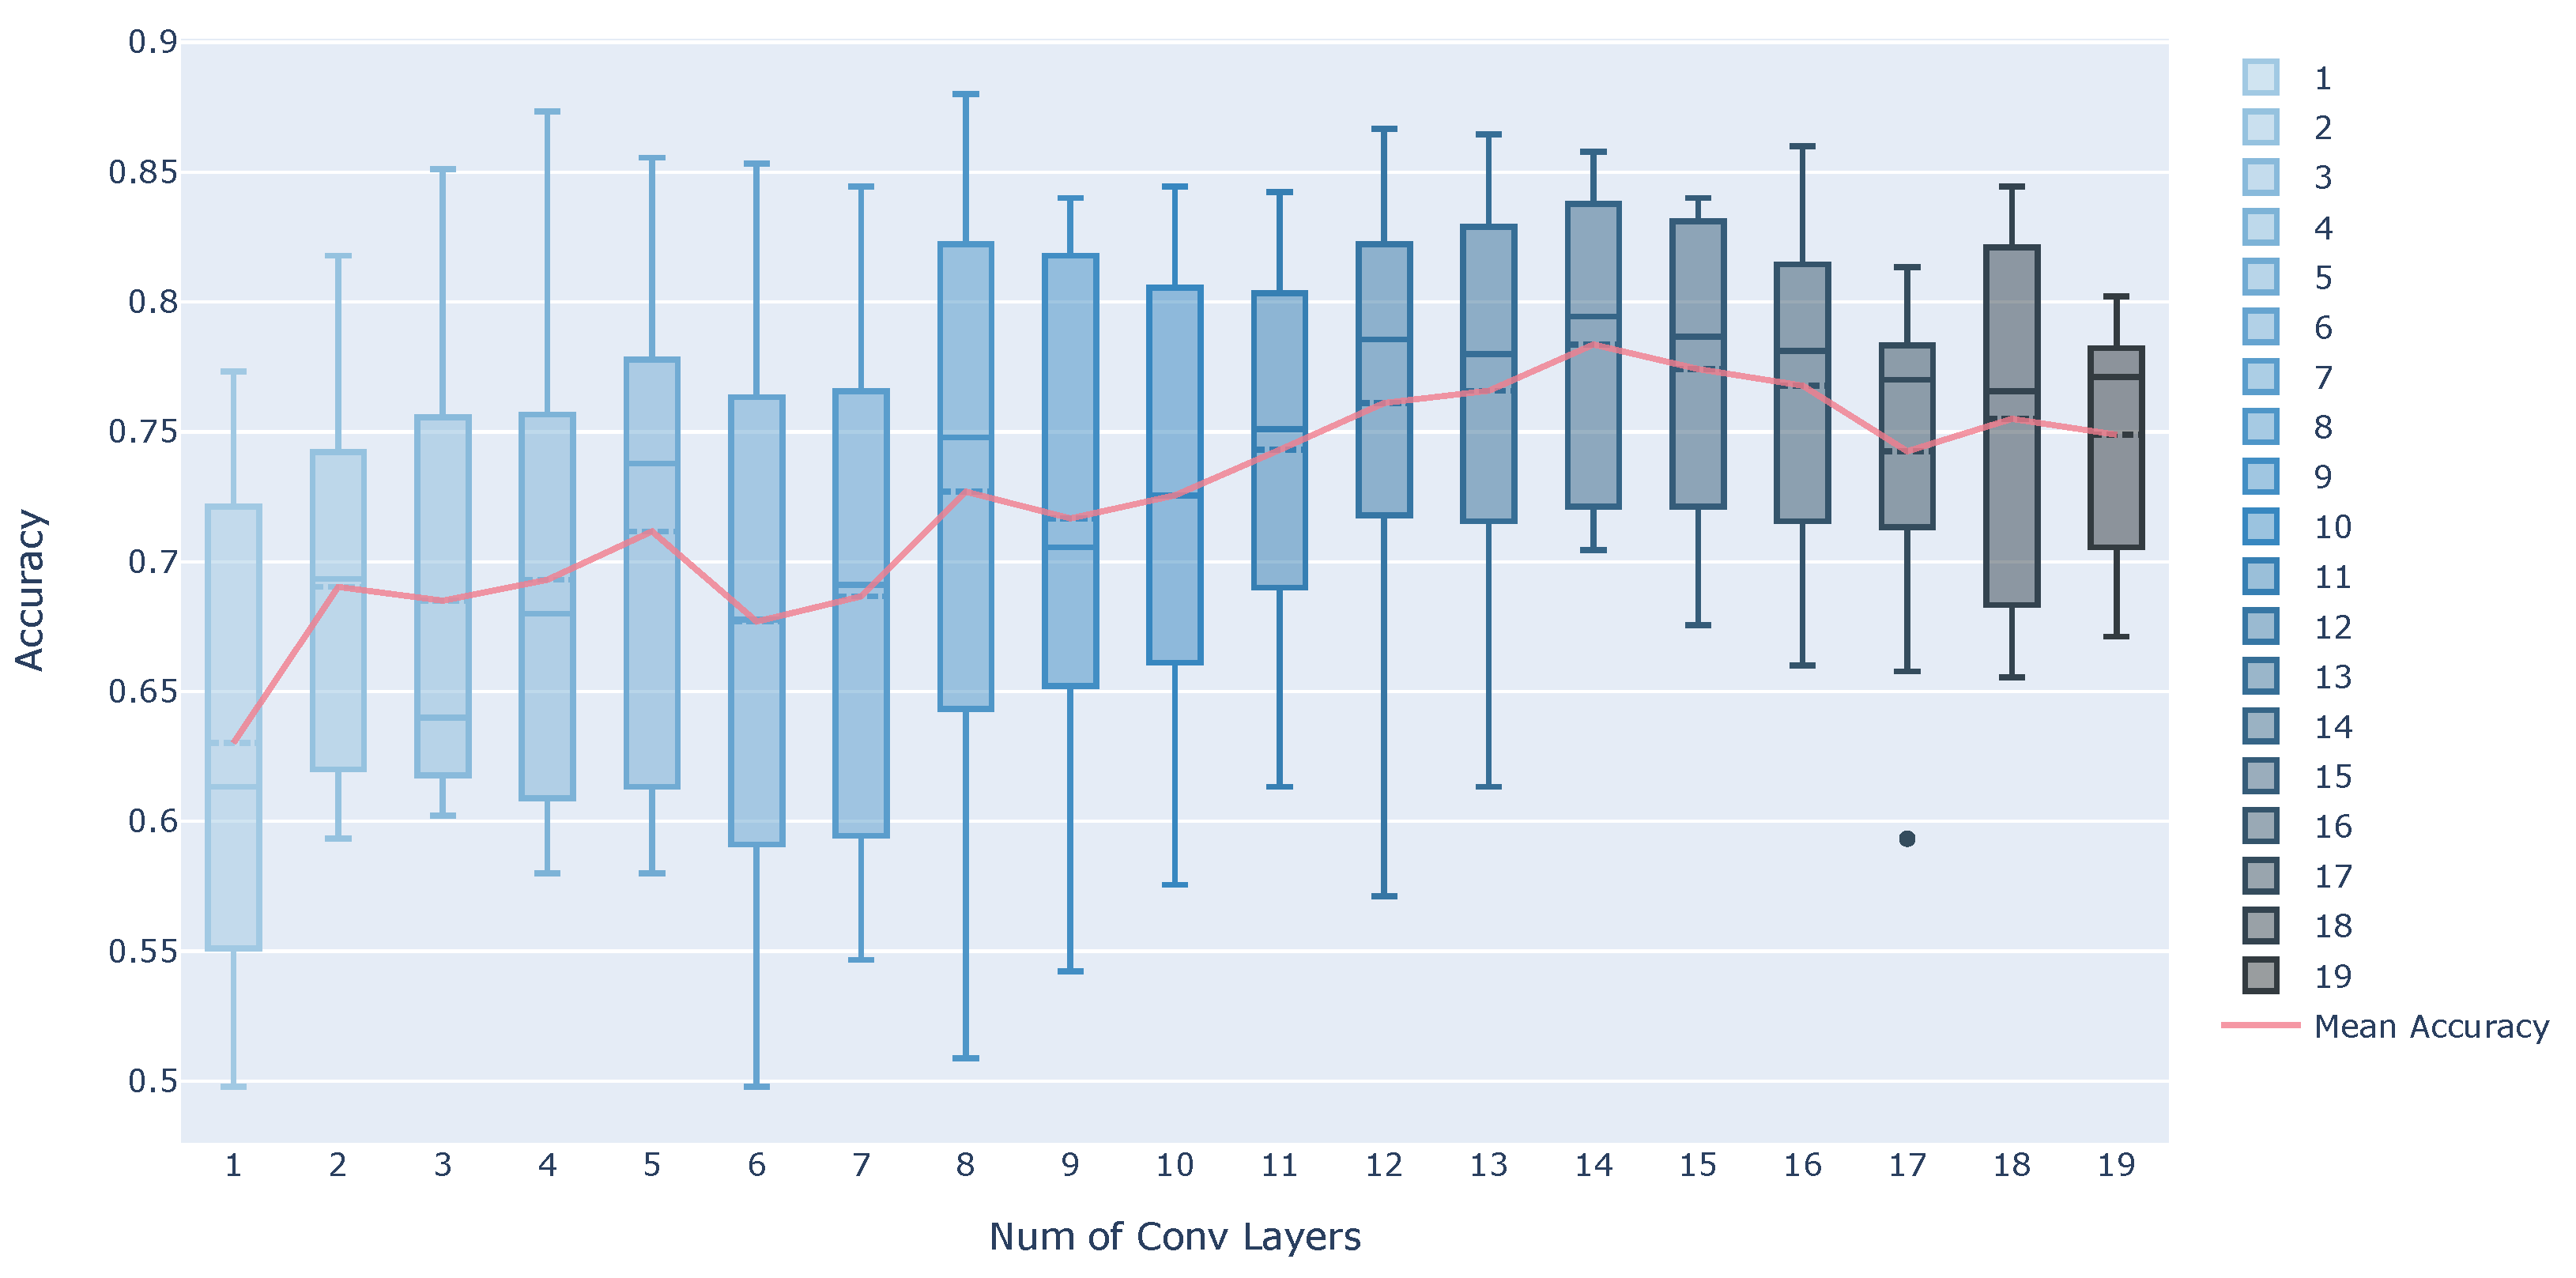
5.2. Verification of Estimation Accuracy When the Number of Convolutional Layers Is Changed
5.3. Possibility of Detailed Classification
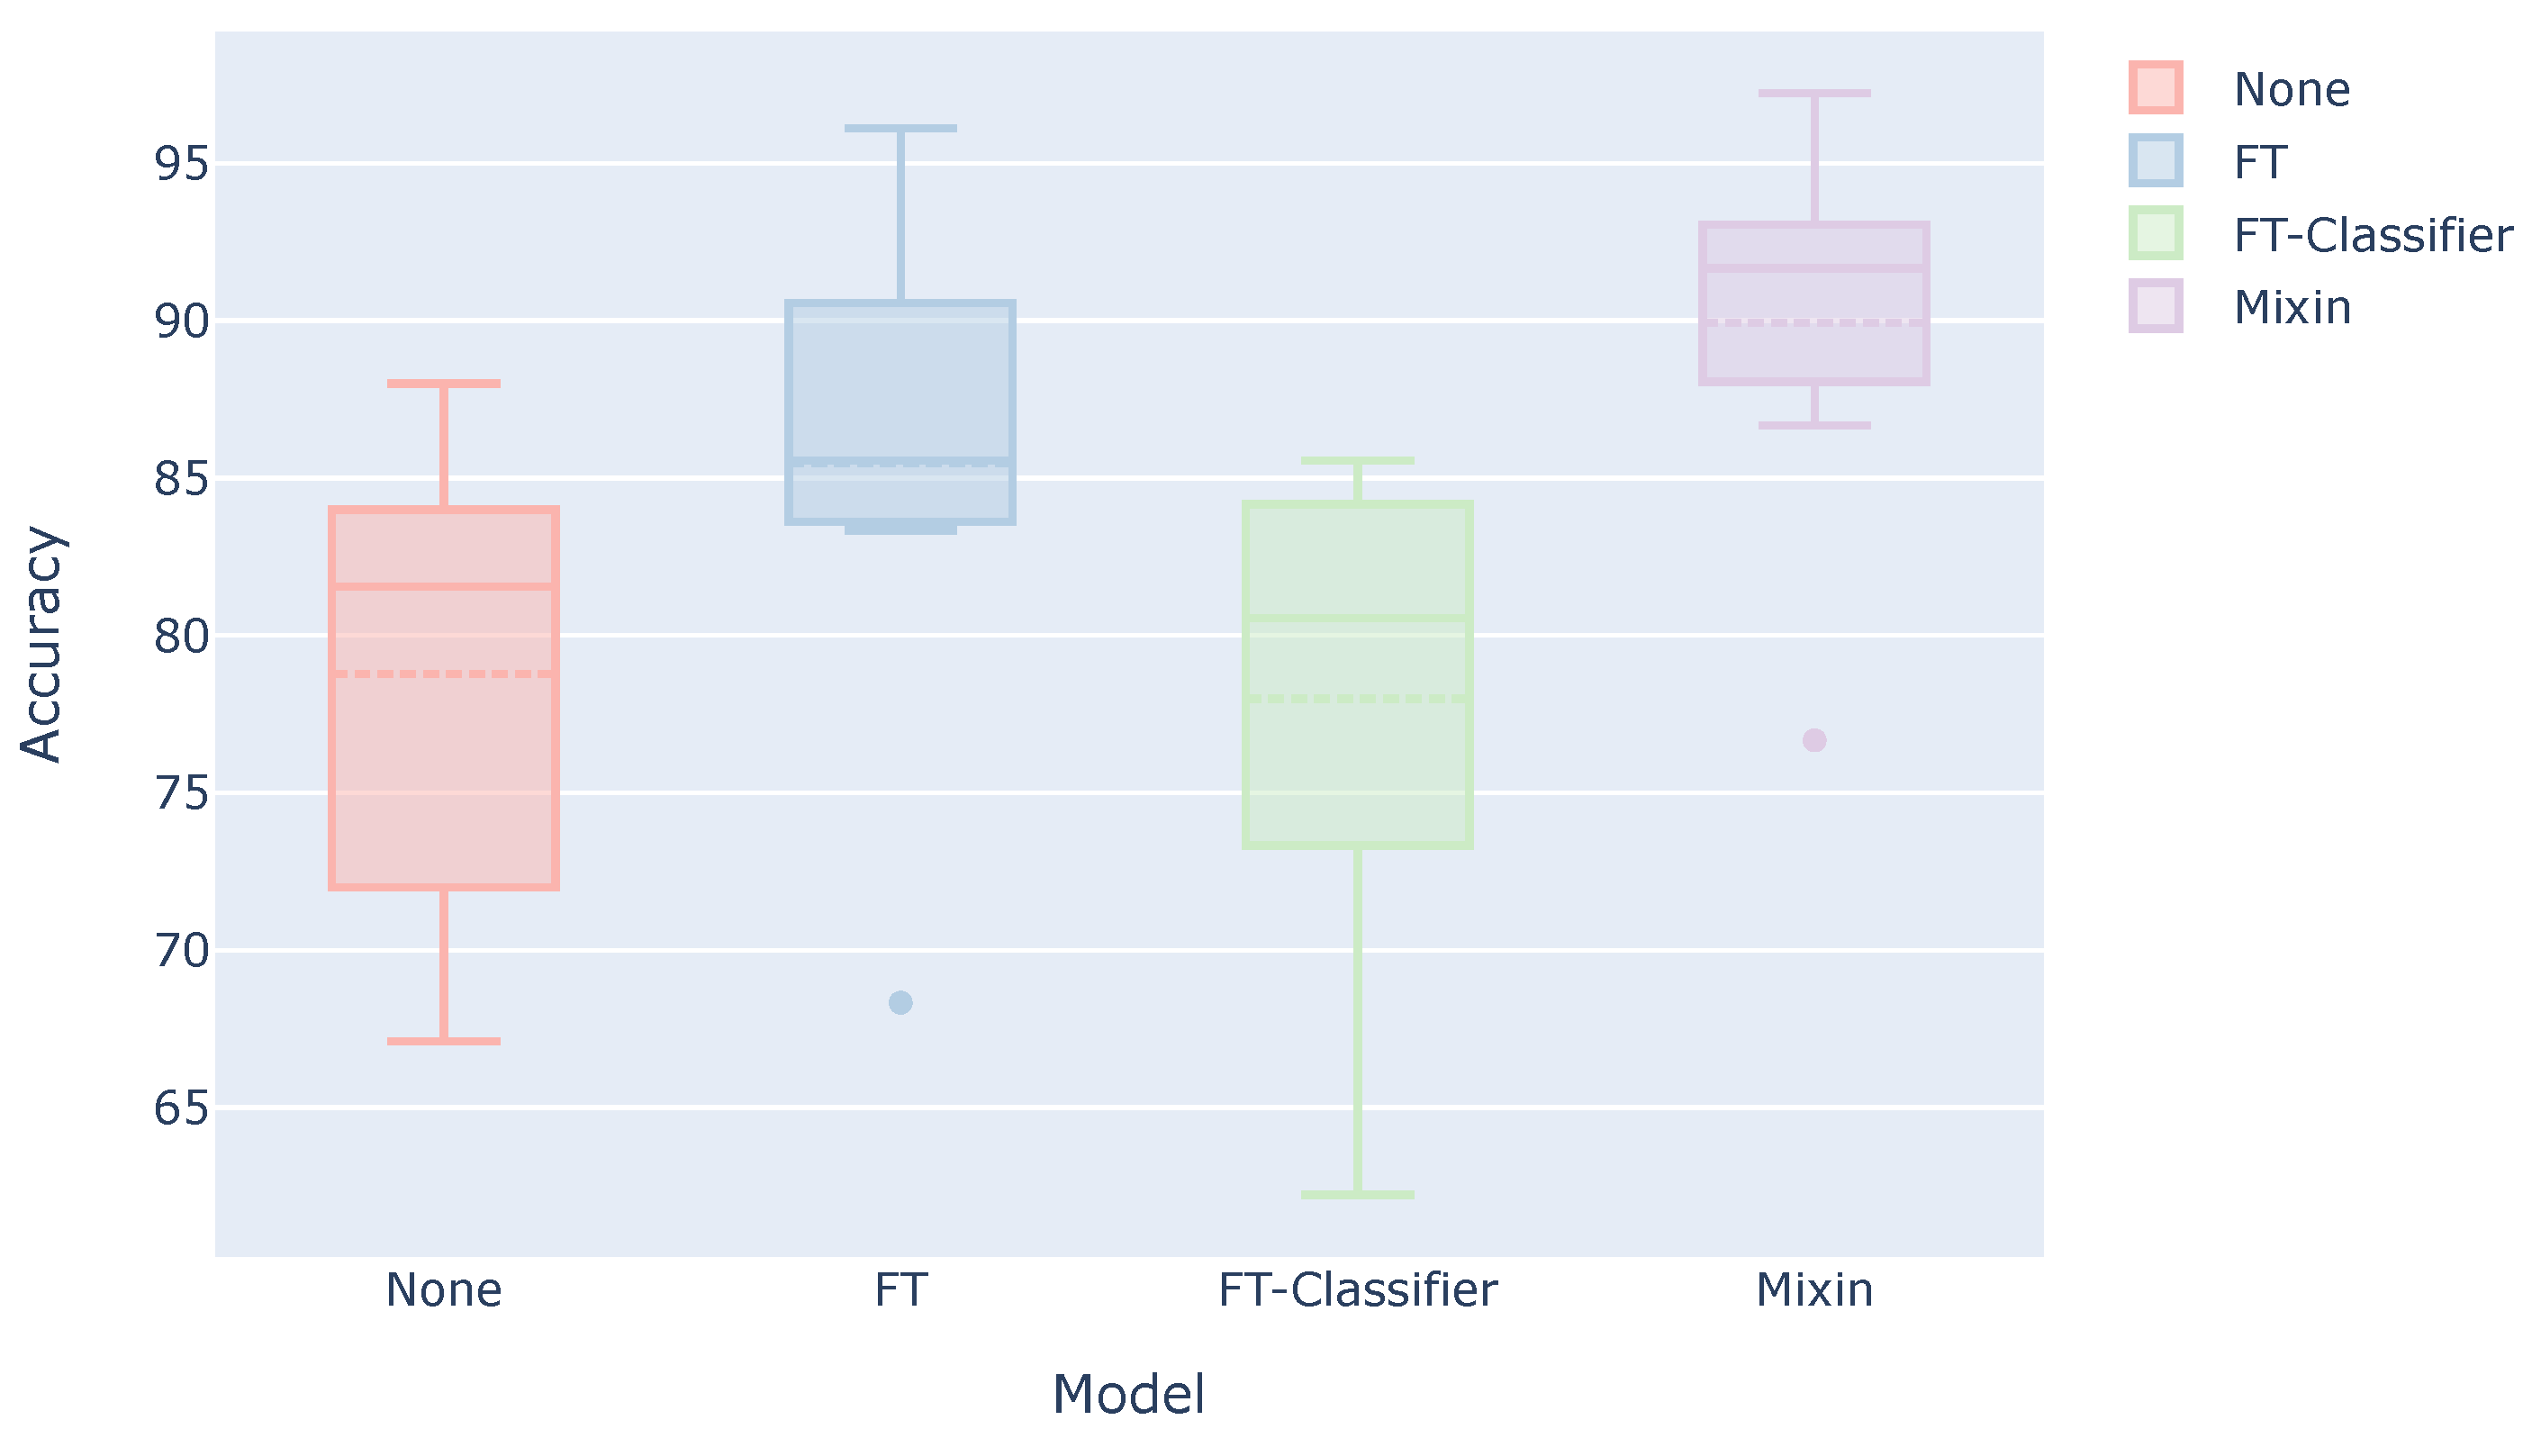
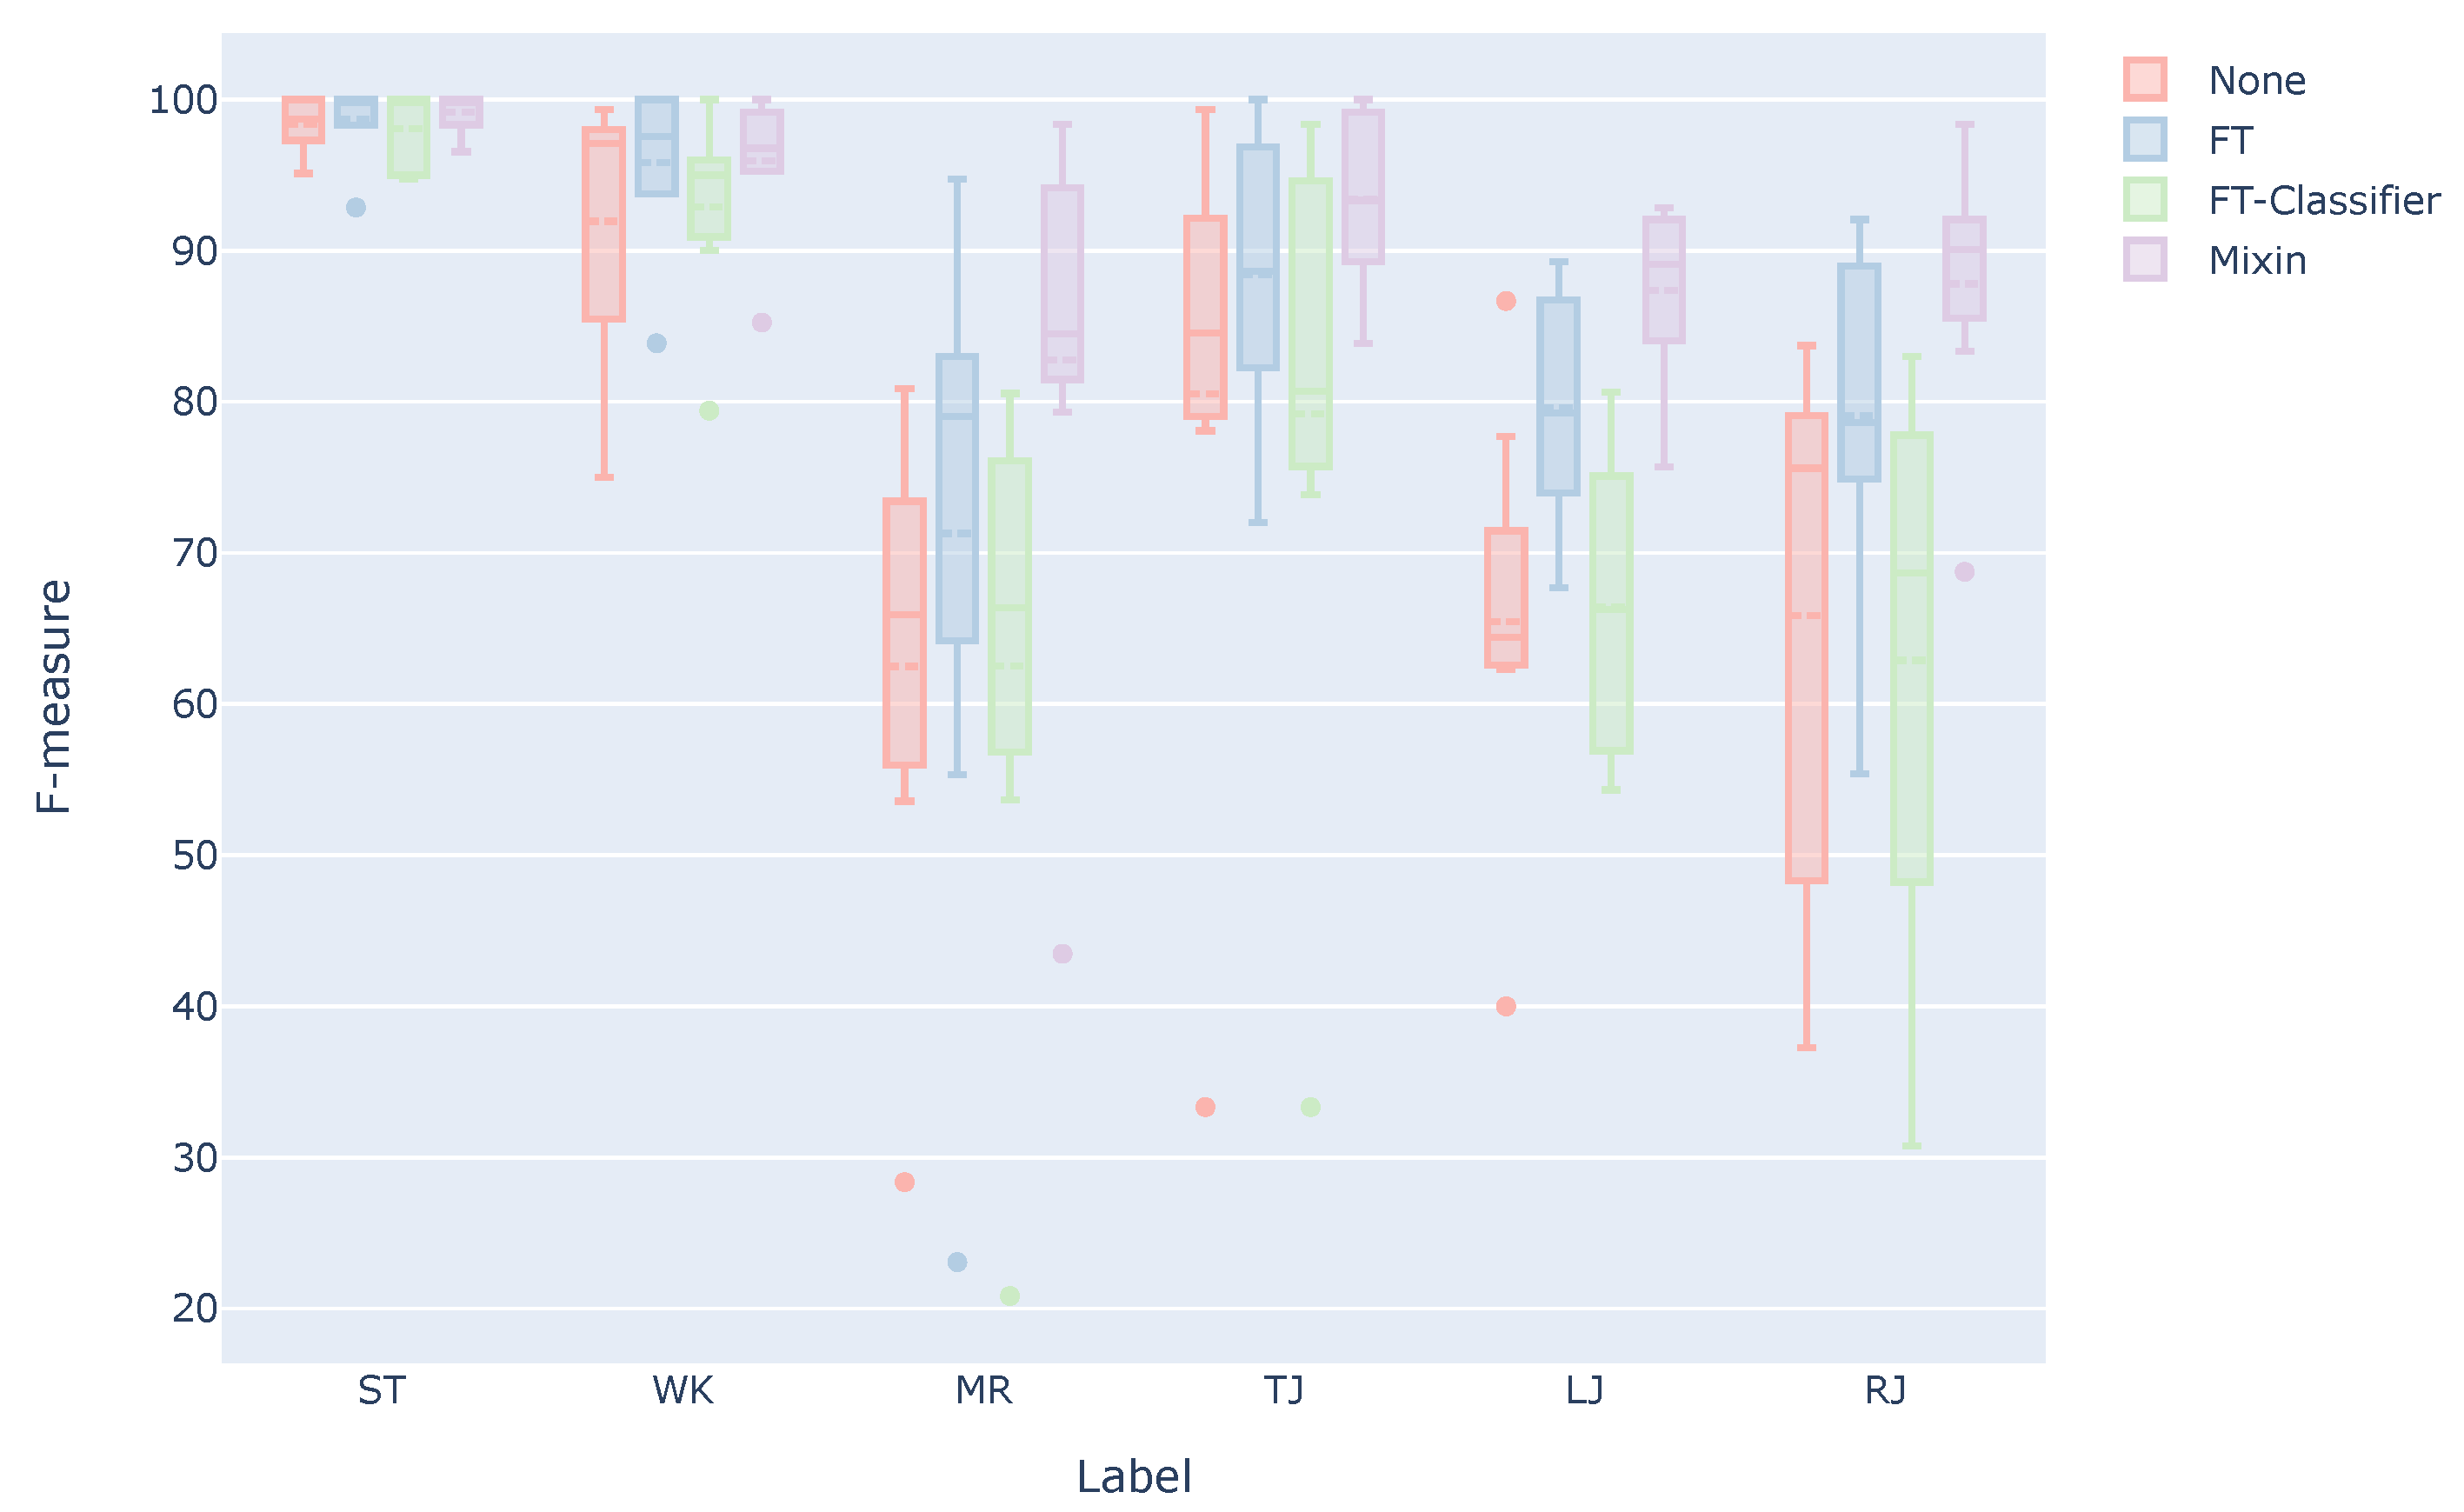
5.4. Verification of the Effectiveness of Our Method in Practical Use
- None: Model trained using only the data of the other subjects (This result is the same as the “Ours” in Table 4).
- FT: Model trained using the data of other subjects and then additionally trained using the user’s three sets.
- FT-Classifier: Model trained using the data of other subjects and then additionally trained with only the classifier part using the user’s three sets.
- Mixin: Model trained using the combined data of other subjects and the user’s three sets.
6. Experiments for Evaluating On-Device Performance
6.1. How to Verify the Performance on a Smartwatch
6.2. Results
7. Conclusions
Author Contributions
Funding
Institutional Review Board Statement
Informed Consent Statement
Data Availability Statement
Acknowledgments
Conflicts of Interest
References
- RingFit Adventure. Nintendo. Available online: https://www.nintendo.co.jp/ring (accessed on 27 April 2021).
- The Prevention of Lifestyle Diseases. Ministry of Health, Labour and Welfare. Available online: https://www.mhlw.go.jp/stf/seisakunitsuite/bunya/kenkou_iryou/kenkou/seikatsu/seikatusyuukan.html (accessed on 27 April 2021).
- Trampobics. Sasakwa Sports Foundation. Available online: https://www.ssf.or.jp/ssf_eyes/dictionary/trampobics.html (accessed on 27 April 2021).
- Miura, K.; Suzuki, T.; Matsumoto, M.; Takuno, E. Aerobic jumping by mini-trampolin in female. Jpn. J. Phys. Fit. 1986, 35, 561. (In Japanese) [Google Scholar]
- Yamaji, K.; Onodera, K.; Kitamura, K. Dropout rate and program implementation rate during the implementation of exercise programs to improve physical fitness. J. Heal. Phys. Educ. Recreat. 1988, 38, 607–612. (In Japanese) [Google Scholar]
- HOP AMP. IVRC History Archive. Available online: http://ivrc.net/archive/hop-amp-2007 (accessed on 27 April 2021).
- Space Hoppers. Coconoe Inc. Available online: https://9ye.jp/works/spacehoppers (accessed on 27 April 2021).
- Fukuchi, K.; Sukedai, Y.; Ohno, Y.; Miwa, S.; Ooba, H. An Entertainment System Using Trampoline with Self-portrait Photo System that Motivates Competitive Creation. IPSJ J. 2017, 58, 1003–1013. (In Japanese) [Google Scholar]
- Mori, H.; Shiratori, K.; Fujieda, T.; Hoshino, J. Versatile training field: The wellness entertainment system using trampoline interface. In Proceedings of ACM SIGGRAPH 2009 Emerging Technologies; ACM: New York, NY, USA, 2009. [Google Scholar] [CrossRef]
- Mukai, K.; Nakatsuru, Y.; Hoshino, J. Movements Detection of Trampoline Interface for Support of Health Exercise. IPSJ Interact. 2012, 193–198. Available online: www.interaction-ipsj.org/archives/paper2012/data/Interaction2012/interactive/data/pdf/1EXB-09.pdf (accessed on 27 April 2021). (In Japanese).
- Kwapisz, J.; Weiss, G.; Moore, S. Activity recognition using cell phone accelerometers. ACM SIGKDD Explor. Newsl. 2010, 12, 78–82. [Google Scholar] [CrossRef]
- Yang, J. Toward physical activity diary: Motion recognition using simple acceleration features with mobile phones. In Proceedings of the 1st International Workshop on Interactive Multimedia for Consumer Electronics, Beijing, China, 23 October 2009; ACM: New York, NY, USA, 2009; pp. 1–10. [Google Scholar] [CrossRef]
- Gjoreski, H.; Bizjak, J.; Gjoreski, M.; Gams, M. Comparing Deep and Classical Machine Learning Methods for Human Activity Recogniton using Wrist Acceleromter. In Proceedings of the 25th International Joint Conference on Artificial Intelligence, New York, NY, USA, 9–15 July 2016; pp. 1–7. [Google Scholar]
- Li, F.; Shirahama, K.; Nisar, M.A.; Köping, L. Comparison of Feature Learning Methods for Human Activity Recognition Using Wearable Sensors. Sensors 2019, 18, 679. [Google Scholar] [CrossRef] [PubMed] [Green Version]
- Hasegawa, T.; Koshino, M. Representation learning by convolutional neural network in activity recognition on smartphone sensing. In Proceedings of the 2nd International Conference on Computational Intelligence and Intelligent Systems, Bangkok, Thailand, 23–25 November 2019; ACM: New York, NY, USA, 2019; pp. 99–104. [Google Scholar] [CrossRef] [Green Version]
- Roggen, D.; Calatroni, A.; Rossi, M.; Holleczek, T.; Förster, K.; Tröster, G.; Lukowicz, P.; Bannach, D.; Pirkl, G.; Ferscha, A.; et al. Collecting complex activity datasets in highly rich networked sensor environments. In Proceedings of the 7th International Conference on Networked Sensing System, Kassel, Germany, 15–18 June 2010; pp. 233–240. [Google Scholar] [CrossRef] [Green Version]
- Lukowicz, P.; Pirkl, G.; Bannach, D.; Wagner, F.; Calatroni, A.; Foerster, K.; Holleczek, T.; Rossi, M.; Roggen, D.; Tröester, G.; et al. Recording a Complex, Multi Modal Activity Data Set for Context Recognition. In Proceedings of the 23rd International Conference on Architecture of Computing Systems, Hannover, Germany, 22–25 February 2010; pp. 1–6. [Google Scholar]
- Kawaguchi, N.; Ogawa, N.; Iwasaki, Y.; Kaji, K.; Terada, T.; Nurao, K.; Inoue, S.; Kawahara, Y.; Sumi, Y.; Nishio, N. HASC Challenge: Gathering large scale human activity corpus for the real-world activity understandings. In Proceedings of the 2nd Augmented Human International Conference, Tokyo, Japan, 13 March 2011; ACM: New York, NY, USA, 2011; pp. 1–5. [Google Scholar] [CrossRef]
- Howard, A.G.; Zhu, M.; Chen, B.; Kalenichenko, D.; Wang, W.; Weyand, T.; Andreetto, M.; Adam, H. MobileNets: Efficient Convolutional Neural Networks for Mobile Vision Applications. arXiv 2017, arXiv:1704.04861. [Google Scholar]
- Tan, M.; Le, Q. EfficientNet: Rethinking Model Scaling for Convolutional Neural Networks. In Proceedings of the 36th International Conference on Machine Learning, Long Beach, CA, USA, 10–15 June 2019; pp. 6105–6114. [Google Scholar]
- Xu, M.; Liu, J.; Liu, Y.; Lin, F.X.; Liu, Y.; Liu, X. A First Look at Deep Learning Apps on Smartphones. In Proceedings of the World Wide Web Conference, San Francisco, CA, USA, 13–17 May 2019; pp. 2125–2136. [Google Scholar]
- TensorFlow Lite. Google. Available online: https://www.tensorflow.org/lite (accessed on 27 April 2021).
- PyTorch Mobile. Facebook. Available online: https://pytorch.org/mobile (accessed on 27 April 2021).
- Core ML Overview. Apple Inc. Available online: https://developer.apple.com/machine-learning/core-ml (accessed on 27 April 2021).
- Tang, Y.; Teng, Q.; Zhang, L.; Min, F.; He, J. Layer-Wise Training Convolutional Neural Networks With Smaller Filters for Human Activity Recognition Using Wearable Sensors. IEEE Sensors J. 2021, 21, 581–592. [Google Scholar] [CrossRef]
- Xu, C.; Chai, D.; He, J.; Zhang, X.; Duan, S. InnoHAR: A Deep Neural Network for Complex Human Activity Recognition. IEEE Access 2019, 7, 9893–9902. [Google Scholar] [CrossRef]
- Szegedy, C.; Liu, W.; Jia, Y.; Sermanet, P.; Reed, S.; Anguelov, D.; Erhan, D.; Vanhoucke, V.; Rabinovich, A. Going Deeper with Convolutions. In Proceedings of the 2015 IEEE Conference on Computer Vision and Pattern Recognition, Boston, MA, USA, 7–12 June 2015; pp. 1–9. [Google Scholar] [CrossRef] [Green Version]
- Agarwal, P.; Alam, M. A Lightweight Deep Learning Model for Human Activity Recognition on Edge Devices. Procedia Comput. Sci. 2020, 167, 2364–2373. [Google Scholar] [CrossRef]
- Kanchanasamut, W.; Pensrl, P. Effects of weight-bearing exercise on a mini-trampoline on foot mobility, plantar pressure and sensation of diabetic neuropathic feet; a preliminary study. Diabet. Foot Ankle 2017, 8, 1287239. [Google Scholar] [CrossRef] [PubMed]
- Matsumura, F. Trampobics. Jpn. Assoc. Univ. Phys. Educ. Sport. 1991, 18, 76–79. (In Japanese) [Google Scholar]
- Aalizadeh, B.; Mohammadzadeh, H.; Khazani, A.; Dadras, A. Effect of a Trampoline Exercise on the Anthropometric Measures and Motor Performance of Adolescent Students. Int. J. Prev. Med. 2016, 7, 91. [Google Scholar] [CrossRef] [PubMed]
- Takahashi, T.; Ishida, H.; Nashimoto, Y.; Shiobara, S.; Arai, Y. Effects of trampoline exercise on the trunk and lower limb muscle strength in male university students. Res. Educ. Pract. Dev. Gunma Univ. 2019, 36, 101–106. (In Japanese) [Google Scholar]
- Giagazoglou, P.; Kokaridas, D.; Sidiropoulou, M.; Patsiaouras, A.; Karra, C.; Neofotistou, K. Effects of a trampoline exercise intervention on motor performance and balance ability of children with intellectual disabilities. Res. Dev. Disabil. 2013, 34, 2701–2707. [Google Scholar] [CrossRef] [PubMed]
- Aragão, F.A.; Karamanidis, K.; Vaz, M.A.; Arampatzis, A. Mini-trampoline exercise related to mechanisms of dynamic stability improves the ability to regain balance in elderly. J. Elerctromyography Kinesiol. 2011, 21, 512–518. [Google Scholar] [CrossRef] [PubMed]
- Simonyan, K.; Zisserman, A. Very Deep Convolutional Networks for Large-Scale Image Recognition. In Proceedings of the 3rd International Conference on Learning Representations, San Diego, CA, USA, 7–9 May 2015. [Google Scholar]
- Lin, M.; Chen, Q.; Yan, S. Network In Network. In Proceedings of the 2nd International Conference on Learning Representation, Banff, AB, Canada, 14–16 April 2014. [Google Scholar]
- CMMotionManager. Apple Inc. Available online: https://developer.apple.com/documentation/coremotion/cmmotionmanager (accessed on 27 April 2021).
- Breiman, L. Random Forests. Mach. Learn. 2001, 45, 5–32. [Google Scholar] [CrossRef] [Green Version]
- Hasegawa, T.; Koshino, M. Detection of Smartphone Wearing Position in Walking Using Deep Learning. IPSJ J. 2016, 57, 2186–2196. (In Japanese) [Google Scholar]
- Kobayashi, S.; Hasegawa, T. Smartphone-based Estimation of Sidewalk Surface Type via Deep Learning. Sensors Mater. 2021, 33, 35–51. [Google Scholar] [CrossRef]
- Kingma, D.P.; Ba, J.L. Adam: A Method for Stochastic Optimization. In Proceedings of the 3rd International Conference on Learning Representations, San Diego, CA, USA, 7–9 May 2015. [Google Scholar]
- Personalizing a Model with On-Device Updates—Apple Developer Documentation. Apple Inc. Available online: https://developer.apple.com/documentation/coreml/core_ml_api/personalizing_a_model_with_on-device_updates (accessed on 3 May 2021).
- Example on-device model personalization with TensorFlow Lite. TensorFlow Blog. Available online: https://blog.tensorflow.org/2019/12/example-on-device-model-personalization.html (accessed on 3 May 2021).


| Layer Type | Number of Filter | Shape of Output | Output Channels |
|---|---|---|---|
| Conv1D | 16 | 192 | 16 |
| Conv1D | 16 | 192 | 16 |
| MaxPooling1D | 2 | 96 | 16 |
| Conv1D | 32 | 96 | 32 |
| Conv1D | 32 | 96 | 32 |
| MaxPooling1D | 2 | 48 | 32 |
| Conv1D | 64 | 48 | 64 |
| Conv1D | 64 | 48 | 64 |
| Conv1D | 64 | 48 | 64 |
| MaxPooling1D | 2 | 24 | 128 |
| Conv1D | 128 | 24 | 128 |
| Conv1D | 128 | 24 | 128 |
| Conv1D | 128 | 24 | 128 |
| MaxPooling1D | 2 | 12 | 128 |
| Conv1D | 128 | 12 | 128 |
| Conv1D | 128 | 12 | 128 |
| Conv1D | 128 | 12 | 128 |
| MaxPooling1D | 2 | 6 | 128 |
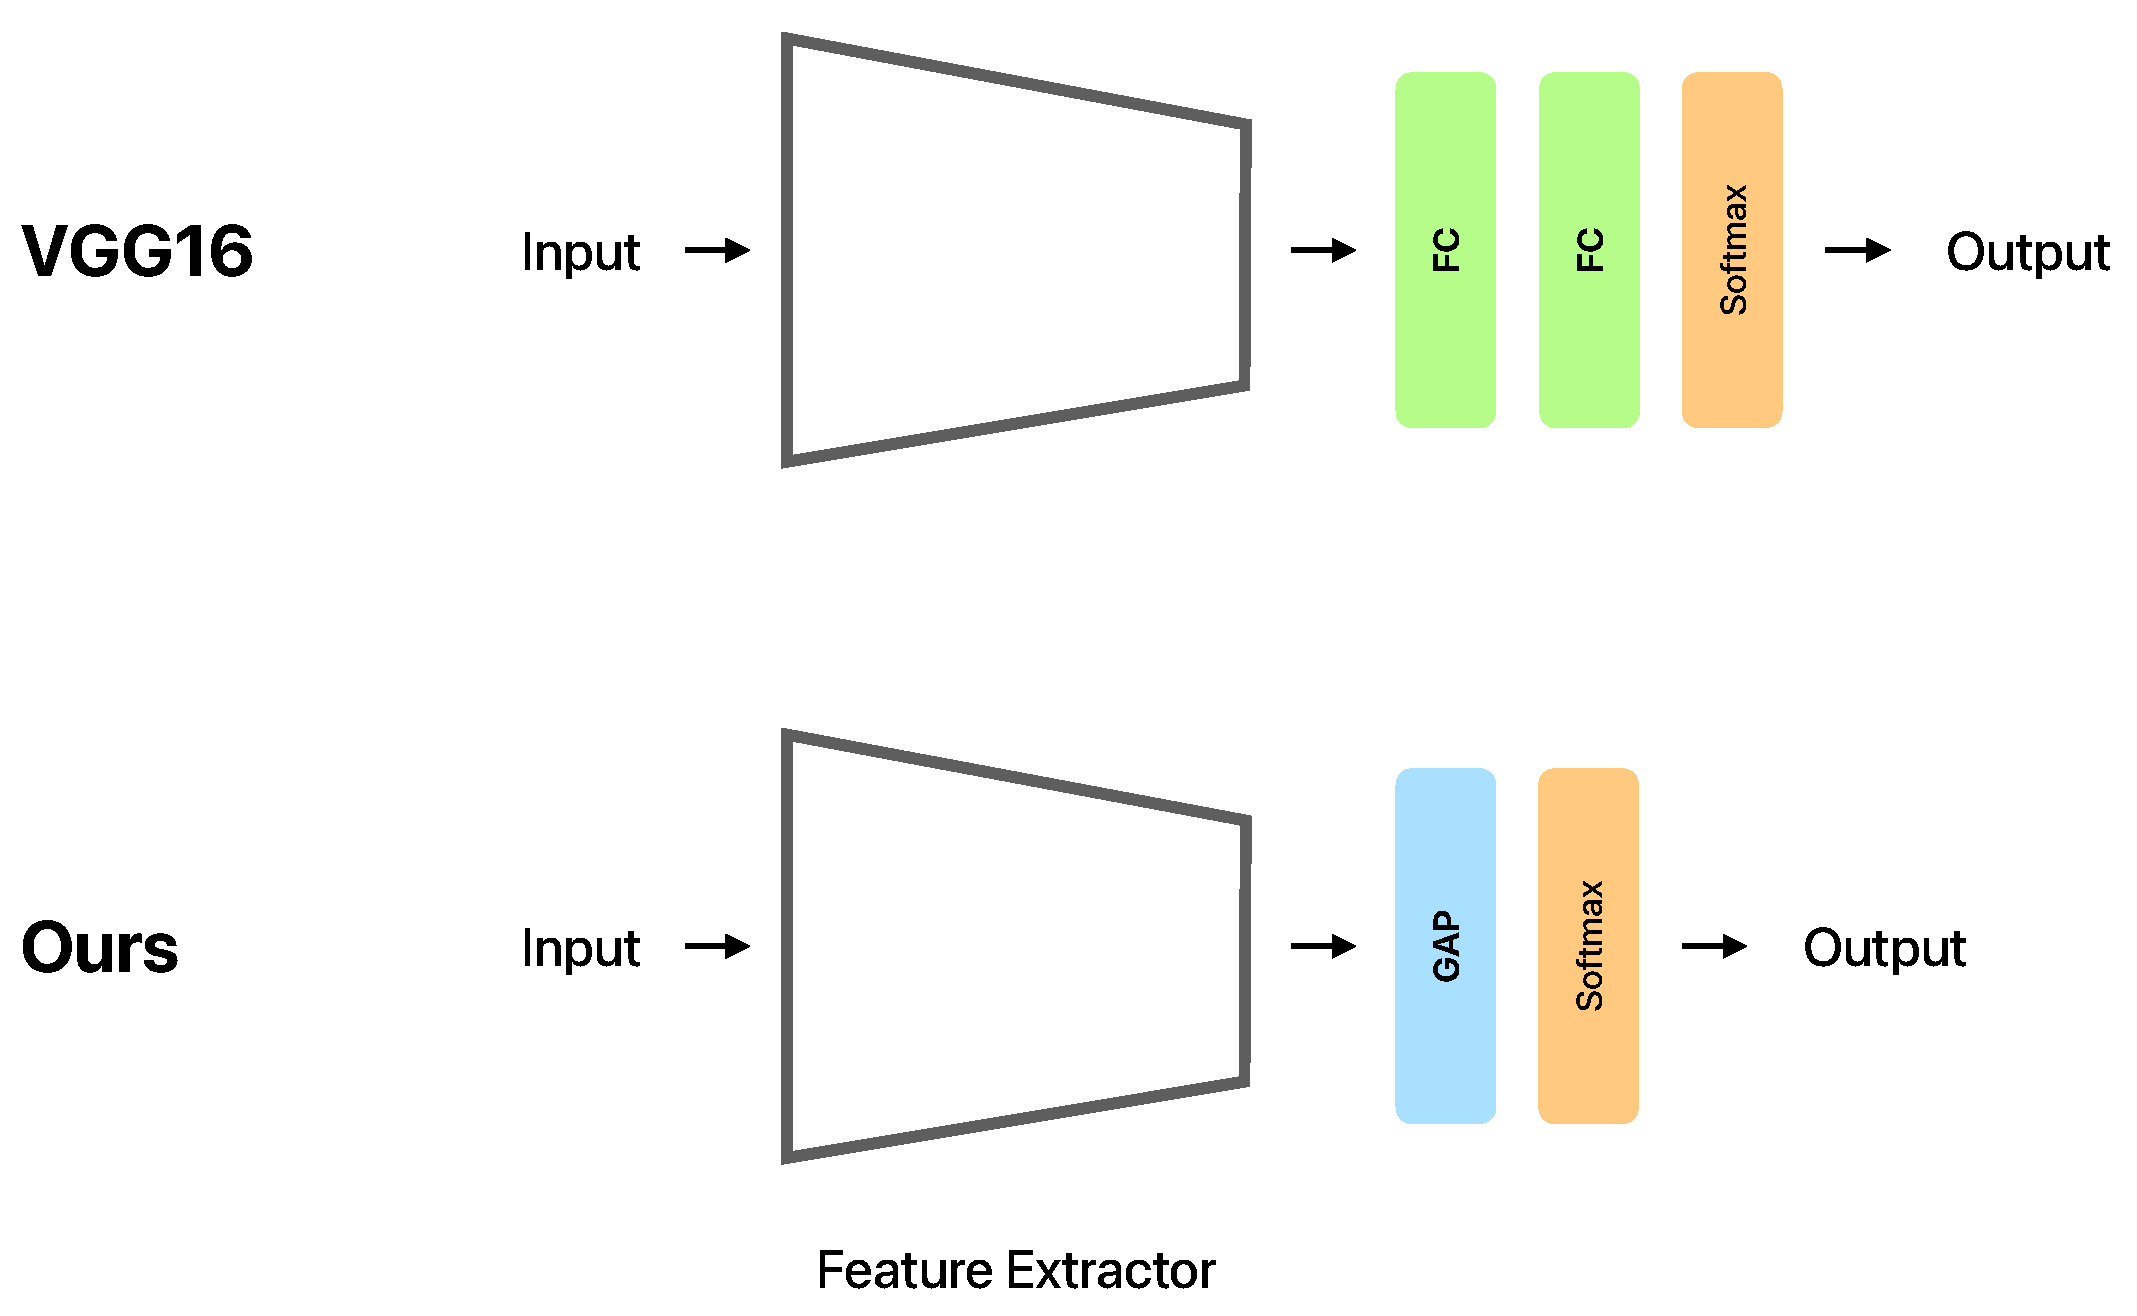
| GAP | - | - | 128 |
| Softmax | - | - | 6 |
| ID | Age | Gender | Dominant | Height [cm] | Weight [kg] |
|---|---|---|---|---|---|
| A | 23 | Male | Right | 163.0 | 52.0 |
| B | 22 | Male | Right | 169.5 | 55.0 |
| C | 23 | Male | Right | 161.0 | 54.0 |
| D | 24 | Male | Right | 173.0 | 55.0 |
| E | 22 | Male | Right | 165.0 | 75.0 |
| F | 23 | Male | Right | 170.5 | 60.0 |
| G | 22 | Male | Right | 170.0 | 76.5 |
| H | 23 | Male | Right | 170.0 | 55.0 |
| Domain | Feature Name |
|---|---|
| Time | Mean |
| Mean of absolute values | |
| Standard deviation | |
| Standard deviation of absolute values | |
| Minimum | |
| Maximum | |
| Root mean square | |
| 1st quartile | |
| Median | |
| 3rd quartile | |
| Interquartile range | |
| Correlation coefficient between axes | |
| Correlation coefficient of absolute values between axes | |
| Initial value in the frame | |
| Final value in the frame | |
| Intensity | |
| Skewness | |
| Kurtosis | |
| Zero-crossing rate | |
| Frequency | Maximum |
| Frequency of maximum | |
| 2nd maximum | |
| Frequency of 2nd maximum | |
| Standard deviation | |
| 1st quartile | |
| Median | |
| 3rd quartile | |
| Interquartile range | |
| Correlation coefficient between axes |
| Subject | RF | Simple CNN [14] | VGG16 [15] | Ours |
|---|---|---|---|---|
| A | 74.4 | 73.3 | 76.2 | 82.9 |
| B | 77.3 | 80.9 | 71.1 | 80.7 |
| C | 57.6 | 66.7 | 59.3 | 67.1 |
| D | 86.7 | 72.4 | 68.0 | 76.0 |
| E | 75.6 | 82.0 | 75.6 | 85.1 |
| F | 58.0 | 63.6 | 63.3 | 68.0 |
| G | 63.3 | 82.2 | 82.4 | 88.0 |
| H | 82.4 | 76.7 | 86.4 | 82.4 |
| Avg. | 71.9 | 74.7 | 72.8 | 78.8 |
| Pre.\Cor. | ST | WK | MR | TJ | LJ | RJ | Precision [%] |
|---|---|---|---|---|---|---|---|
| ST | 591 | 4 | 1 | 4 | 0 | 0 | 98.5 |
| WL | 7 | 551 | 39 | 3 | 0 | 91.7 | |
| MR | 1 | 42 | 360 | 71 | 121 | 120 | 50.3 |
| TJ | 1 | 0 | 32 | 456 | 50 | 55 | 76.8 |
| LJ | 0 | 2 | 101 | 39 | 328 | 121 | 55.5 |
| RJ | 0 | 1 | 67 | 27 | 101 | 303 | 60.7 |
| Recall [%] | 98.5 | 91.8 | 60.0 | 76.0 | 54.7 | 50.5 | 71.9 |
| F-measure [%] | 98.5 | 91.8 | 54.8 | 76.4 | 55.1 | 55.1 |
| Pre.\Cor. | ST | WL | MR | TJ | LJ | RJ | Precision [%] |
|---|---|---|---|---|---|---|---|
| ST | 581 | 3 | 0 | 3 | 0 | 0 | 99.0 |
| WL | 8 | 578 | 65 | 3 | 2 | 5 | 87.4 |
| MR | 1 | 16 | 379 | 13 | 95 | 83 | 64.6 |
| TJ | 4 | 1 | 9 | 479 | 32 | 30 | 86.5 |
| LJ | 0 | 2 | 88 | 64 | 422 | 91 | 63.3 |
| RJ | 0 | 0 | 59 | 38 | 50 | 391 | 72.7 |
| Recall [%] | 97.8 | 96.3 | 63.2 | 79.8 | 70.3 | 65.2 | 78.8 |
| F-measure [%] | 98.4 | 91.7 | 63.9 | 83.0 | 66.6 | 68.7 |
| Model | Size [MB] | Time [ms/window] | Battery [%/h] |
|---|---|---|---|
| Simple CNN | 4.0 | 8.1 | 7 |
| VGG16 | 8.6 | 17.8 | 5 |
| Ours | 1.3 | 12.5 | 5 |
Publisher’s Note: MDPI stays neutral with regard to jurisdictional claims in published maps and institutional affiliations. |
© 2021 by the authors. Licensee MDPI, Basel, Switzerland. This article is an open access article distributed under the terms and conditions of the Creative Commons Attribution (CC BY) license (https://creativecommons.org/licenses/by/4.0/).
Share and Cite
Kobayashi, S.; Hasegawa, T. Detection of Motion on a Trampoline with a Smartwatch. Sensors 2021, 21, 8413. https://doi.org/10.3390/s21248413
Kobayashi S, Hasegawa T. Detection of Motion on a Trampoline with a Smartwatch. Sensors. 2021; 21(24):8413. https://doi.org/10.3390/s21248413
Chicago/Turabian StyleKobayashi, Satoshi, and Tatsuhito Hasegawa. 2021. "Detection of Motion on a Trampoline with a Smartwatch" Sensors 21, no. 24: 8413. https://doi.org/10.3390/s21248413
APA StyleKobayashi, S., & Hasegawa, T. (2021). Detection of Motion on a Trampoline with a Smartwatch. Sensors, 21(24), 8413. https://doi.org/10.3390/s21248413