
Overview of Explainable Artificial Intelligence for Prognostic and Health Management of Industrial Assets Based on Preferred Reporting Items for Systematic Reviews and Meta-Analyses


Abstract
:1. Introduction
1.1. General Progress in Artificial Intelligence
1.2. Artificial Intelligence in Prognostic and Health Management
1.3. Black-Box Artificial Intelligence Problem
1.4. The Need for Explainable Artificial Intelligence
- (i)
- Justification of the model’s decision by identifying issues and enhancing AI models.
- (ii)
- Obedience of the AI regulation and guidelines in usage, bias, ethics, dependability, accountability, safety, and security.
- (iii)
- Permission for users to confirm the model’s desirable features, promote engagement, obtain fresh insights into the model or data, and augment human intuition.
- (iv)
- Allowance for users to better optimize and focus their activities, efforts, and resources.
- (v)
- Support for the model development when it is not yet considered as reliable.
- (vi)
- Encouragement for the cooperation between AI experts and external parties.
1.5. Common XAI Approaches
1.6. Review Motivation
- (i)
- (ii)
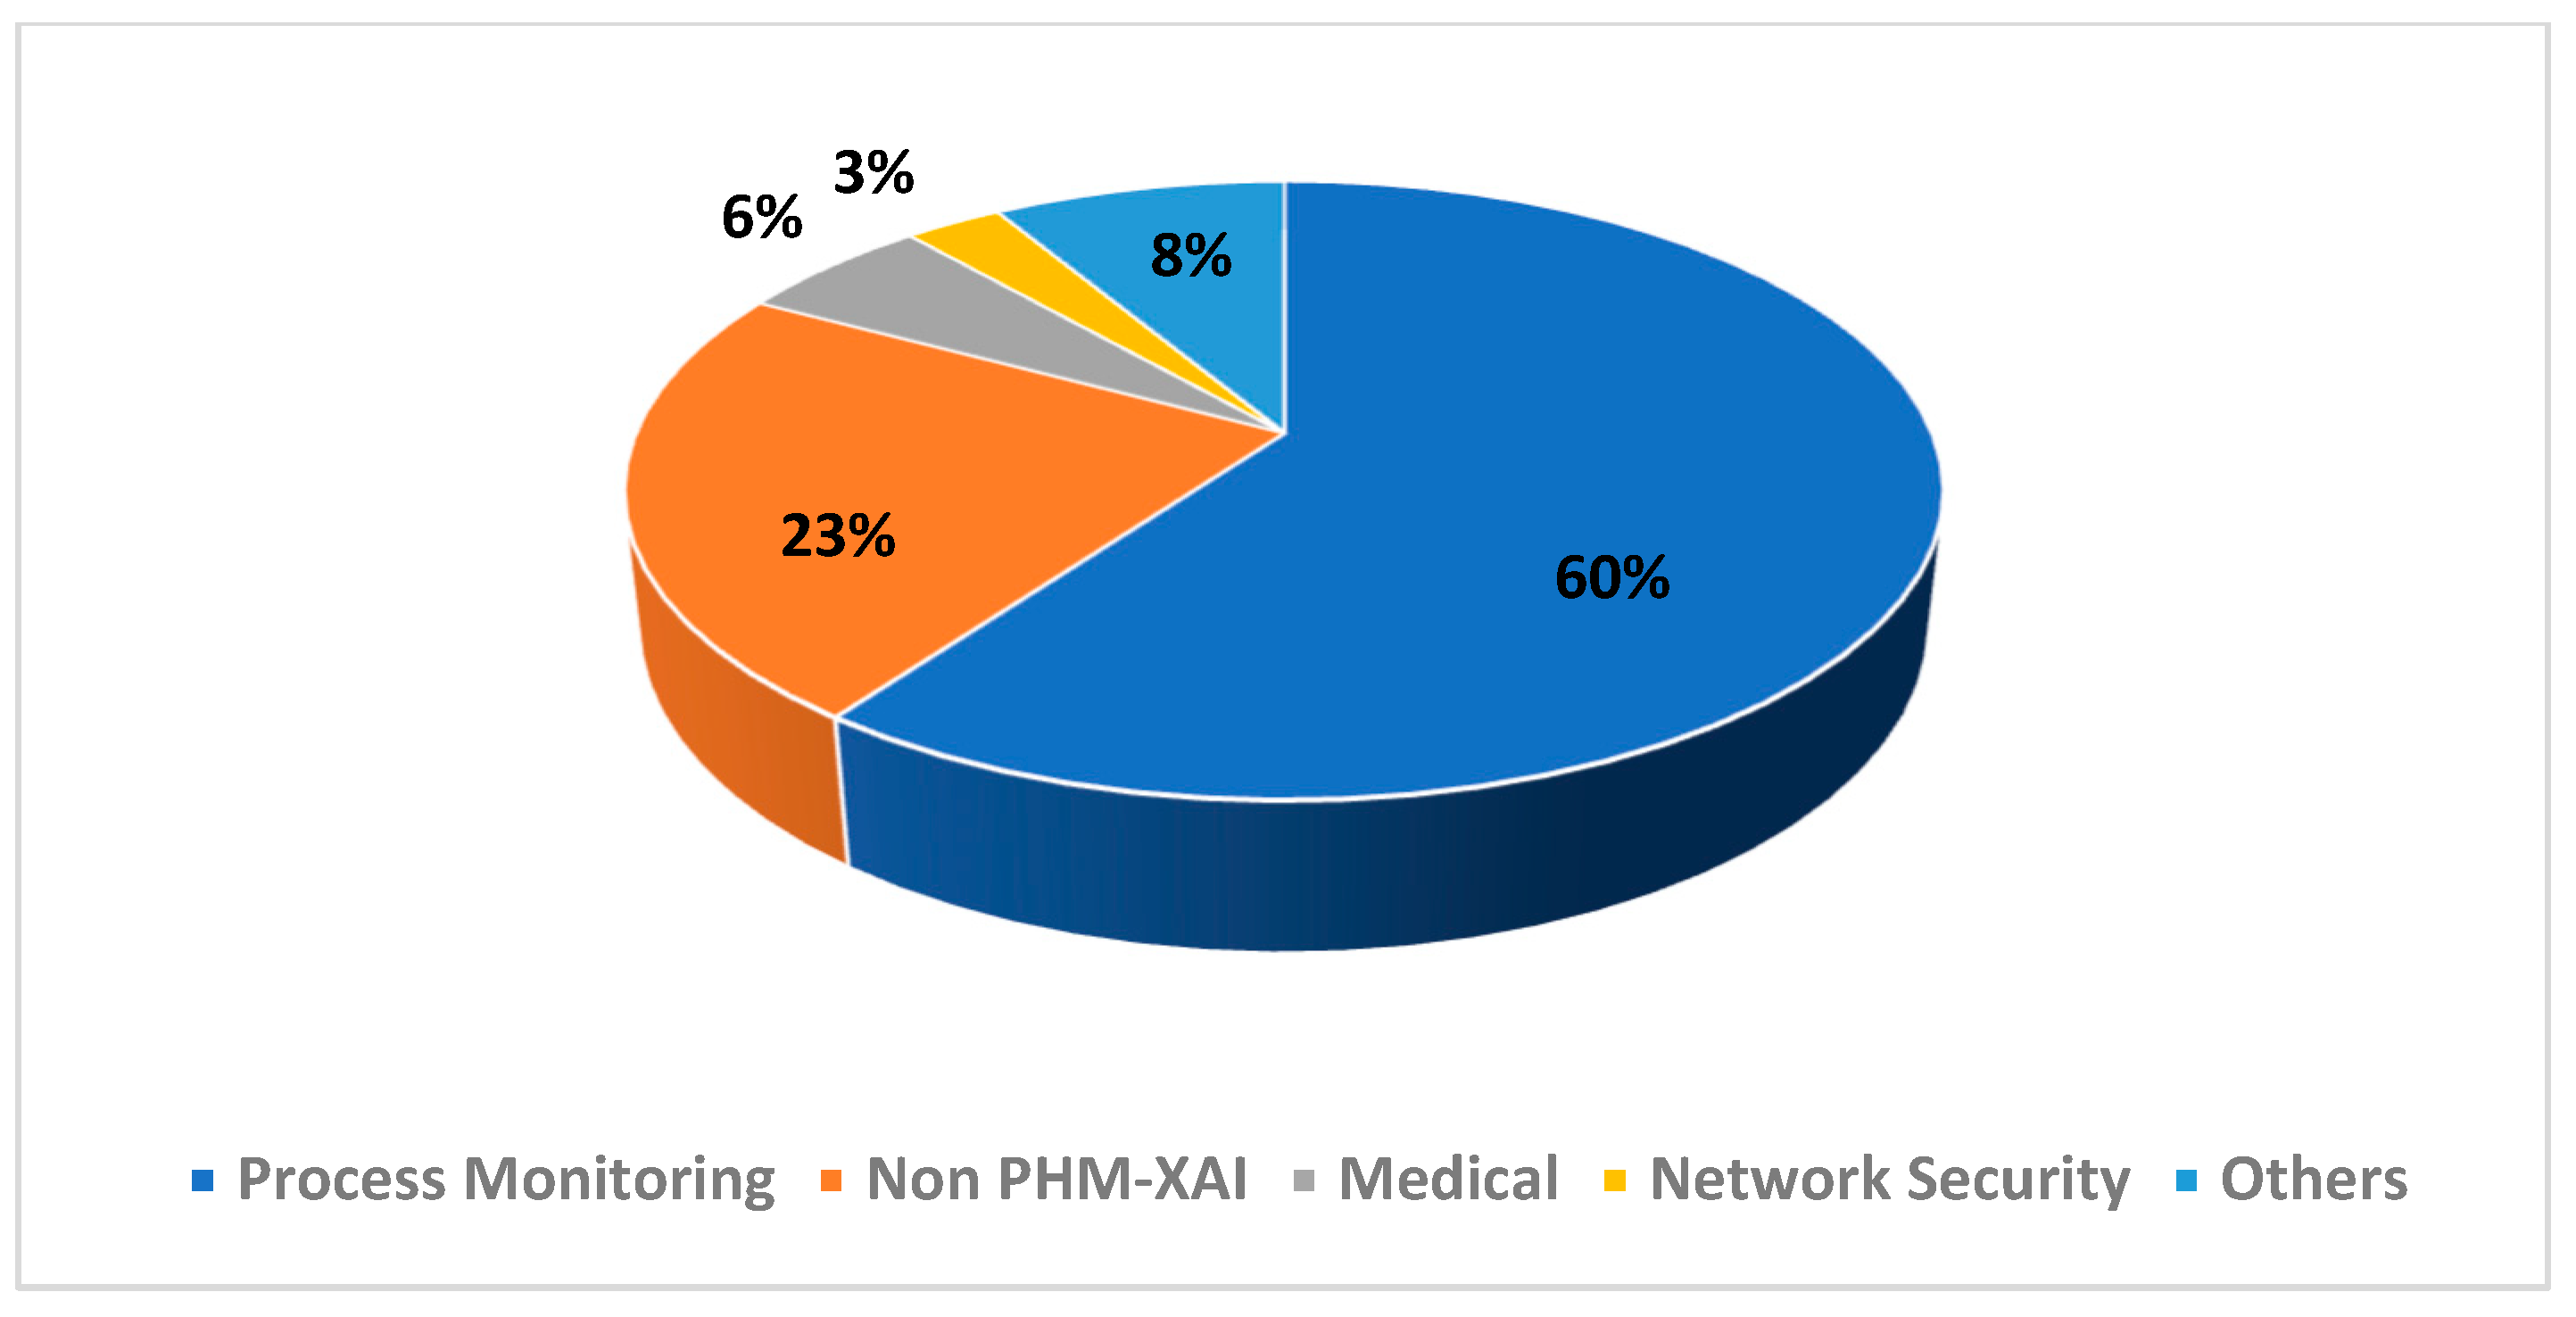
- Specialized reviews: In the early years, several general surveys on XAI methods were written [32,34]. More recently, as the discipline grows, more specialized works emerged. Reviews on XAI have been related to drug discovery [31], fintech management [35], healthcare [30,33,36], neurorobotics [39], pathology [28], plant biology [37], and psychology [29]. Thus, it is necessary to produce an analytical compilation of PHM-XAI works, which is still absent.
- (iii)
- PHM nature and regulation: PHM is naturally related to high-investment and safety-sensitive industrial domains. Moreover, it is pressing to ensure the use of well-regulated AI in PHM. Hence, it is necessary for XAI to be promoted as much as possible and its know-how disseminated for the benefit of PHM actors.
- (i)
- General trend: This is related to an overview of the XAI approach employed, the repartition of the mentioned methods according to PHM activities, and the type of case study involved.
- (ii)
- Accuracy versus explainability power: According to DARPA, the model’s accuracy performance is inverse to its explainability prowess [40].
- (iii)
- XAI role: This must assist or overload PHM tasks.
- (iv)
- Challenges in PHM-XAI progress: Crosschecks were done with the general challenges raised in [14,32,34,38] associated with:
- (a)
- The lack of explanation evaluation metrics.
- (b)
- The absence of human involvement for enhancing the explanation effectivity.
- (c)
- The omission of uncertainty management in the studied literature.
2. Methodology
2.1. Framework
2.2. Databases
2.3. Steps of Our Bibliographical Review
- (S1)
- Verify whether the article type is research or not.
- (S2)
- Exclude non-PHM articles by identifying absence of commonly employed PHM terms such as prognostic, prognosis, RUL, diagnostic, diagnosis, anomaly detection, failure, fault, or degradation.
- (S3)
- Discard non-XAI articles by identifying absence of commonly used XAI terms which are explainable, interpretable, and AI.
- (S4)
- Eliminate non-PHM-XAI articles by identifying the absence of both PHM and XAI terms as, respectively, indicated in steps (ii) and (iii) above.
- (S5)
- Remove articles related to medical applications or network security.
- (i)
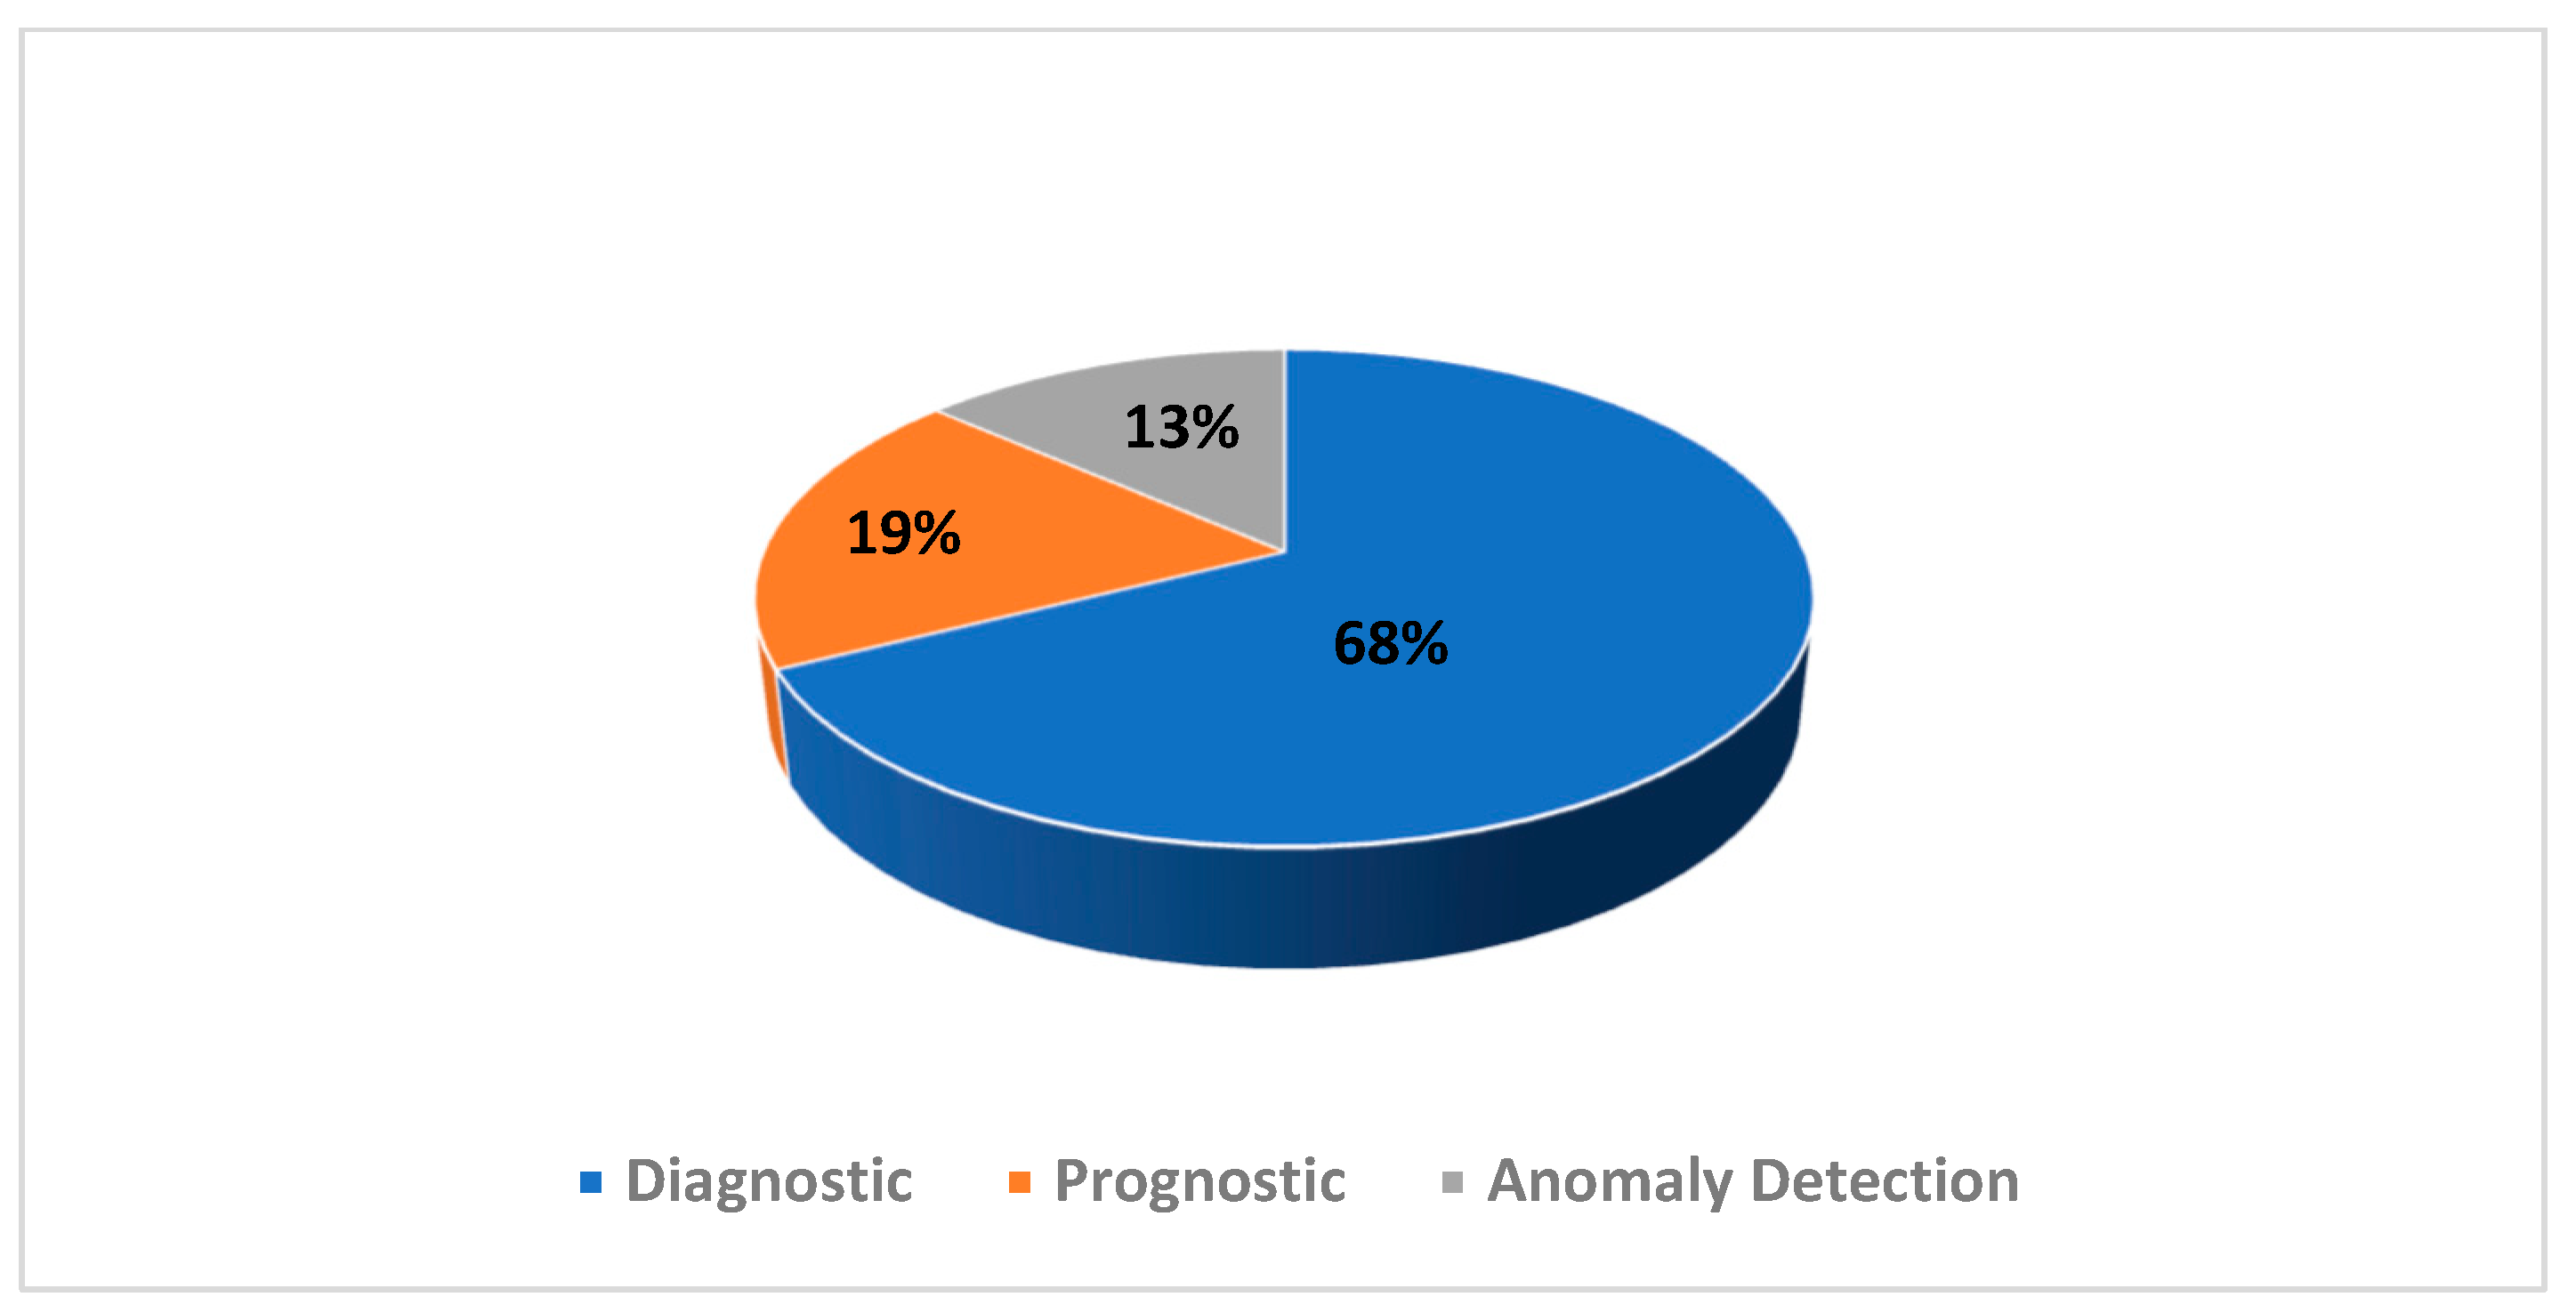
- PHM activity category: This corresponds to either anomaly detection, prognostic, or diagnostic, with structural damage detection as well as binary failure prediction being considered as diagnostic.
- (ii)
- XAI approach employed: This is related to the category of the XAI method.
- (iii)
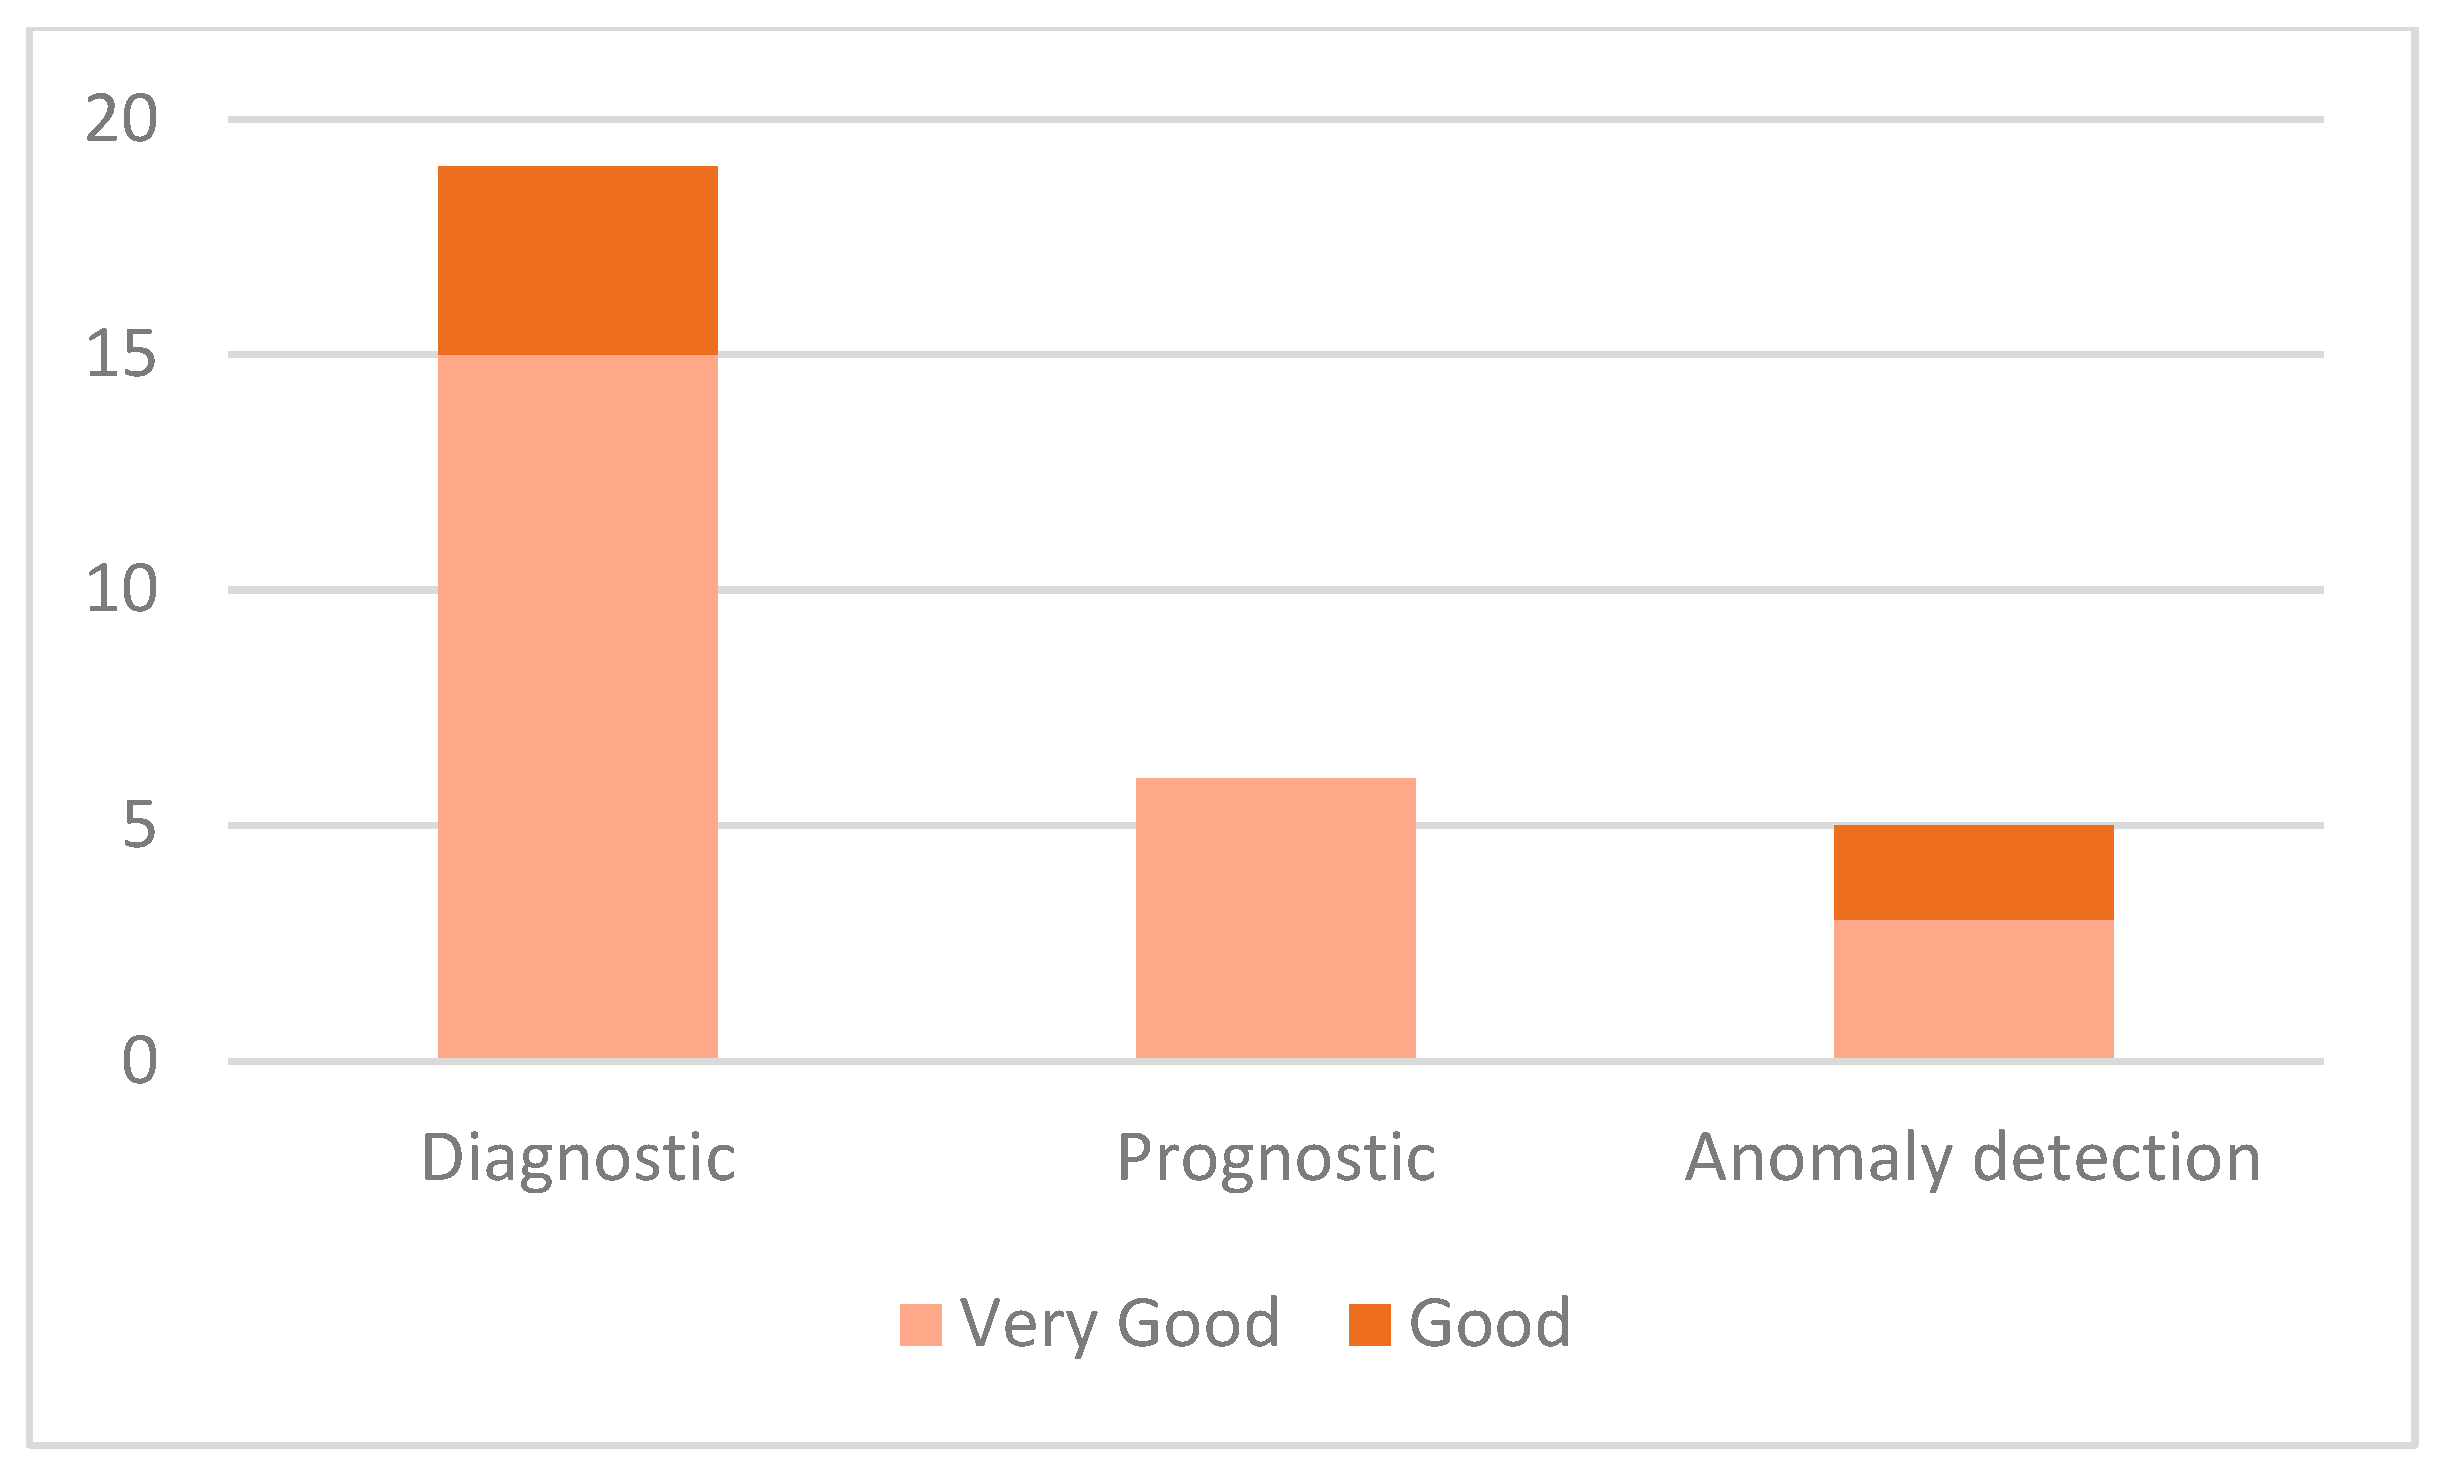
- Recorded performance: This is associated with the reported result. Some papers clearly claim the comparability or the superiority of the proposed method over other tested methods. In the case where comparison was not conducted, the reported standalone results for accuracy, precision, F1 score, area under the receiving operating characteristic curve (AUC) score, area under precision-recall curve (PRAUC) score, or the Cohen kappa statistic score were referred to Table A4 in Appendix A and classified as either “bad”, “fair”, “good”, and “very good”. When mixed performance of good and very good was recorded for the same method, it was quantified as only “good”. When a method was superior to the rest, it was classified as “very good” unless detailed as only “good”. Some results were appreciated based on the problem at hand, for example using the mean square error (MSE), root mean square error (RMSE), and mean absolute error (MAE) as direct comparisons is not possible.
- (iv)
- XAI role in assisting PHM task: This regards the role of XAI in strengthening PHM ability.
- (v)
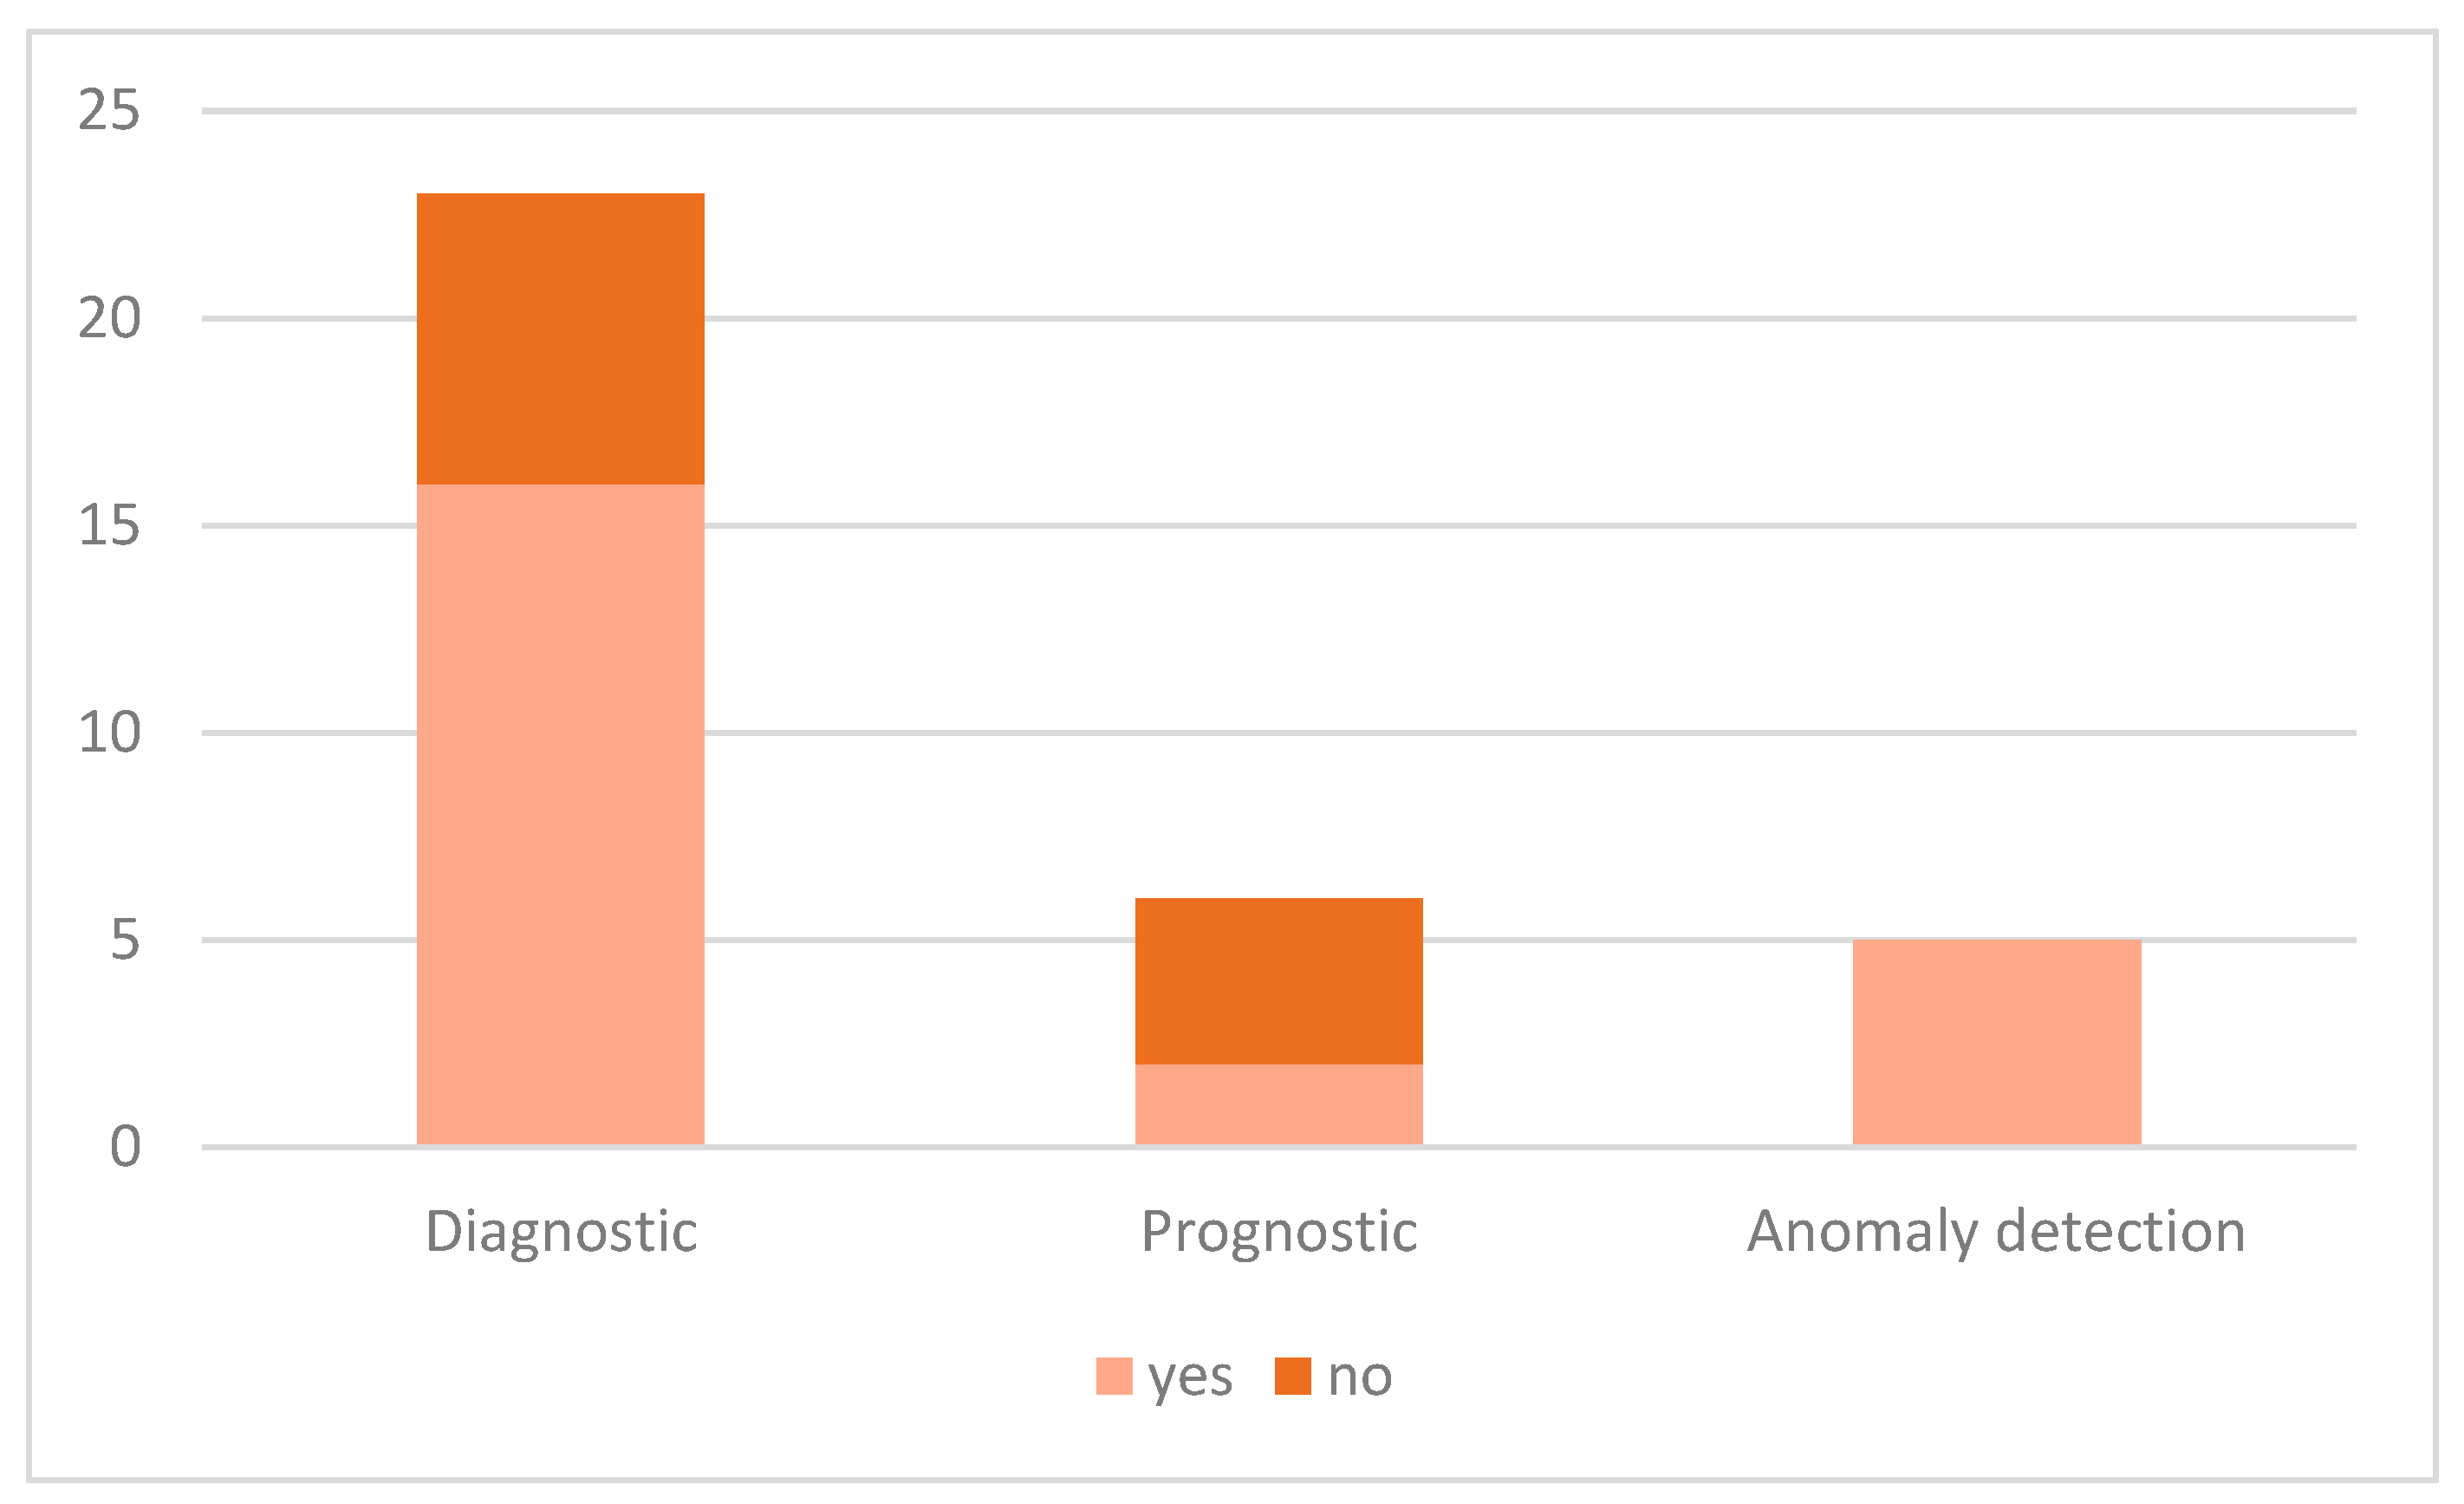
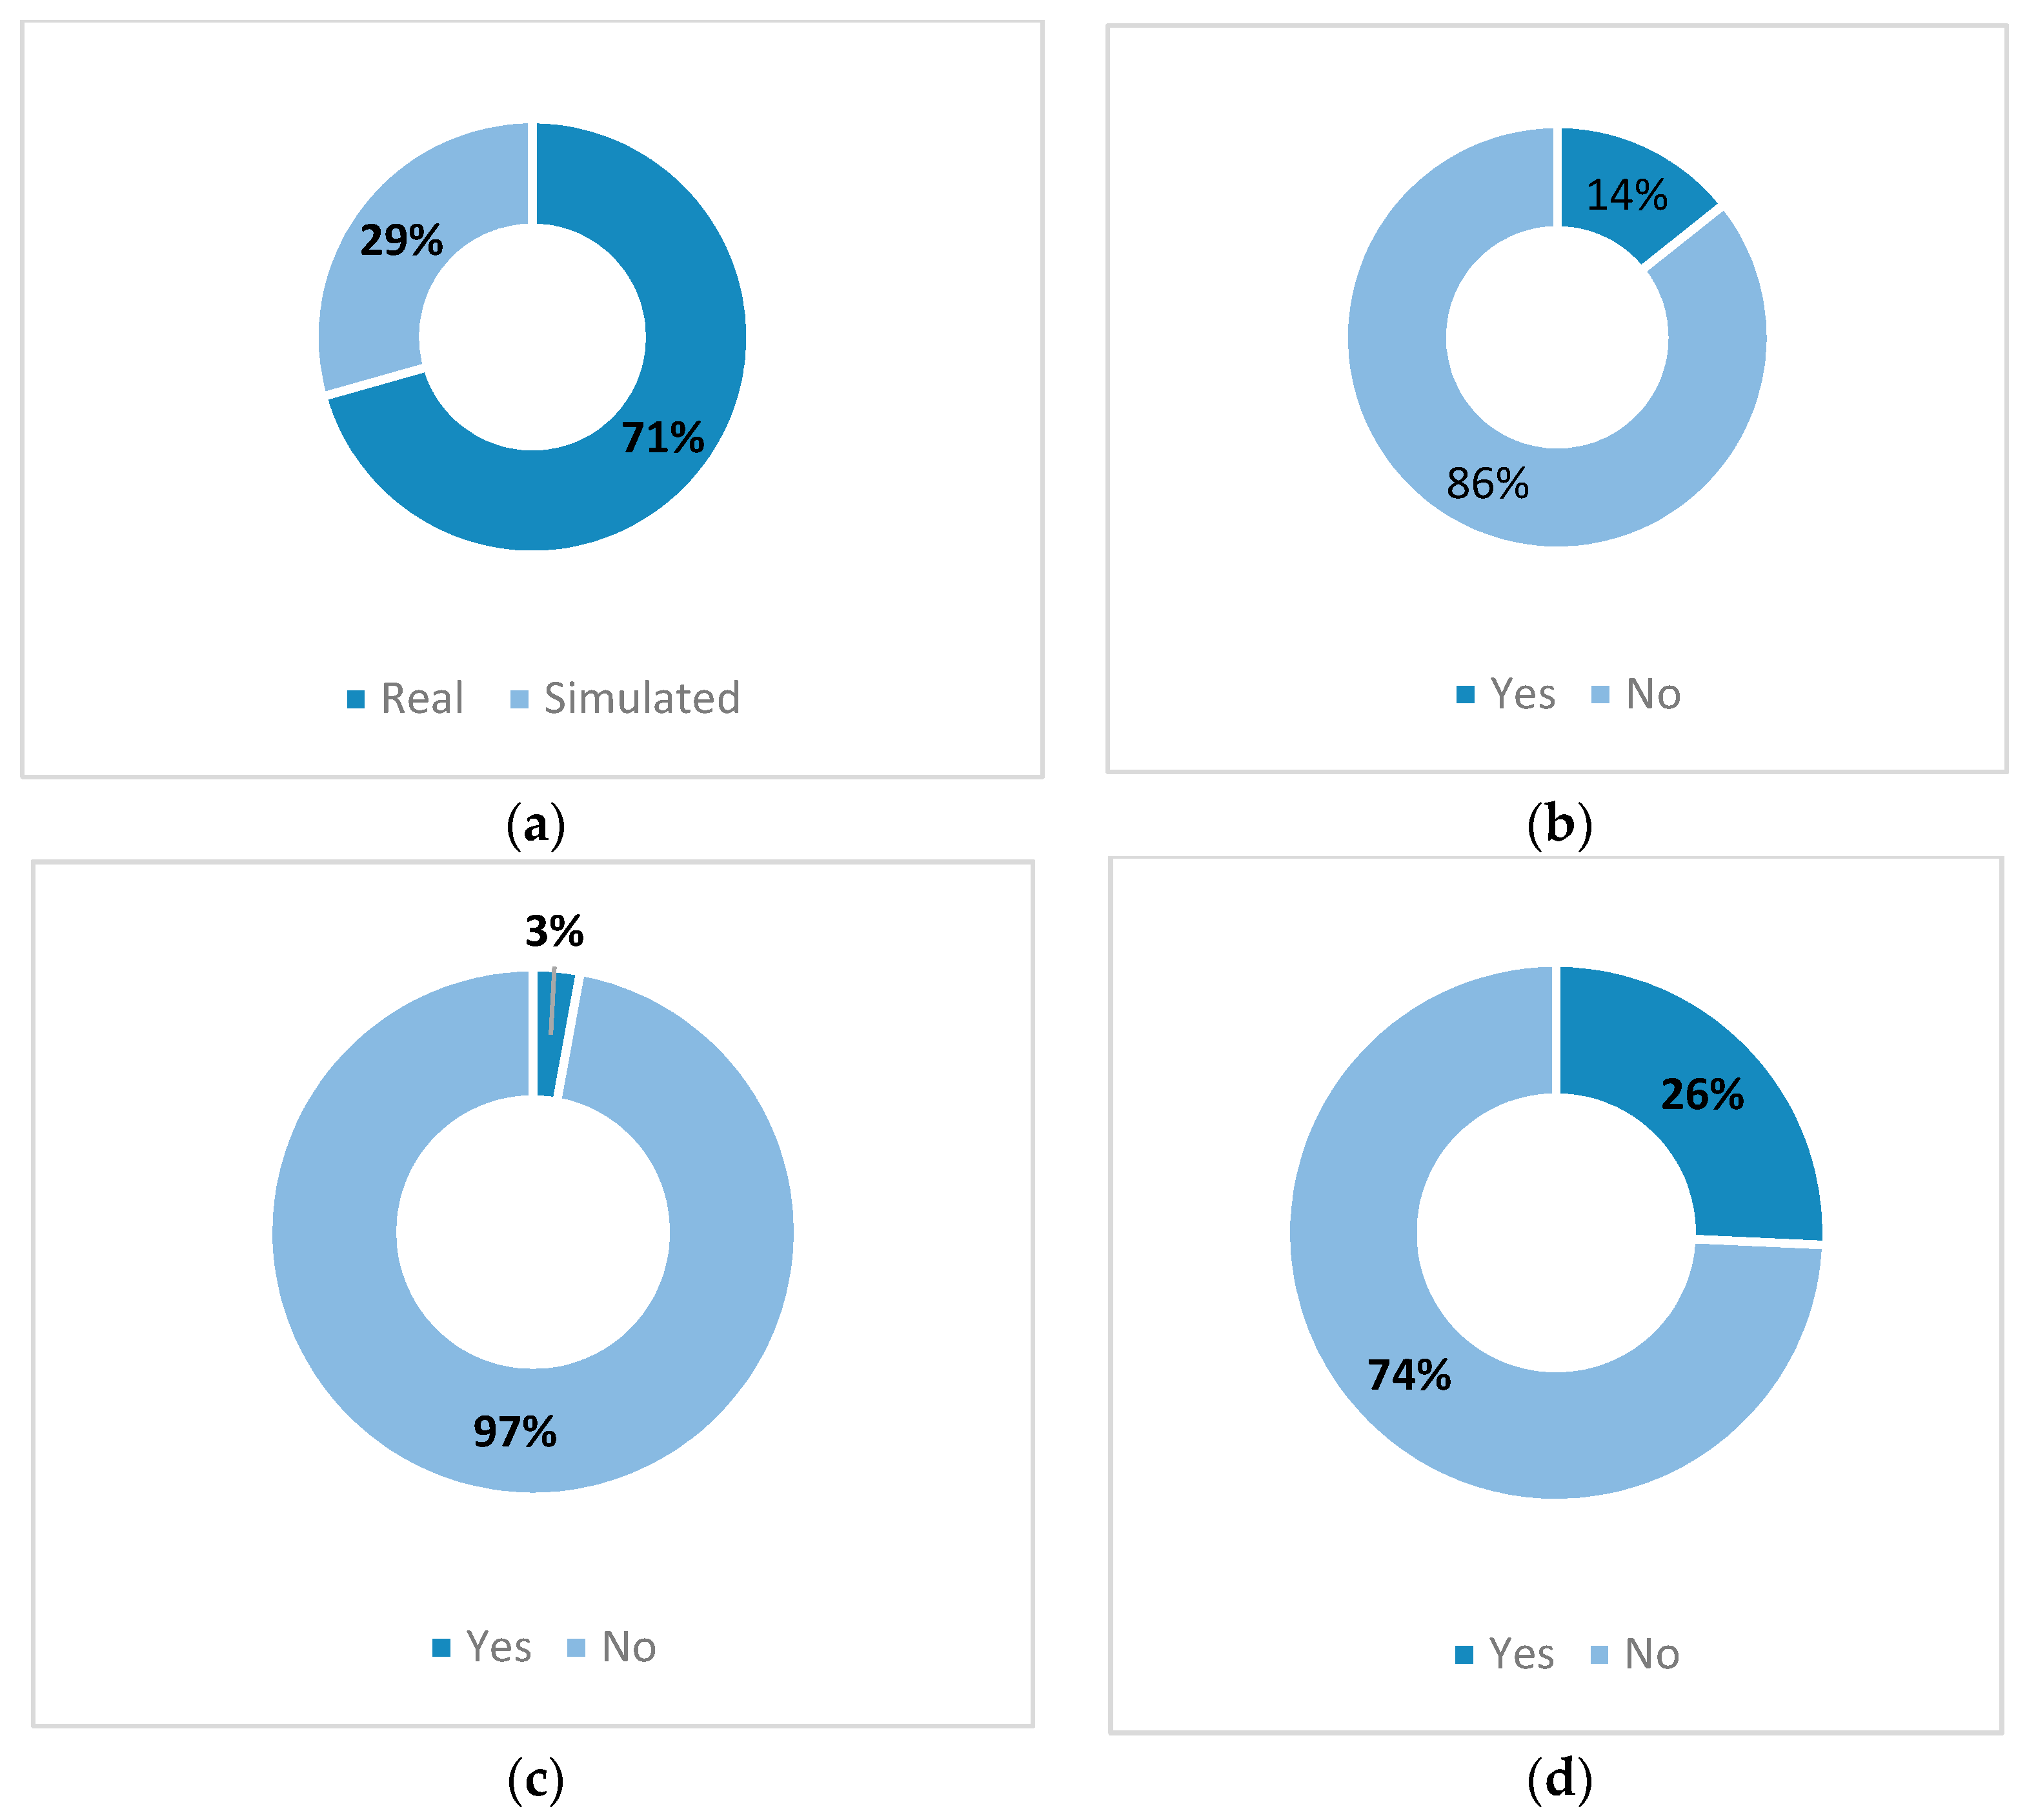
- Existence of explanation evaluation metrics: This is stated as presence or not of a metric.
- (vi)
- Human role in PHM-XAI works: This is considered as existence of the mentioned role or not.
- (vii)
- Uncertainty management: This is linked to if uncertainty management in any of the stages of the PHM or XAI approaches increases the possibility for adoption by user due to additional surety.
- (viii)
- Case study type (real or simulated): Real was considered when the data of a case study came from a real mechanical device, whereas simulated was considered when data were generated utilizing any type of computational simulation.
2.4. Outputs
- (i)
- Table: Selected and excluded articles with variables sought.
- (ii)
- Pie chart: Summary of the PHM activity category, explanation metric, human role, and uncertainty management.
- (iii)
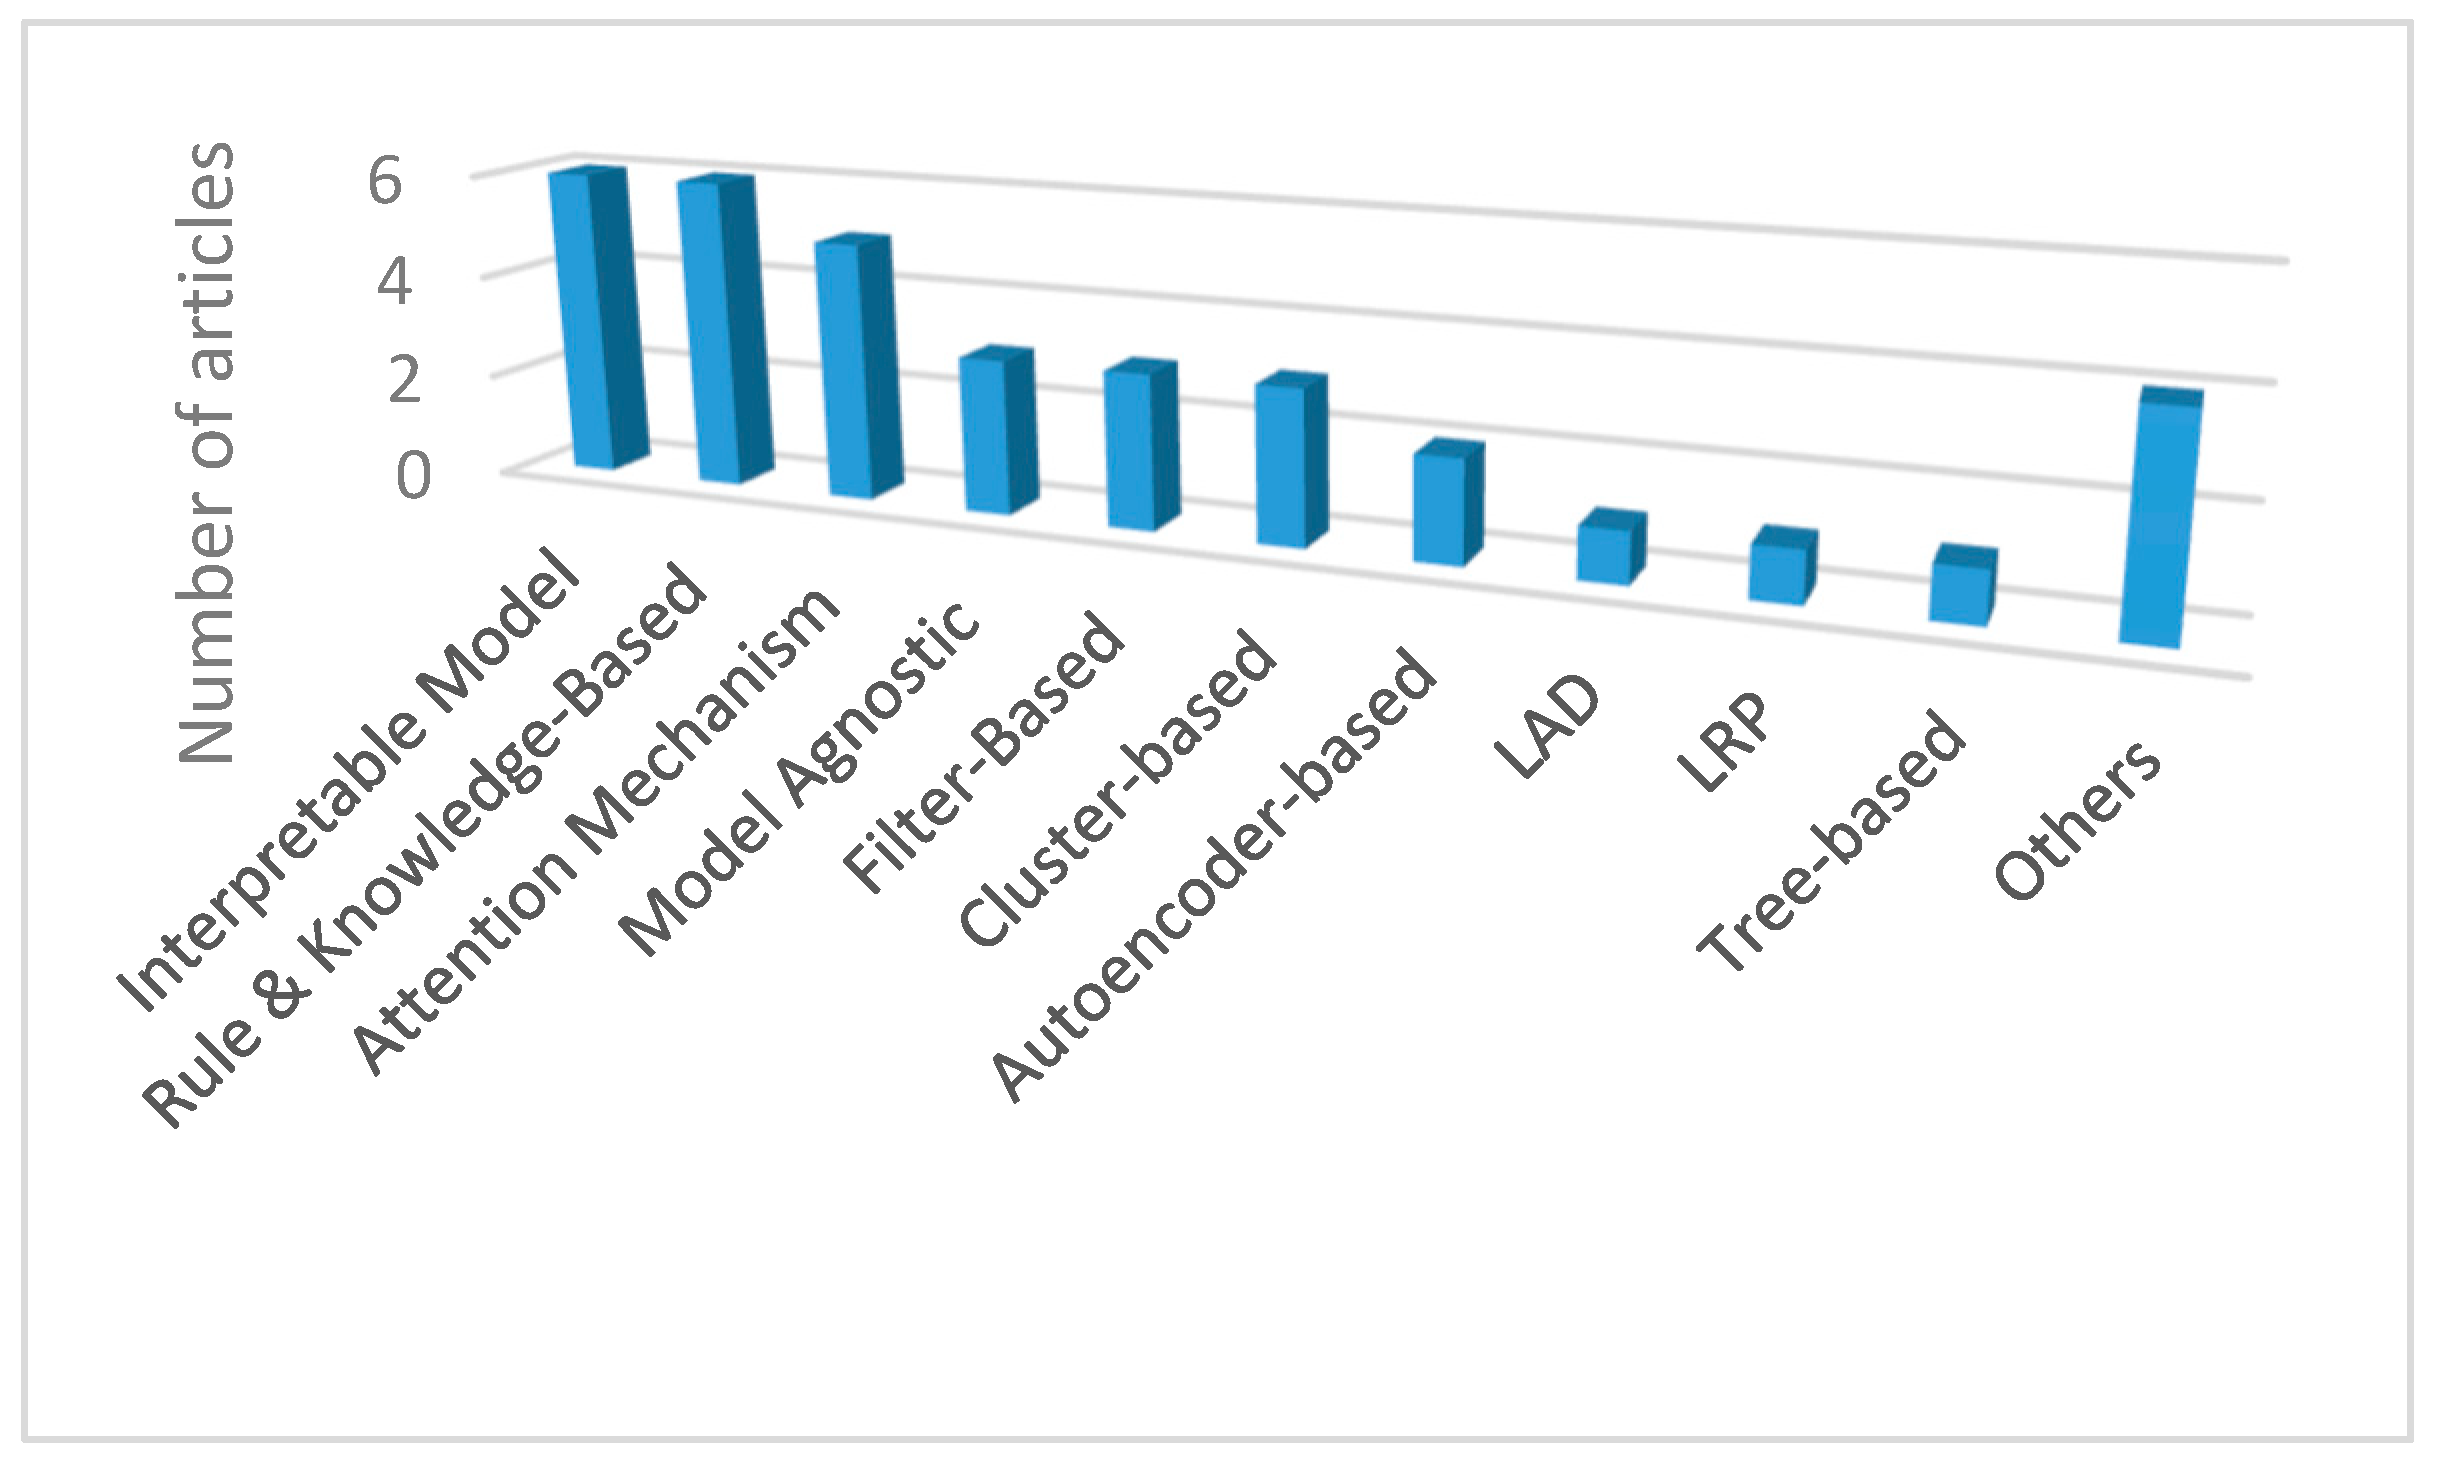
- Column graph: Summary of the PHM-XAI yearly trend, XAI approach employed, recorded performance, and XAI role in assisting a PHM task.
3. Results
3.1. Framework
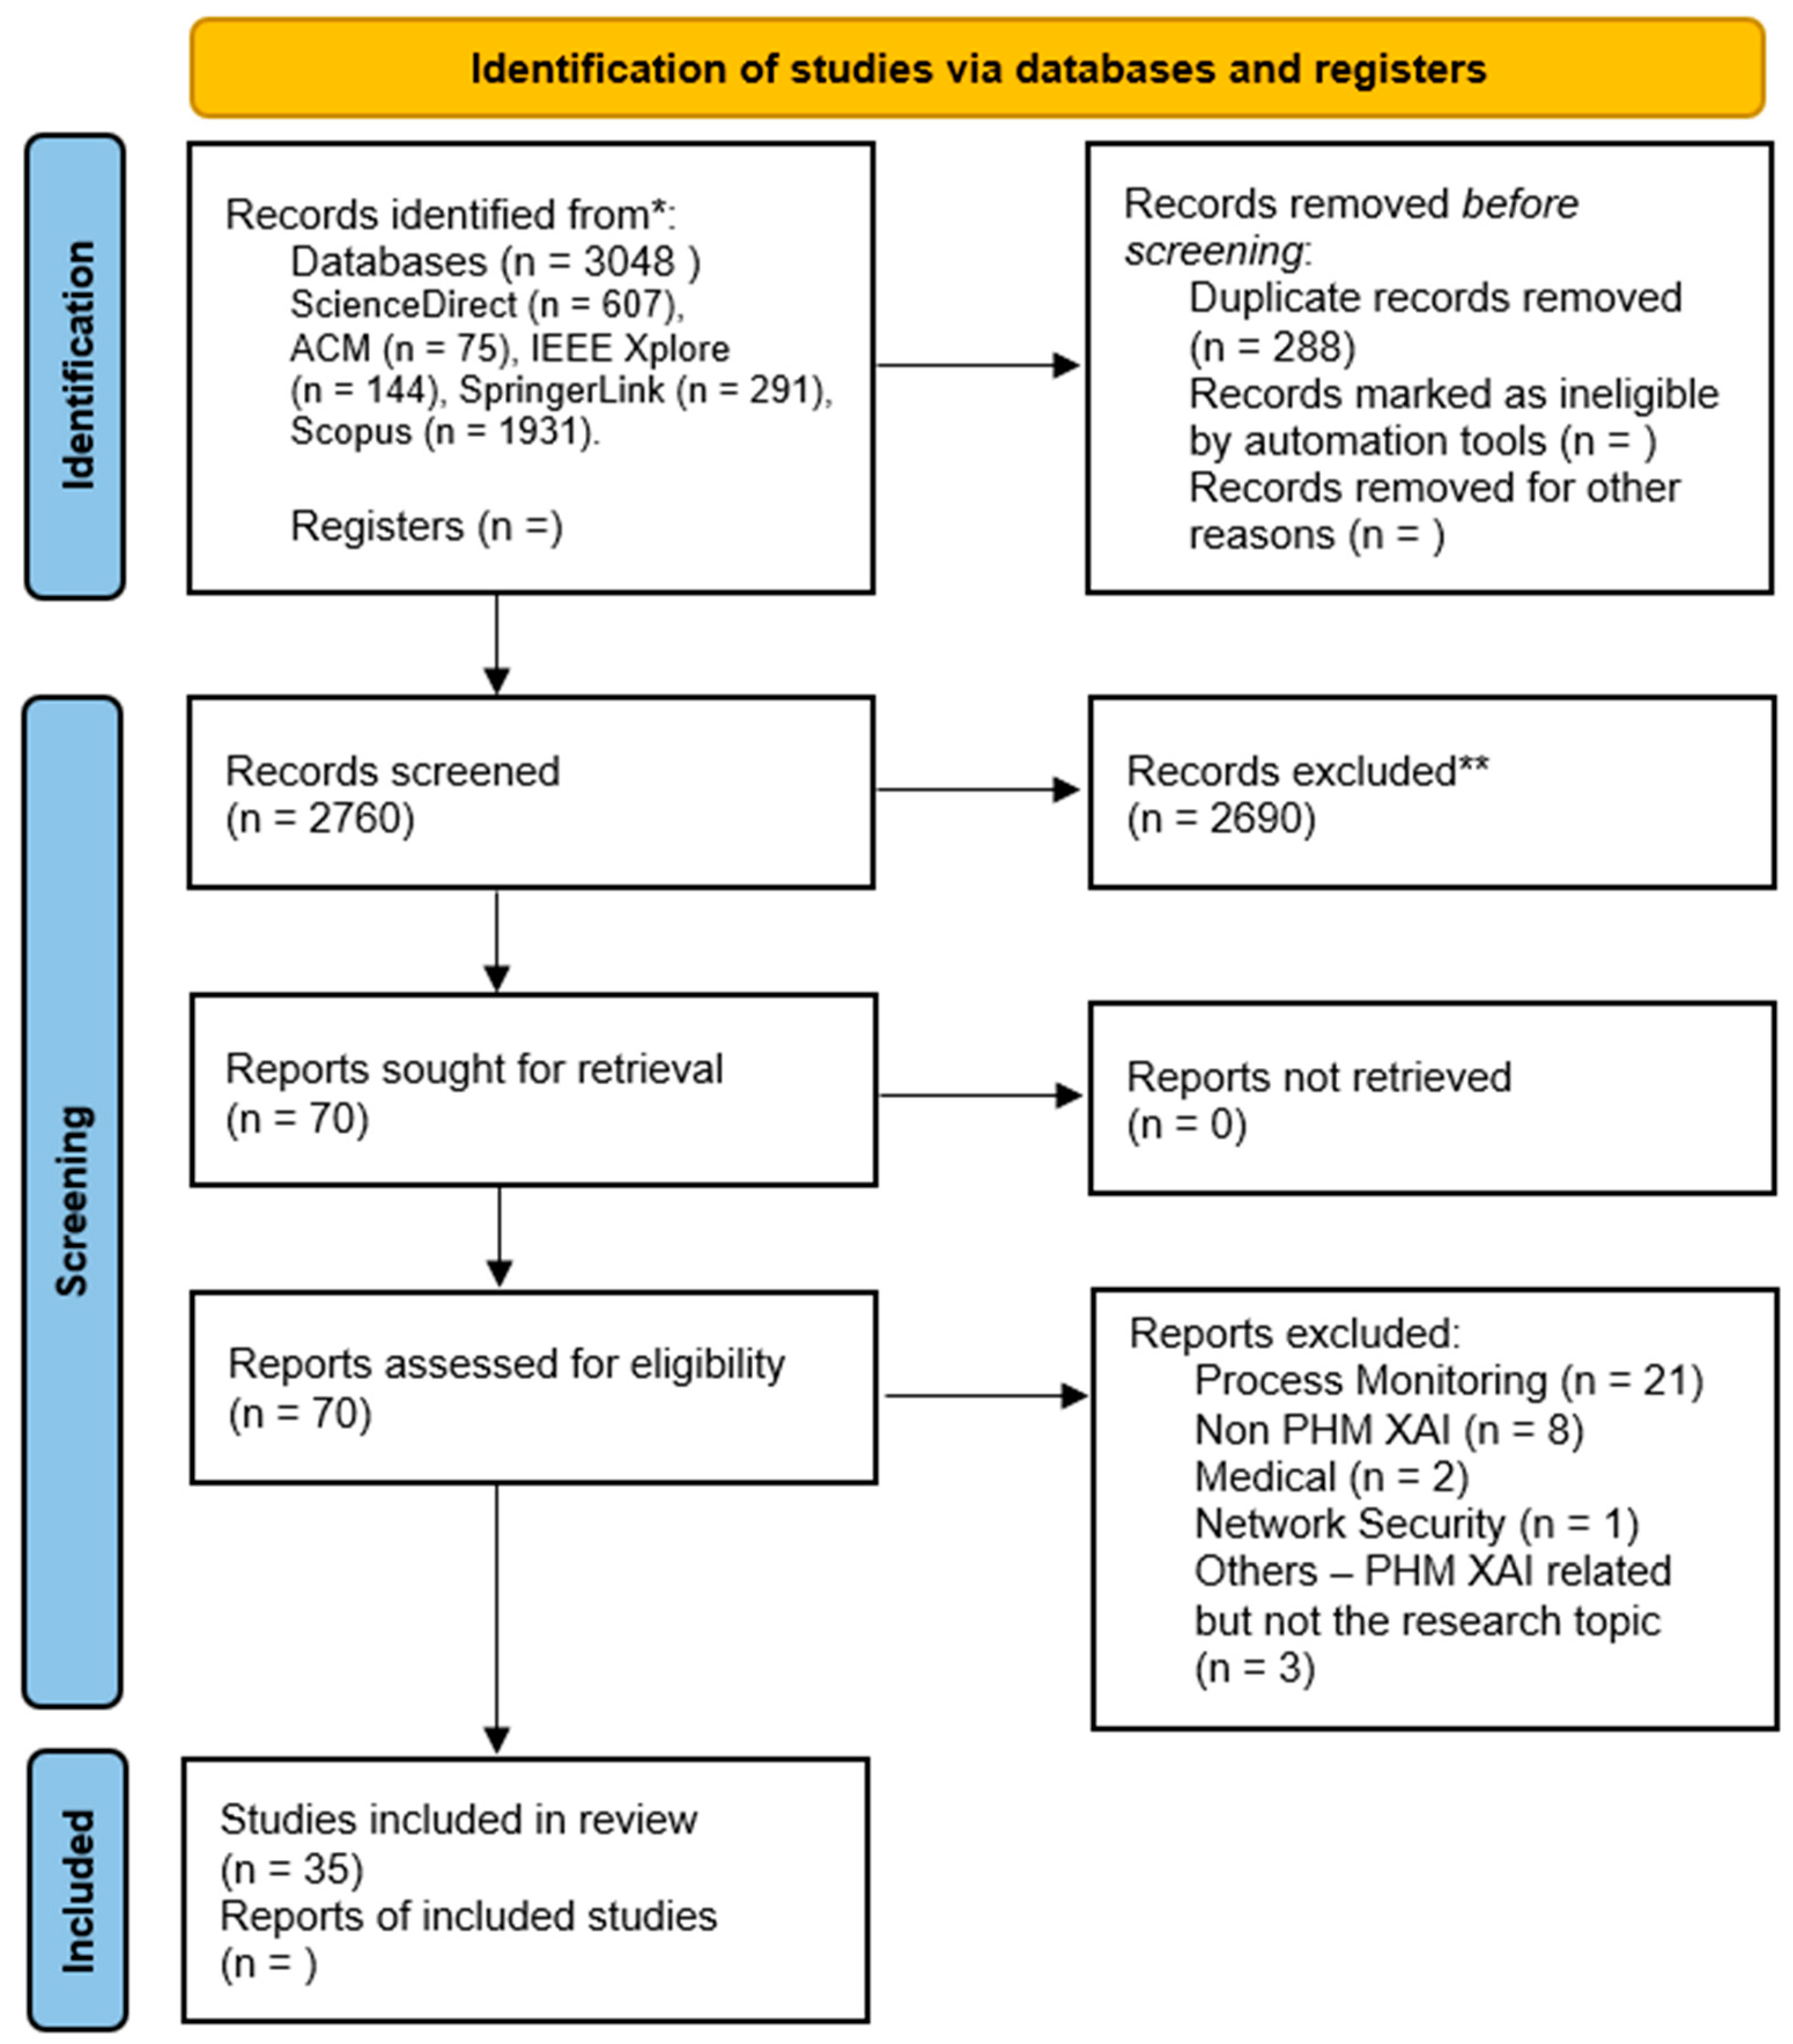
3.2. PRISMA Flow Diagram
4. Discussion
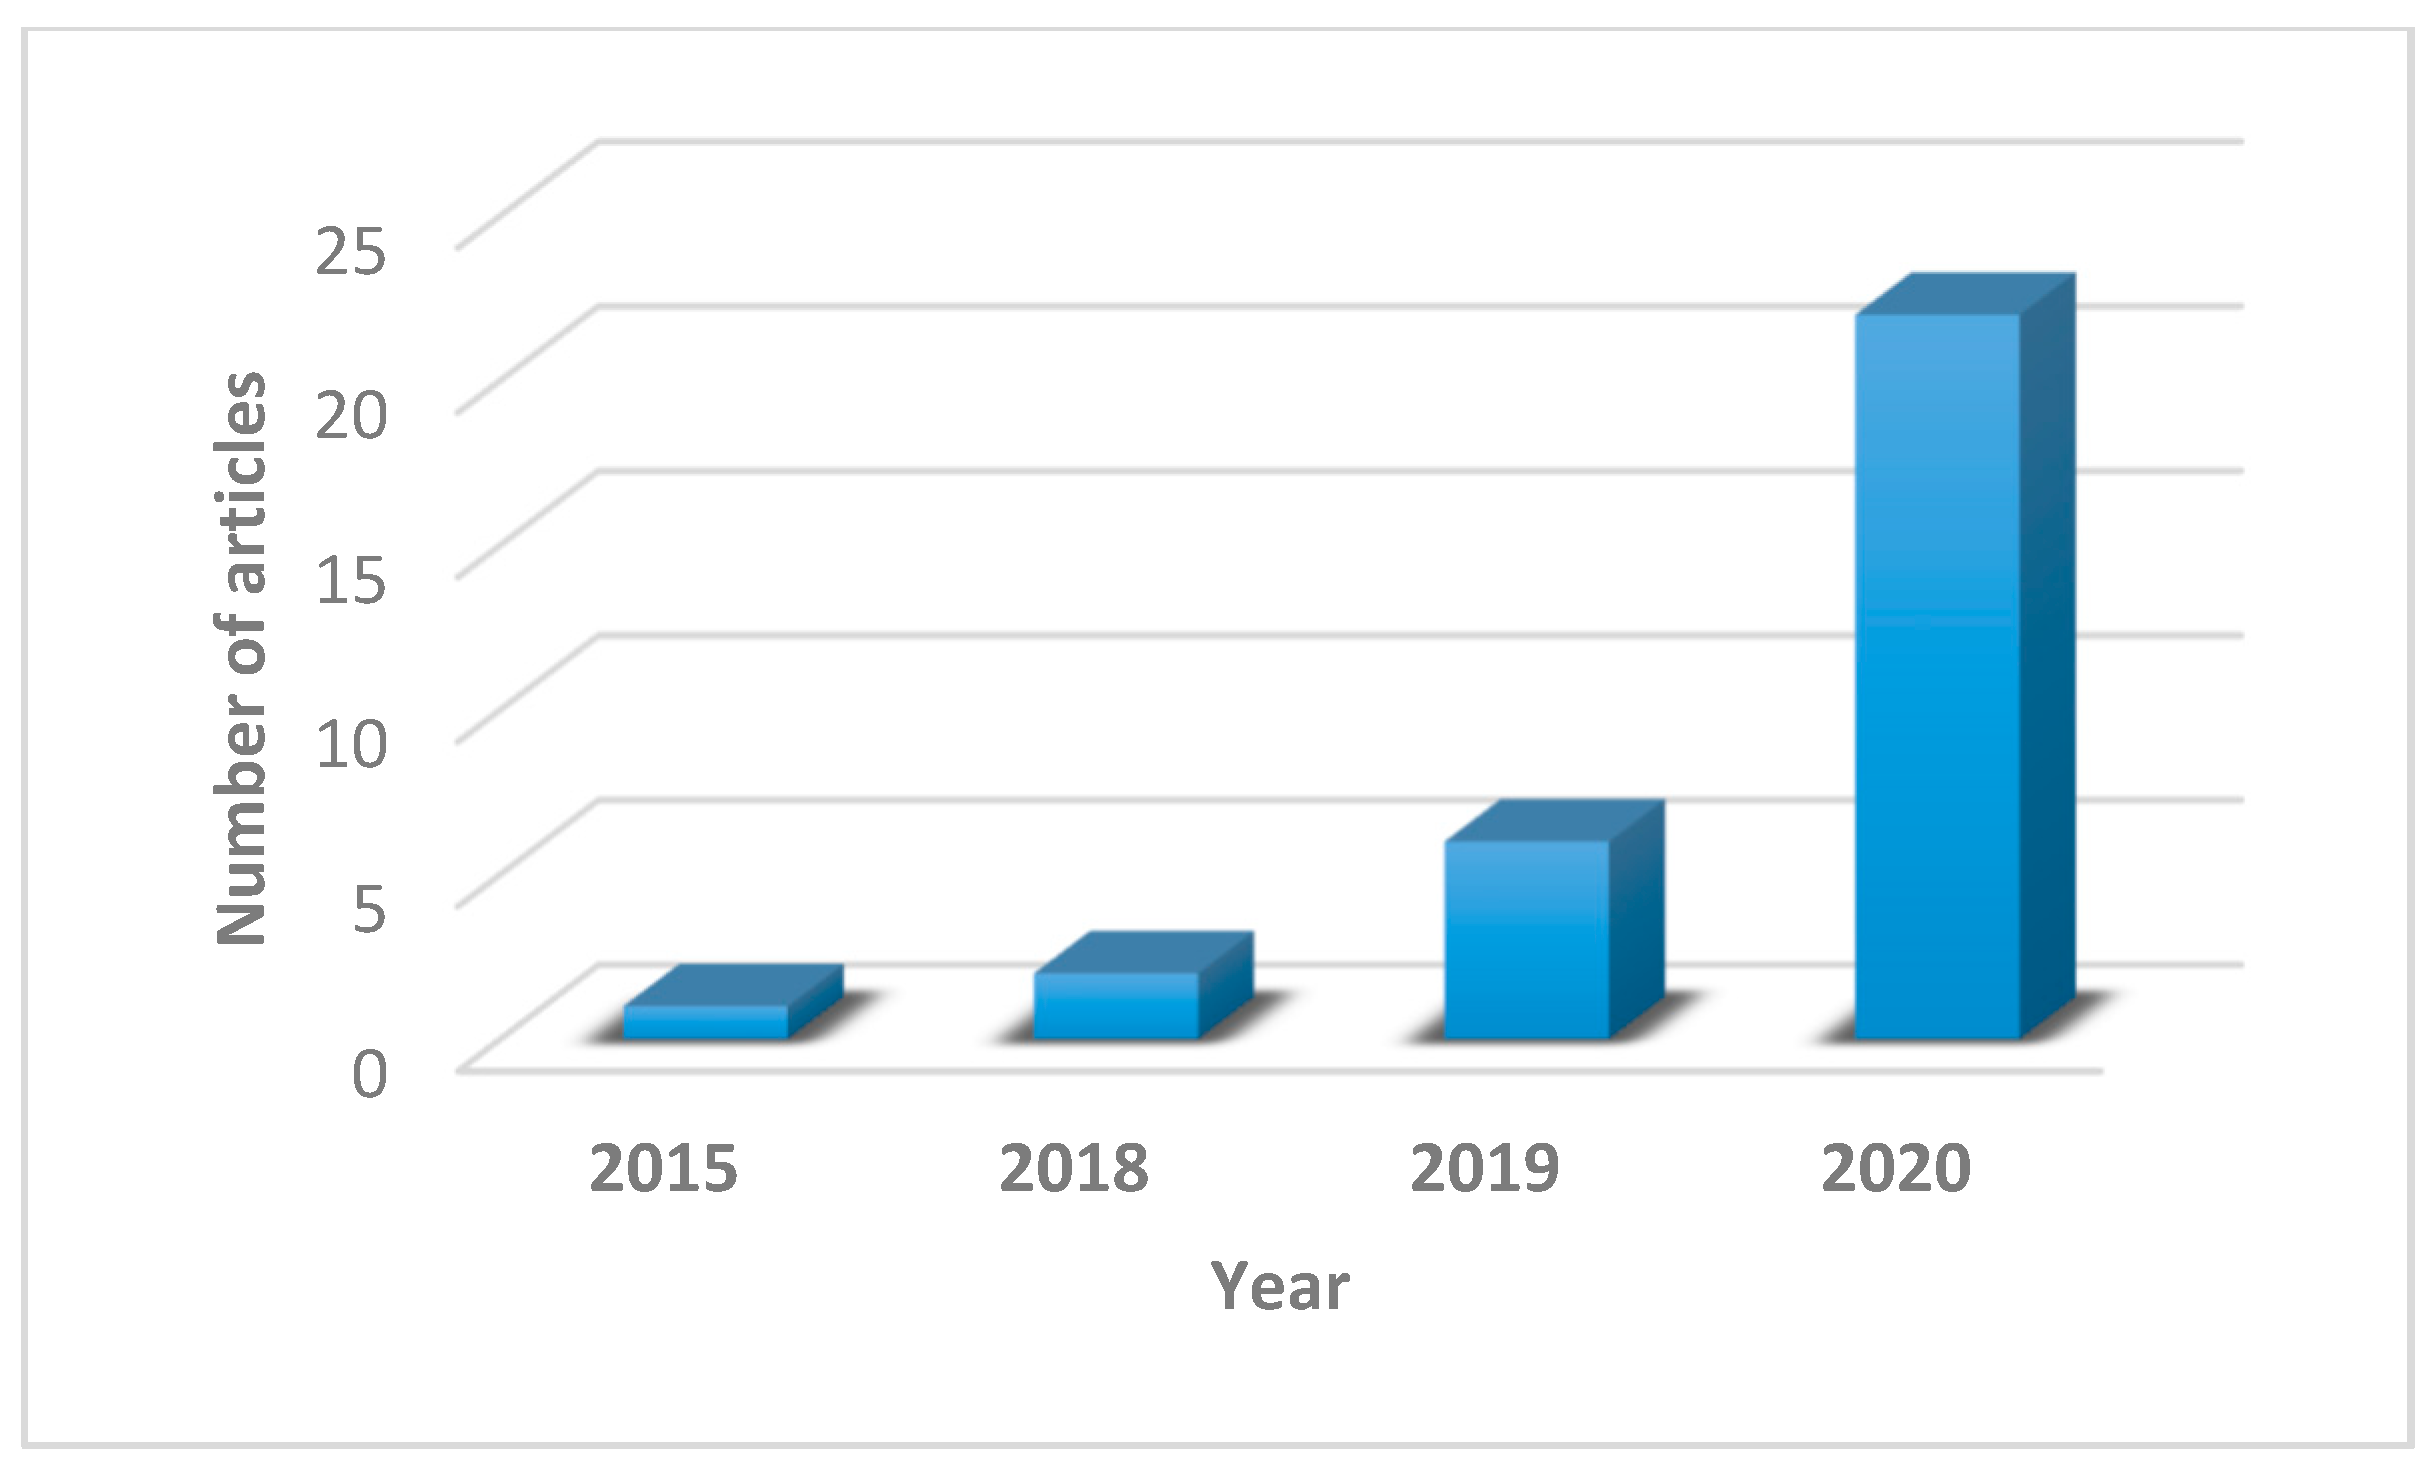
4.1. General Trend
4.2. XAI
4.3. PHM
4.4. Lack of Current Studies
4.4.1. Human Role in XAI
4.4.2. Explainability Metrics
4.4.3. Uncertainty Management
5. Conclusions
- (i)
- PHM-XAI progress: Much unexplored opportunity is still available for prognostics and health management researchers to advance the assimilation of explainable artificial intelligence in prognostics and health management.
- (ii)
- Interpretable models, rule- and knowledge-based models, and attention mechanism: These are the most widely used techniques and more research involving other approaches could give additional insight into the prognostics and health management community in terms of performance, ease of use, and flexibility of the explainable artificial intelligence method.
- (iii)
- XAI as PHM tool and instrument of explanation: explainable artificial intelligence could be preferred or required within prognostics and health management compared to standalone methods.
- (iv)
- PHM performance uninfluenced by XAI: The confidence of prognostics and health management practitioners and end users in the artificial intelligence model’s adoption should be boosted.
- (v)
- Lack of human role, explanation metrics, and uncertainty management: Efforts need to be concentrated in these areas amongst other in the future. Moreover, the development of evaluation metrics that can cater prognostics and health management needs is urgently recommended.
- (vi)
- Mostly real case studies were tested: the confidence of prognostics and health management practitioners and end users in the artificial intelligence model’s adoption should be increased.
- (i)
- This review does not classify explainable artificial intelligence methods in term of their nature (post-hoc, local, or global explainability): New insights or patterns could potentially be discovered by applying this classification.
- (ii)
- The review does not explore in detail the subject of explainability metrics: This aspect should be a standalone subject as it is a vast and emerging topic that involves the explainable artificial intelligence methods, human factors, and the proper need for the domain.
Author Contributions
Funding
Institutional Review Board Statement
Informed Consent Statement
Data Availability Statement
Conflicts of Interest
Appendix A

| ID | Authors and Year | Title | Publisher, Publication Name | PHM Activity | XAI Approach | Performance | XAI Assist PHM | Metric | Human Role | Uncertainty Management | Case Study |
|---|---|---|---|---|---|---|---|---|---|---|---|
| 1 | [54] Wong et al., 2015 | On equivalence of FIS and ELM for interpretable rule-based knowledge representation | IEEE, IEEE Transactions on Neural Networks and Learning Systems | Diagnostic | Rule- and knowledge-based | Accuracy: 85.14% Good | Yes | No | No | No | Real— Circulating cooling water system for turbine. (energy sector) |
| 2 | [55] Wu et al., 2018 | K-PdM: KPI-oriented machinery deterioration estimation framework for oredictive maintenance using cluster-based hidden Markov model | IEEE, IEEE Access | Prognostic | Rule- and knowledge-based | RMSE: 14.28 Very Good | No | No | No | Probabilistic state transition model | Simulated—Turbofan engine (aerospace) |
| 3 | [56] Massimo et al., 2018 | Unsupervised classification of multichannel profile data using PCA: An application to an emission control system | Elsevier, Computers and Industrial Engineering | Diagnostic | Cluster- based | MSE: 2.127 × 10⁻⁵ to 5.809 × 10⁻³ Very Good | Yes | No | Yes | No | Real—Emission control system (automotive, environment) |
| 4 | [57] Mathias et al, 2019 | Forecasting remaining useful life: Interpretable deep learning approach via variational Bayesian inference | Elsevier, Decision Support Systems | Prognostic | Interpretable model | MAE: 13.267 Better than other methods, except LSTM | No | No | No | Uncertainty in model parameters | Simulated— Turbofan engine (Aerospace) |
| 5 | [58] Imene et al., 2019 | Fault isolation in manufacturing systems based on learning algorithm and fuzzy rule selection | Springer, Neural Computing and Applications | Diagnostic | Rule- and knowledge- based | Accuracy: 97.01% Very Good | Yes | No | No | Probabilistic classification by Bayes decision rule | Real— Rotary kiln (civil engineering) |
| 6 | [59] Kerelous et al., 2019 | Interpretable logic tree analysis: A data-driven fault tree methodology for causality analysis | Elsevier, Expert Systems with Applications | Diagnostic | LAD | Mean and standard errors are less than 2% and 1% Very good | Yes | No | Yes | FTA—Expert opinion | Simulated— Actuator system (manufacturing, energy, production, chemical) |
| 7 | [60] Rajendran et al., 2019 | Unsupervised wireless spectrum anomaly detection with interpretable features | IEEE, IEEE Transactions on Cognitive Communications and Networking | Anomaly detection | Autoencoder | Generally better than other tested methods | Yes | No | No | Probabilistic classification error by discriminator | Real—software defined radio spectrum simulated—synthetic data (communication) |
| 8 | [61] Wang et al., 2019 | An attention-augmented deep architecture for hard drive status monitoring in large-scale storag systems | ACM, ACM Transactions on Storage | Prognostic, diagnostic | Attention mechanism | Prognostic precision: 94.5–98.3% Generally, better than other methods. No comparison in diagnostic | Diag: Yes Prog: No | No | No | No | Real— Hard drive (information technology) |
| 9 | [62] Le et al., 2019 | Visualization and explainable machine learning for efficient manufacturing and system operations | ASTM, Smart and Sustainable Manufacturing Systems | Diagnostic | Others | N/A 1 | Yes | No | Yes | No | Simulated—turbofan (aerospace) |
| 10 | [63] Langone et al., 2020 | Interpretable anomaly prediction: Predicting anomalous behavior in industry 4.0 settings via regularized logistic regression tools | Elsevier, Data and Knowledge Engineering | Anomaly detection | Interpretable model | Kappa: 0.4–0.6 AUC: 0.6–0.8 F1: 0.3–0.5 PRAUC: 0.2–0.4 Good | Yes | No | No | Statistical feature extraction | Real— High-pressure plunger pump (chemical) |
| 11 | [64] Peng et al., 2020 | A dynamic structure-adaptive symbolic approach for slewing bearings life prediction under variable working conditions | Sage, Structural Health Monitoring | Prognostic | Interpretable model | RMSE: 18.19 Better than previous methods | Yes | No | No | No | Real— Slewing bearings (rotating machinery, energy, manufacturing) |
| 12 | [65] Ritto et al., 2020 | Digital twin, physics-based model, and machine learning applied to damage detection in structures | Elsevier, Mechanical Systems and Signal Processing | Diagnostic | Interpretable model | Accuracy: 74.8–93.3% Good | No | No | No | No | Not specified— Spring mass system (wind turbine, energy) |
| 13 | [66] Rea et al., 2020 | Progress toward interpretable machine learning based disruption predictors across tokamaks | Taylor and Francis, Fusion Science and Technology | Diagnostic | Interpretable model | N/A | No | No | No | Physic-based indicator | Real DIII—D and JET tokamaks (energy) |
| 14 | [67] Murari et al., 2020 | Investigating the physics of tokamak global stability with interpretable ML tools | MDPI, Applied Sciences | Anomaly detection | Mathematic equation | Success Rate > 90% Very Good | No | No | No | No | Type unspecified—Tokamak (energy) |
| 15 | [68] Zhou et al., 2020 | Fault diagnosis of gas turbine based on partly interpretable convolutional neural networks | Elsevier, Energy | Diagnostic | Tree-based | Accuracy: 95.52% Better than other tested methods | Yes | No | No | No | Simulated— Gas turbine model (energy) |
| 16 | [69] Zhou et al., 2020 | Addressing noise and skewness in interpretable health-condition assessment by learning model confidence | MDPI, Sensors | Diagnostic | Rule- and knowledge- based | F1 Score: 0.8005 Very Good | No | No | No | No | Real— Aircraft structure. (aerospace) |
| 17 | [70] Jianbo et al., 2020 | Knowledge extraction and insertion to deep belief network for gearbox fault diagnosis | Elsevier, Knowledge-Based Systems | Diagnostic | Rule- and Knowledge-based | Accuracy: 92.33 Very Good | Yes | No | No | No | Real— Gearbox (manufacturing, energy, automotive) |
| 18 | [71] Conde et al., 2020 | Isotonic boosting classification rules | Springer, Advances in Data Analysis and Classification | Diagnostic | Rule- and knowledge-based | Total Misclassification Probability (TMP): 0.036-0.164 Good and comparable to other methods | Yes | No | No | No | Real— Induction motor (manufacturing, energy, production) |
| 19 | [72] Antonio et al., 2020 | Using an autoencoder in the design of an anomaly detector for smart manufacturing | Elsevier, Pattern Recognition Letters | Anomaly detection | Autoencoder | Precision: 77.8–100% Accuracy: 94.9–100% Same as the previous best method | Yes | No | No | No | Simulated— Continuous batch washing equipment (industrial laundry) |
| 20 | [73] Abid et al., 2020 | Robust interpretable deep learning for intelligent fault diagnosis of induction motors | IEEE, IEEE Transactions on Instrumentation and Measurement | Diagnostic | Filter-based | Accuracy: 99.95% ± 0.05% Better than other tested methods and previous works | Yes | No | No | No | Real— Electrical and mechanical motor (Manufacturing, Energy, Production) |
| 21 | [74] Liu et al., 2020 | Tscatnet: An interpretable cross-domain intelligent diagnosis model with antinoise and few-shot learning capability | IEEE, IEEE Transactions on Instrumentation and Measurement | Diagnostic | Filter-based | Accuracy: 100% Better than other tested methods | Yes | No | No | No | Real—Bearing, drive train (manufacturing, energy, production) |
| 22 | [75] Li et al., 2020 | Waveletkernelnet: an interpretable deep neural network for industrial intelligent diagnosis. | IEEE, IEEE Transactions on Systems, Man, and Cybernetics: Systems | Diagnostic | Filter-based | Accuracy: 92.61–99.91% Better than other tested methods | Yes | No | No | No | Real—Bearing, drive train (manufacturing, energy, production) |
| 23 | [76] Chen et al., 2020 | Vibration signals analysis by explainable artificial intelligence approach: Application on bearing faults diagnosis | IEEE, IEEE Access | Diagnostic | Attention mechanism | N/A | No | No | No | No | Real— Rolling bearing (manufacturing, energy, production) |
| 24 | [77] Sun et al., 2020 | Vision-based fault diagnostics using explainable deep learning with class activation maps | IEEE, IEEE Access | Diagnostic | Attention mechanism | Accuracy: 95.85% Precision: 100% Very good | No | No | No | No | Real— Base-excited cantilever beam, water pump system (manufacturing, energy, production) |
| 25 | [78] Oh et al., 2020 | VODCA: Verification of diagnosis using CAM-based approach for explainable process monitoring | MDPI, Sensors | Diagnostic | Attention mechanism | Accuracy: 78.4–99.5% Good | Yes | No | No | True positive and true negative indicators | Simulated— Ford motor and real—sapphire grinding (automotive, production) |
| 26 | [79] Sreenath et al., 2020 | Fouling modeling and prediction approach for heat exchangers using deep learning | Elsevier, International Journal of Heat and Mass Transfer | Failure Prediction | Model agnostic | Accuracy: 99.80–99.92% Very good | No | No | No | No | Simulated— Heat-exchanger model (manufacturing, energy, production) |
| 27 | [80] Hong et al., 2020 | Remaining useful life prognosis for turbofan engine using explainable deep neural network with dimensional reduction | MDPI, Sensors | Prognostic | Model Agnostic | RMSE: 10.41 Very good | No | No | No | No | Simulated—Turbofan engine (aerospace) |
| 28 | [81] Grezmak et al., 2020 | Interpretable convolutional neural network through layer-wise relevance propagation for machine fault diagnosis | IEEE, IEEE Sensors Journal | Diagnostic | LRP | Accuracy: 100% Very good | No | No | No | No | Real— Induction motor (manufacturing, energy, production) |
| 29 | [82] Ming et al., 2020 | ProtoSteer: Steering deep sequence model with prototypes | IEEE, IEEE Transactions on Visualization and Computer Graphics | Diagnostic | Others | N/A | Yes | No | Yes | No | Real— Vehicle fault log (automotive) |
| 30 | [83] Chen et al., 2020 | Frequency-temporal-logic-based bearing fault diagnosis and fault interpretation using Bayesian optimization &ANN | Elsevier, Mechanical Systems and Signal Processing | Diagnostic | Others | Better error percentage, error rate and robustness than other tested methods | Yes | No | No | No | Real—Bearings (manufacturing, energy, production) |
| 31 | [84] Steenwinckel et al., 2021 | FLAGS: A methodology for adaptive anomaly detection and root cause analysis on sensor data streams by fusing expert knowledge with machine learning | Elsevier, Future Generation Computer Systems | Anomaly detection, diagnostic | Rule- and knowledge- based | Accuracy: 75% Good in anomaly detection, no result for diagnostic | Yes, for both | No | Yes | FMEA and FTA—Expert opinion | Real—Train (transportation) |
| 32 | [85] Zhang et al., 2021 | A new interpretable learning method for fault diagnosis of rolling bearings | IEEE, EEE Transactions on Instrumentation and Measurement | Diagnostic | Cluster- based | Accuracy: 99.3–100% Very good | Yes | No | No | No | Real— Rolling bearing (manufacturing, energy, production) |
| 33 | [86] Onchis et al., 2021 | Stable and explainable deep learning damage prediction for prismatic cantilever steel beam | Elsevier, Computers in Industry | Diagnostic | Model Agnostic | Accuracy for 19% damage: 75–92% Accuracy for 43% damage: 85–95% Good | Yes, by LIME only | Stability-fit compensation index (SFC)—Quality indicator of the explanations | No | Yes | Real— Prismatic cantilever steel beam (civil engineering, structural engineering) |
| 34 | [87] Kim et al., 2021 | An explainable convolutional neural network for fault diagnosis in linear motion guide | IEEE, IEEE Transactions on Industrial Informatics | Diagnostic | Attention mechanism | Accuracy: 99.59–99.71% Very good | No | No | No | No | Real— Linear motion guide (manufacturing, energy, production) |
| 35 | [88] Ding et al., 2021 | Stationary subspaces autoregressive with exogenous terms methodology for degradation trend estimation of rolling and slewing bearings | Elsevier, Mechanical Systems and Signal Processing | Prognostic | Others | MAE: 0.0375–0.0414 RMSE: 0.0482–0.0659 Better than other methods and comparable to previous works | Yes | No | No | No | Real— Rolling and slewing bearings (manufacturing, energy, production) |
| ID | Authors, Date | Title | Publisher, Publication Name | Exclusion Reason |
|---|---|---|---|---|
| 1 | [89] Kumar et al., 2016 | Adaptive cluster tendency visualization and anomaly detection for streaming data | ACM, ACM Transactions on Knowledge Discovery from Data | Non-PHM-XAI implementation/case study |
| 2 | [90] Bao et al., 2016 | Improved fault detection and diagnosis using sparse global-local preserving projections | Elsevier, Journal of Process Control | Process monitoring and anomaly detection |
| 3 | [91] Kozjek et al., 2017 | Interpretative identification of the faulty conditions in a cyclic manufacturing process | Elsevier, Journal of Manufacturing Systems | Process monitoring and diagnosis |
| 4 | [92] Ragab et al., 2017 | Fault diagnosis in industrial chemical processes using interpretable patterns based on logical analysis of data | Elsevier, Expert Systems with Applications | Process monitoring and fault diagnosis |
| 5 | [93] Tang et al., 2018 | Fisher discriminative sparse representation based on DBN for fault diagnosis of complex system | MDPI, Applied Science | Process monitoring and fault diagnosis |
| 6 | [94] Luo et al., 2018 | Knowledge-data-integrated sparse modeling for batch process monitoring | Elsevier, Chemical Engineering Science | Process anomaly detection and diagnosis |
| 7 | [95] Puggini et al., 2018 | An enhanced variable selection and Isolation Forest based methodology for anomaly detection with OES data | Elsevier, Engineering Applications of Artificial Intelligence | Process anomaly detection and diagnosis |
| 8 | [96] Cheng et al., 2018 | Monitoring influent measurements at water resource recovery facility using data-driven soft sensor approach | IEEE, IEEE Sensors Journal | Process anomaly detection |
| 9 | [97] Zhang et al., 2018 | Weakly correlated profile monitoring based on sparse multi-channel functional principal component analysis | Taylor and Francis, IISE Transactions | Process monitoring |
| 10 | [98] Luo et al., 2018 | Industrial process monitoring based on knowledge-data integrated sparse model and two-level deviation magnitude plots | ACS, Industrial and Engineering Chemistry Research | Process monitoring, anomaly detection and diagnosis |
| 11 | [99] Vojíř et al., 2018 | EasyMiner.eu: web framework for interpretable machine learning based on rules and frequent item sets | Elsevier, Knowledge-Based Systems | Only development version offers anomaly detection |
| 12 | [100] Du et al., 2019 | A condition change detection method for solar conversion efficiency in solar cell manufacturing processes | IEEE, IEEE Transactions on Semiconductor Manufacturing | Process monitoring and anomaly detection |
| 13 | [101] Keneniet et al., 2019 | Evolving rule-based explainable artificial intelligence for unmanned aerial vehicles | IEEE, IEEE Access | Interpret why agent deviate from its mission, not because of system failure |
| 14 | [102] Wang et al., 2019 | Dynamic soft sensor development based on convolutional neural networks | ACS, Industrial and Engineering Chemistry Research | Process modelling |
| 15 | [103] Wang et al., 2019 | Explicit and interpretable nonlinear soft sensor models for influent surveillance at a full-scale wastewater treatment plant | Elsevier, Journal of Process Control | Process monitoring and variable prediction |
| 16 | [104] Liu et al., 2019 | Intelligent online catastrophe assessment and preventive control via a stacked denoising autoencoder | Elsevier, Neurocomputing | Black-box |
| 17 | [105] Bukhsh et al., 2019 | Predictive maintenance using tree-based classification techniques: a case of railway switches | Elsevier, Transportation Research Part C | Predict maintenance need, activity type and maintenance trigger status |
| 18 | [106] Ragab et al., 2019 | Deep understanding in industrial processes by complementing human expertise with interpretable patterns of machine learning | Elsevier, Expert Systems with Applications | Process monitoring and fault diagnosis |
| 19 | [107] Luo et al., 2019 | Sparse robust principal component analysis with applications to fault detection and diagnosis | ACS, Industrial and Engineering Chemistry Research | Process monitoring, fault detection and diagnosis |
| 20 | [108] Jie et al., 2020 | Process abnormity identification by fuzzy logic rules and expert estimated thresholds derived certainty factor | Elsevier, Chemometrics and Intelligent Laboratory Systems | Process anomaly diagnosis |
| 21 | [109] Sajedi et al., 2020 | Dual Bayesian inference for risk-informed vibration-based diagnosis | Wiley, Computer-Aided Civil and Infrastructure Engineering | Uncertainty interpretation, not model’s interpretation |
| 22 | [110] Sun et al., 2020 | ALVEN: Algebraic learning via elastic net for static and dynamic nonlinear model identification | Elsevier, Computers and Chemical Engineering | Process monitoring and variable prediction |
| 23 | [111] Henriques et al., 2020 | Combining k-means and XGBoost models for anomaly detection using log datasets | MDPI, Electronics | Anomaly in project, not engineered system |
| 24 | [112] Gorzałczany et al., 2020 | A modern data-mining approach based on genetically optimized fuzzy systems for interpretable and accurate smart-grid stability prediction | MDPI, Energies | Electrical grid demand stability in financial perspective |
| 25 | [113] Müller et al., 2020 | Data or interpretations impacts of information presentation strategies on diagnostic processes | Wiley, Human Factors and Ergonomics in Manufacturing and Service Industries | Experiment with operator effectivity following quality of interpretability |
| 26 | [114] Shriram et al., 2020 | Least squares sparse principal component analysis and parallel coordinates for real-time process monitoring | ACS, Industrial and Engineering Chemistry Research | Process monitoring and diagnosis |
| 27 | [115] Alshraideh et al., 2020 | Process control via random forest classification of profile signals: an application to a tapping process | Elsevier, Journal of Manufacturing Processes | Process monitoring and anomaly detection |
| 28 | [116] Minghua et al., 2020 | Diagnosing root causes of intermittent slow queries in cloud databases | ACM, Proceedings of the VLDB Endowment | Diagnosing slow query due to lack of resources, not failure |
| 29 | [117] Shaha et al., 2020 | Performance prediction and interpretation of a refuse plastic fuel fired boiler | IEEE, IEEE Access | Performance prediction |
| 30 | [118] Kovalev et al., 2020 | SurvLIME: a method for explaining machine learning survival models | Elsevier, Knowledge-Based Systems | Medical survival model |
| 31 | [119] Kovalev et al., 2020 | A robust algorithm for explaining unreliable machine learning survival models using the Kolmogorov.Smirnov bounds | Elsevier, Neural Networks | Medical survival model |
| 32 | [120] Karn et al., 2021 | Cryptomining detection in container clouds using system calls and explainable machine learning | IEEE, IEEE Transactions on Parallel and Distributed Systems | Network attack |
| 33 | [121] Gyula et al., 2021 | Decision trees for informative process alarm definition and alarm-based fault classification | Elsevier, Process Safety and Environmental Protection | Process monitoring and anomaly detection |
| 34 | [122] Zaman et al., 2021 | Fuzzy heuristics and decision tree for classification of statistical feature-based control chart patterns | MDPI, Symmetry | Process monitoring and diagnosis |
| 35 | [123] Li et al., 2021 | DTDR-ALSTM: Extracting dynamic time-delays to reconstruct multivariate data for improving attention-based LSTM industrial time series prediction models | Elsevier, Knowledge-Based Systems | Process monitoring and variable prediction |
| Database and Date | Number of Extracted Papers | Search Field and Keywords | Filters Applied |
|---|---|---|---|
| IEEE Xplore 18/02/21 | 144 | Using ‘Document Title’:
| Journals, Early Access Article, Specify Year Range: 2015–2021 |
| Science Direct 17/02/21 | 607 | Using ‘Title, abstract or author-specified keywords’:
| Article type: Research Articles, Subject areas: Engineering and Computer Science, Years: 2015–2021 |
| Springer Link 22/02/21 | 291 | Using ‘With all the words’:
| Content Type: Article, Discipline: Computer Science or Engineering, Language: English, Show documents published: 2015–2021 |
| ACM Digital Library 28/05/21 | 75 | Using ‘Publication Title, Abstract and Keywords’:
| Publications: Journal, Content Type: Research Article, Publication Date: 2015–2021 |
| Scopus 27/02/21 | 1931 |
| Limited to: Article, Publication stage: Final, Subject Area: Engineering and Comput Science, Language: English, Exclude: Medical, Published from: 2015–2021 |
| Value | <50% | 50–75% | 75–90% | 90–100% | |
|---|---|---|---|---|---|
| Metric | |||||
| Accuracy | Bad | Fair | Good | Very good | |
| Precision | Bad | Fair | Good | Very good | |
| Value | 0.00–0.20 | 0.21–0.40 | 0.41–0.6 | 0.61–1.00 | |
| Metric | |||||
| F1 | Bad | Fair | Good | Very good | |
| AUC | Bad | Fair | Good | Very good | |
| PRAUC | Bad | Fair | Good | Very good | |
| Kappa | Bad | Fair | Good | Very good | |
References
- Stone, P.; Brooks, R.; Brynjolfsson, E.; Calo, R.; Etzioni, O.; Hager, G.; Hirschberg, J.; Kalyanakrishnan, S.; Kamar, E.; Kraus, S.; et al. Artificial Intelligence and Life in 2030. One Hundred Year Study on Artificial Intelligence: Report of the 2015–2016 Study Panel; Stanford University: Stanford, CA, USA, 2016; Available online: ai100.stanford.edu/2016-report (accessed on 6 September 2016).
- Aykroyd, R.; Leiva, V.; Ruggeri, F. Recent developments of control charts, identification of big data sources and future trends of current research. Technol. Forecast. Soc. Chang. 2019, 144, 221–232. [Google Scholar] [CrossRef]
- Bughin, J.; Hazan, E.; Ramaswamy, S.; Chui, M.; Allas, T.; Dahlstrom, P.; Henke, N.; Trench, M. Artificial Intelligence: The Next Digital Frontier? McKinsey and Company: Chicago, IL, USA, 2017; pp. 1–80. Available online: apo.org.au/node/210501 (accessed on 24 August 2021).
- The International Telecommunication Union. Assessing the Economic Impact of Artificial Intelligence, Artificial Intelligence in Service of Business: Creating a Competitive Advantage. St. Petersburg International Economic Forum. 2018. Available online: handle.itu.int/11.1002/pub/81202956-en (accessed on 5 October 2021).
- Ernst, E.; Merola, R.; Samaan, D. The economics of artificial intelligence: Implications for the future of work. ILO 2018, 9, 1–35. [Google Scholar] [CrossRef] [Green Version]
- Rigla, M.; García-Sáez, G.; Pons, B.; Hernando, M.E. Artificial intelligence methodologies and their application to diabetes. J. Diabetes Sci. Technol. 2018, 12, 303–310. [Google Scholar] [CrossRef]
- Xin, Z.; Wang, D. Application of artificial intelligence algorithms in image processing. J. Vis. Commun. Image Represent. 2019, 61, 42–49. [Google Scholar]
- Palacios, C.A.; Reyes-Suarez, J.A.; Bearzotti, L.A.; Leiva, V.; Marchant, C. Knowledge discovery for higher education student retention based on data mining: Machine learning algorithms and case study in Chile. Entropy 2021, 23, 485. [Google Scholar] [CrossRef]
- Bustos, N.; Tello, M.; Droppelmann, G.; Garcia, N.; Feijoo, F.; Leiva, V. Machine learning techniques as an efficient alternative diagnostic tool for COVID-19 cases. Signa Vitae 2022, in press. [Google Scholar] [CrossRef]
- Mahdi, E.; Leiva, V.; Mara’Beh, S.; Martin, C. A new approach to predicting cryptocurrency returns based on the gold prices with support vector machines during the COVID-19 pandemic using sensor-related data. Sensors 2021, 21, 6319. [Google Scholar] [CrossRef]
- Xu, Z.; Saleh, J. Machine learning for reliability engineering and safety applications: Review of current status and future opportunities. arXiv 2020, arXiv:2008.08221. [Google Scholar] [CrossRef]
- Doumari, S.A.; Givi, H.; Dehghani, M.; Montazeri, Z.; Leiva, V.; Guerrero, J.M. A new two-stage algorithm for solving optimization problems. Entropy 2021, 23, 491. [Google Scholar] [CrossRef]
- Voulodimos ADoulamis, N.; Doulamis, A.; Protopapadakis, E. Deep learning for computer vision: A brief review. Comput. Intell. Neurosci. 2018, 2018, 7068349. [Google Scholar] [CrossRef]
- Linardatos, P.; Papastefanopoulos, V.; Kotsiantis, S. Explainable AI: A review of machine learning interpretability methods. Entropy 2021, 23, 18. [Google Scholar] [CrossRef] [PubMed]
- Zhang, S.; Zhang, S.; Wang, B.; Habetler, T.G. Deep learning algorithms for bearing fault diagnostics: A comprehensive review. IEEE Access 2020, 8, 29857–29881. [Google Scholar] [CrossRef]
- Lu, S.; Chai, H.; Sahoo, A.; Phung, B.T. Condition monitoring based on partial discharge diagnostics using machine learning methods: A comprehensive state-of-the-art review. IEEE Trans. Dielectr. Electr. Insul. 2020, 27, 1861–1888. [Google Scholar] [CrossRef]
- Ellefsen, A.L.; Asøy, V.; Ushakov, S.; Zhang, H. A comprehensive survey of prognostics and health management based on deep learning for autonomous ships. IEEE Trans. Reliab. 2019, 68, 720–740. [Google Scholar] [CrossRef] [Green Version]
- Sheppard, J.W.; Kaufman, M.A.; Wilmer, T.J. IEEE standards for prognostics and health management. IEEE Aerosp. Electron. Syst. Mag. 2019, 24, 34–41. [Google Scholar] [CrossRef] [Green Version]
- Zhou, J.; Zheng, L.; Wang, Y.; Gogu, C. A Multistage deep transfer learning method for machinery fault diagnostics across diverse working conditions and devices. IEEE Access 2020, 8, 80879–80898. [Google Scholar] [CrossRef]
- Khan, S.; Yairi, T. A review on the application of deep learning in system health management. Mech. Syst. Signal Process. 2018, 107, 241–265. [Google Scholar] [CrossRef]
- Aydemir, G.; Paynabar, K. Image-based prognostics using deep learning approach. IEEE Trans. Ind. Inform. 2020, 16, 5956–5964. [Google Scholar] [CrossRef]
- Costello, J.J.A.; West, G.M.; McArthur, S.D.J. Machine learning model for event-based prognostics in gas circulator condition monitoring. IEEE Trans. Reliab. 2017, 66, 1048–1057. [Google Scholar] [CrossRef] [Green Version]
- Yang, C.; Gunay, B.; Shi, Z.; Shen, W. Machine learning-based prognostics for central heating and cooling plant equipment health monitoring. IEEE Trans. Autom. Sci. Eng. 2021, 18, 346–355. [Google Scholar] [CrossRef]
- Sayani, J.K.S.; Lal, B.; Pedapati, S.R. Comprehensive review on various gas hydrate modelling techniques: Prospects and challenges. Arch. Comput. Methods Eng. 2021, in press. [Google Scholar] [CrossRef]
- Fan, K.; Hsu, C.; Tsai, D.; He, F.; Cheng, C. Data-driven approach for fault detection and diagnostic in semiconductor manufacturing. IEEE Trans. Autom. Sci. Eng. 2020, 17, 1925–1936. [Google Scholar] [CrossRef]
- Li, X.; Zhang, W.; Xu, N.; Ding, Q. Deep learning-based machinery fault diagnostics with domain adaptation across sensors at different places. IEEE Trans. Ind. Electron. 2020, 67, 6785–6794. [Google Scholar] [CrossRef]
- Yang, Q.; Jia, X.; Li, X.; Feng, J.; Li, W.; Lee, J. Evaluating feature selection and anomaly detection methods of hard drive failure prediction. IEEE Trans. Reliab. 2021, 70, 749–760. [Google Scholar] [CrossRef]
- Tosun, A.B.; Pullara, F.; Becich, M.J.; Taylor, D.L.; Fine, J.L.; Chennubhotla, S.C. Explainable AI (XAI) for anatomic pathology. Adv. Anat. Pathol. 2020, 27, 241–250. [Google Scholar] [CrossRef] [PubMed]
- Taylor, J.E.T.; Taylor, G.W. Artificial cognition: How experimental psychology can help generate explainable artificial intelligence. Psychon. Bull. Rev. 2021, 28, 454–475. [Google Scholar] [CrossRef]
- Markus, A.; Kors, J.; Rijnbeek, P. The role of explainability in creating trustworthy artificial intelligence for health care: A comprehensive survey of the terminology, design choices, and evaluation strategies. arXiv 2020, arXiv:2007.15911. [Google Scholar] [CrossRef]
- Jiménez-Luna, J.; Grisoni, F.; Schneider, G. Drug discovery with explainable artificial intelligence. Nat. Mach. Intell. 2020, 2, 573–584. [Google Scholar] [CrossRef]
- Barredo, A.; Díaz, N.; Del Ser, J.; Bennetot, A.; Tabik, S.; Barbado, A.; Garcia, S.; Gil-Lopez, S.; Molina, D.; Benjamins, R.; et al. Explainable artificial intelligence (XAI): Concepts, taxonomies, opportunities and challenges toward responsible AI. Inf. Fusion 2020, 58, 82–115. [Google Scholar] [CrossRef] [Green Version]
- Payrovnaziri, S.N.; Chen, Z.; Rengifo-Moreno, P.; Miller, T.; Bian, J.; Chen, J.H.; Liu, X.; He, Z. Explainable artificial intelligence models using real-world electronic health record data: A systematic scoping review. J. Am. Med. Inform. Assoc. 2020, 27, 1173–1185. [Google Scholar] [CrossRef]
- Stepin, I.; Alonso, J.; Catala, A.; Pereira-Farina, M. A survey of contrastive and counterfactual explanation generation methods for explainable artificial intelligence. IEEE Access 2021, 9, 11974–12001. [Google Scholar] [CrossRef]
- Bussmann, N.; Giudici, P.; Marinelli, D.; Papenbrock, J. Explainable AI in fintech risk management. Front. Artif. Intell. 2020, 3, 26. [Google Scholar] [CrossRef] [PubMed]
- Tjoa, E.; Guan, C. A survey on explainable artificial intelligence (XAI): Toward medical XAI. IEEE Trans. Neural Netw. Learn. Syst. 2021, 32, 4793–4813. [Google Scholar] [CrossRef]
- Streich, J.; Romero, J.; Gazolla, J.; Kainer, D.; Cliff, A.; Prates, E.; Brown, J.B.; Khoury, S.; Tuskan, G.A.; Garvin, M.; et al. Can exascale computing and explainable artificial intelligence applied to plant biology deliver on the United Nations sustainable development goals? Curr. Opin. Biotechnol. 2020, 61, 217–225. [Google Scholar] [CrossRef] [PubMed]
- Adadi, A.; Berrada, M. Peeking inside the black-box: A survey on explainable artificial intelligence (XAI). IEEE Access 2018, 6, 52138–52160. [Google Scholar] [CrossRef]
- Chen, K.; Hwu, T.; Kashyap, H.J.; Krichmar, J.L.; Stewart, K.; Xing, J.; Zou, X. Neurorobots as a means toward neuroethology and explainable AI. Front. Neurorobot. 2020, 14, 570308. [Google Scholar] [CrossRef] [PubMed]
- Xu, F.; Uszkoreit, H.; Du, Y.; Fan, W.; Zhao, D.; Zhu, J. Explainable AI: A brief survey on history, research areas, approaches and challenges. In Natural Language Processing and Chinese Computing. NLPCC 2019; Tang, J., Kan, M.Y., Zhao, D., Li, S., Zan, H., Eds.; Springer: Cham, Switzerland, 2019; Volume 11839, pp. 563–574. [Google Scholar]
- Molnar, C. Interpretable Machine Learning. A Guide for Making Black Box Models Explainable. 2019. Available online: https://christophm.github.io/interpretable-ml-book/ (accessed on 17 October 2021).
- Gianfagna, L.; Di Cecco, A. Model-agnostic methods for XAI. In Explainable AI with Python; Springer: Cham, Switzerland, 2021. [Google Scholar] [CrossRef]
- Page, M.J.; McKenzie, J.E.; Bossuyt, P.M.; Boutron, I.; Hoffmann, T.C.; Mulrow, C.D.; Shamseer, L.; Tetzlaff, J.M.; Akl, E.A.; Brennan, S.E.; et al. The PRISMA 2020 statement: An updated guideline for reporting systematic reviews. PLoS Med. 2021, 18, e1003583. [Google Scholar] [CrossRef] [PubMed]
- Xing, M.; Yan, X.; Sun, X.; Wang, S.; Zhou, M.; Zhu, B.; Kuai, L.; Liu, L.; Luo, Y.; Li, X.; et al. Fire needle therapy for moderate-severe acne: A PRISMA systematic review and meta-analysis of randomized controlled trials. Complement. Ther. Med. 2019, 44, 253–260. [Google Scholar] [CrossRef]
- Li, T.; Hua, F.; Dan, S.; Zhong, Y.; Levey, C.; Song, Y. Reporting quality of systematic review abstracts in operative dentistry: An assessment using the PRISMA for Abstracts guidelines. J. Dent. 2020, 102, 103471. [Google Scholar] [CrossRef] [PubMed]
- Lundberg, S.M.; Erion, G.; Chen, H.; DeGrave, A.; Prutkin, J.M.; Nair, B.; Katz, R.; Himmelfarb, J.; Bansal, N.; Lee, S.-I. From local explanations to global understanding with explainable AI for trees. Nat. Mach. Intell. 2020, 2, 56–67. [Google Scholar] [CrossRef]
- Verweij, G.; Rao, A.; Woods, J. Sizing the Prize: What’s the Real Value of AI for Your Business and How Can You Capitalise? Available online: www.pwc.com/AI (accessed on 21 June 2017).
- Brock, D.C. Learning from artificial intelligence’s previous awakenings: The history of expert systems. AI Mag. 2018, 39, 3–15. [Google Scholar] [CrossRef] [Green Version]
- Itti, L.; Koch, C.; Niebur, E. A model of saliency-based visual attention for rapid scene analysis. IEEE Trans. Pattern Anal. Mach. Intell. 2002, 20, 1254–1259. [Google Scholar] [CrossRef] [Green Version]
- Kamal, A.; Pedapati, S.R.; Muhammad, M. Reliability engineering applications in electronic, software, nuclear and aerospace industries: A 20 year review (2000–2020). Ain Shams Eng. J. 2021, 12, 3009–3019. [Google Scholar]
- Zhou, J.; Gandomi, A.H.; Chen, F.; Holzinger, A. Evaluating the quality of machine learning explanations: A survey on methods and metrics. Electronics 2021, 10, 593. [Google Scholar] [CrossRef]
- Martin, K.; Liret, A.; Wiratunga, N.; Owusu, G.; Kern, M. Evaluating explainability methods intended for multiple stakeholders. Künstliche Intell. 2021, 35, 397–411. [Google Scholar] [CrossRef]
- Holzinger, A.; Carrington, A.; Müller, H. Measuring the quality of explanations: The system causability scale (SCS). Künstliche Intell. 2020, 34, 193–198. [Google Scholar] [CrossRef] [Green Version]
- Wong, S.Y.; Yap, K.S.; Yap, H.J.; Tan, S.C.; Chang, S.W. On equivalence of FIS and ELM for interpretable rule-based knowledge representation. IEEE Trans. Neural Netw. Learn. Syst. 2015, 26, 1417–1430. [Google Scholar] [CrossRef]
- Wu, Z.; Luo, H.; Yang, Y.; Lv, P.; Zhu, X.; Ji, Y.; Wu, B. K-PdM: KPI-oriented machinery deterioration estimation framework for predictive maintenance using cluster-based hidden Markov model. IEEE Access 2018, 6, 41676–41687. [Google Scholar] [CrossRef]
- Pacella, M. Unsupervised classification of multichannel profile data using PCA: An application to an emission control system. Comput. Ind. Eng. 2018, 122, 161–169. [Google Scholar] [CrossRef]
- Kraus, M.; Feuerriegel, S. Forecasting remaining useful life: Interpretable deep learning approach via variational Bayesian inferences. Decis. Support Syst. 2019, 125, 113100. [Google Scholar] [CrossRef]
- Djelloul, I.; Sari, Z.; Souier, M. Fault isolation in manufacturing systems based on learning algorithm and fuzzy rule selection. Neural Comput. Appl. 2019, 31, 3211–3225. [Google Scholar] [CrossRef]
- Waghen, K.; Ouali, M.S. Interpretable logic tree analysis: A data-driven fault tree methodology for causality analysis. Expert Syst. Appl. 2019, 136, 376–391. [Google Scholar] [CrossRef]
- Rajendran, S.; Meert, W.; Lenders, V.; Pollin, S. Unsupervised wireless spectrum anomaly detection with interpretable features. IEEE Trans. Cogn. Commun. Netw. 2019, 5, 637–647. [Google Scholar] [CrossRef]
- Wang, J.; Bao, W.; Zheng, L.; Zhu, X.; Yu, P.S. An attention-augmented deep architecture for hard drive status monitoring in large-scale storage systems. ACM Trans. Storage 2019, 15, 21. [Google Scholar] [CrossRef]
- Le, D.; Vung, P.; Nguyen, H.; Dang, T. Visualization and explainable machine learning for efficient. Manuf. Syst. Oper. 2019, 3, 20190029. [Google Scholar]
- Langone, R.; Cuzzocrea, A.; Skantzos, N. Interpretable anomaly prediction: Predicting anomalous behavior in industry 4.0 settings via regularized logistic regression tools. Data Knowl. Eng. 2020, 130, 101850. [Google Scholar] [CrossRef]
- Ding, P.; Jia, M.; Wang, H. A dynamic structure-adaptive symbolic approach for slewing bearings’ life prediction under variable working conditions. Struct. Health Monit. 2020, 20, 273–302. [Google Scholar] [CrossRef]
- Ritto, T.G.; Rochinha, F. Digital twin, physics-based model, and machine learning applied to damage detection in structures. Mech. Syst. Signal Process. 2021, 155, 107614. [Google Scholar] [CrossRef]
- Rea, C.; Montes, K.; Pau, A.; Granetz, R.; Sauter, O. Progress toward interpretable machine learning-based disruption predictors across tokamaks progress toward interpretable machine learning-based disruption predictors across tokamaks. Fusion Sci. Technol. 2020, 76, 912–924. [Google Scholar] [CrossRef]
- Murari, A.; Peluso, E.; Lungaroni, M.; Rossi, R.; Gelfusa, M. Investigating the physics of tokamak global stability with interpretable machine learning tools. Appl. Sci. 2020, 10, 6683. [Google Scholar] [CrossRef]
- Zhou, D.; Yao, Q.; Wu, H.; Ma, S.; Zhang, H. Fault diagnosis of gas turbine based on partly interpretable convolutional neural networks. Energy 2020, 200, 117467. [Google Scholar] [CrossRef]
- Zhou, Y.; Hong, S.; Shang, J.; Wu, M.; Wang, Q.; Li, H.; Xie, J. Addressing noise and skewness in interpretable health-condition assessment by learning model confidence. Sensors 2020, 20, 7307. [Google Scholar] [CrossRef]
- Yu, J.; Liu, G. Knowledge extraction and insertion to deep belief network for gearbox fault diagnosis. Knowl. Based Syst. 2020, 197, 105883. [Google Scholar] [CrossRef]
- Conde, D.; Fernández, M.A.; Rueda, C.; Salvador, B. Isotonic boosting classification rules. Adv. Data Anal. Classif. 2021, 15, 289–313. [Google Scholar] [CrossRef]
- Alfeo, A.L.; Cimino, M.G.C.A.; Manco, G.; Ritacco, E.; Vaglini, G. Using an autoencoder in the design of an anomaly detector for smart manufacturing. Pattern Recognit. Lett. 2020, 136, 272–278. [Google Scholar] [CrossRef]
- Abid, F.B.; Sallem, M.; Braham, A. Robust interpretable deep learning for intelligent fault diagnosis of induction motors. IEEE Trans. Instrum. Meas. 2020, 69, 3506–3515. [Google Scholar] [CrossRef]
- Liu, C.; Qin, C.; Shi, X.; Wang, Z.; Zhang, G.; Han, Y. TScatNet: An interpretable cross-domain intelligent diagnosis model with antinoise and few-shot learning capability. IEEE Trans. Instrum. Meas. 2021, 70, 3506110. [Google Scholar] [CrossRef]
- Li, T.; Zhao, Z.; Sun, C.; Chetng, L.; Chen, X.; Yan, R.; Gao, R.X. WaveletKernelNet: An interpretable deep neural network for industrial intelligent diagnosis. IEEE Trans. Syst. Man Cybern. Syst. 2021, in press. [Google Scholar] [CrossRef]
- Chen, H.Y.; Lee, C.H. Vibration signals analysis by explainable artificial intelligence (XAI) approach: Application on bearing faults diagnosis. IEEE Access 2020, 8, 134246–134256. [Google Scholar] [CrossRef]
- Sun, K.H.; Huh, H.; Tama, B.A.; Lee, S.Y.; Jung, J.H.; Lee, S. Vision-based fault diagnostics using explainable deep learning with class activation maps. IEEE Access 2020, 8, 129169–129179. [Google Scholar] [CrossRef]
- Oh, C.; Jeong, J. VODCA: Verification of diagnosis using cam-based approach for explainable process monitoring. Sensors 2020, 20, 6858. [Google Scholar] [CrossRef]
- Sundar, S.; Rajagopal, M.; Zhao, H.; Kuntumalla, G.; Meng, Y.; Chang, H.; Shao, C.; Ferreira, P.; Miljkovic, N.; Sinha, S.; et al. Fouling modeling and prediction approach for heat exchangers using deep learning. Int. J. Heat Mass Transf. 2020, 159, 120112. [Google Scholar] [CrossRef]
- Hong, C.W.; Lee, C.; Lee, K.; Ko, M.S.; Kim, D.E.; Hur, K. Remaining useful life prognosis for turbofan engine using explainable deep neural networks with dimensionality reduction. Sensors 2020, 20, 6626. [Google Scholar] [CrossRef]
- Grezmak, J.; Zhang, J.; Wang, P.; Loparo, K.A.; Gao, R.X. Interpretable convolutional neural network through layer-wise relevance propagation for machine fault diagnosis. IEEE Sens. J. 2020, 20, 3172–3181. [Google Scholar] [CrossRef]
- Ming, Y.; Xu, P.; Cheng, F.; Qu, H.; Ren, L. ProtoSteer: Steering deep sequence model with prototypes. IEEE Trans. Vis. Comput. Graph. 2020, 26, 238–248. [Google Scholar] [CrossRef]
- Chen, G.; Liu, M.; Chen, J. Frequency-temporal-logic-based bearing fault diagnosis and fault interpretation using Bayesian optimization with Bayesian neural networks. Mech. Syst. Signal Process. 2020, 145, 106951. [Google Scholar] [CrossRef]
- Steenwinckel, B.; De Paepe, D.; Vanden Hautte, S.; Heyvaert, P.; Bentefrit, M.; Moens, P.; Dimou, A.; Bossche, B.V.D.; De Turck, F.; Van Hoecke, S.; et al. FLAGS: A methodology for adaptive anomaly detection and root cause analysis on sensor data streams by fusing expert knowledge with machine learning. Future Gener. Comput. Syst. 2021, 116, 30–48. [Google Scholar] [CrossRef]
- Zhang, D.; Chen, Y.; Guo, F.; Karimi, H.R.; Dong, H.; Xuan, Q. A new interpretable learning method for fault diagnosis of rolling bearings. IEEE Trans. Instrum. Meas. 2021, 70, 3507010. [Google Scholar] [CrossRef]
- Onchis, D.; Gillich, G. Stable and explainable deep learning damage prediction for prismatic cantilever steel beam. Comput. Ind. 2021, 125, 103359. [Google Scholar] [CrossRef]
- Kim, M.S.; Yun, J.P.; Park, P. an explainable convolutional neural network for fault diagnosis in linear motion guide. IEEE Trans. Ind. Inform. 2021, 17, 4036–4045. [Google Scholar] [CrossRef]
- Ding, P.; Jia, M.; Yan, X. Stationary subspaces-vector autoregressive with exogenous terms methodology for degradation trend estimation of rolling and slewing bearings. Mech. Syst. Signal Process. 2021, 150, 107293. [Google Scholar] [CrossRef]
- Kumar, D.; Bezdek, J.; Rajasegarar, S.; Palaniswami, M.; Leckie, C.; Chan, J.; Gubbi, J. Adaptive cluster tendency visualization and anomaly detection for streaming data. ACM Trans. Knowl. Discov. Data 2016, 11, 24. [Google Scholar] [CrossRef]
- Bao, S.; Luo, L.; Mao, J. Improved fault detection and diagnosis using sparse global-local preserving projections. J. Process Control 2016, 47, 121–135. [Google Scholar] [CrossRef]
- Kozjek, D.; Vrabič, R.; Kralj, D.; Butala, P. Interpretative identification of the faulty conditions in a cyclic manufacturing process. J. Manuf. Syst. 2017, 43, 214–224. [Google Scholar] [CrossRef] [Green Version]
- Ragab, A.; Koujok, M.; Poulin, B.; Amazouz, M.; Yacout, S. Fault diagnosis in industrial chemical processes using interpretable patterns based on logical analysis of data. Expert Syst. Appl. 2017, 95, 368–383. [Google Scholar] [CrossRef]
- Tang, Q.; Chai, Y.; Qu, J.; Ren, H. Fisher discriminative sparse representation based on DBN for fault diagnosis of complex system. Appl. Sci. 2018, 8, 795. [Google Scholar] [CrossRef] [Green Version]
- Luo, L.; Bao, S. Knowledge-data-integrated sparse modeling for batch process monitoring. Chem. Eng. Sci. 2018, 189, 221–232. [Google Scholar] [CrossRef]
- Puggini, L.; Mcloone, S. An enhanced variable selection and isolation forest based methodology for anomaly detection with OES data. Eng. Appl. Artif. Intell. 2018, 67, 126–135. [Google Scholar] [CrossRef] [Green Version]
- Cheng, T.; Harrou, F.; Sun, Y.; Leiknes, T. Monitoring influent measurements at water resource recovery facility using data-driven soft sensor approach. IEEE Sens. J. 2019, 19, 42–352. [Google Scholar] [CrossRef] [Green Version]
- Zhang, C.; Yan, H.; Lee, S.; Shi, J. Weakly correlated profile monitoring based on sparse multi-channel functional principal component analysis. IISE Trans. 2018, 50, 878–891. [Google Scholar] [CrossRef]
- Luo, L.; Bao, S.; Mao, J.; Ding, Z. Industrial process monitoring based on knowledge-data integrated sparse model and two-level deviation magnitude plots. Ind. Eng. Chem. Res. 2018, 57, 611–622. [Google Scholar] [CrossRef]
- Vojíř, S.; Zeman, V.; Kuchař, J.; Kliegr, T. EasyMiner.eu: Web framework for interpretable machine learning based on rules and frequent itemsets. Knowl. Based Syst. 2018, 150, 111–115. [Google Scholar] [CrossRef]
- Du, J.; Zhang, X.; Shi, J. A condition change detection method for solar conversion efficiency in solar cell manufacturing processes. IEEE Trans. Semicond. Manuf. 2019, 32, 82–92. [Google Scholar] [CrossRef]
- Keneni, B.M.; Kaur, D.; Al Bataineh, A.; Devabhaktuni, V.K.; Javaid, A.Y.; Zaientz, J.D.; Marinier, R.P. Evolving rule-based explainable artificial intelligence for unmanned aerial vehicles. IEEE Access 2019, 7, 17001–17016. [Google Scholar] [CrossRef]
- Wang, K.; Shang, C.; Liu, L.; Jiang, Y.; Huang, D.; Yang, F. Dynamic soft sensor development based on convolutional neural networks. Ind. Eng. Chem. Res. 2019, 58, 11521–11531. [Google Scholar] [CrossRef]
- Wang, X.; Kvaal, K.; Ratnaweera, H. Explicit and interpretable nonlinear soft sensor models for influent surveillance at a full-scale wastewater treatment plant. J. Process Control 2019, 77, 1–6. [Google Scholar] [CrossRef]
- Liu, Y.; Zhai, M.; Jin, J.; Song, A.; Lin, J.; Wu, Z.; Zhao, Y. Intelligent online catastrophe assessment and preventive control via a stacked denoising autoencoder. Neurocomputing 2019, 380, 306–320. [Google Scholar] [CrossRef]
- Bukhsh, Z.; Saeed, A.; Stipanovic, I.; Dorée, A. Predictive maintenance using tree-based classification techniques: A case of railway switches. Transp. Res. Part C 2019, 101, 35–54. [Google Scholar] [CrossRef]
- Ragab, A.; El Koujok, M.; Ghezzaz, H.; Amazouz, M.; Ouali, M.; Yacout, S. Deep understanding in industrial processes by complementing human expertise with interpretable patterns of machine learning. Expert Syst. Appl. 2019, 122, 388–405. [Google Scholar] [CrossRef]
- Luo, L.; Bao, S.; Tong, C. Sparse robust principal component analysis with applications to fault detection and diagnosis. Ind. Eng. Chem. Res. 2019, 58, 1300–1309. [Google Scholar] [CrossRef]
- Yuan, J.; Zhang, S.; Wang, S.; Wang, F.; Zhao, L. Process abnormity identification by fuzzy logic rules and expert estimated thresholds derived certainty factor. Chemom. Intell. Lab. Syst. 2020, 209, 104232. [Google Scholar] [CrossRef]
- Sajedi, S.; Liang, X. Dual Bayesian inference for risk-informed vibration-based damage diagnosis. Comput. Aided Civ. Infrastruct. Eng. 2020, 36, 1168–1184. [Google Scholar] [CrossRef]
- Sun, W.; Braatz, R. ALVEN: Algebraic learning via elastic net for static and dynamic nonlinear model identification. Comput. Chem. Eng. 2020, 143, 107103. [Google Scholar] [CrossRef]
- Henriques, J.; Caldeira, F.; Cruz, T.; Simões, P. Combining k-means and XGBoost models for anomaly detection using log datasets. Electronics 2020, 9, 1164. [Google Scholar] [CrossRef]
- Gorzałczany, M.B.; Piekoszewski, J.; Rudziński, F. A modern data-mining approach based on genetically optimized fuzzy systems for interpretable and accurate smart-grid stability prediction. Energies 2020, 13, 2559. [Google Scholar] [CrossRef]
- Müller, R.; Gögel, C.; Bönsel, R. Data or interpretations: Impacts of information presentation strategies on diagnostic processes. Hum. Factors Ergon. Manuf. 2020, 30, 266–281. [Google Scholar] [CrossRef]
- Gajjar, S.; Kulahci, M.; Palazoglu, A. Least squares sparse principal component analysis and parallel coordinates for real-time process monitoring. Ind. Eng. Chem. Res. 2020, 59, 15656–15670. [Google Scholar] [CrossRef]
- Alshraideh, H.; del Castillo, E.; Gil Del Val, A. Process control via random forest classification of profile signals: An application to a tapping process. J. Manuf. Process. 2020, 58, 736–748. [Google Scholar] [CrossRef]
- Ma, M.; Yin, Z.; Zhang, S.; Wang, S.; Zheng, C.; Jiang, X.; Minghua, M.; Luo, C.; Li, Y.; Qiu, N.; et al. Diagnosing root causes of intermittent slow queries in cloud databases. Proc. VLDB Endow. 2020, 13, 1176–1189. [Google Scholar] [CrossRef]
- Shaha, P.; Singamsetti, M.S.; Tripathy, B.K.; Srivastava, G.; Bilal, M.; Nkenyereye, L. Performance prediction and interpretation of a refuse plastic fuel fired boiler. IEEE Access 2020, 8, 117467–117482. [Google Scholar] [CrossRef]
- Kovalev, M.S.; Utkin, L.V.; Kasimov, E.M. SurvLIME: A method for explaining machine learning survival models. Knowl. Based Syst. 2020, 203, 106164. [Google Scholar] [CrossRef]
- Kovalev, M.; Utkin, L. A robust algorithm for explaining unreliable machine learning survival models using the Kolmogorov-Smirnov bounds. arXiv 2020, arXiv:2005.02249. [Google Scholar]
- Karn, R.R.; Kudva, P.; Huang, H.; Suneja, S.; Elfadel, I.M. Cryptomining detection in container clouds using system calls and explainable machine learning. IEEE Trans. Parallel Distrib. Syst. 2021, 32, 674–691. [Google Scholar] [CrossRef]
- Dorgo, G.; Palazoglu, A.; Abonyi, J. Decision trees for informative process alarm definition and alarm-based fault classification. Process Saf. Environ. Prot. 2021, 149, 312–324. [Google Scholar] [CrossRef]
- Zaman, M.; Hassan, A. Fuzzy heuristics and decision tree for classification of statistical feature-based control chart patterns. Symmetry 2021, 13, 110. [Google Scholar] [CrossRef]
- Li, J.; Yang, B.; Li, H.; Wang, Y.; Qi, C.; Liu, Y. DTDR-ALSTM: Extracting dynamic time-delays to reconstruct multivariate data for improving attention-based LSTM industrial time series prediction models. Knowl. Based Syst. 2021, 211, 106508. [Google Scholar] [CrossRef]


Publisher’s Note: MDPI stays neutral with regard to jurisdictional claims in published maps and institutional affiliations. |
© 2021 by the authors. Licensee MDPI, Basel, Switzerland. This article is an open access article distributed under the terms and conditions of the Creative Commons Attribution (CC BY) license (https://creativecommons.org/licenses/by/4.0/).
Share and Cite
Nor, A.K.M.; Pedapati, S.R.; Muhammad, M.; Leiva, V. Overview of Explainable Artificial Intelligence for Prognostic and Health Management of Industrial Assets Based on Preferred Reporting Items for Systematic Reviews and Meta-Analyses. Sensors 2021, 21, 8020. https://doi.org/10.3390/s21238020
Nor AKM, Pedapati SR, Muhammad M, Leiva V. Overview of Explainable Artificial Intelligence for Prognostic and Health Management of Industrial Assets Based on Preferred Reporting Items for Systematic Reviews and Meta-Analyses. Sensors. 2021; 21(23):8020. https://doi.org/10.3390/s21238020
Chicago/Turabian StyleNor, Ahmad Kamal Mohd, Srinivasa Rao Pedapati, Masdi Muhammad, and Víctor Leiva. 2021. "Overview of Explainable Artificial Intelligence for Prognostic and Health Management of Industrial Assets Based on Preferred Reporting Items for Systematic Reviews and Meta-Analyses" Sensors 21, no. 23: 8020. https://doi.org/10.3390/s21238020
APA StyleNor, A. K. M., Pedapati, S. R., Muhammad, M., & Leiva, V. (2021). Overview of Explainable Artificial Intelligence for Prognostic and Health Management of Industrial Assets Based on Preferred Reporting Items for Systematic Reviews and Meta-Analyses. Sensors, 21(23), 8020. https://doi.org/10.3390/s21238020