
Quality Evaluation of Rock Mass Using RMR14 Based on Multi-Source Data Fusion


Abstract
:Highlights
1. Introduction
2. D-S Evidence Theory
2.1. Description of D-S Evidence Theory
2.2. Combination Rule of D-S Theory
2.3. Measurement for Basic Probability Assignment
2.4. Measurement for Belief Reinforcement
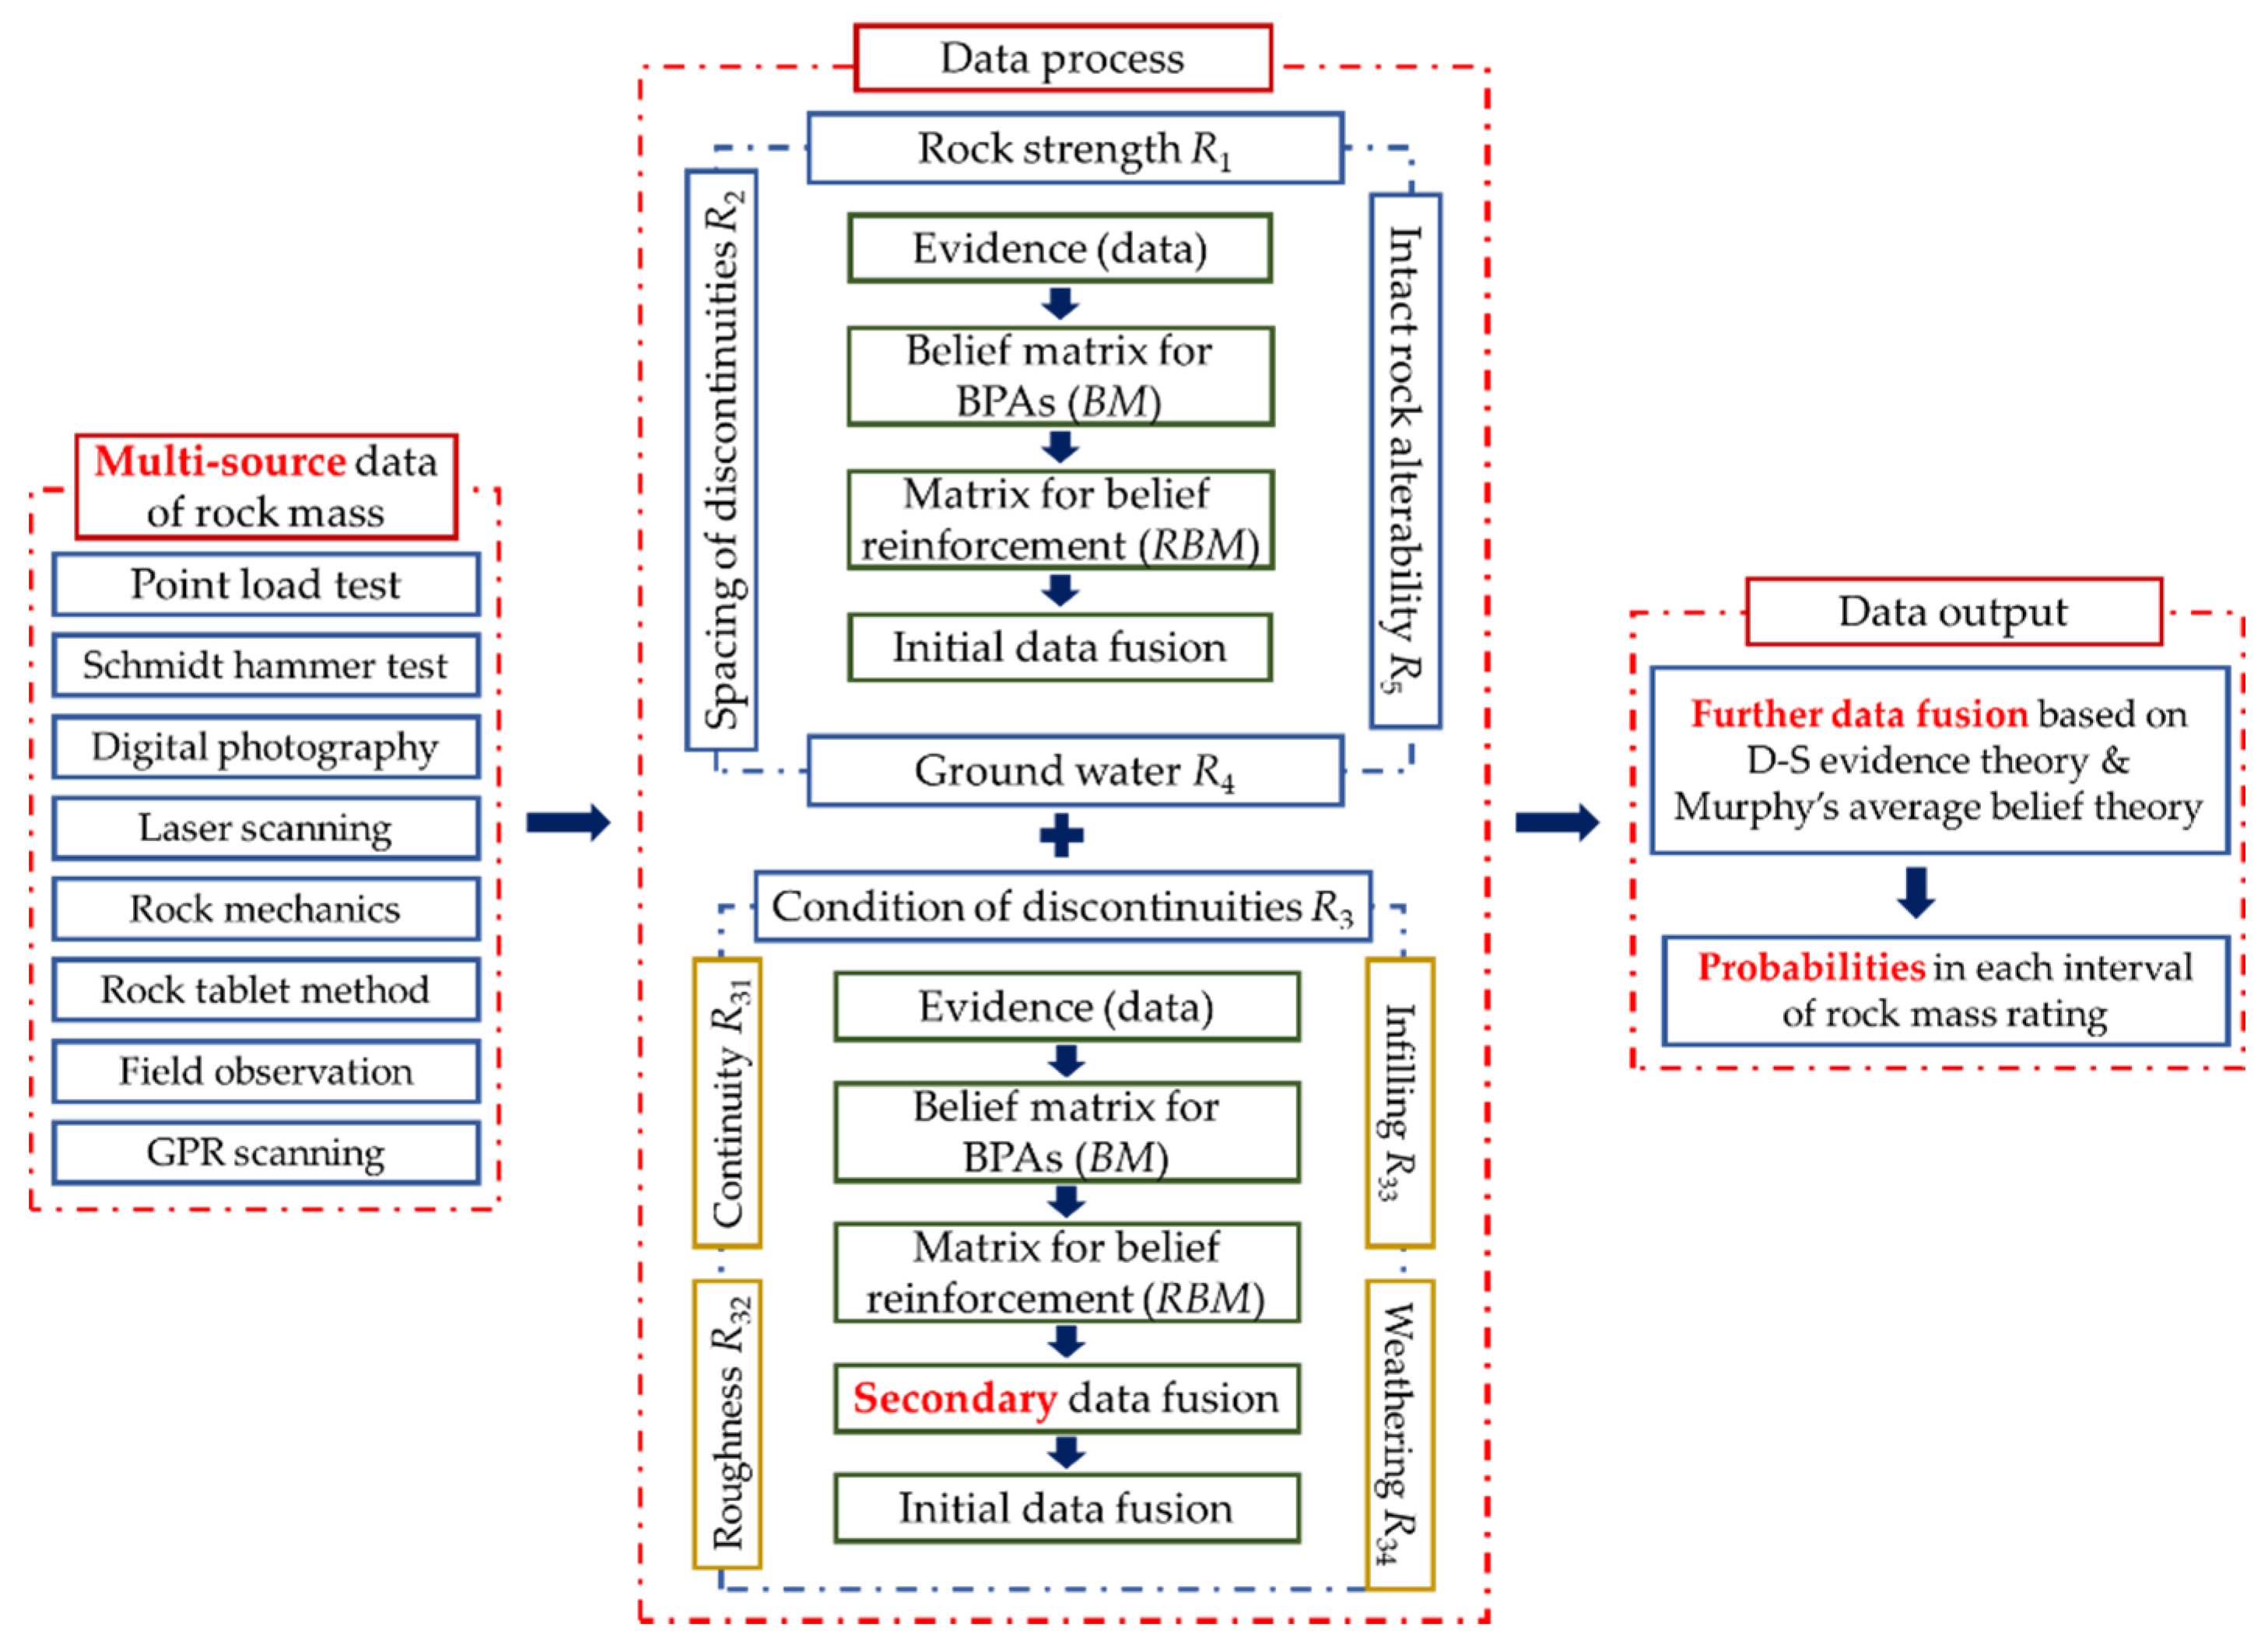
3. A Method for Quality Evaluation of Rock Mass with Multi-Source Data
3.1. Description
3.2. Process Steps
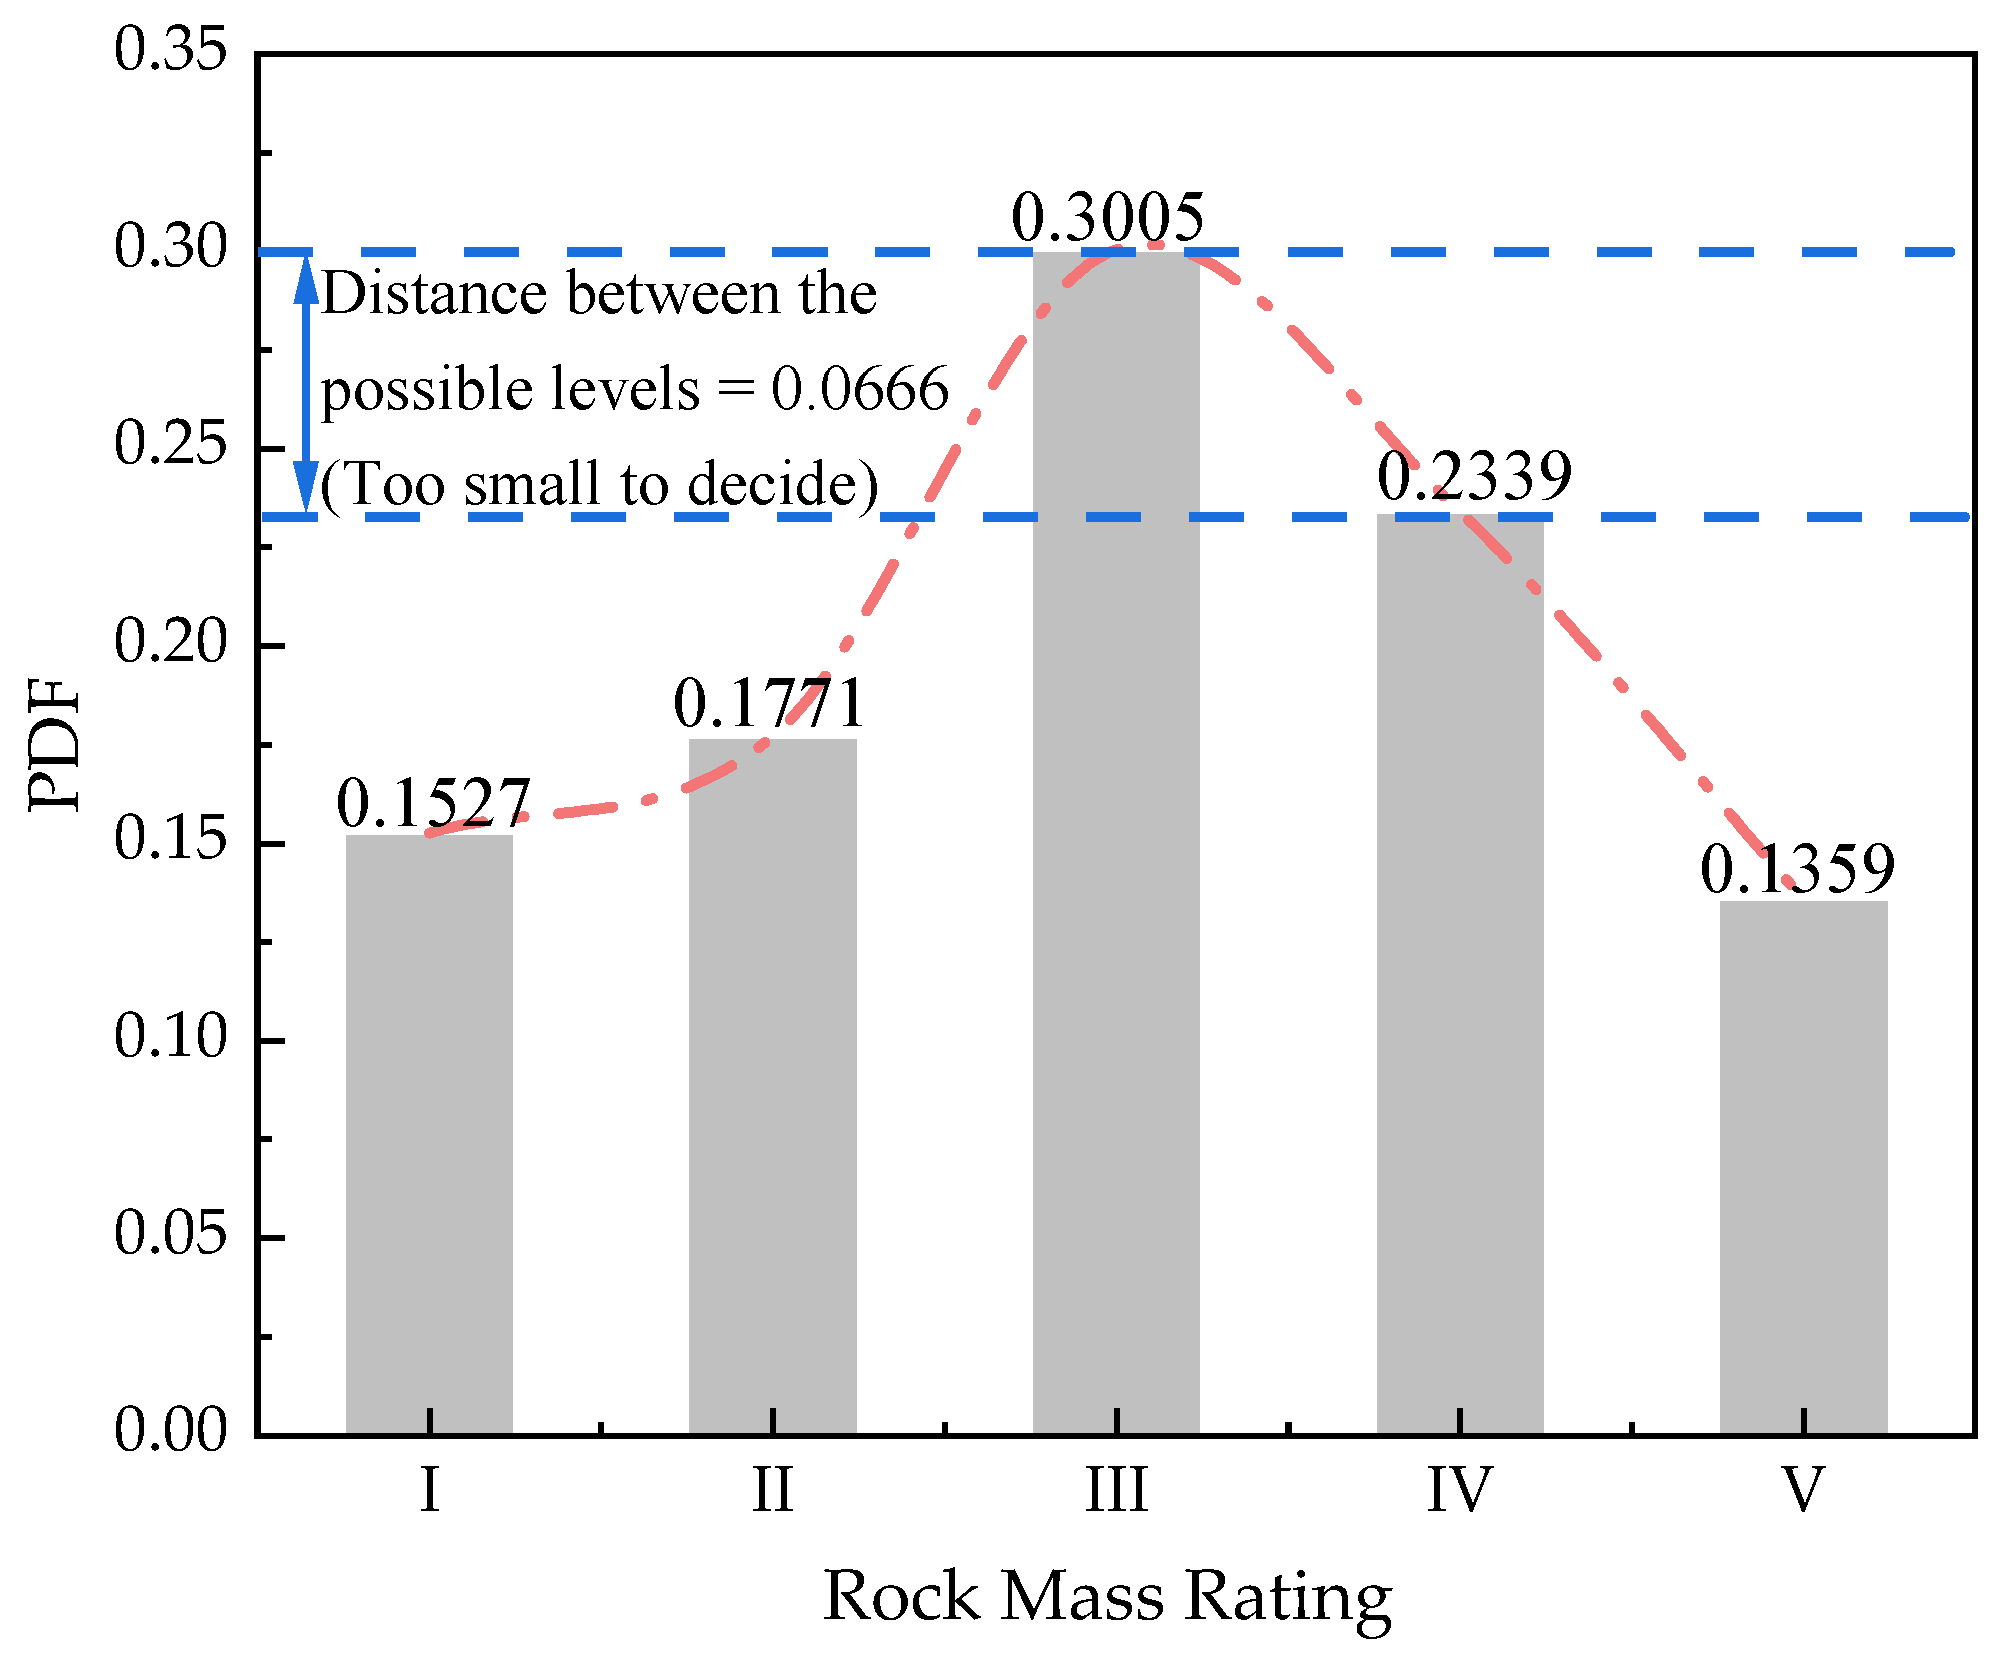
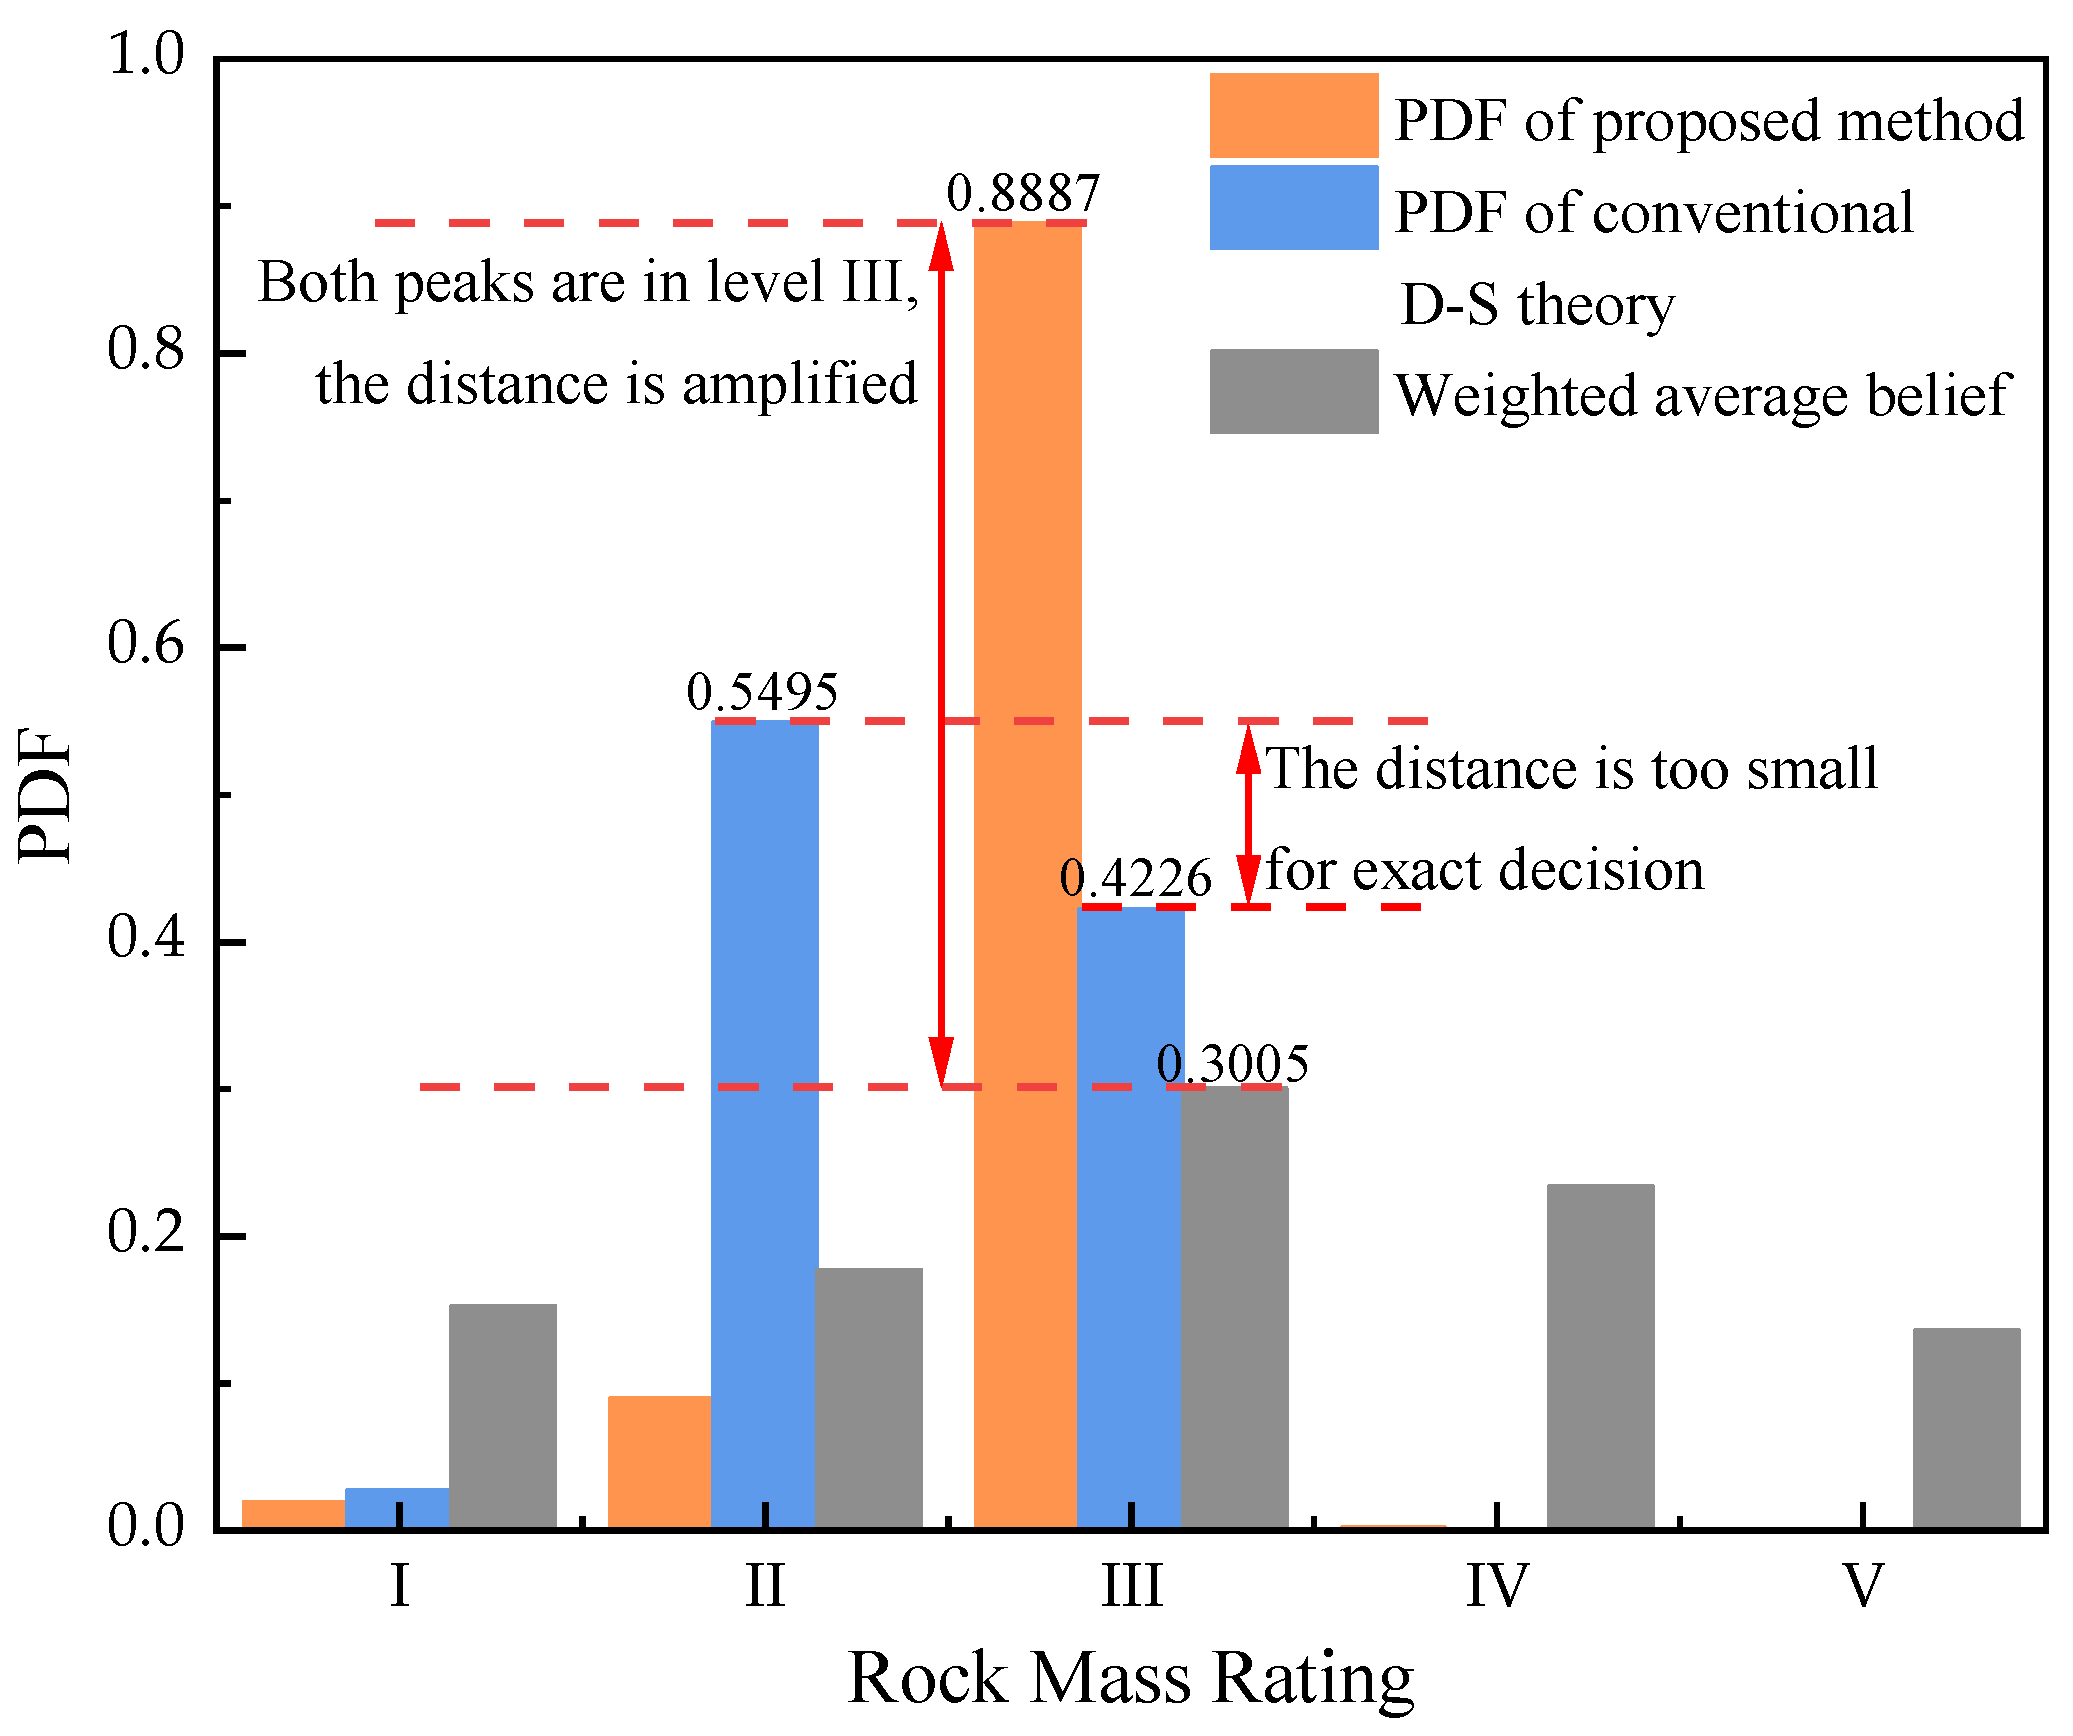
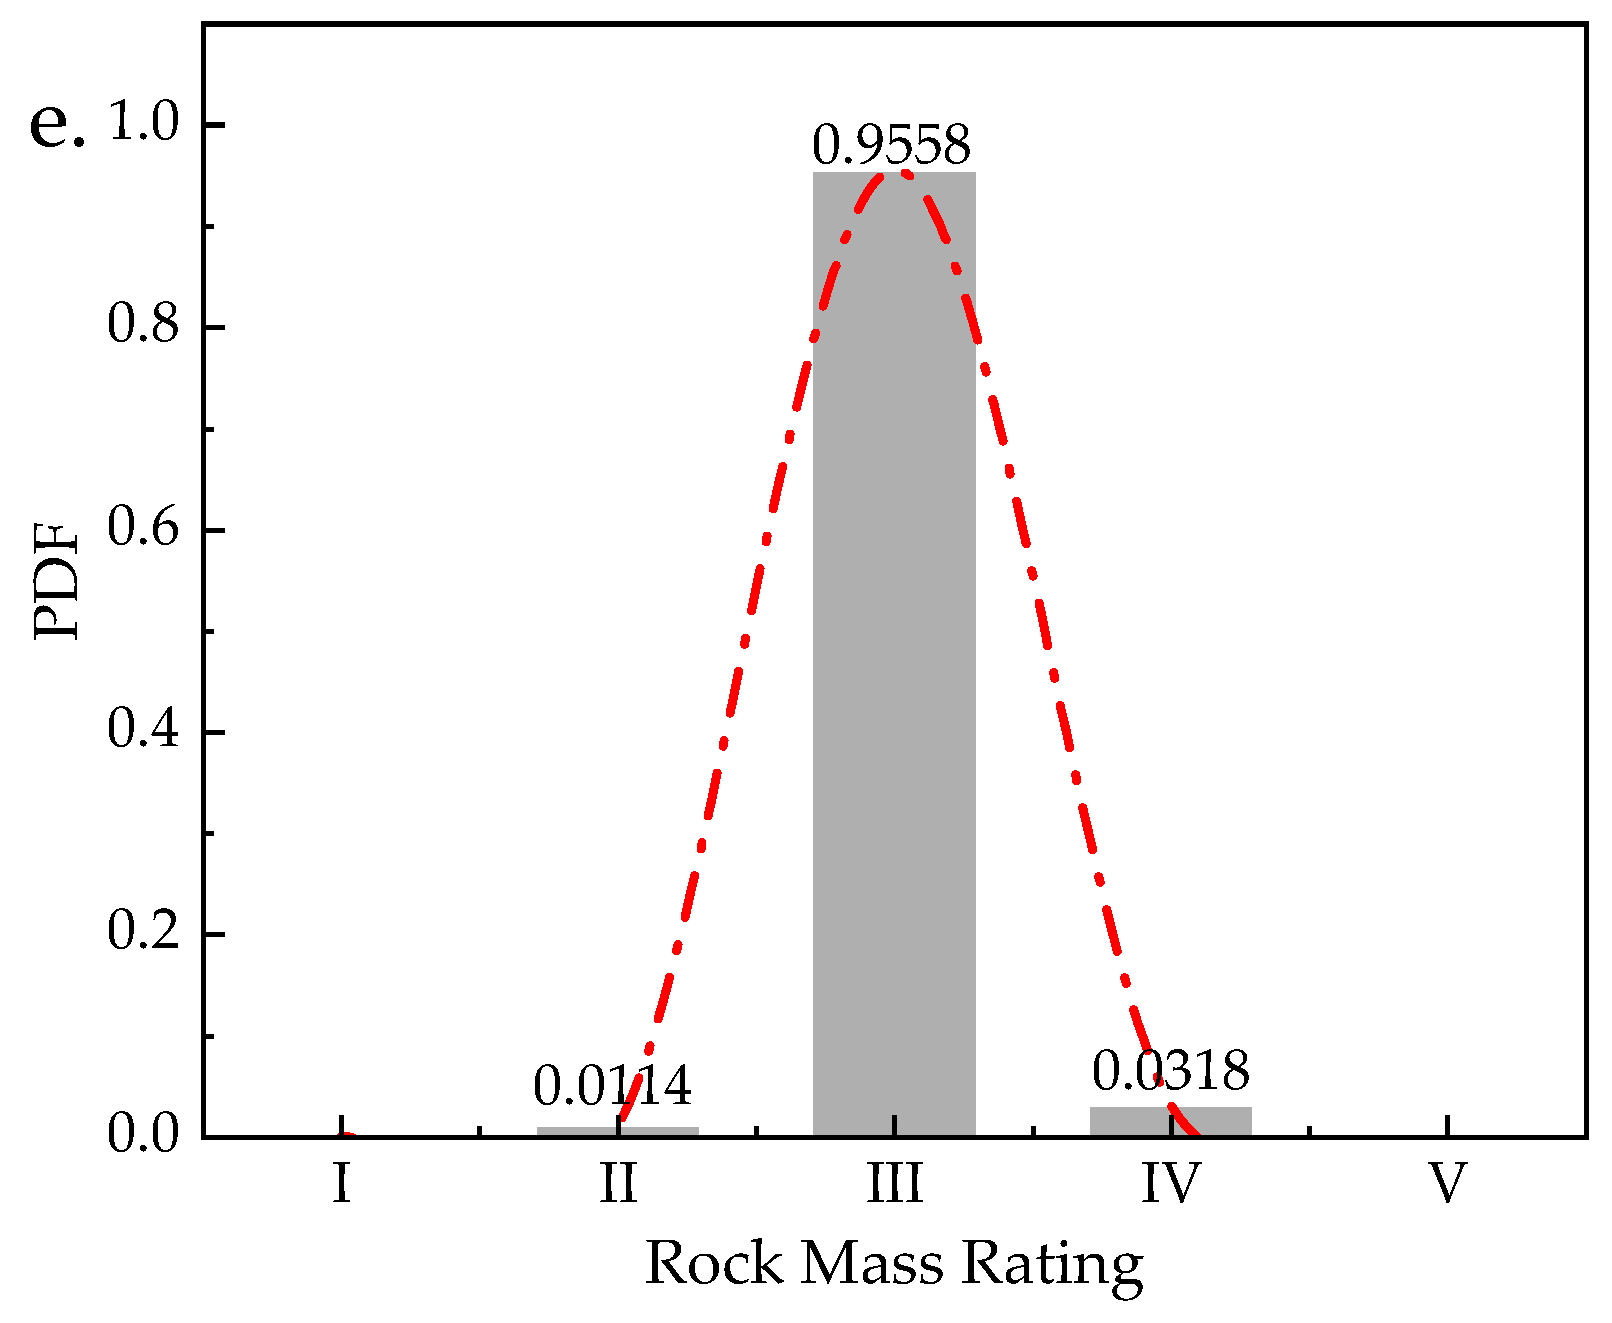
3.3. Model Validation
4. Case Study
4.1. Background
4.2. Quality Evaluation with the Proposed Method
5. Conclusions
Author Contributions
Funding
Institutional Review Board Statement
Informed Consent Statement
Data Availability Statement
Conflicts of Interest
Nomenclature
| Power set composed of all the possible subsets of | |
| B(mi, mj) | Belief divergence between two belief functions mi and mj |
| Bel(A) | Belief function of A |
| BM | Matrix constructed by BPAs of evidence |
| Matrix constructed by the BPAs of evidence for validation | |
| Matrix constructed by the BPAs of R1 as evidence for validation | |
| Matrix constructed by the BPAs of R2 as evidence for validation | |
| Matrix constructed by the BPAs of R3 as evidence for validation | |
| Matrix constructed by the BPAs of R4 as evidence for validation | |
| Matrix constructed by the BPAs of R5 as evidence for validation | |
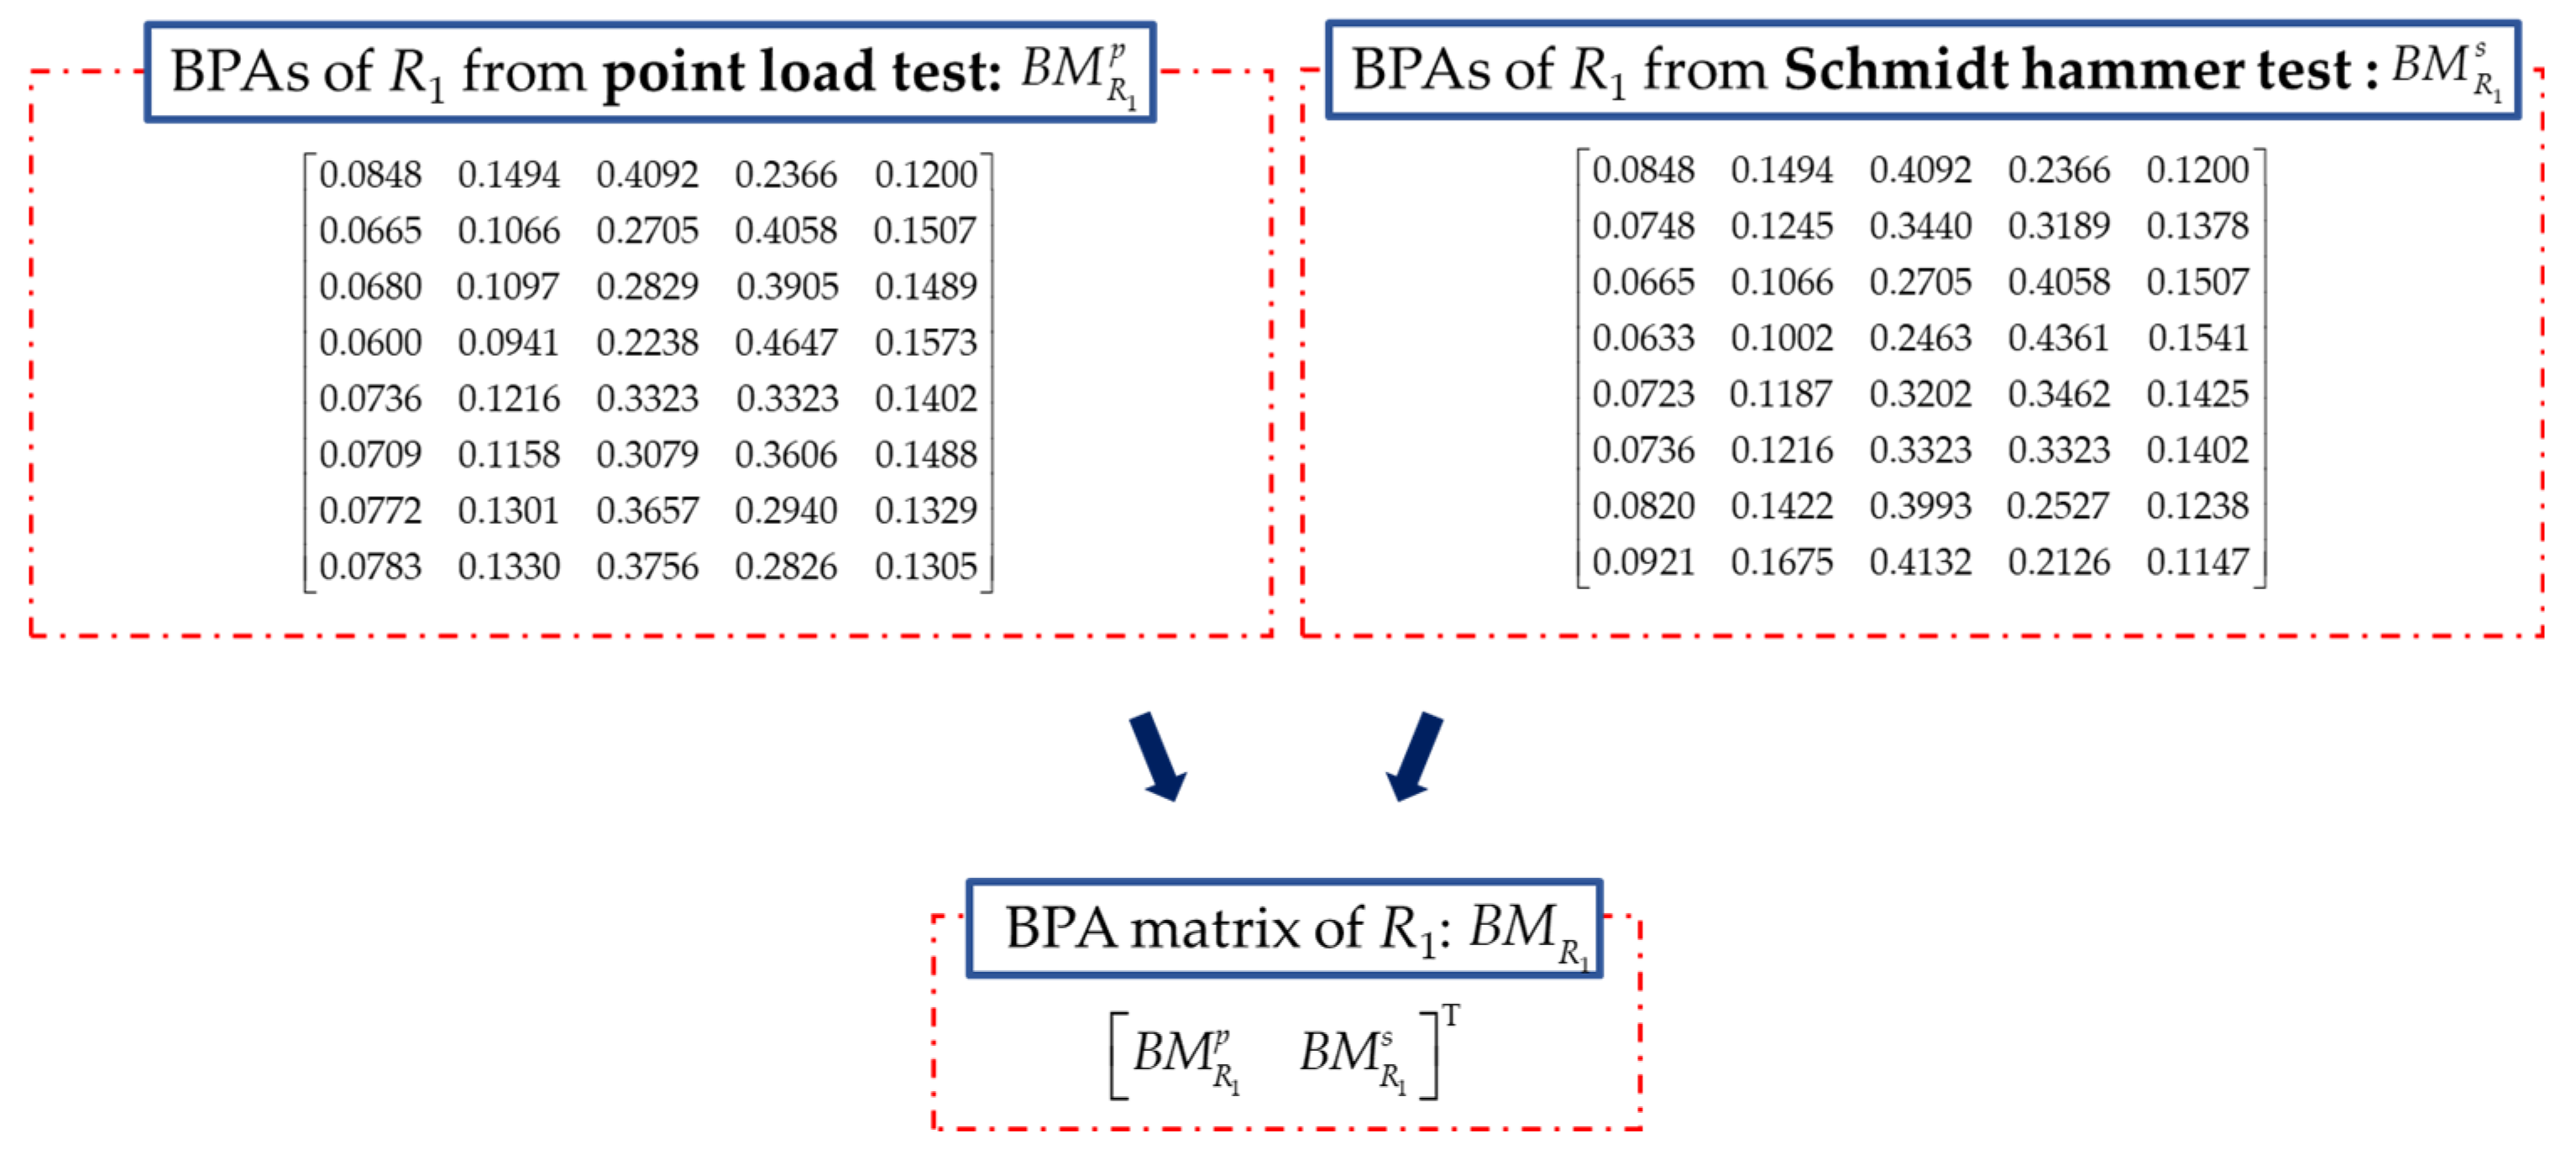
| Matrix constructed by the BPAs of R1 as evidence | |
| Matrix constructed by the BPAs of R1 from the point load test as evidence | |
| Matrix constructed by the BPAs of R1 from the Schmidt hammer test as evidence | |
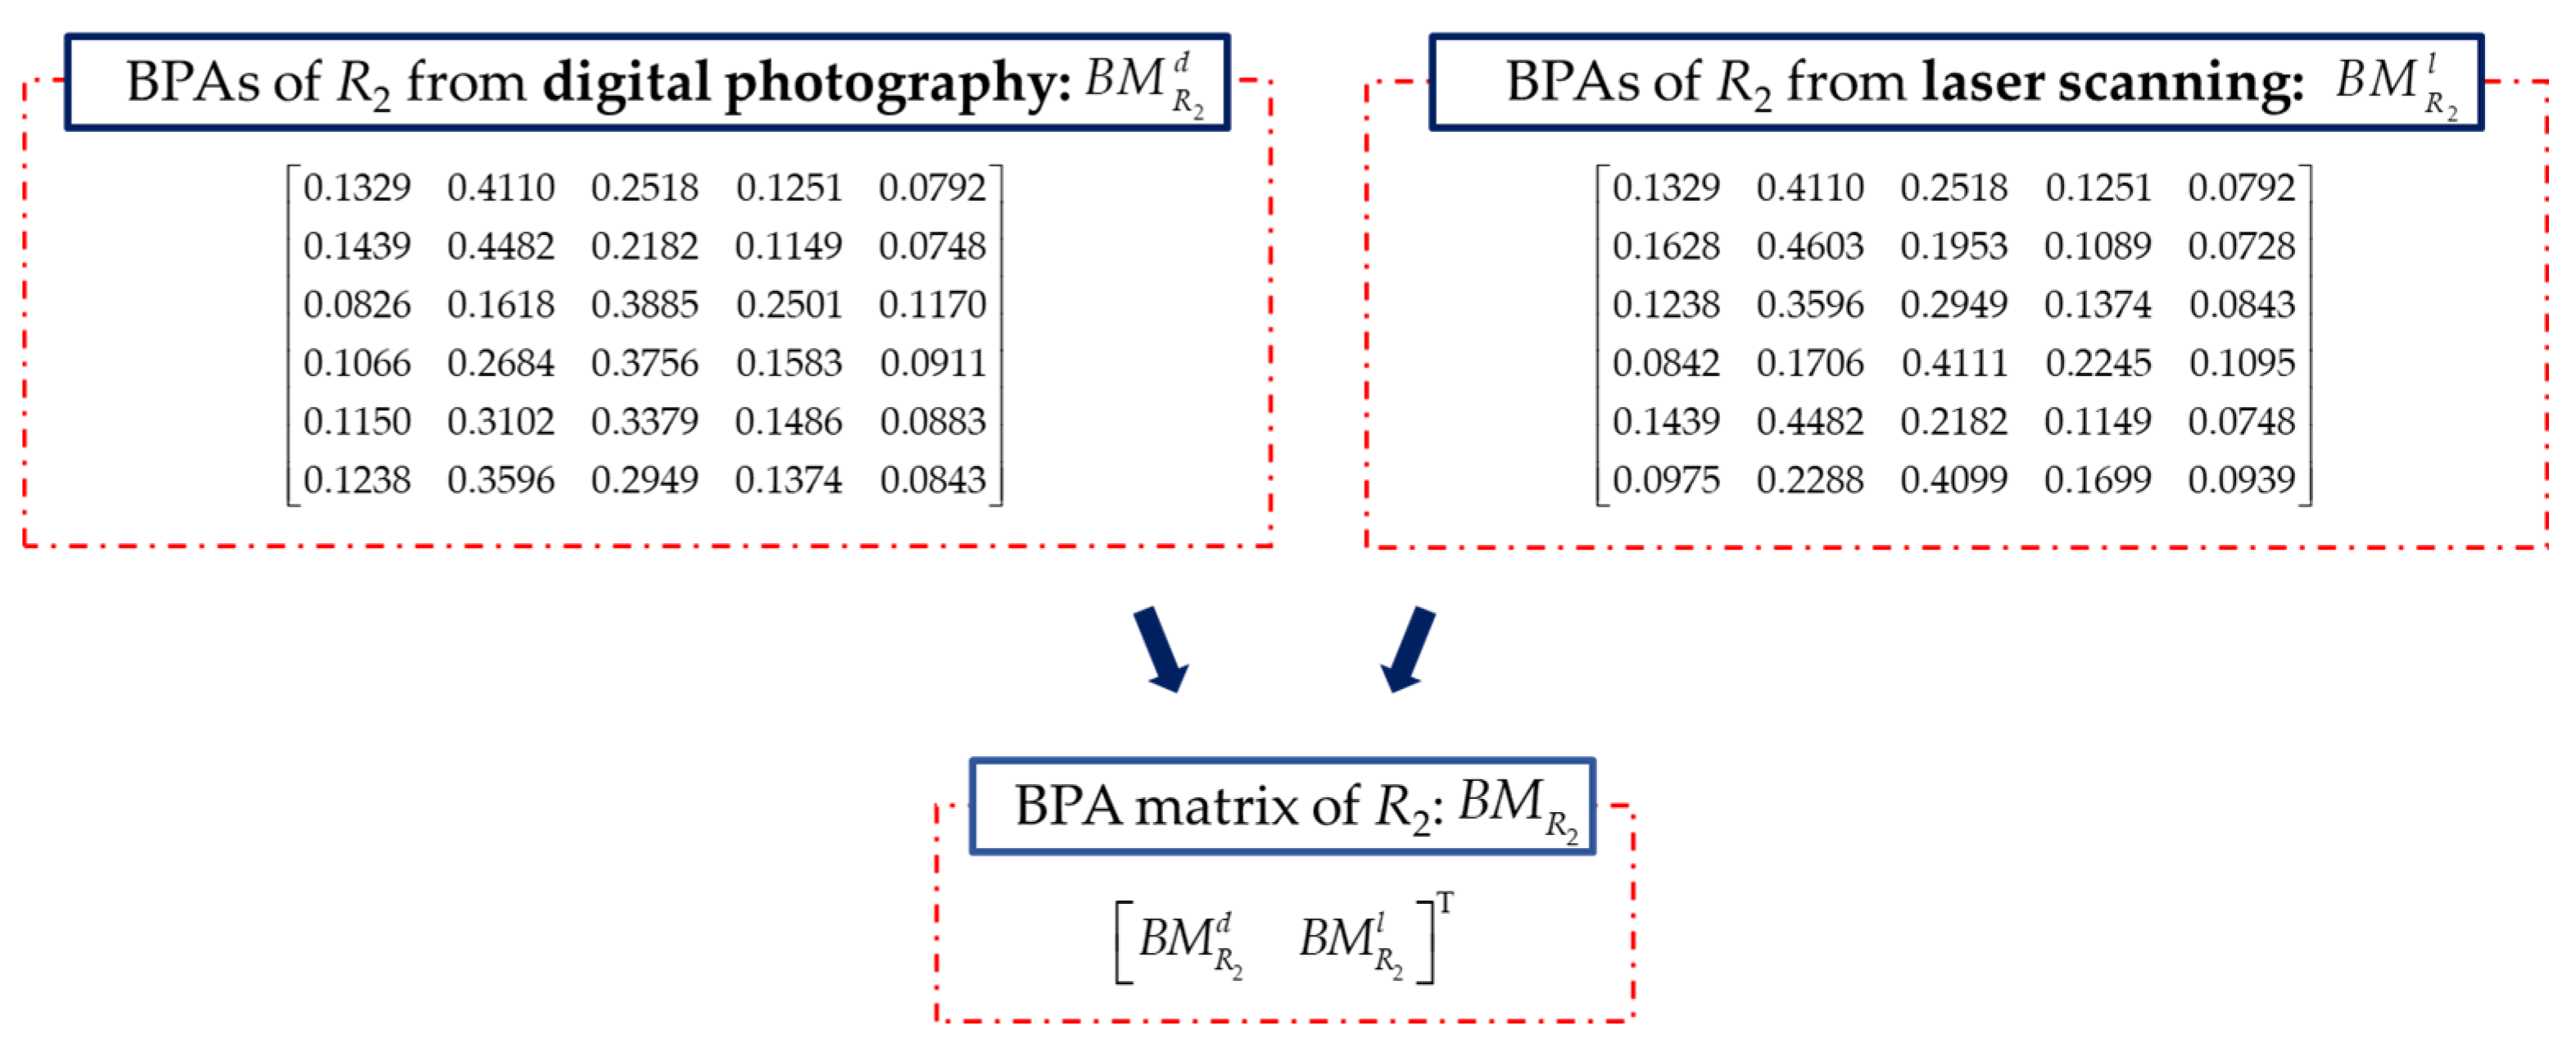
| Matrix constructed by the BPAs of R2 as evidence | |
| Matrix constructed by the BPAs of R2 from digital photography as evidence | |
| Matrix constructed by the BPAs of R2 from laser scanning as evidence | |
| Matrix constructed by the BPAs of R3 as evidence | |
| Matrix constructed by the BPAs of R31 as evidence | |
| Matrix constructed by the BPAs of R31 from digital photography as evidence | |
| Matrix constructed by the BPAs of R31 from laser scanning as evidence | |
| Matrix constructed by the BPAs of R32 as evidence | |
| Matrix constructed by the BPAs of R32 from field observation as evidence | |
| Matrix constructed by the BPAs of R32 from rock mechanics as evidence | |
| Matrix constructed by the BPAs of R33 as evidence | |
| Matrix constructed by the BPAs of R33 from digital photography as evidence | |
| Matrix constructed by the BPAs of R33 from laser scanning as evidence | |
| Matrix constructed by the BPAs of R34 as evidence | |
| Matrix constructed by the BPAs of R34 from rock tablet method as evidence | |
| Matrix constructed by the BPAs of R34 from field observation as evidence | |
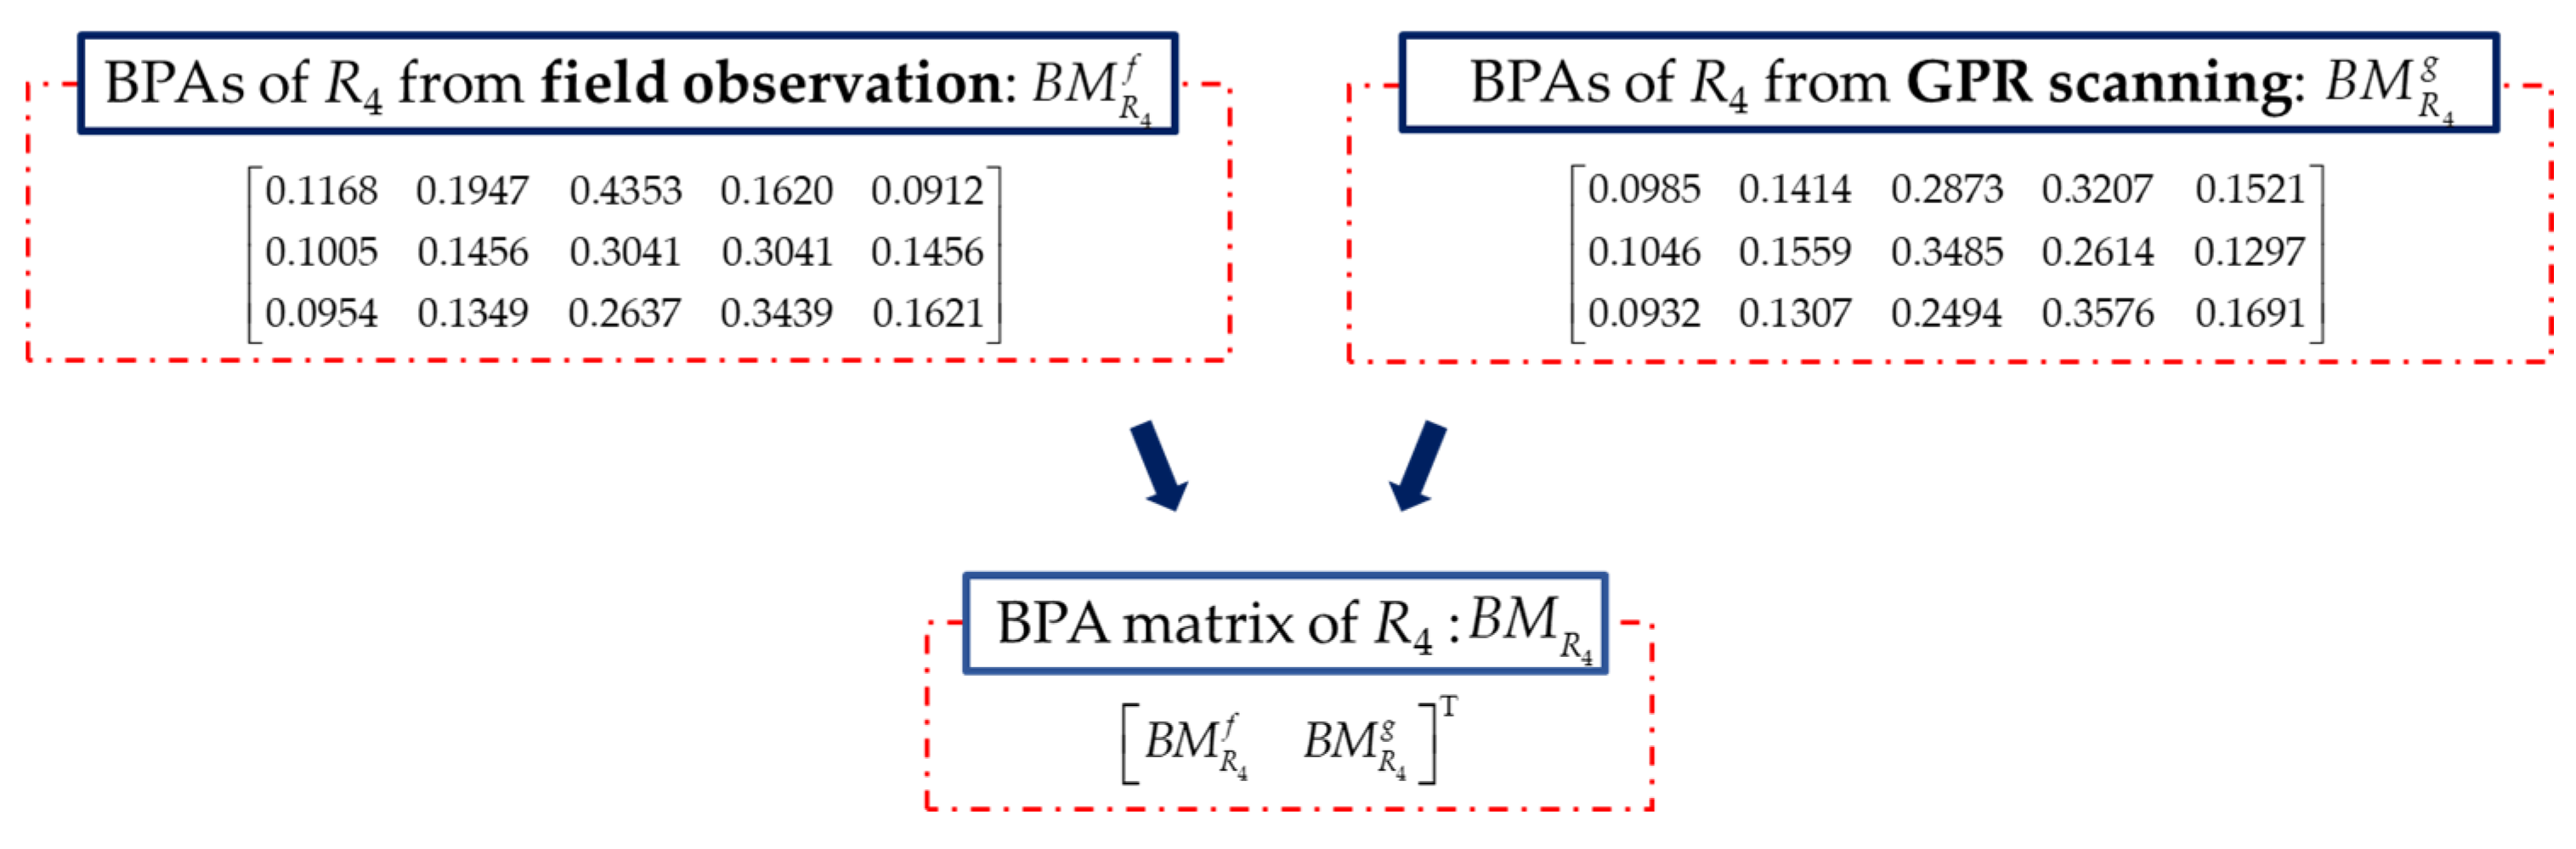
| Matrix constructed by the BPAs of R4 as evidence | |
| Matrix constructed by the BPAs of R4 from field observation as evidence | |
| Matrix constructed by the BPAs of R4 from GPR scanning as evidence | |
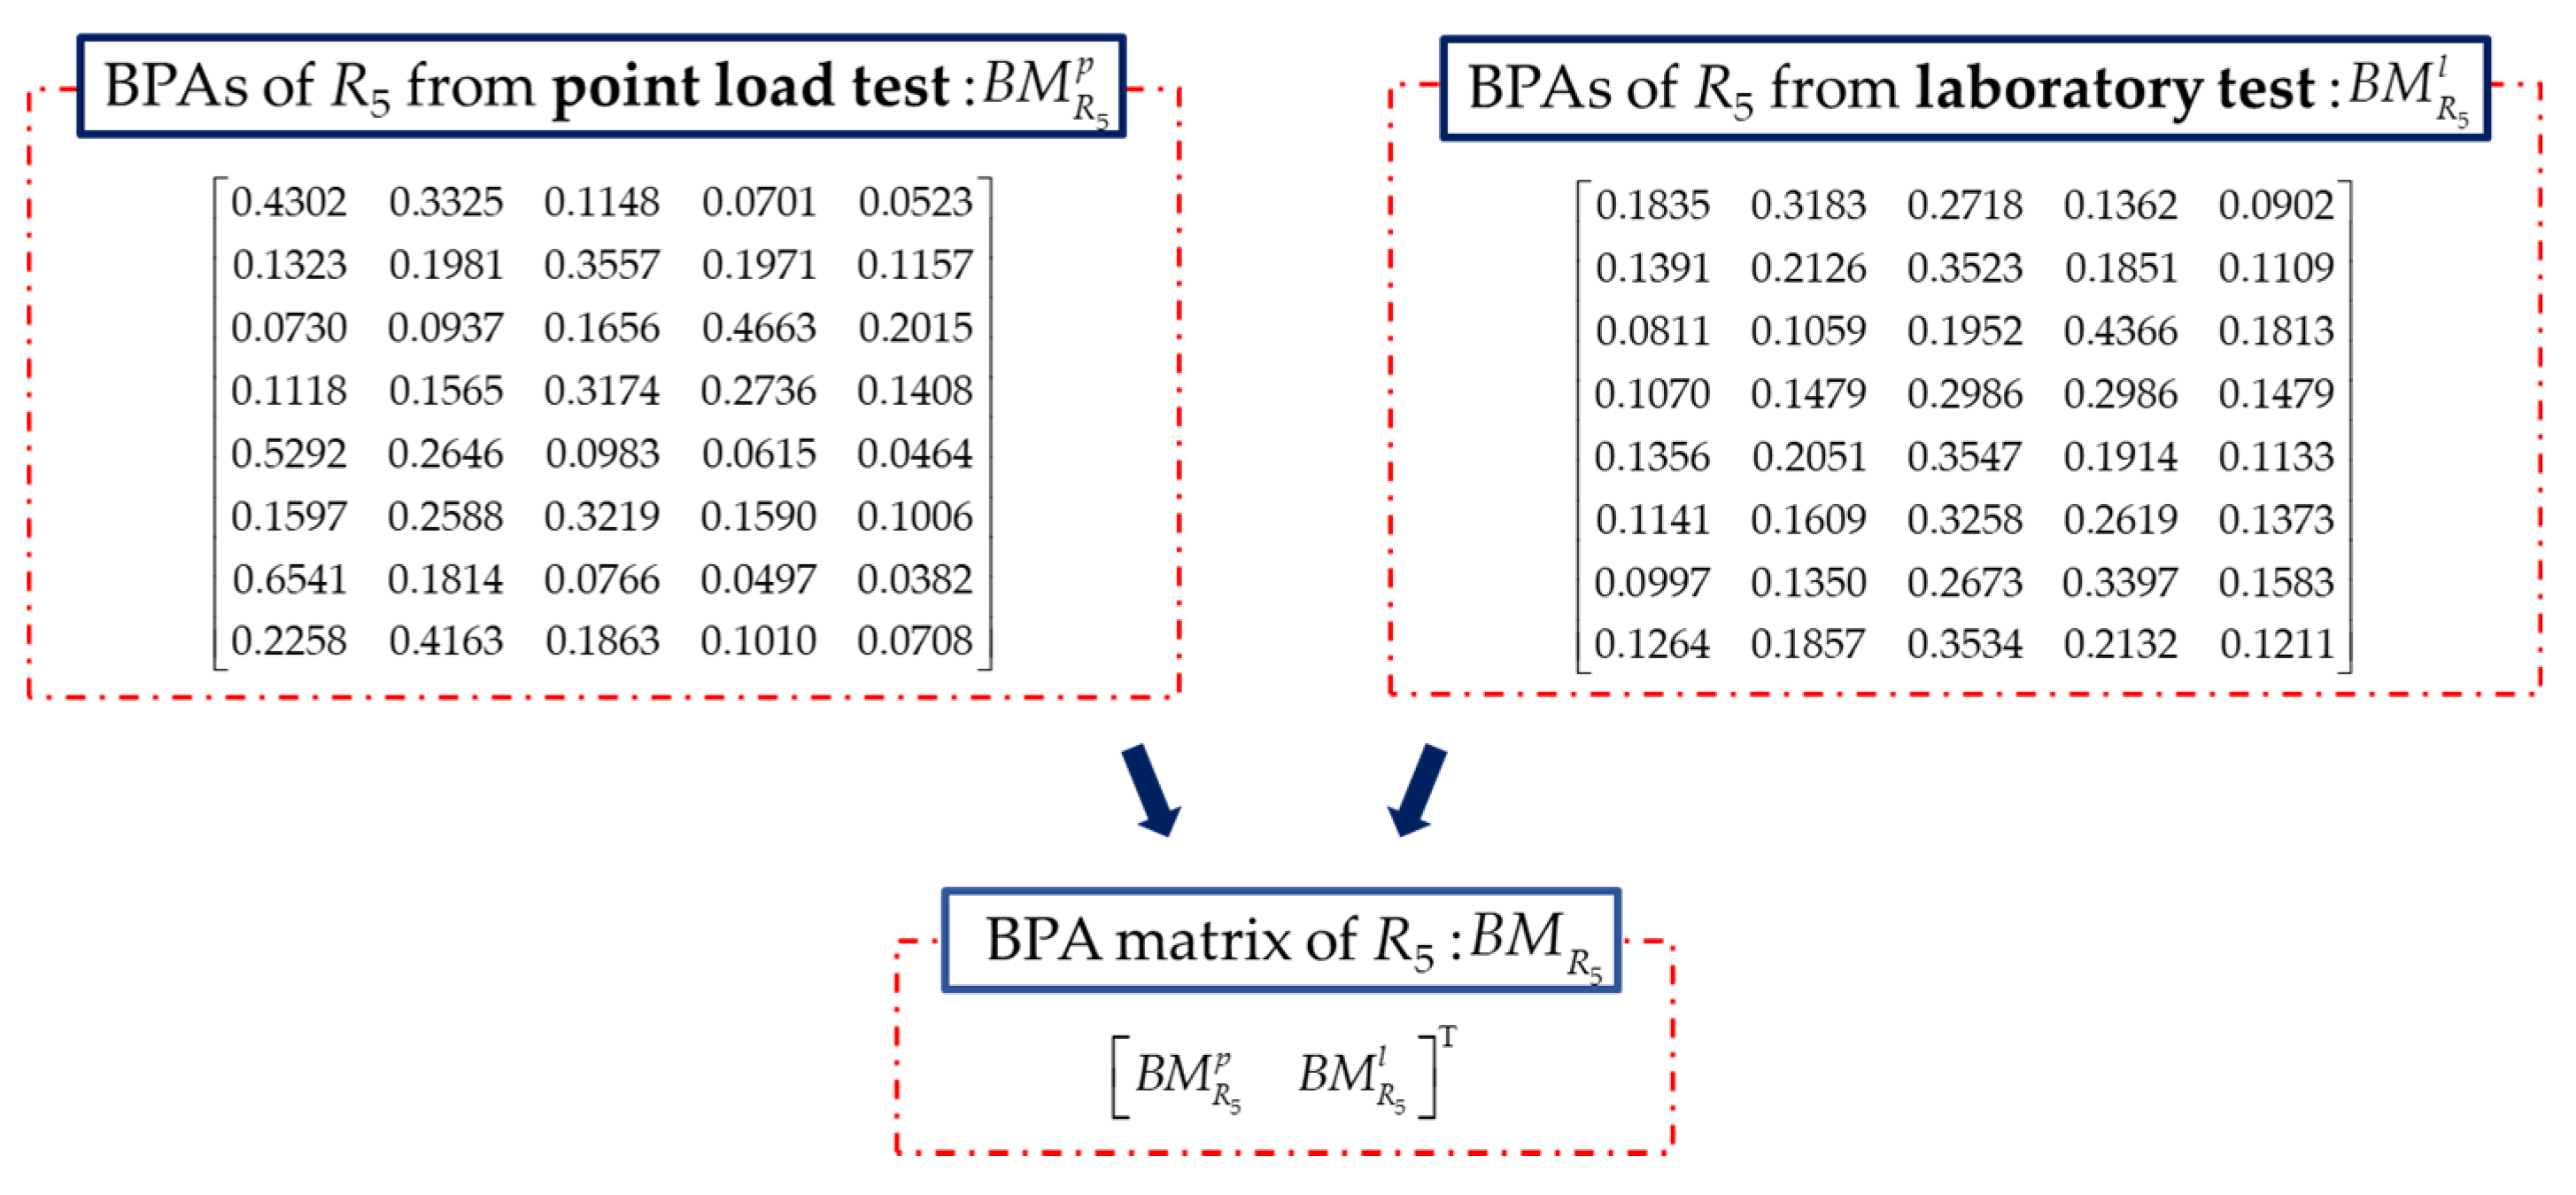
| Matrix constructed by the BPAs of R5 as evidence | |
| Matrix constructed by the BPAs of R5 from point load test as evidence | |
| Matrix constructed by the BPAs of R5 from laboratory test as evidence | |
| ci | Weight of the average belief |
| Dij | Distance between evidence Si and target pattern Xi |
| dij | Distance between sample i and j |
| FI | Event in discernment framework representing the quality of rock mass is in level I |
| FII | Event in discernment framework representing the quality of rock mass is in level II |
| FIII | Event in discernment framework representing the quality of rock mass is in level III |
| FIV | Event in discernment framework representing the quality of rock mass is in level IV |
| FV | Event in discernment framework representing the quality of rock mass is in level V |
| Fusion result in the discernment framework | |
| Id2 | Intact rock alterability of rock |
| K | Conflict coefficient between different BPAs |
| Weighted average belief vector in discernment framework | |
| m1, m2, …, mn | Different BPAs in the same discernment framework |
| m(A) | A’s basic probability assignment (BPA) in discernment framework |
| msi(Xj) | BPA of evidence Si to the target pattern Xj. |
| Weighted average belief of the event Fj | |
| n | Number of samples |
| p | Number of dimensions in a vector |
| Pl(A) | Likelihood function of A |
| R | Schmidt blow count |
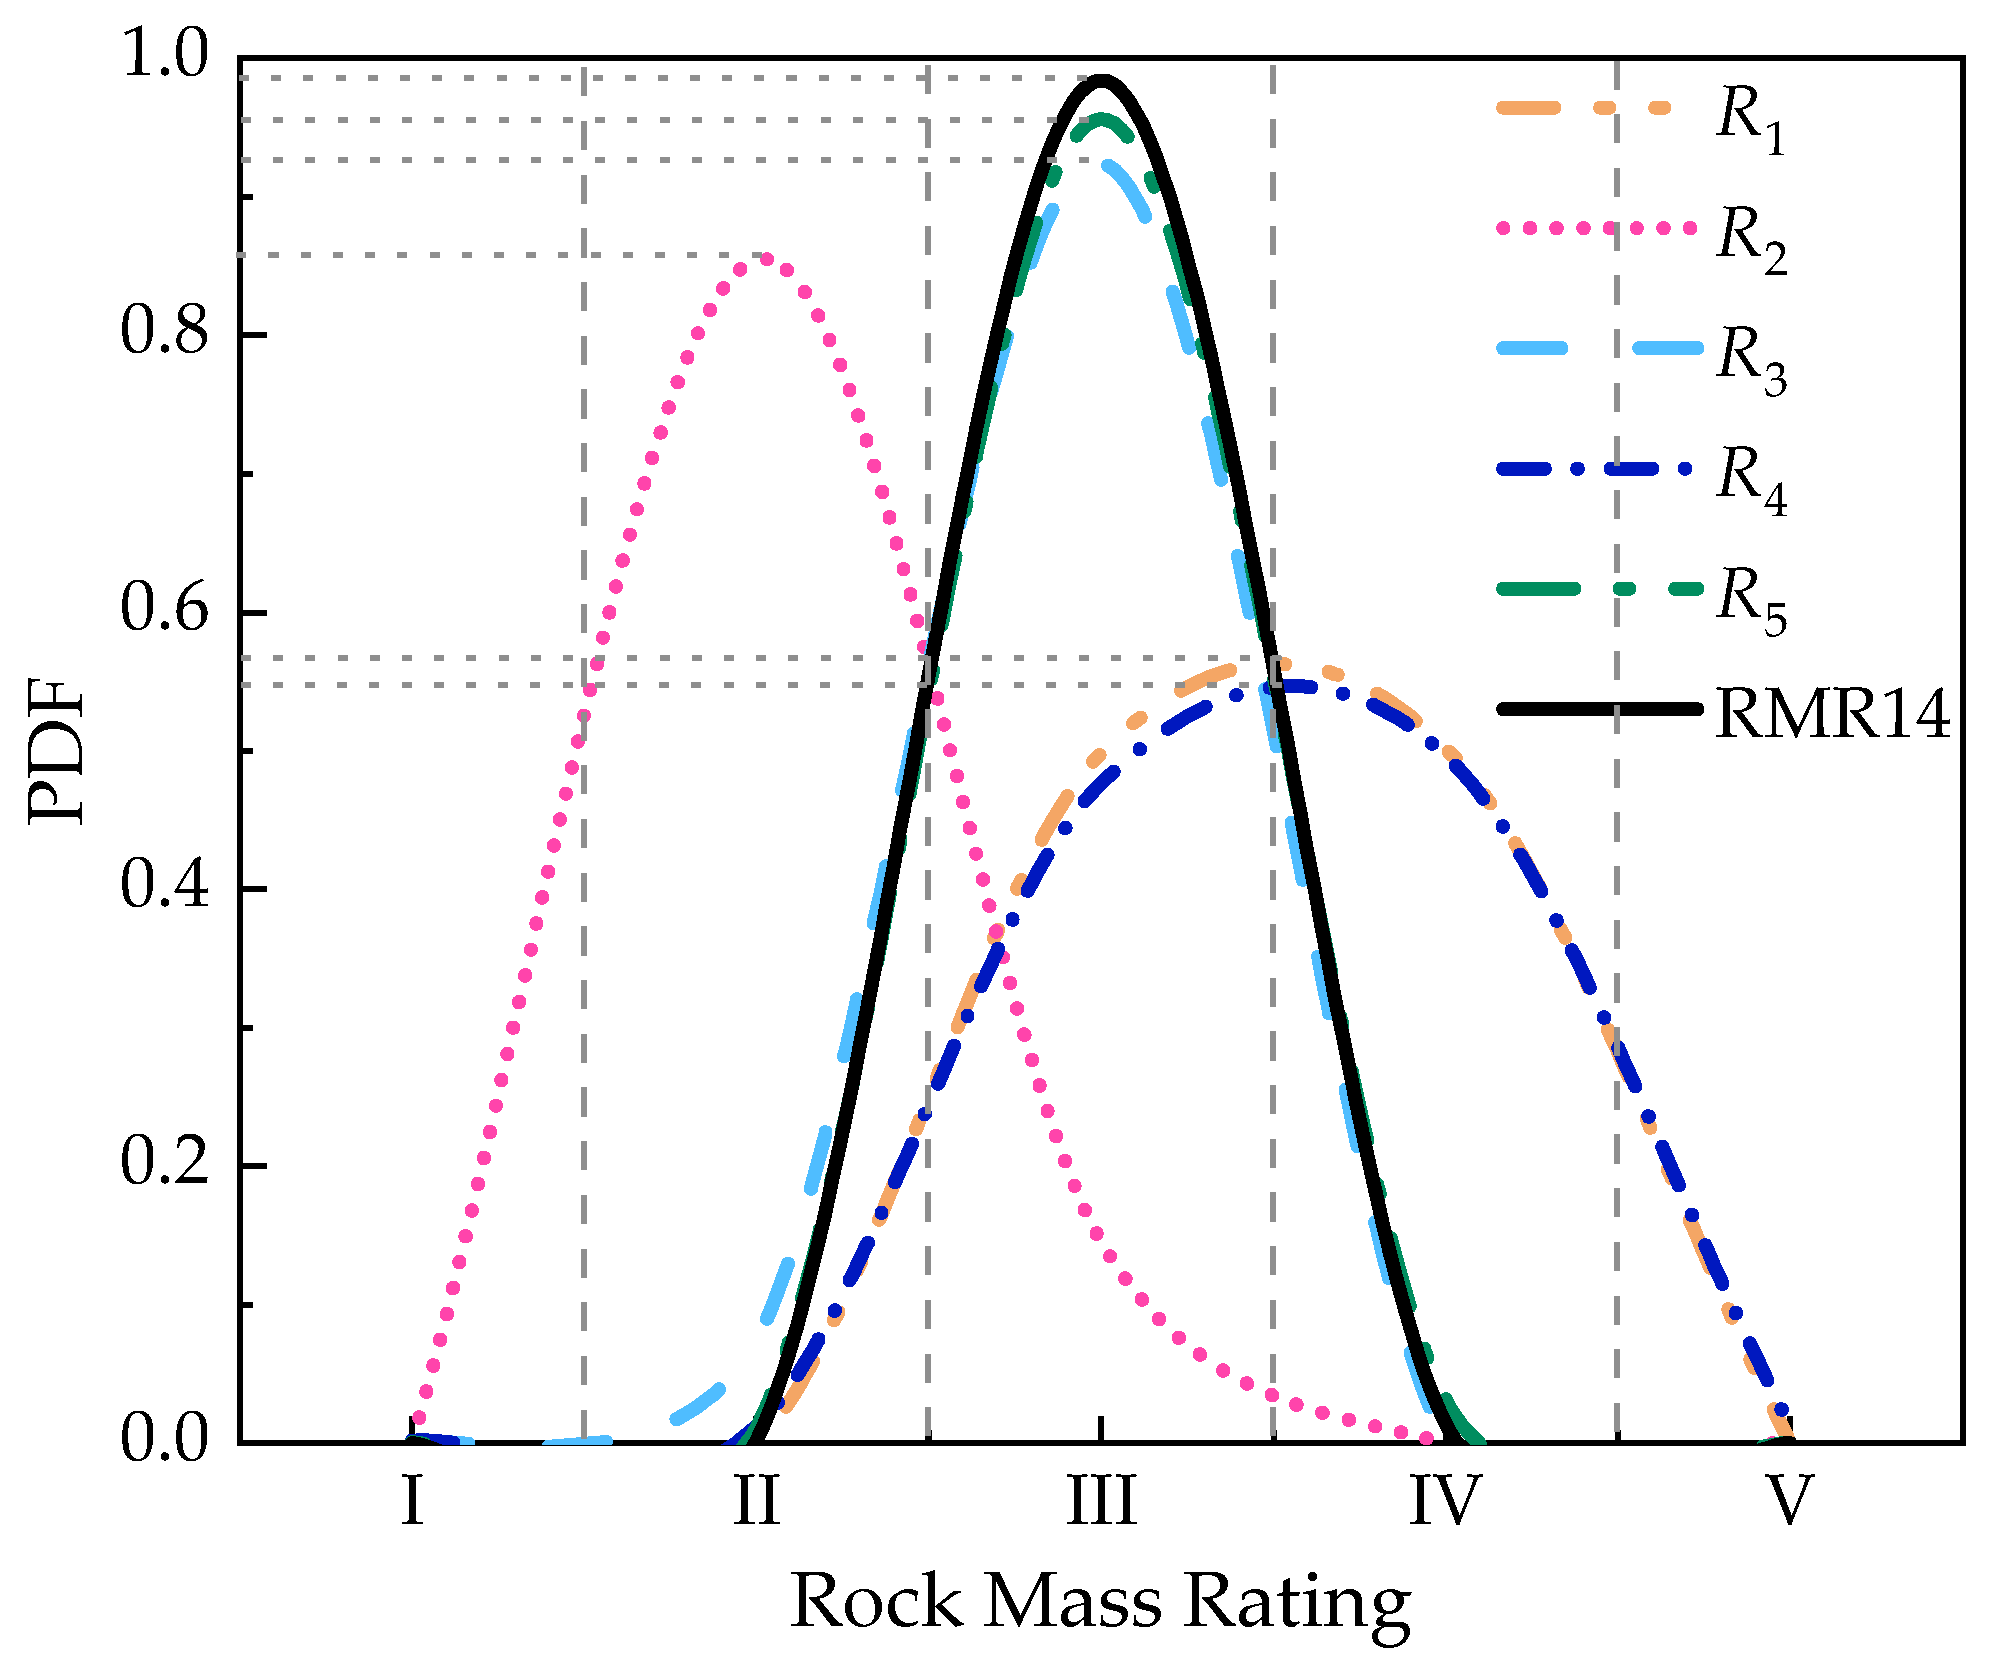
| R1 | Rating of rock strength in RMR14 |
| R2 | Rating of spacing of discontinuities in RMR14 |
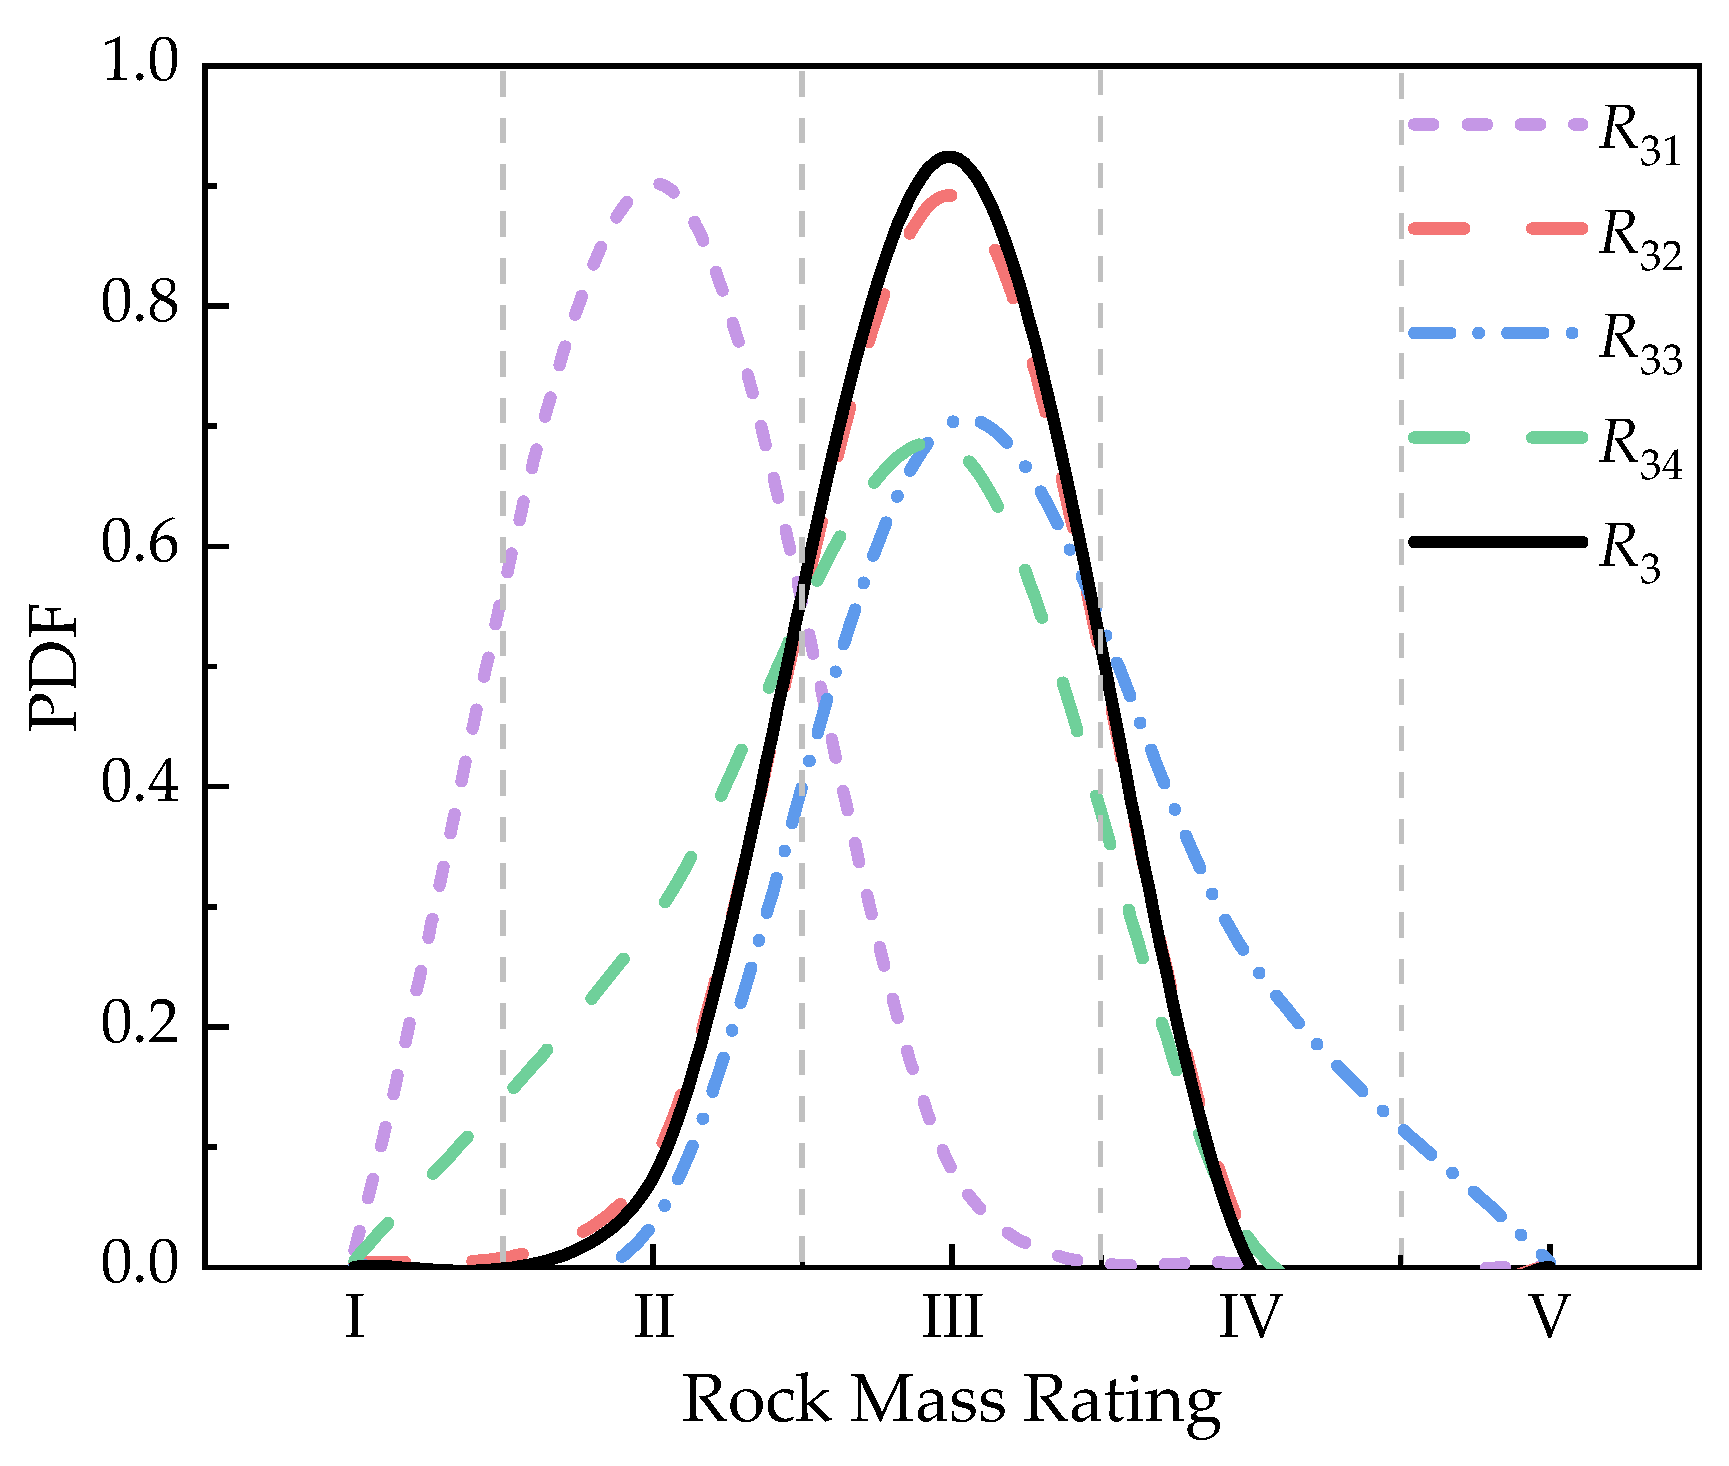
| R3 | Rating of condition of discontinuities in RMR14 |
| R31 | Rating of continuity as a sub-indicator in condition of discontinuities in RMR14 |
| R32 | Rating of roughness as a sub-indicator in condition of discontinuities in RMR14 |
| R33 | Rating of infilling as a sub-indicator in condition of discontinuities in RMR14 |
| R34 | Rating of weathering as a sub-indicator in condition of discontinuities in RMR14 |
| R4 | Rating of ground water in RMR14 |
| R5 | Rating of intact rock alterability in RMR14 |
| RB(mi, mj) | Belief reinforcement between two belief functions mi and mj |
| Average value of elements in the i-th row of matrix | |
| RBM | Matrix of belief reinforcement based on BM |
| Si = {si1, si2, …, sip} | Coordinates of evidence Si |
| Sei | Reciprocal of the average value of the elements in the i-th row of a matrix |
| UCS | Uniaxial compressive strength |
| Xi = {xi1, xi2, …, xip} | Coordinates of target pattern Xi |
| Discernment framework in D-S evidence theory | |
| θ1, θ2, …, θn | Elements (events) in discernment framework |
References
- Deere, D.U.; Deere, D.W. Rock quality designation (RQD) after twenty years. In Contract Report GL-89-1; U.S. Army Corps Engineers: Vicksburg, MS, USA, 1989. [Google Scholar]
- Deere, D. The rock quality designation (RQD) index in practice. In Symposium of Rock Classification for Engineering Purposes; ASTM Special Technical Publication: Philadelphia, PA, USA, 1988; pp. 91–101. [Google Scholar]
- Hoek, E.; Brown, E.T. Practical estimates of rock mass strength. Int. J. Rock Mech. Min. Sci. 1997, 34, 1165–1186. [Google Scholar] [CrossRef]
- Hoek, E. Strength of rock and rock masses. ISRM News J. 1994, 2, 4–16. [Google Scholar]
- Bieniawski, Z.T. Engineering Rock Mass Classifications: A Complete Manual for Engineers and Geologists in Mining, Civil, and Petroleum Engineering; John Wiley & Sons: New York, NY, USA, 1989; pp. 4–64. [Google Scholar]
- Bieniawski, Z.T. Engineering classification of jointed rock masses. Civ. Eng. S. Afr. 1973, 15, 335–343. [Google Scholar] [CrossRef]
- Celada, B.; Tardáguila, I.; Varona, P.; Rodríguez, A.; Bieniawski, Z.T. Innovating tunnel design by an improved experience-based RMR system. In Proceedings of the World Tunnel Congress, Foz do Iguaçu, Brazil, 9–15 May 2014; pp. 1–9. [Google Scholar]
- National Standards Compilation Group of People’s Republic of China. TB 10121–2007 Technical Code for Monitoring Measurement of Railway Tunnel; China Planning Press: Beijing, China, 2014. [Google Scholar]
- Bieniawski, Z.T. The point-load test in geotechnical practice. Eng. Geol. 1975, 9, 1–11. [Google Scholar] [CrossRef]
- Chau, K.T.; Wong, R.H.C. Uniaxial compressive strength and point load strength of rocks. Int. J. Rock Mech. Min. Sci. Geomech. 1996, 33, 183–188. [Google Scholar] [CrossRef]
- Karaman, K.; Kesimal, A. A comparative study of schmidt hammer test methods for estimating the uniaxial compressive strength of rocks. Bull. Eng. Geol. Environ. 2015, 74, 507–520. [Google Scholar] [CrossRef]
- Katz, O.; Reches, Z.; Roegiers, J.C. Evaluation of mechanical rock properties using a Schmidt hammer. Int. J. Rock Mech. Min. Sci. 2000, 37, 723–728. [Google Scholar] [CrossRef]
- Cacciari, P.P.; Futai, M.M. Mapping and characterization of rock discontinuities in a tunnel using 3D terrestrial laser scanning. Bull. Eng. Geol. Environ. 2016, 75, 223–237. [Google Scholar] [CrossRef]
- Sturzenegger, M.; Stead, D. Close-range terrestrial digital photogrammetry and terrestrial laser scanning for discontinuity characterization on rock cuts. Eng. Geol. 2009, 106, 163–182. [Google Scholar] [CrossRef]
- Chae, B.G.; Ichikawa, Y.; Jeong, G.C.; Seo, Y.S.; Kim, B.C. Roughness measurement of rock discontinuities using a confocal laser scanning microscope and the Fourier spectral analysis. Eng. Geol. 2004, 72, 181–199. [Google Scholar] [CrossRef]
- Park, K.H.; Owatsiriwong, A.; Lee, J.G. Analytical solution for steady-state groundwater inflow into a drained circular tunnel in a semi-infinite aquifer: A revisit. Tunn. Undergr. Space Technol. 2008, 23, 206–209. [Google Scholar] [CrossRef]
- Yan, L.; Liu, P.; Peng, H.; Kašanin-Grubin, M.; Lin, K. Laboratory study of the effect of temperature difference on the disintegration of redbed softrock. Phys. Geogr. 2019, 40, 149–163. [Google Scholar] [CrossRef] [Green Version]
- Zhang, Q.; Huang, X.; Zhu, H.; Li, J. Quantitative assessments of the correlations between rock mass rating (RMR) and geological strength index (GSI). Tunn. Undergr. Space Technol. 2019, 83, 73–81. [Google Scholar] [CrossRef]
- Chen, H.; Jiang, B.; Ding, S.; Huang, B. Data-driven fault diagnosis for traction systems in high-speed trains: A survey, challenges, and perspectives. IEEE Trans Intell Transp Syst. 2020, 1–17. [Google Scholar] [CrossRef]
- Hall, D.L.; Llinas, J. An introduction to multisensor data fusion. Proc. IEEE 1997, 85, 6–23. [Google Scholar] [CrossRef] [Green Version]
- Raol, J.R. Data Fusion Mathematics: Theory and Practice; CRC Press: Los Angeles, CA, USA, 2015; pp. 1–32. [Google Scholar]
- Khaleghi, B.; Khamis, A.; Karray, F.O.; Razavi, S.N. Multisensor data fusion: A review of the state-of-the-art. Inf. Fusion 2013, 14, 28–44. [Google Scholar] [CrossRef]
- Dong, J.; Zhuang, D.; Huang, Y.; Fu, J. Advances in multi-sensor data fusion: Algorithms and applications. Sensors 2009, 9, 7771–7784. [Google Scholar] [CrossRef] [Green Version]
- Razavi, S.N.; Haas, C.T. Multisensor data fusion for on-site materials tracking in construction. Autom. Constr. 2010, 19, 1037–1046. [Google Scholar] [CrossRef]
- Wang, W.; Chen, J.; Hong, T. Occupancy prediction through machine learning and data fusion of environmental sensing and Wi-Fi sensing in buildings. Autom. Constr. 2018, 94, 233–243. [Google Scholar] [CrossRef] [Green Version]
- Tran, M.Q.; Liu, M.K.; Elsisi, M. Effective multi-sensor data fusion for chatter detection in milling process. ISA Trans. 2021. In Press. [Google Scholar] [CrossRef]
- Liu, M.K.; Tran, M.Q.; Weng, P.Y. Fusion of vibration and current signatures for the fault diagnosis of induction machines. Shock Vib. 2019, 2019, 1–17. [Google Scholar] [CrossRef]
- Bakr, M.A.; Lee, S. Distributed multisensor data fusion under unknown correlation and data inconsistency. Sensors 2017, 17, 2472. [Google Scholar] [CrossRef] [PubMed] [Green Version]
- Bellhouse, D. Most honourable remembrance: The life and work of thomas bayes. Math. Intell. 2004, 3, 77–78. [Google Scholar] [CrossRef]
- Shafer, G. A Mathematical theory of evidence turns 40. Int. J. Approx. Reason. 2016, 79, 7–25. [Google Scholar] [CrossRef]
- Dempster, A.P. New methods for reasoning towards posterior distributions based on sample data. Ann. Math. Stat. 1966, 38, 355–374. [Google Scholar] [CrossRef]
- Basheer, I.A.; Hajmeer, M. Artificial neural networks: Fundamentals, computing, design, and application. J. Microbiol. Methods 2000, 43, 3–31. [Google Scholar] [CrossRef]
- Borsuk, M.E.; Stow, C.A.; Reckhow, K.H. A bayesian network of eutrophication models for synthesis, prediction, and uncertainty analysis. Ecol. Modell. 2004, 173, 219–239. [Google Scholar] [CrossRef]
- Parikh, C.R.; Pont, M.J.; Barrie Jones, N. Application of dempster-shafer theory in condition monitoring applications: A case study. Pattern Recognit. Lett. 2001, 22, 777–785. [Google Scholar] [CrossRef]
- Sun, R.; Huang, H.Z.; Miao, Q. Improved information fusion approach based on D-S evidence theory. J. Mech. Sci. Technol. 2008, 22, 2417–2425. [Google Scholar] [CrossRef]
- Kröse, B.; Krose, B.; Smagt, P.; van der Smagt, P. An Introduction to Neural Networks; Amsterdam University Press: Amsterdam, The Netherlands, 1993; pp. 1–22. [Google Scholar]
- Schmidhuber, J. Deep learning in neural networks: An overview. Neural Netw. 2015, 61, 85–117. [Google Scholar] [CrossRef] [PubMed] [Green Version]
- Zhang, W.; Liu, Y.; Zhang, S.; Long, T.; Liang, J. Error fusion of hybrid neural networks for mechanical condition dynamic prediction. Sensors 2021, 21, 4043. [Google Scholar] [CrossRef]
- Ma, M.; An, J. Combination of evidence with different weighting factors: A novel probabilistic-based dissimilarity measure approach. J. Sens. 2015, 2015, 509385. [Google Scholar] [CrossRef]
- Murphy, C.K. Combining belief functions when evidence conflicts. Decis. Support Syst. 2000, 29, 1–9. [Google Scholar] [CrossRef]
- Xie, S.; Chen, Y.; Dong, S.; Zhang, G. Risk assessment of an oil depot using the improved multi-sensor fusion approach based on the cloud model and the belief jensen-shannon divergence. J. Loss Prev. Process Ind. 2020, 67, 104214. [Google Scholar] [CrossRef]
- Xiao, F. Multi-sensor data fusion based on the belief divergence measure of evidences and the belief entropy. Inf. Fusion 2019, 46, 23–32. [Google Scholar] [CrossRef]
- Xiao, F. A New divergence measure for belief functions in D–S evidence theory for multisensor data fusion. Inf. Sci. 2020, 514, 462–483. [Google Scholar] [CrossRef]
- Jousselme, A.L.; Grenier, D.; Bossé, É. A new distance between two bodies of evidence. Inf. Fusion 2001, 2, 91–101. [Google Scholar] [CrossRef]
- Lee, L.H.; Wan, C.H.; Rajkumar, R.; Isa, D. An enhanced support vector machine classification framework by using euclidean distance function for text document categorization. Appl. Intell. 2012, 37, 80–99. [Google Scholar] [CrossRef]
- Deng, Y.; Shi, W.; Zhu, Z.; Liu, Q. Combining belief functions based on distance of evidence. Decis. Support Syst. 2004, 38, 489–493. [Google Scholar] [CrossRef]
- Salvini, R.; Vanneschi, C.; Coggan, J.S.; Mastrorocco, G. Evaluation of the use of UAV photogrammetry for rock discontinuity roughness characterization. Rock Mech. Rock Eng. 2020, 53, 3699–3720. [Google Scholar] [CrossRef]
- Wang, C.; Wang, L.; Karakus, M. A new spectral analysis method for determining the joint roughness coefficient of rock joints. Int. J. Rock Mech. Min. Sci. 2019, 113, 72–82. [Google Scholar] [CrossRef]
- Krklec, K.; Domínguez-Villar, D.; Perica, D. Use of rock tablet method to measure rock weathering and landscape denudation. Earth Sci. Rev. 2021, 212, 103449. [Google Scholar] [CrossRef]
- Shmatovskyi, L. Experimental studies concerning stressed rocks resistance to disintegration. In E3S Web of Conferences; EDP Sciences: Les Ulis, France, 2019; Volume 109, p. 88. [Google Scholar]


| Rating Index | I | II | III | IV | V |
|---|---|---|---|---|---|
| Rock strength (R1) | 12–15 | 8–12 | 5–8 | 3–5 | 0–3 |
| Spacing of discontinuities (R2) | 29–40 | 22–29 | 15–22 | 8–15 | 0–8 |
| Condition of discontinuities (R3) | 17–20 | 13–17 | 9–13 | 4–9 | 0–4 |
| Ground water (R4) | 13–15 | 10–13 | 7–10 | 3–7 | 0–3 |
| Intact rock alterability (R5) | 9–10 | 7–9 | 4–7 | 2–4 | 0–2 |
| Total rating | 80–100 | 60–80 | 40–60 | 20–40 | 0–20 |
| Rock Mass Rating | I | II | III | IV | V |
|---|---|---|---|---|---|
| Continuity (R31) | 4.1–5.0 | 3.1–4.0 | 2.1–3.0 | 1.1–2.0 | 0–1.0 |
| Roughness (R32) | 4.1–5.0 | 3.1–4.0 | 2.1–3.0 | 1.1–2.0 | 0–1.0 |
| Infilling (R33) | 4.1–5.0 | 3.1–4.0 | 2.1–3.0 | 1.1–2.0 | 0–1.0 |
| Weathering (R34) | 4.1–5.0 | 3.1–4.0 | 2.1–3.0 | 1.1–2.0 | 0–1.0 |
| No. | R1 | R2 | R3 | R4 | R5 |
|---|---|---|---|---|---|
| 1 | 14 | 11 | 12 | 3 | 2 |
| 2 | 13 | 30 | 12 | 4 | 10 |
| 3 | 5 | 20 | 17 | 13 | 7 |
| 4 | 10 | 19 | 16 | 10 | 5 |
| 5 | 3 | 36 | 12 | 7 | 5 |
| Rock Mass Rating | |||||
|---|---|---|---|---|---|
| I | II | III | IV | V | |
| 0.4397 | 0.4720 | 0.3054 | 0.2494 | 0.2401 | |
| Se | 2.2744 | 2.1187 | 3.2741 | 4.0091 | 4.1646 |
| c | 0.1436 | 0.1338 | 0.2067 | 0.2531 | 0.2629 |
| Rock Mass Rating | |||||
|---|---|---|---|---|---|
| I | II | III | IV | V | |
| 0.4819 | 0.7590 | 0.4779 | 0.4751 | 0.4625 | |
| Se | 2.0749 | 1.3176 | 2.0927 | 2.1046 | 2.1622 |
| c | 0.2128 | 0.1351 | 0.2146 | 0.2158 | 0.2217 |
| Weighted average belief | 6.2 × 10⁻⁴ | 0.1366 | 0.6387 | 0.2213 | 0.0028 |
| Final probability | 8.7 × 10⁻¹³ | 0.0021 | 0.9838 | 0.0142 | 3.5 × 10⁻¹⁰ |
Publisher’s Note: MDPI stays neutral with regard to jurisdictional claims in published maps and institutional affiliations. |
© 2021 by the authors. Licensee MDPI, Basel, Switzerland. This article is an open access article distributed under the terms and conditions of the Creative Commons Attribution (CC BY) license (https://creativecommons.org/licenses/by/4.0/).
Share and Cite
Zhang, Q.; Jiang, Q.; Li, Y.; Wang, N.; He, L. Quality Evaluation of Rock Mass Using RMR14 Based on Multi-Source Data Fusion. Sensors 2021, 21, 7108. https://doi.org/10.3390/s21217108
Zhang Q, Jiang Q, Li Y, Wang N, He L. Quality Evaluation of Rock Mass Using RMR14 Based on Multi-Source Data Fusion. Sensors. 2021; 21(21):7108. https://doi.org/10.3390/s21217108
Chicago/Turabian StyleZhang, Qi, Qing Jiang, Yuanhai Li, Ning Wang, and Lei He. 2021. "Quality Evaluation of Rock Mass Using RMR14 Based on Multi-Source Data Fusion" Sensors 21, no. 21: 7108. https://doi.org/10.3390/s21217108
APA StyleZhang, Q., Jiang, Q., Li, Y., Wang, N., & He, L. (2021). Quality Evaluation of Rock Mass Using RMR14 Based on Multi-Source Data Fusion. Sensors, 21(21), 7108. https://doi.org/10.3390/s21217108