
Structural Response Prediction for Damage Identification Using Wavelet Spectra in Convolutional Neural Network

Abstract
:1. Introduction
2. Structural Response Prediction Method
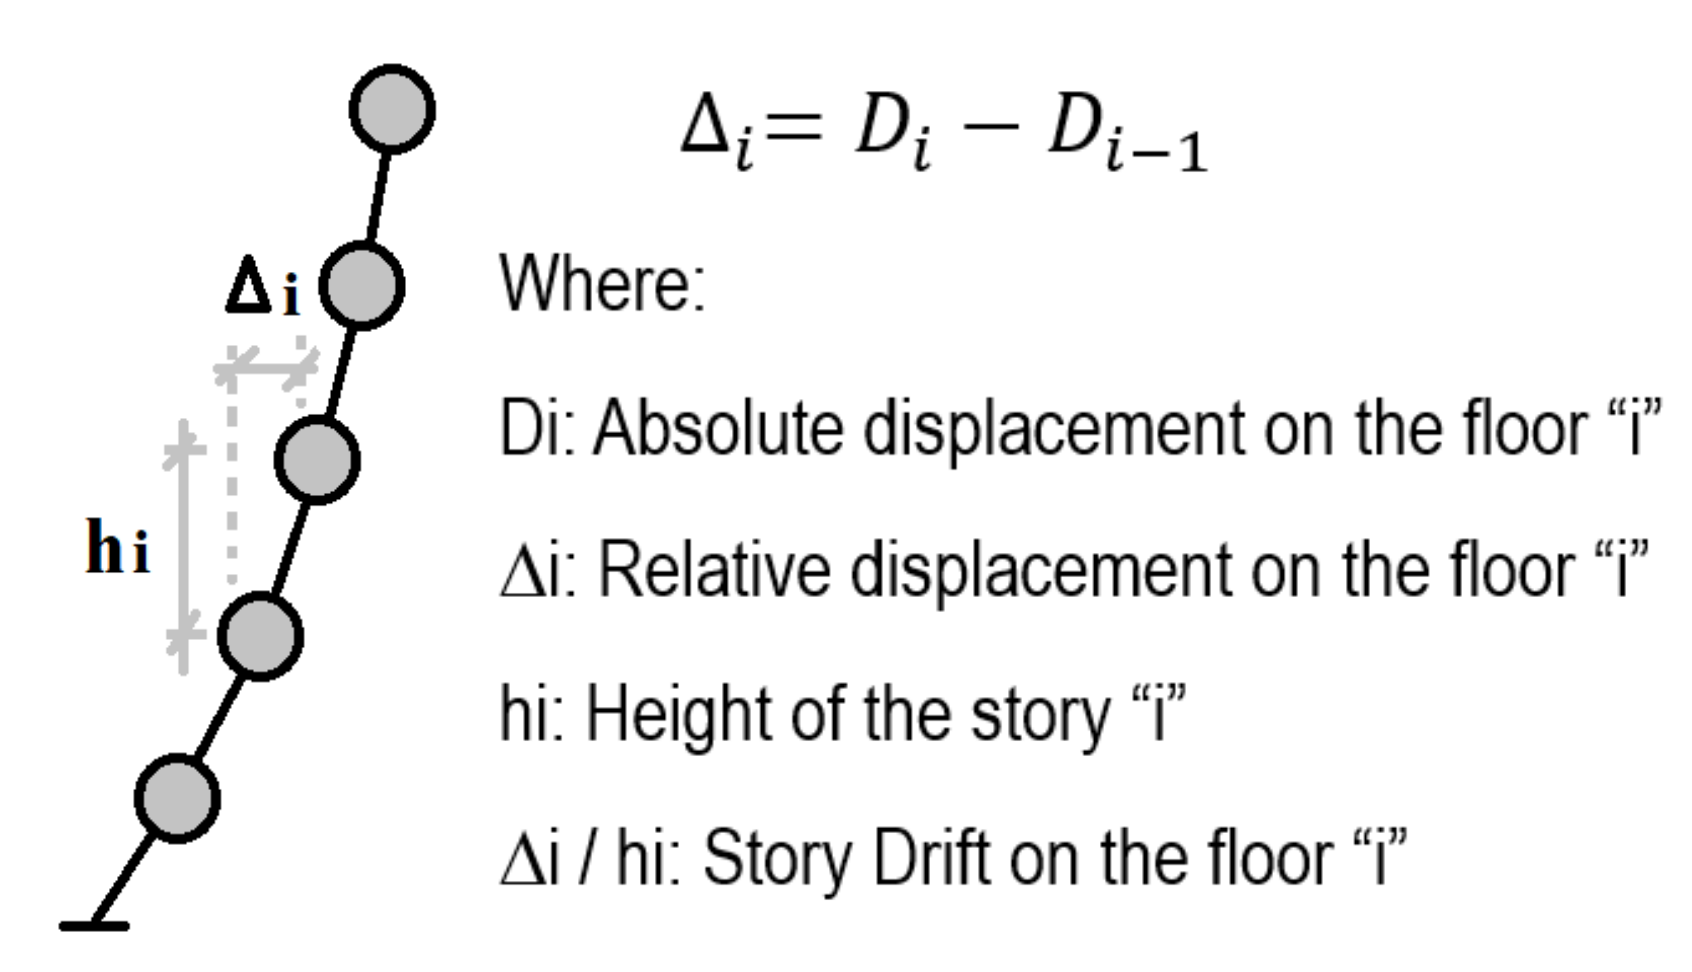
2.1. Structural Model and Structural Responses for Damage Identification
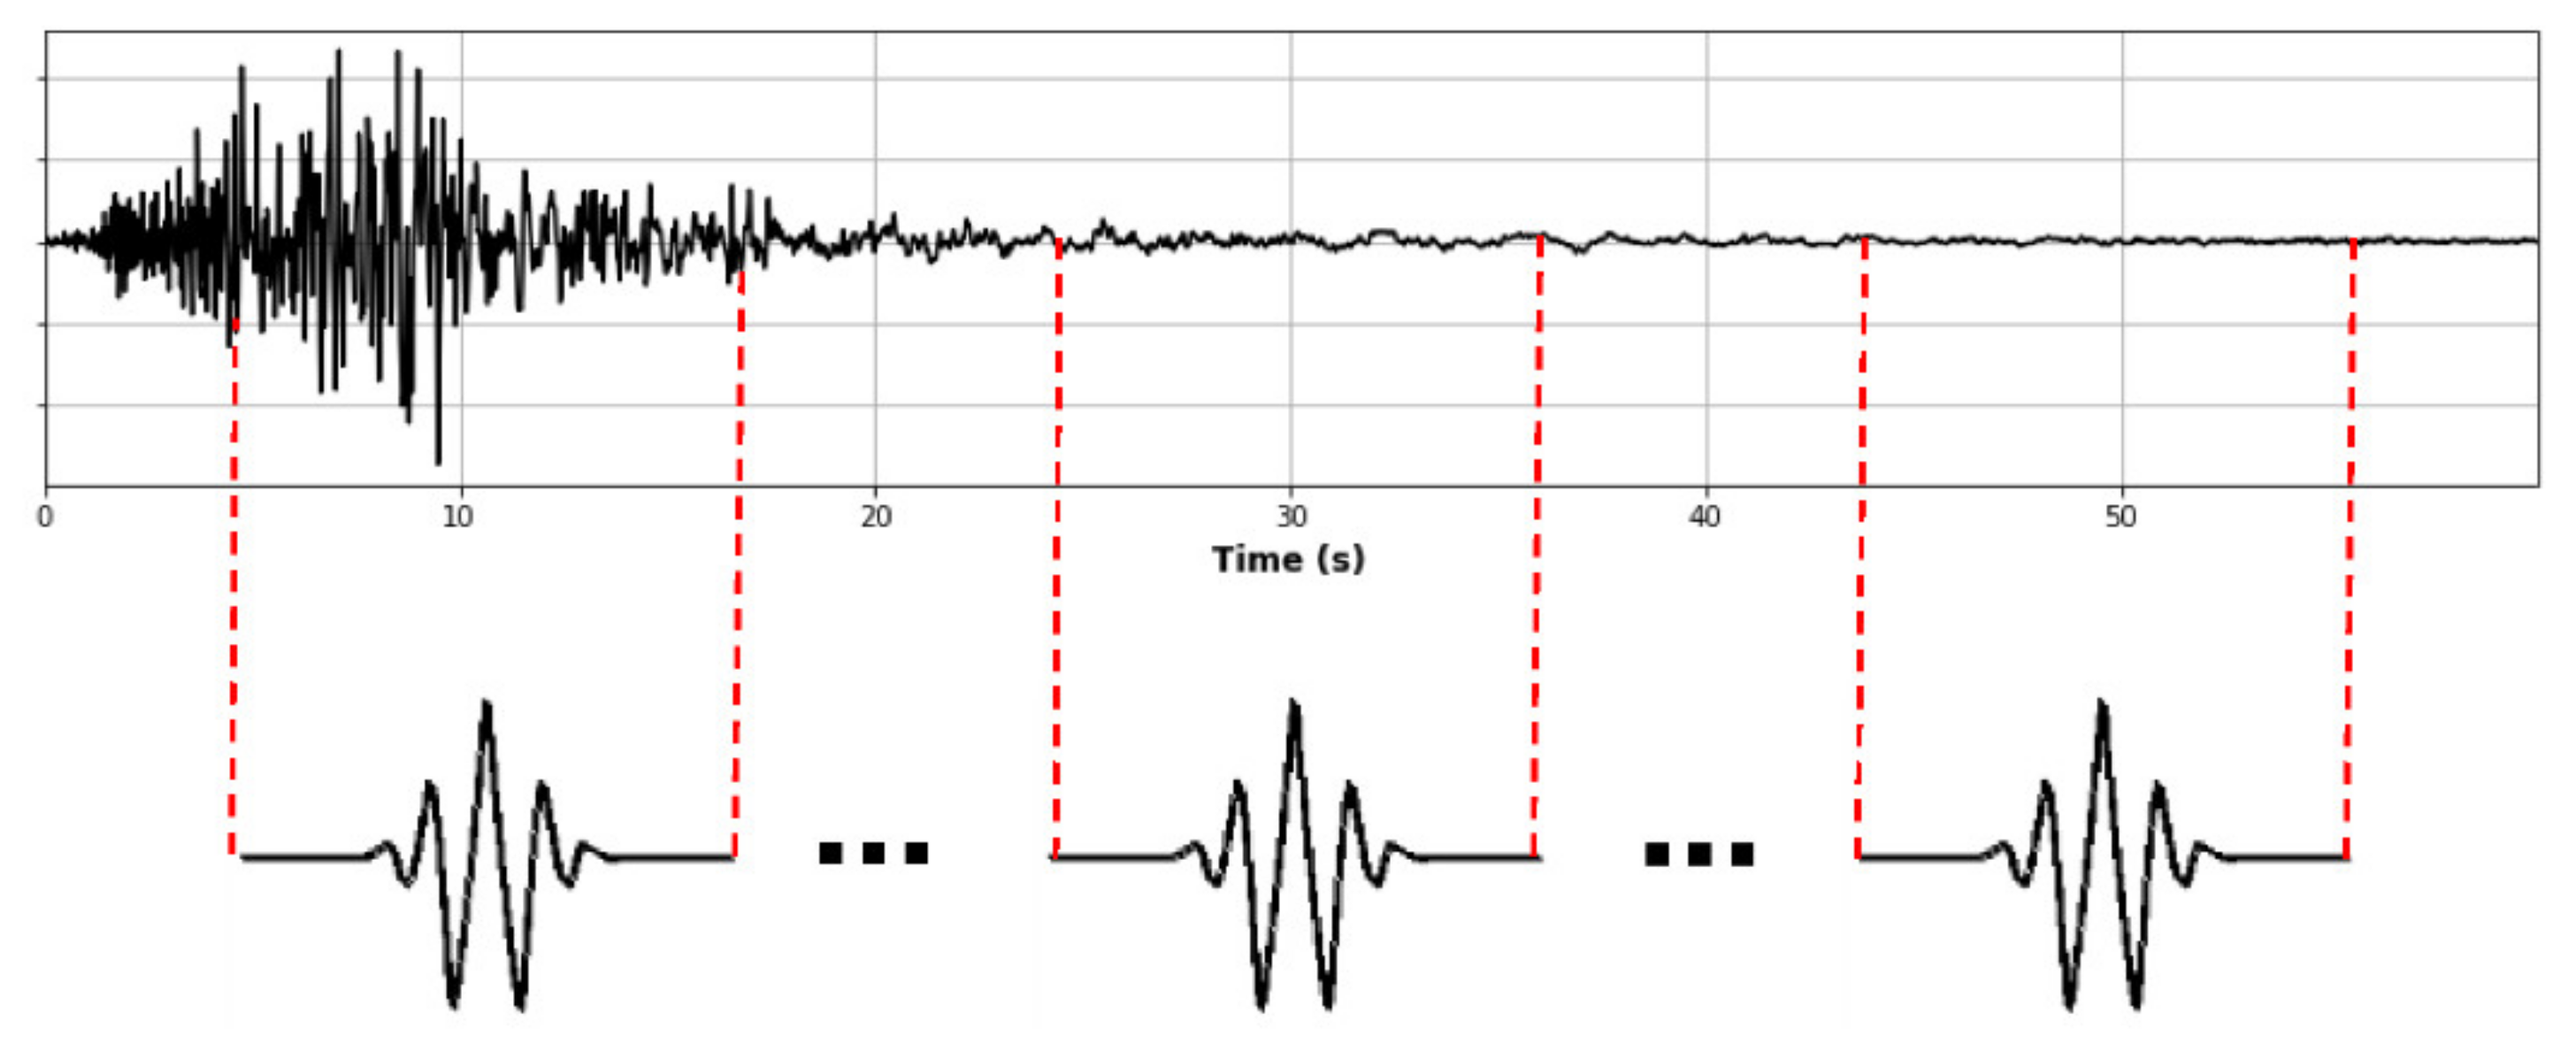
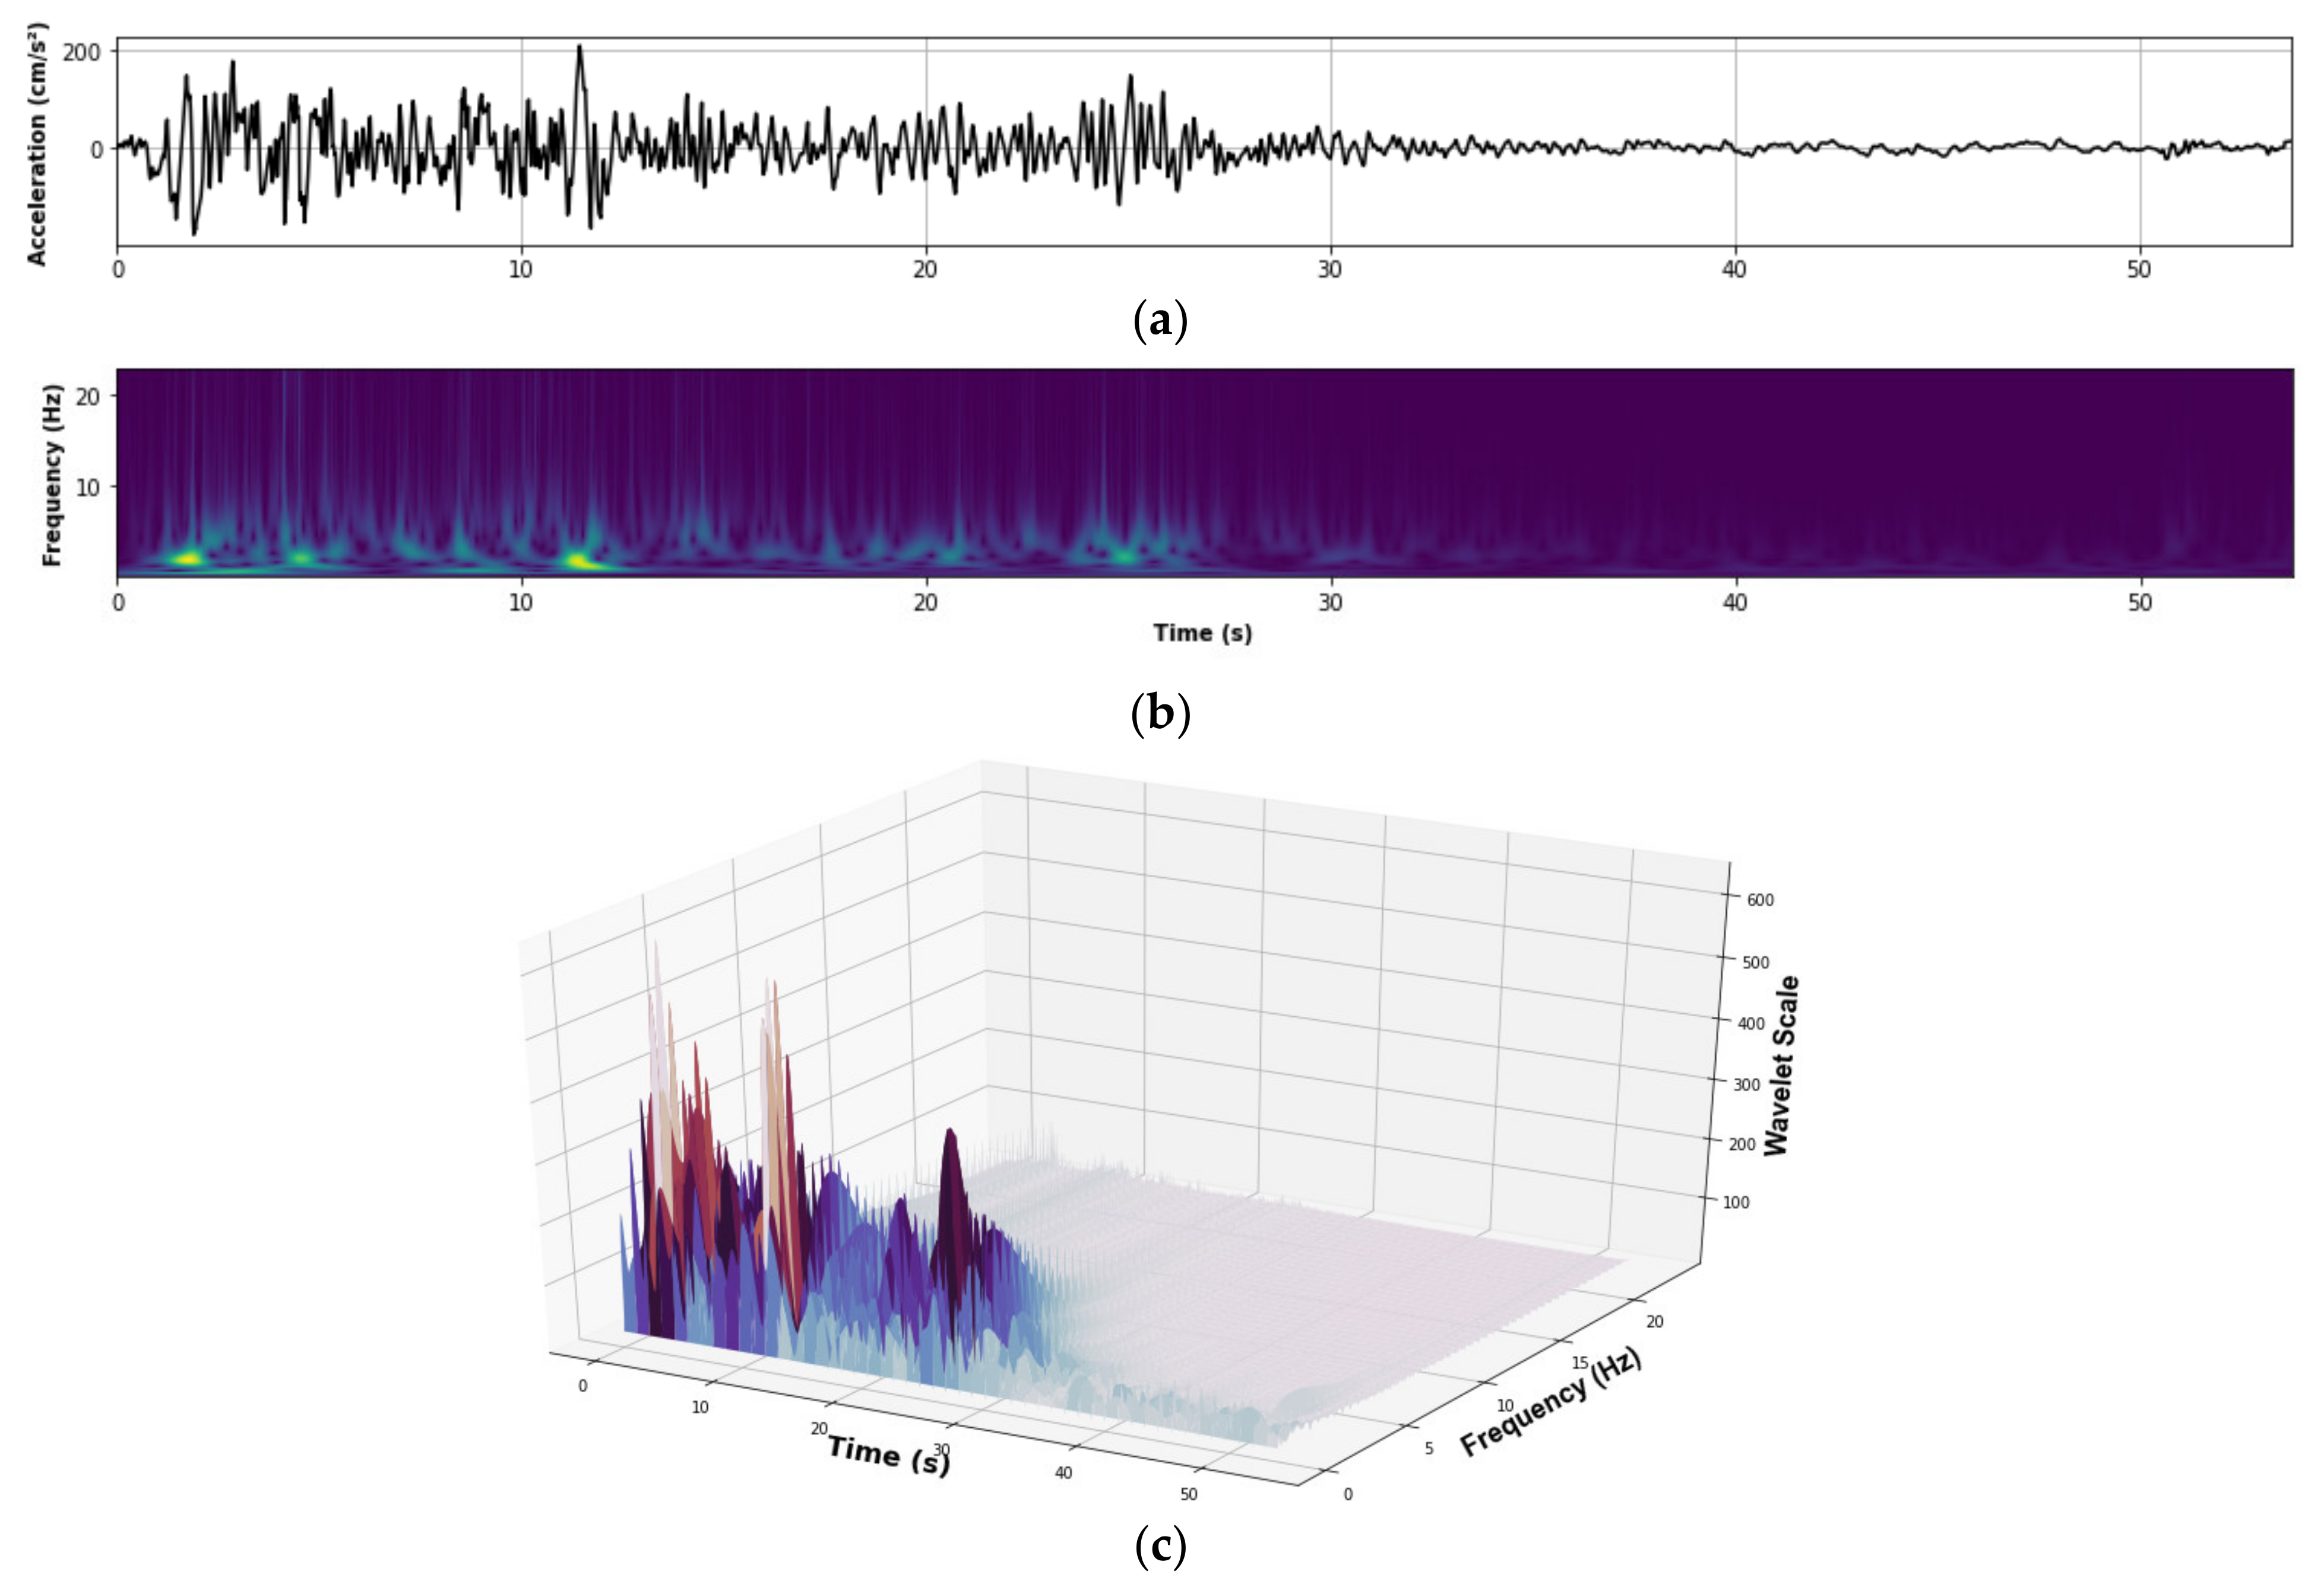
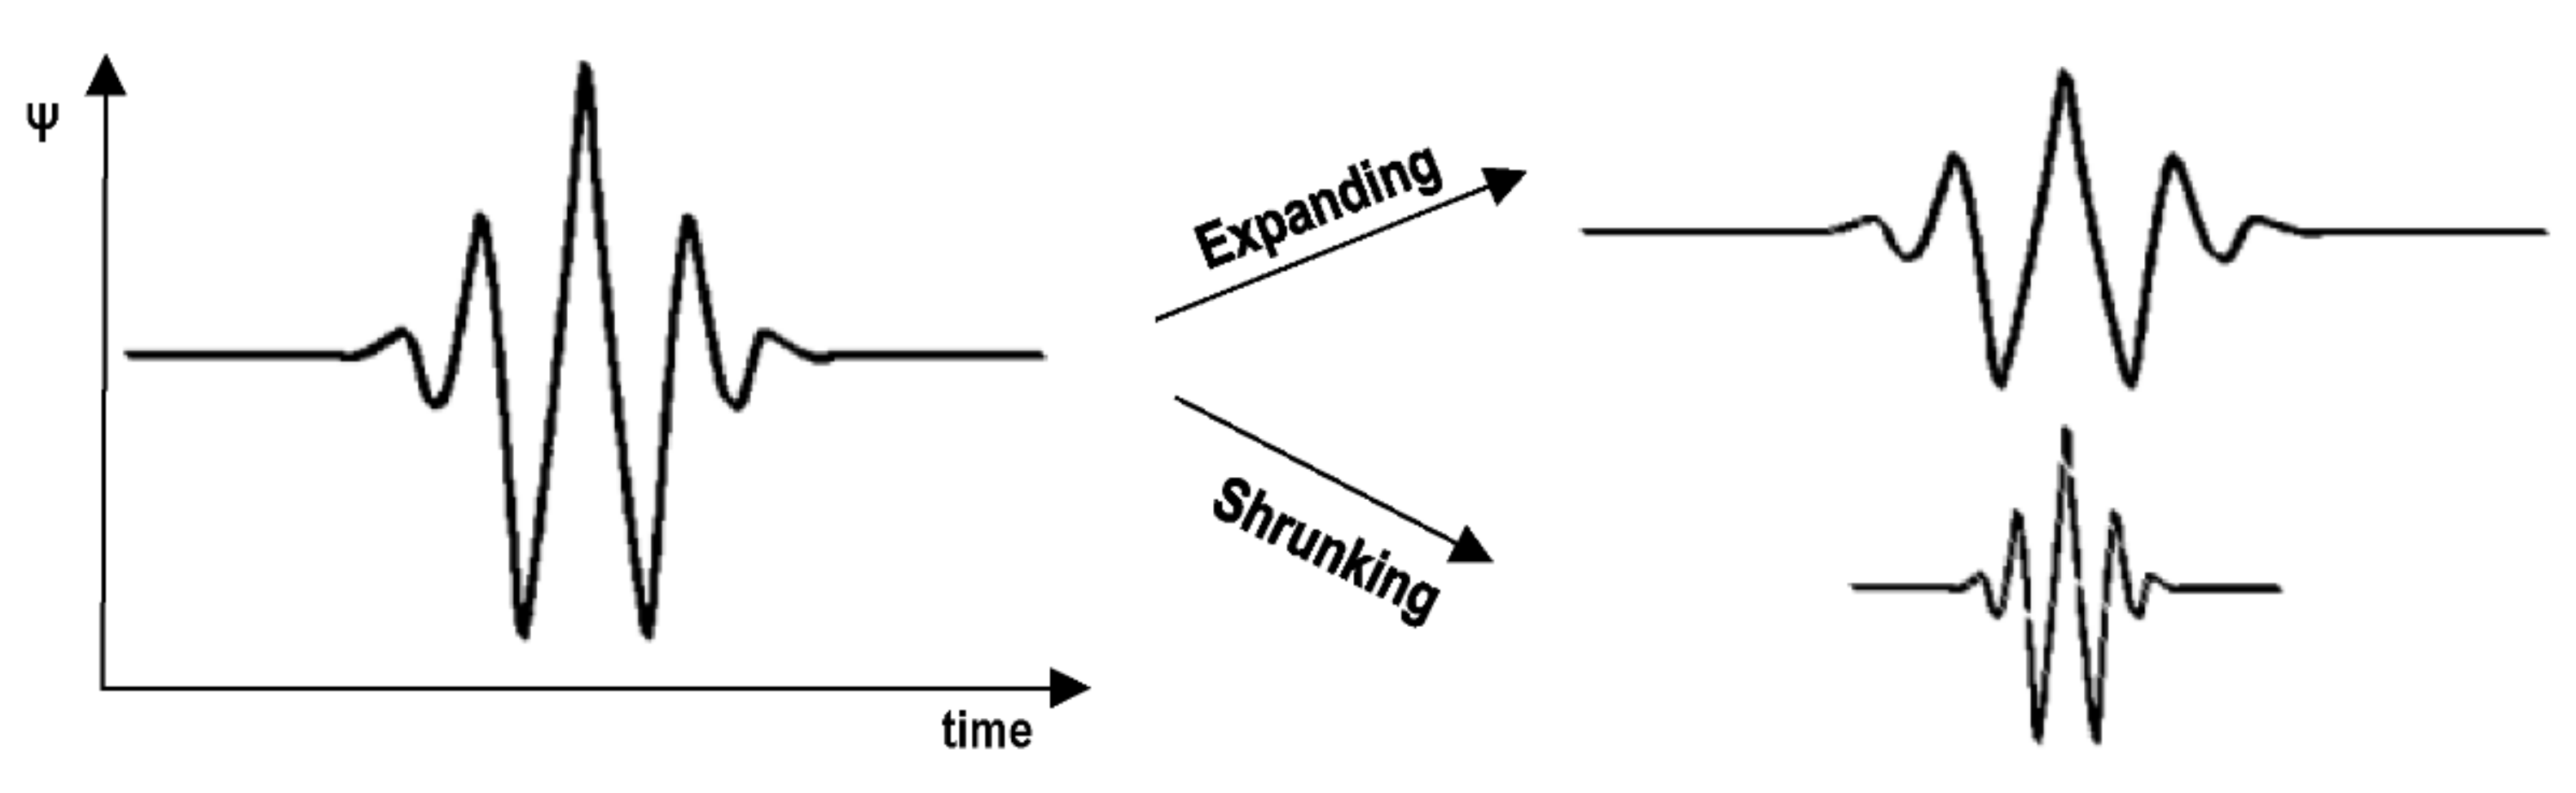
2.2. Wavelet Spectrum
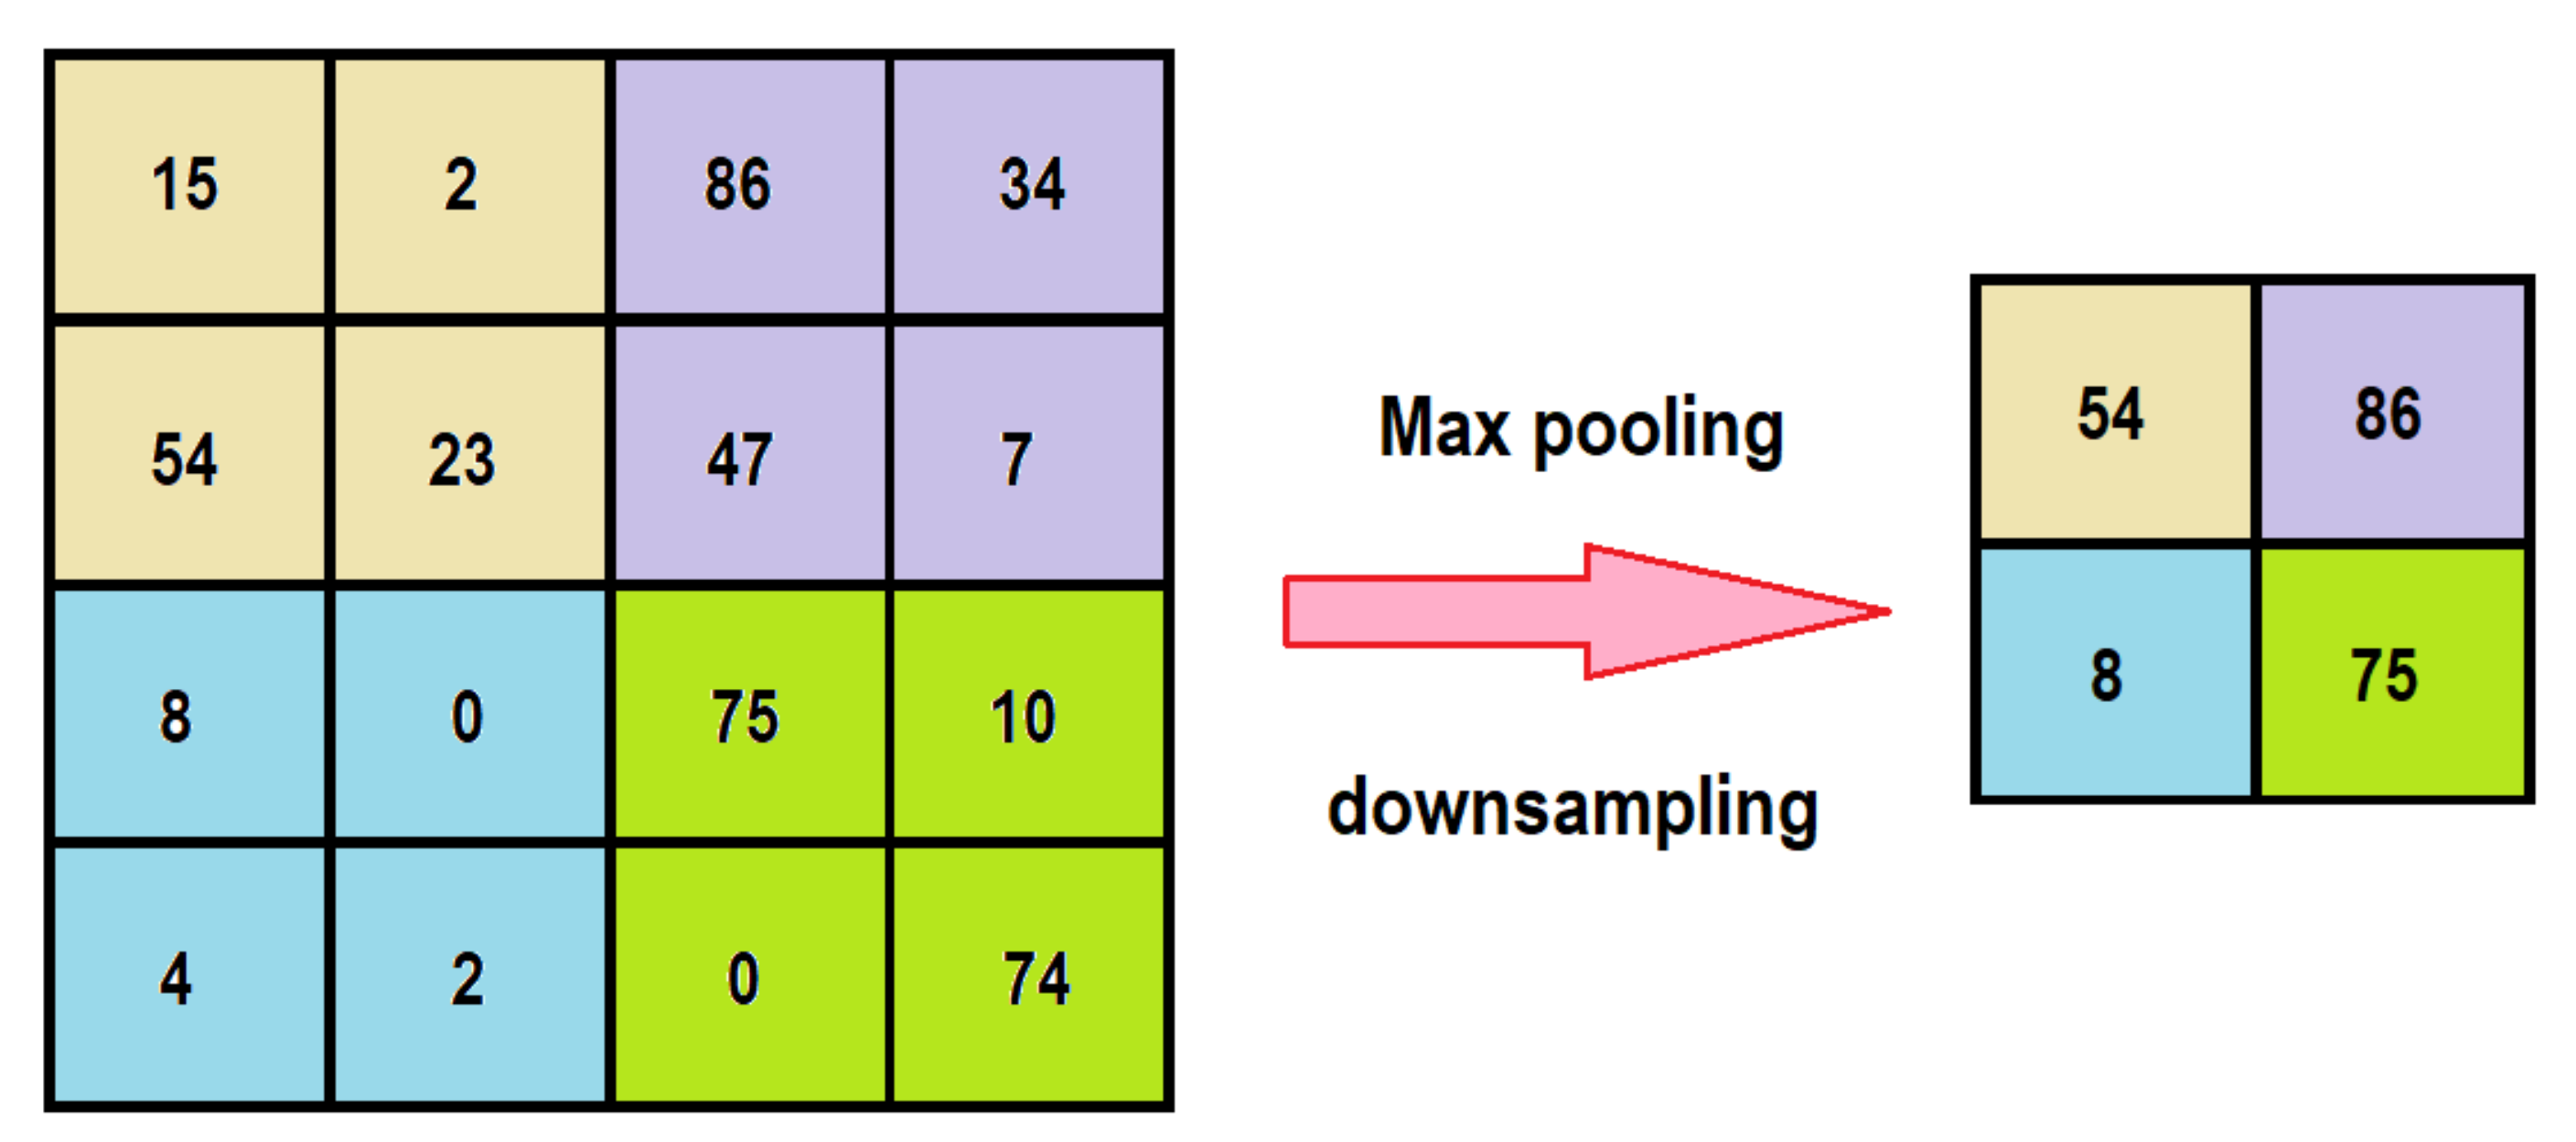
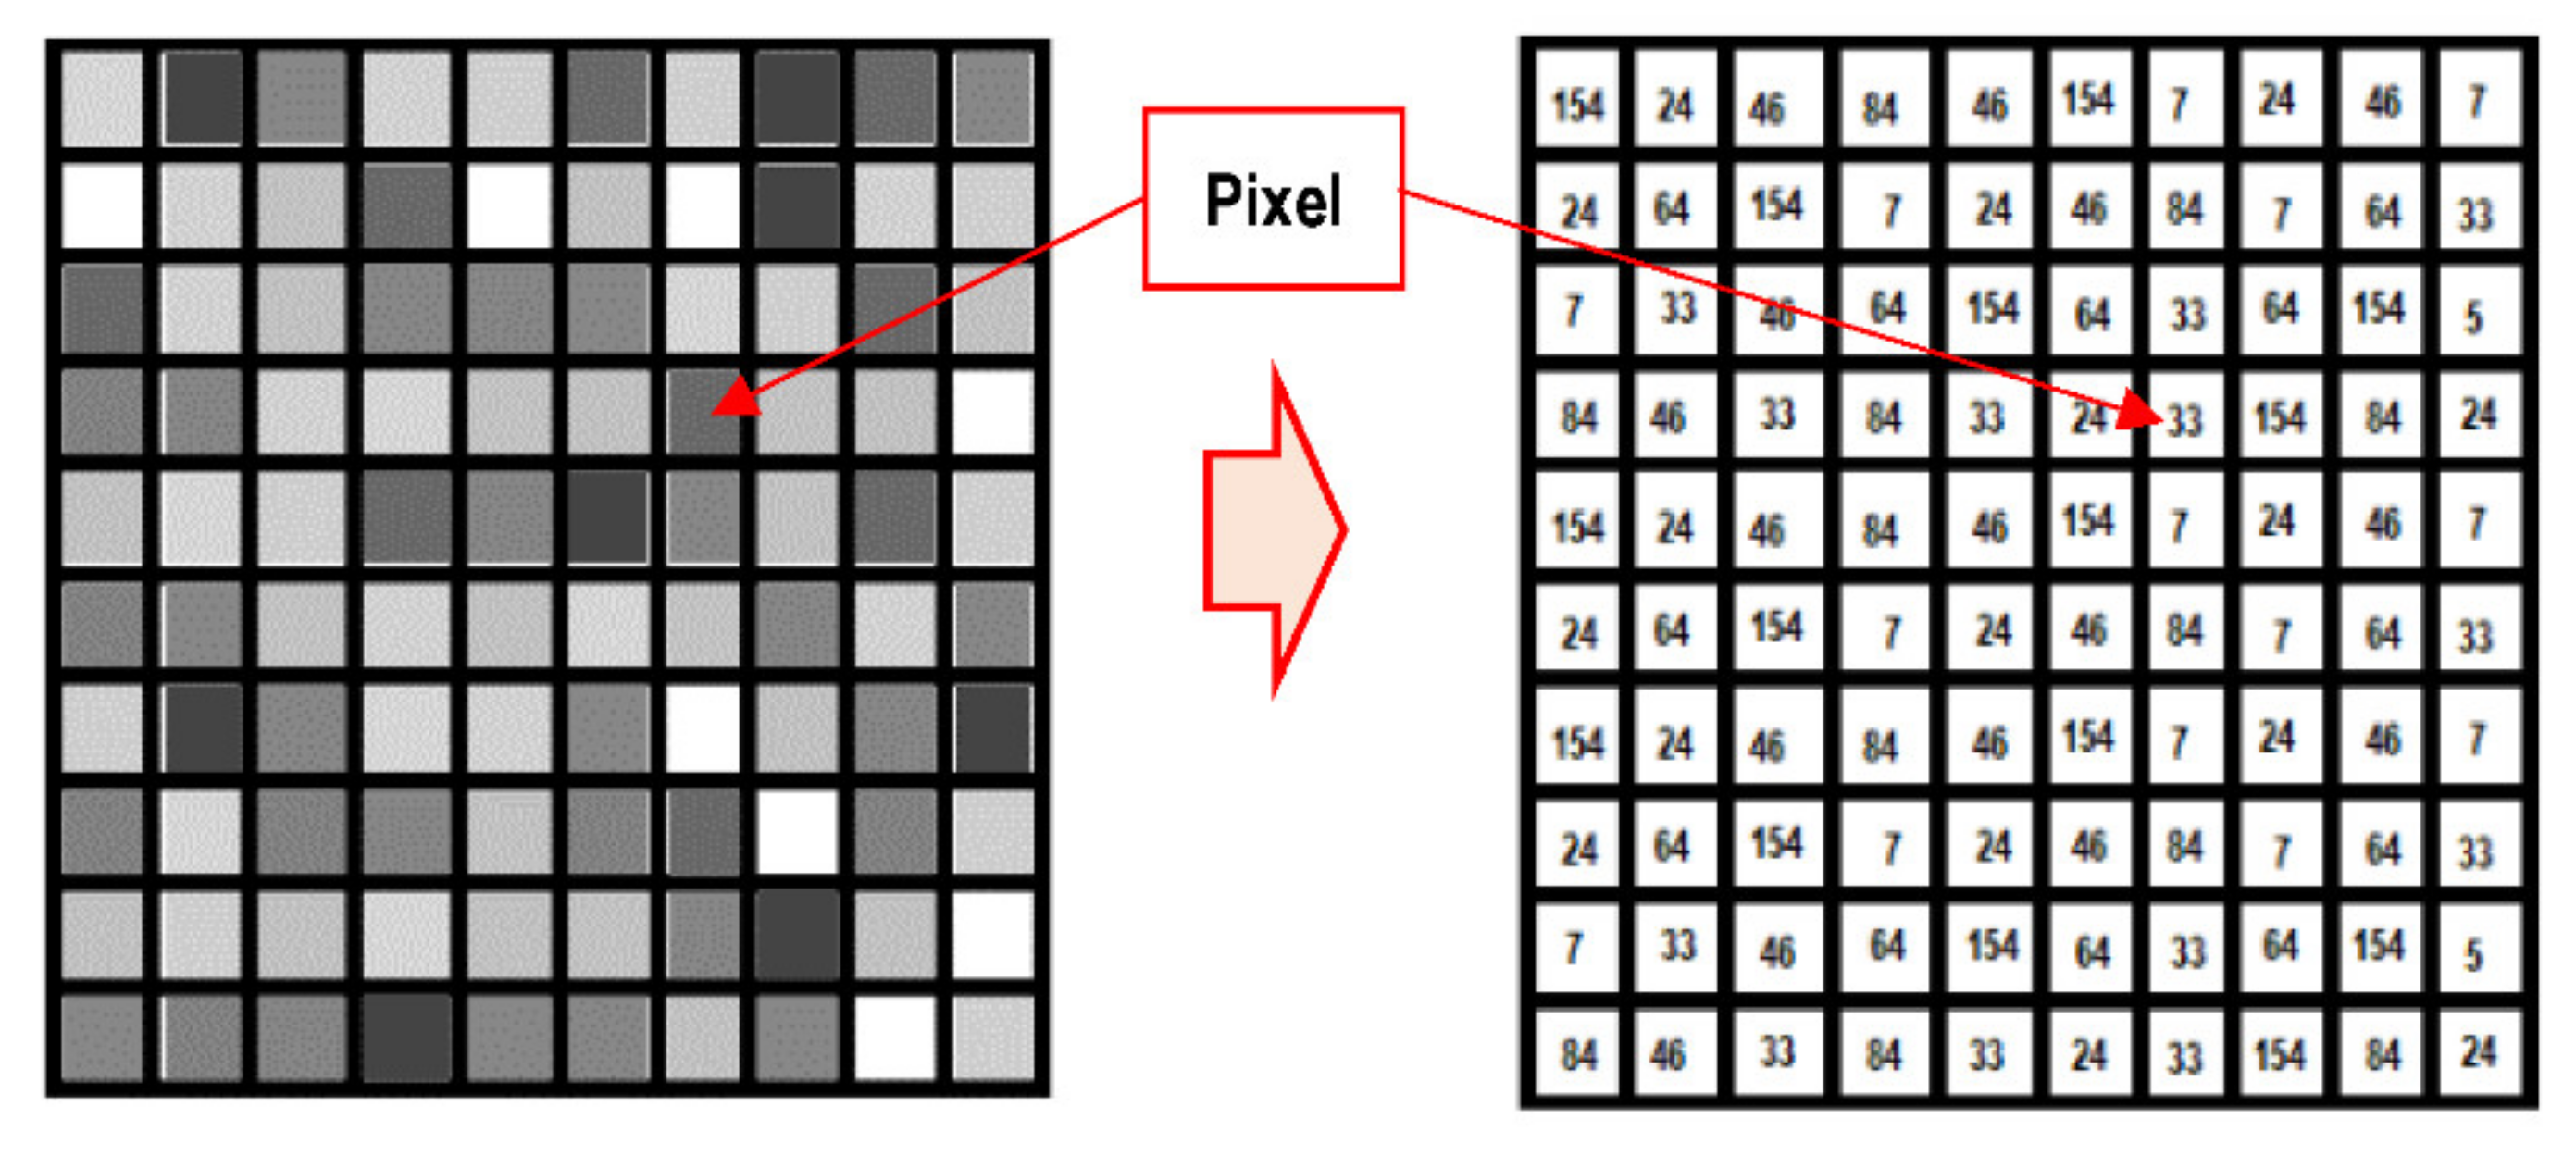
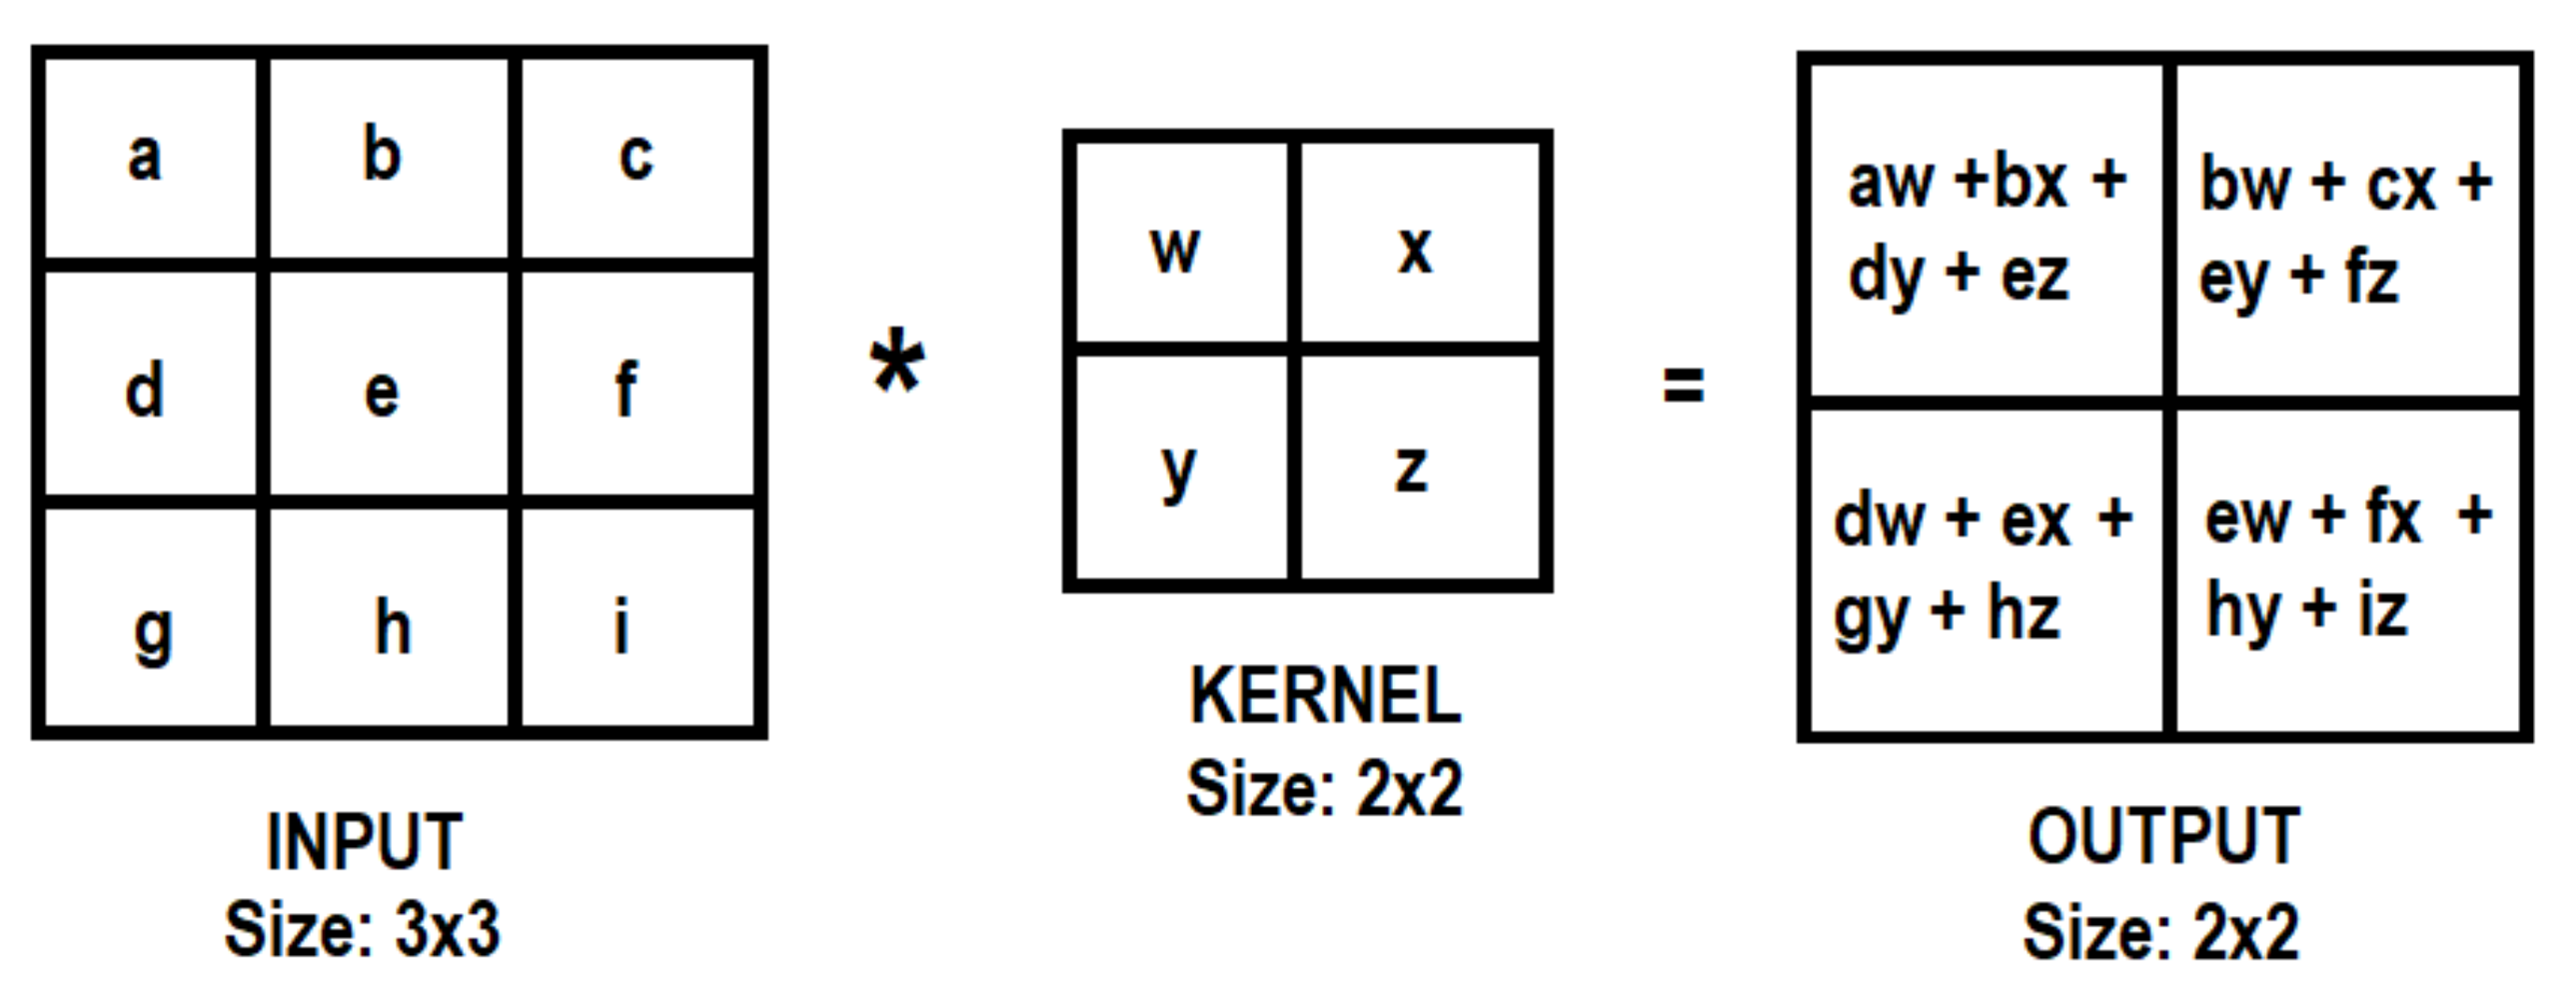
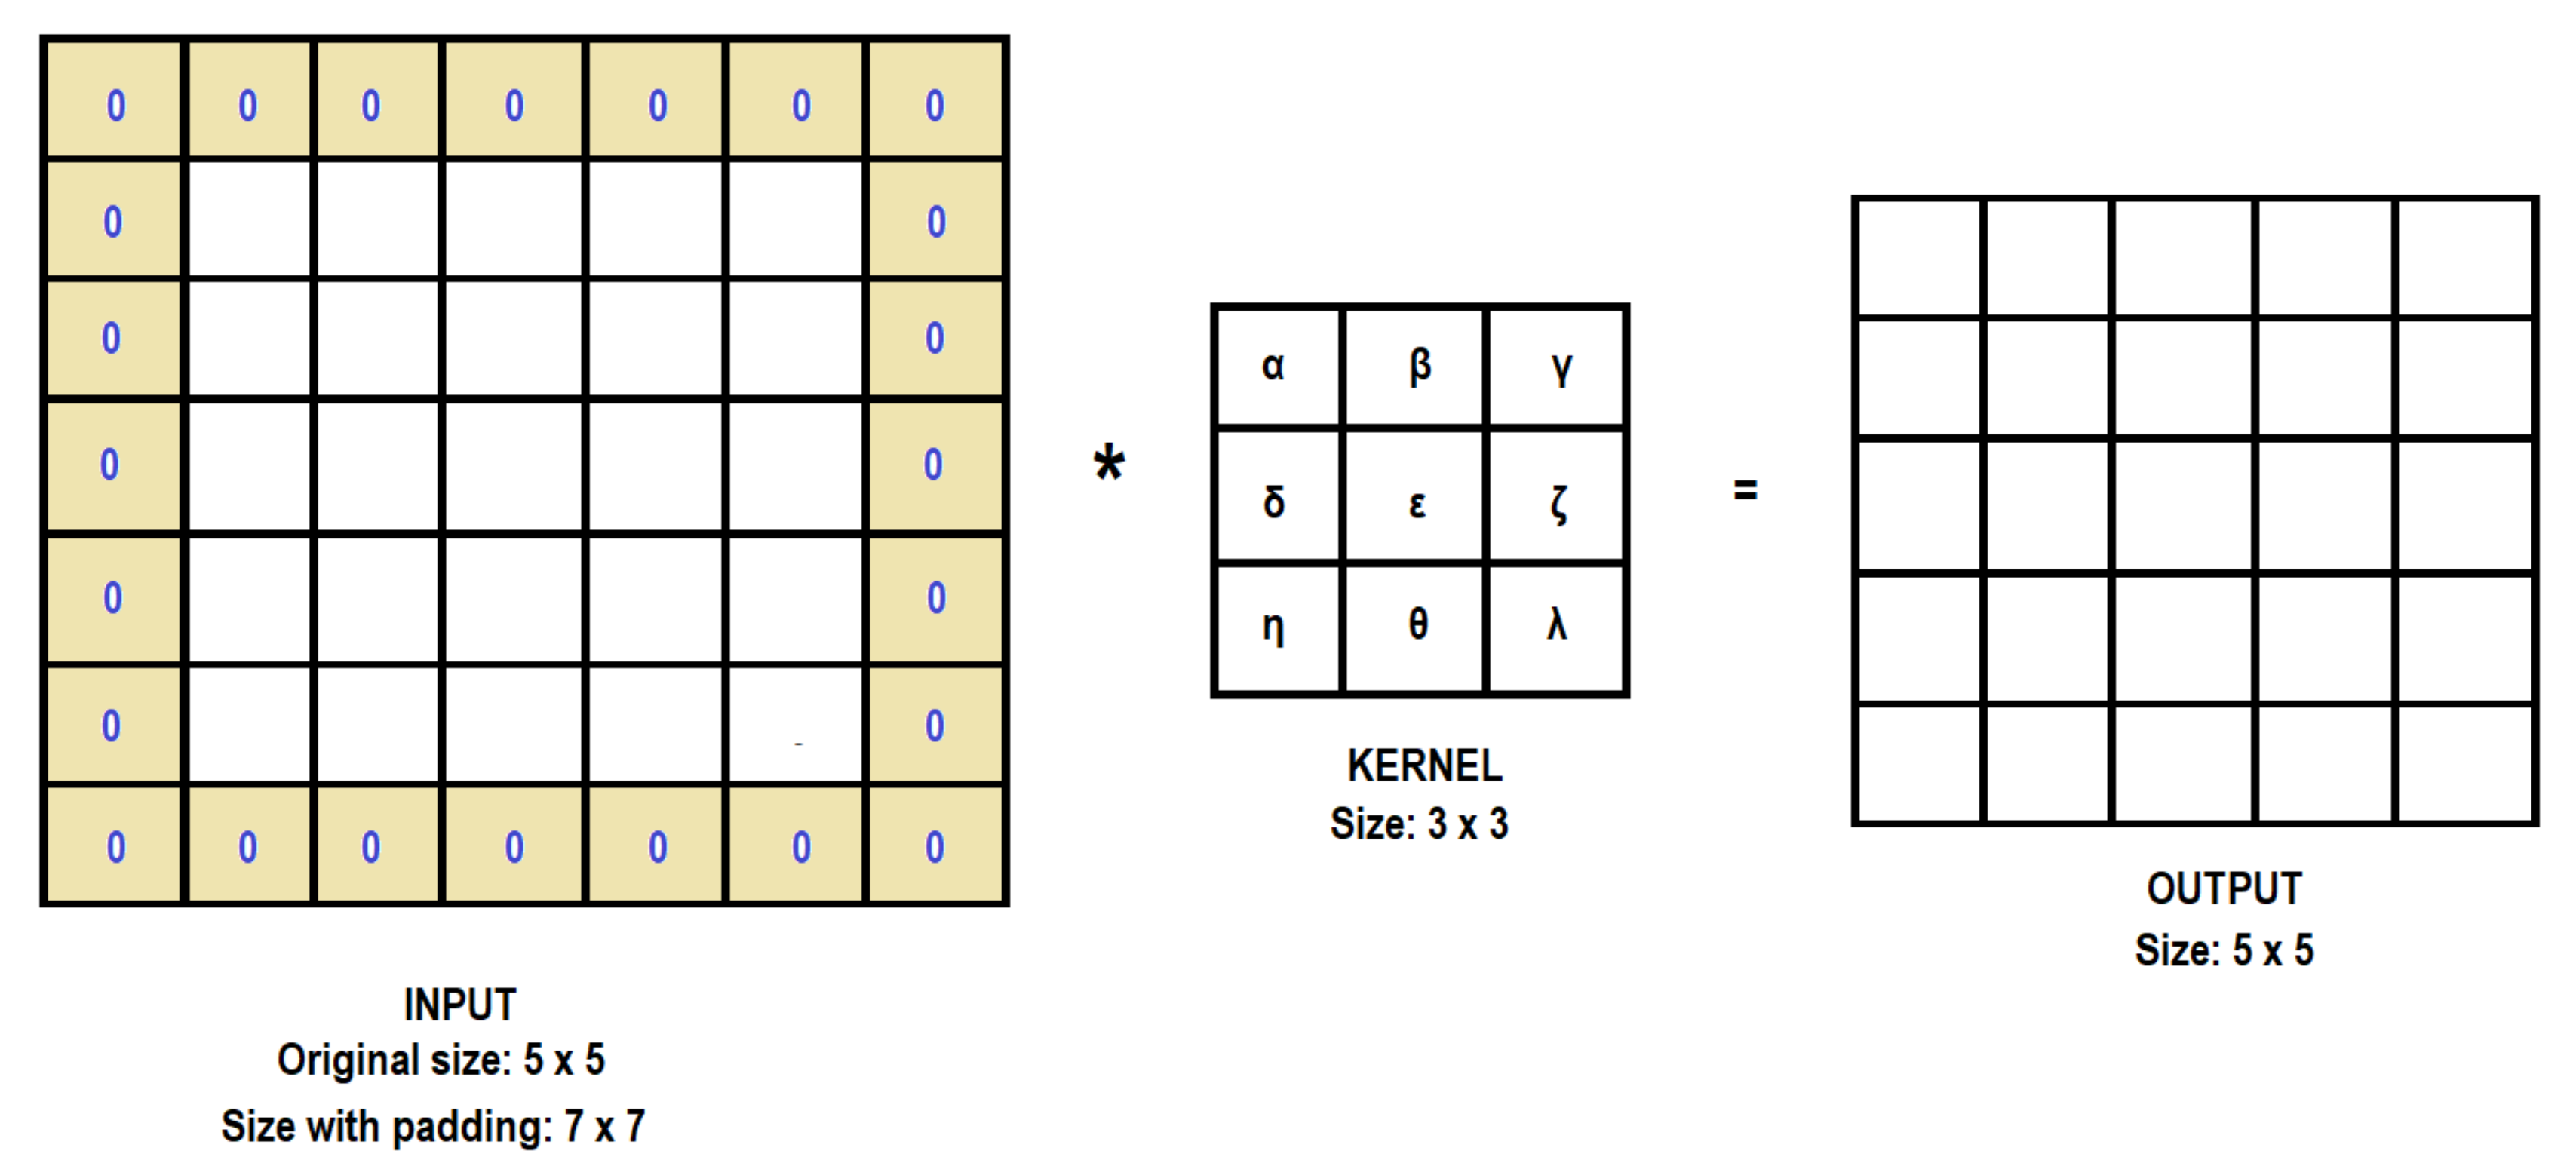
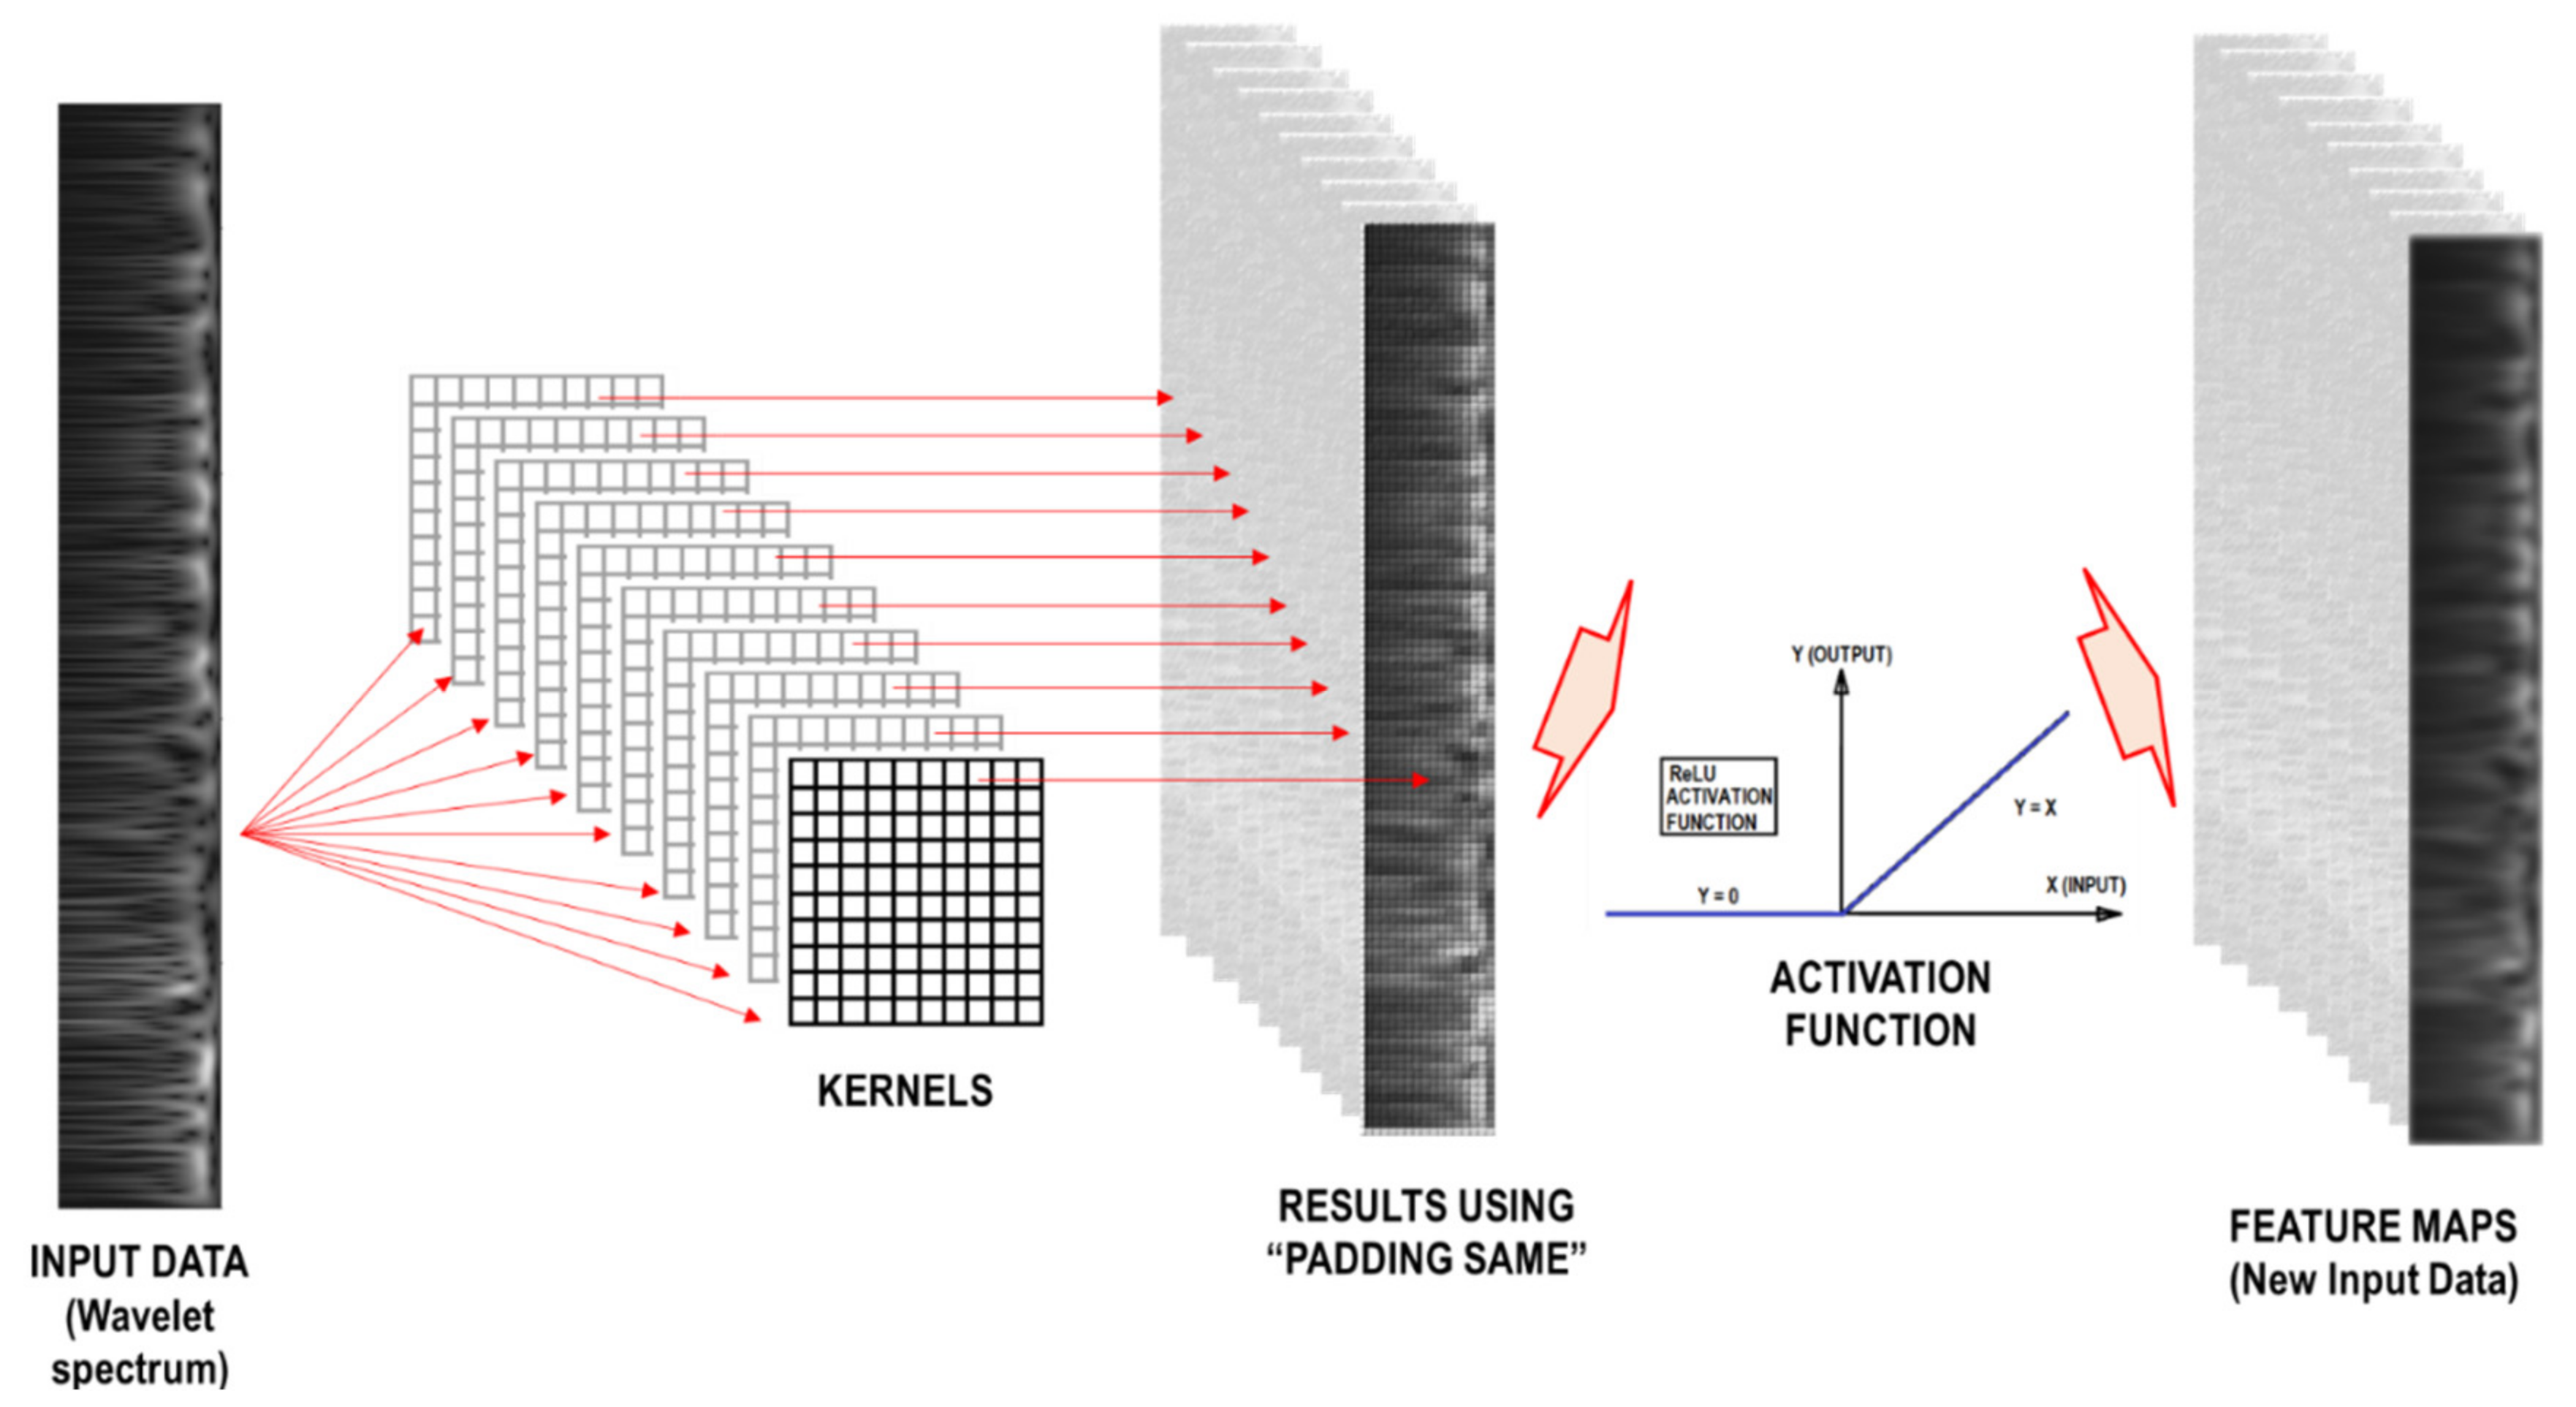
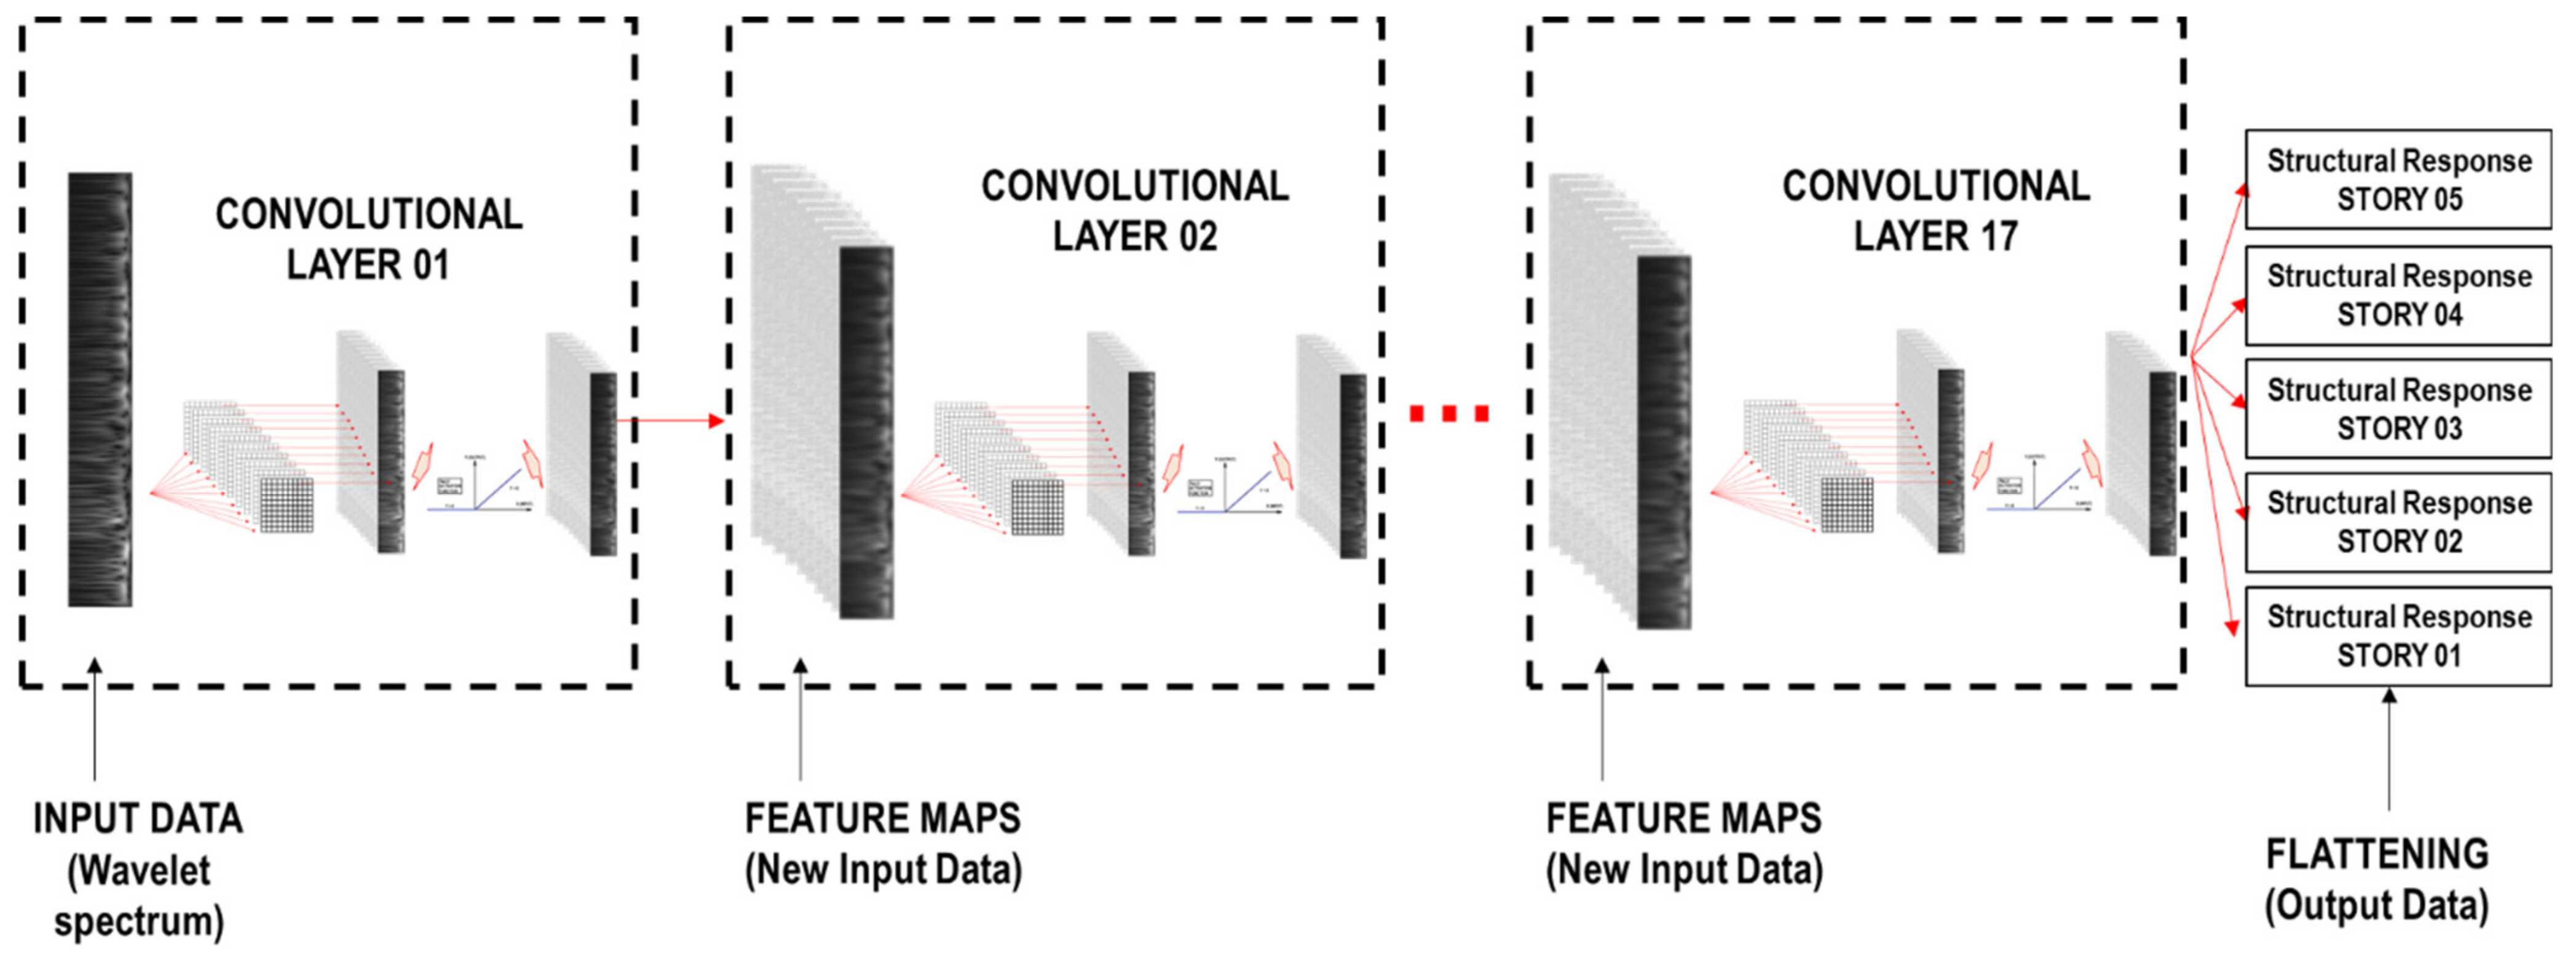
2.3. Convolutional Neural Network (CNN)
2.4. Case Study and Input Ground Motion
2.4.1. Case Study
- The fundamental period is considered the following: T1 = 0.025 H (H: total height of the building). The height of each story (h) is considered to be 4.0 m, then, H is 20 m and T1 is 0.5 s.
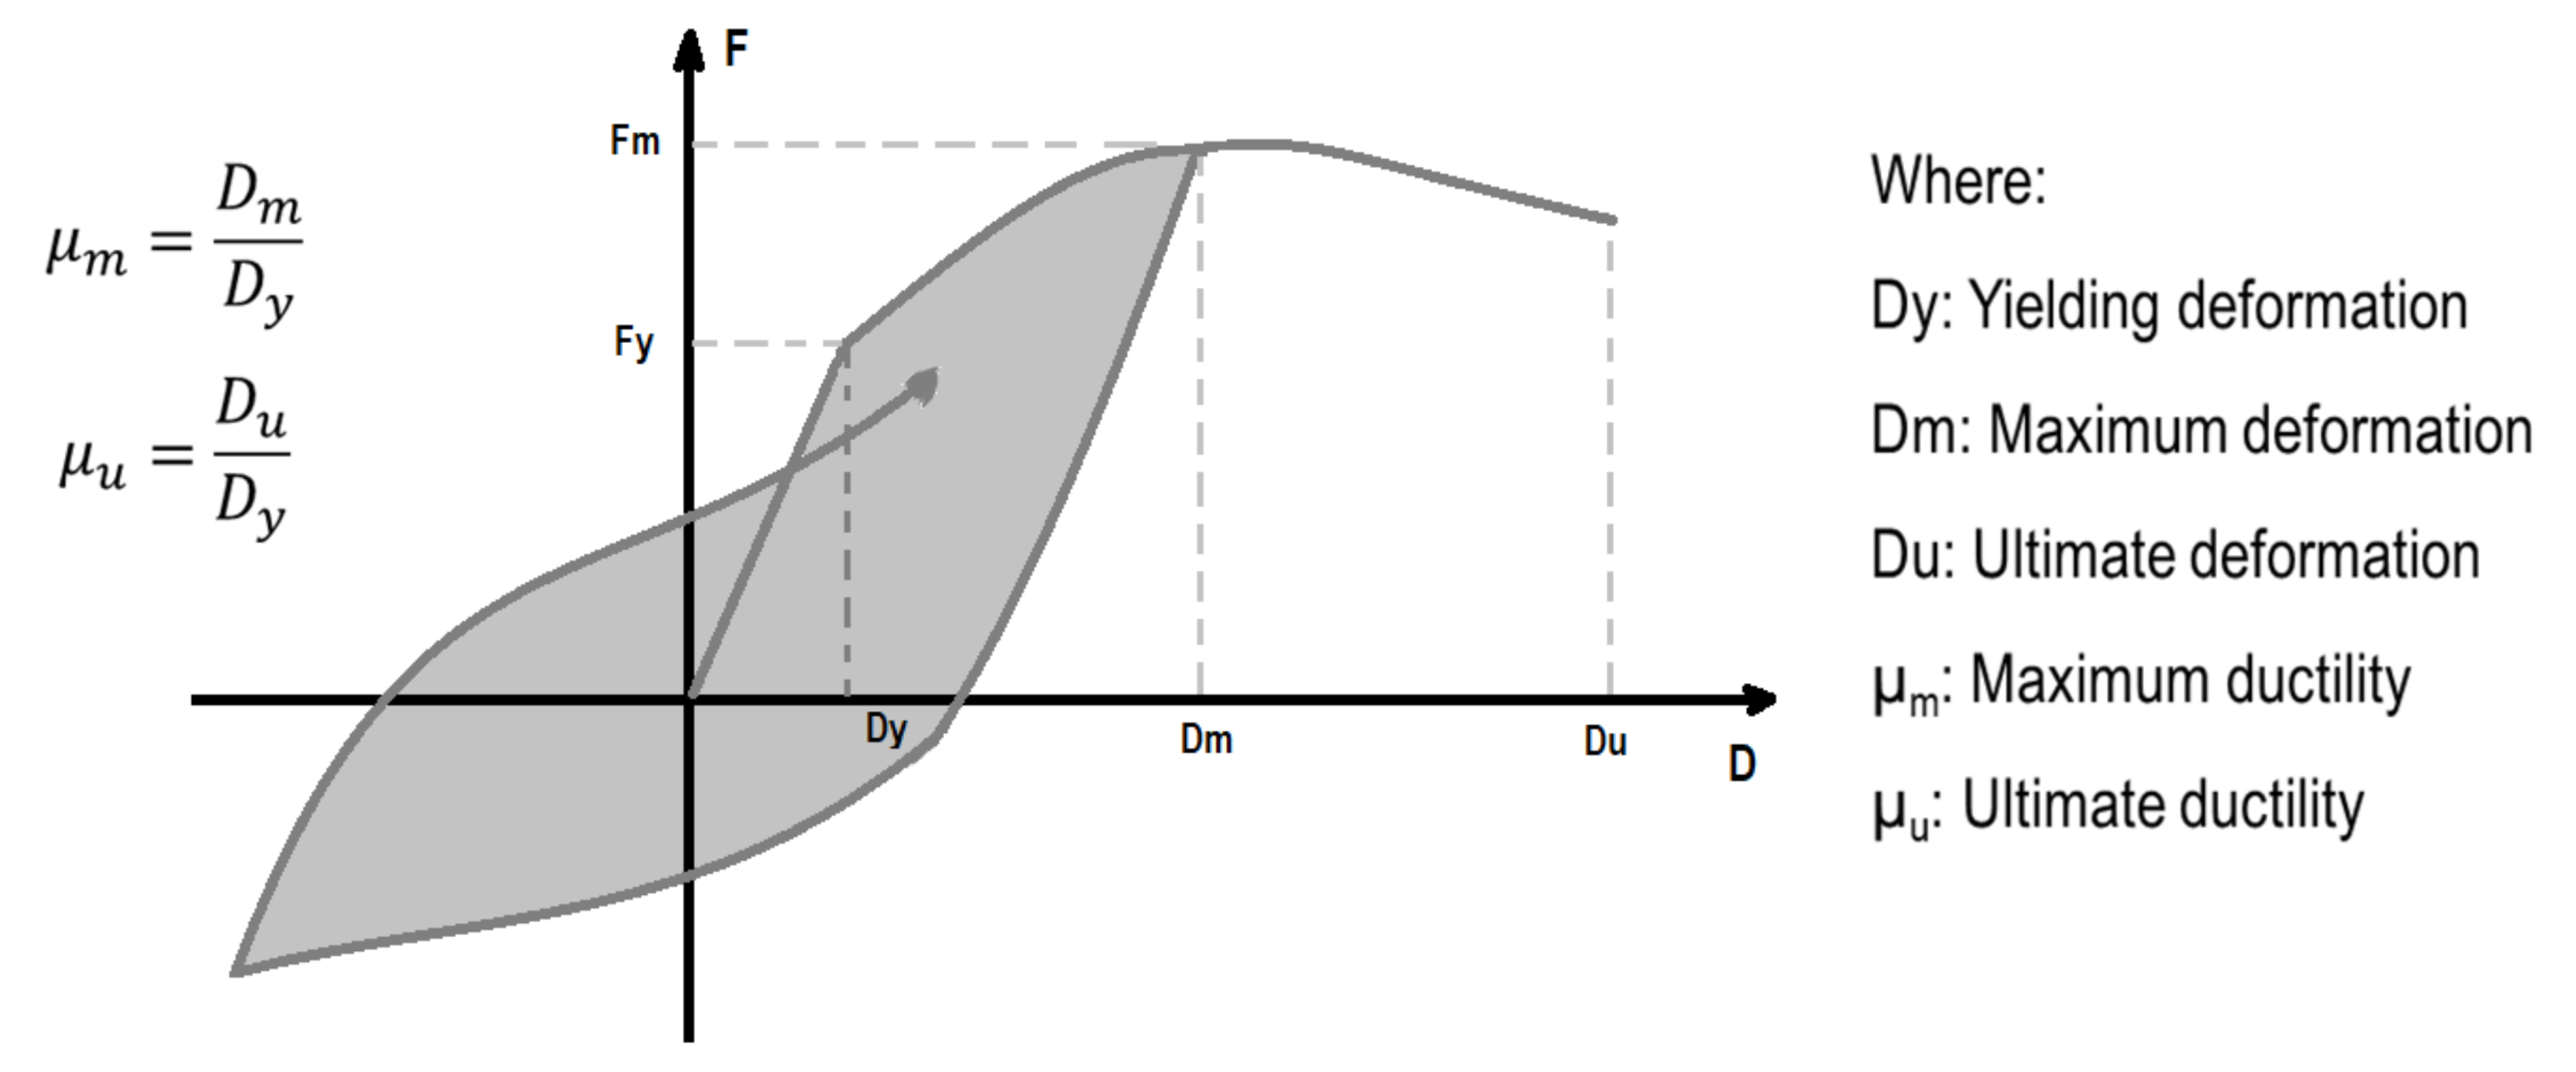
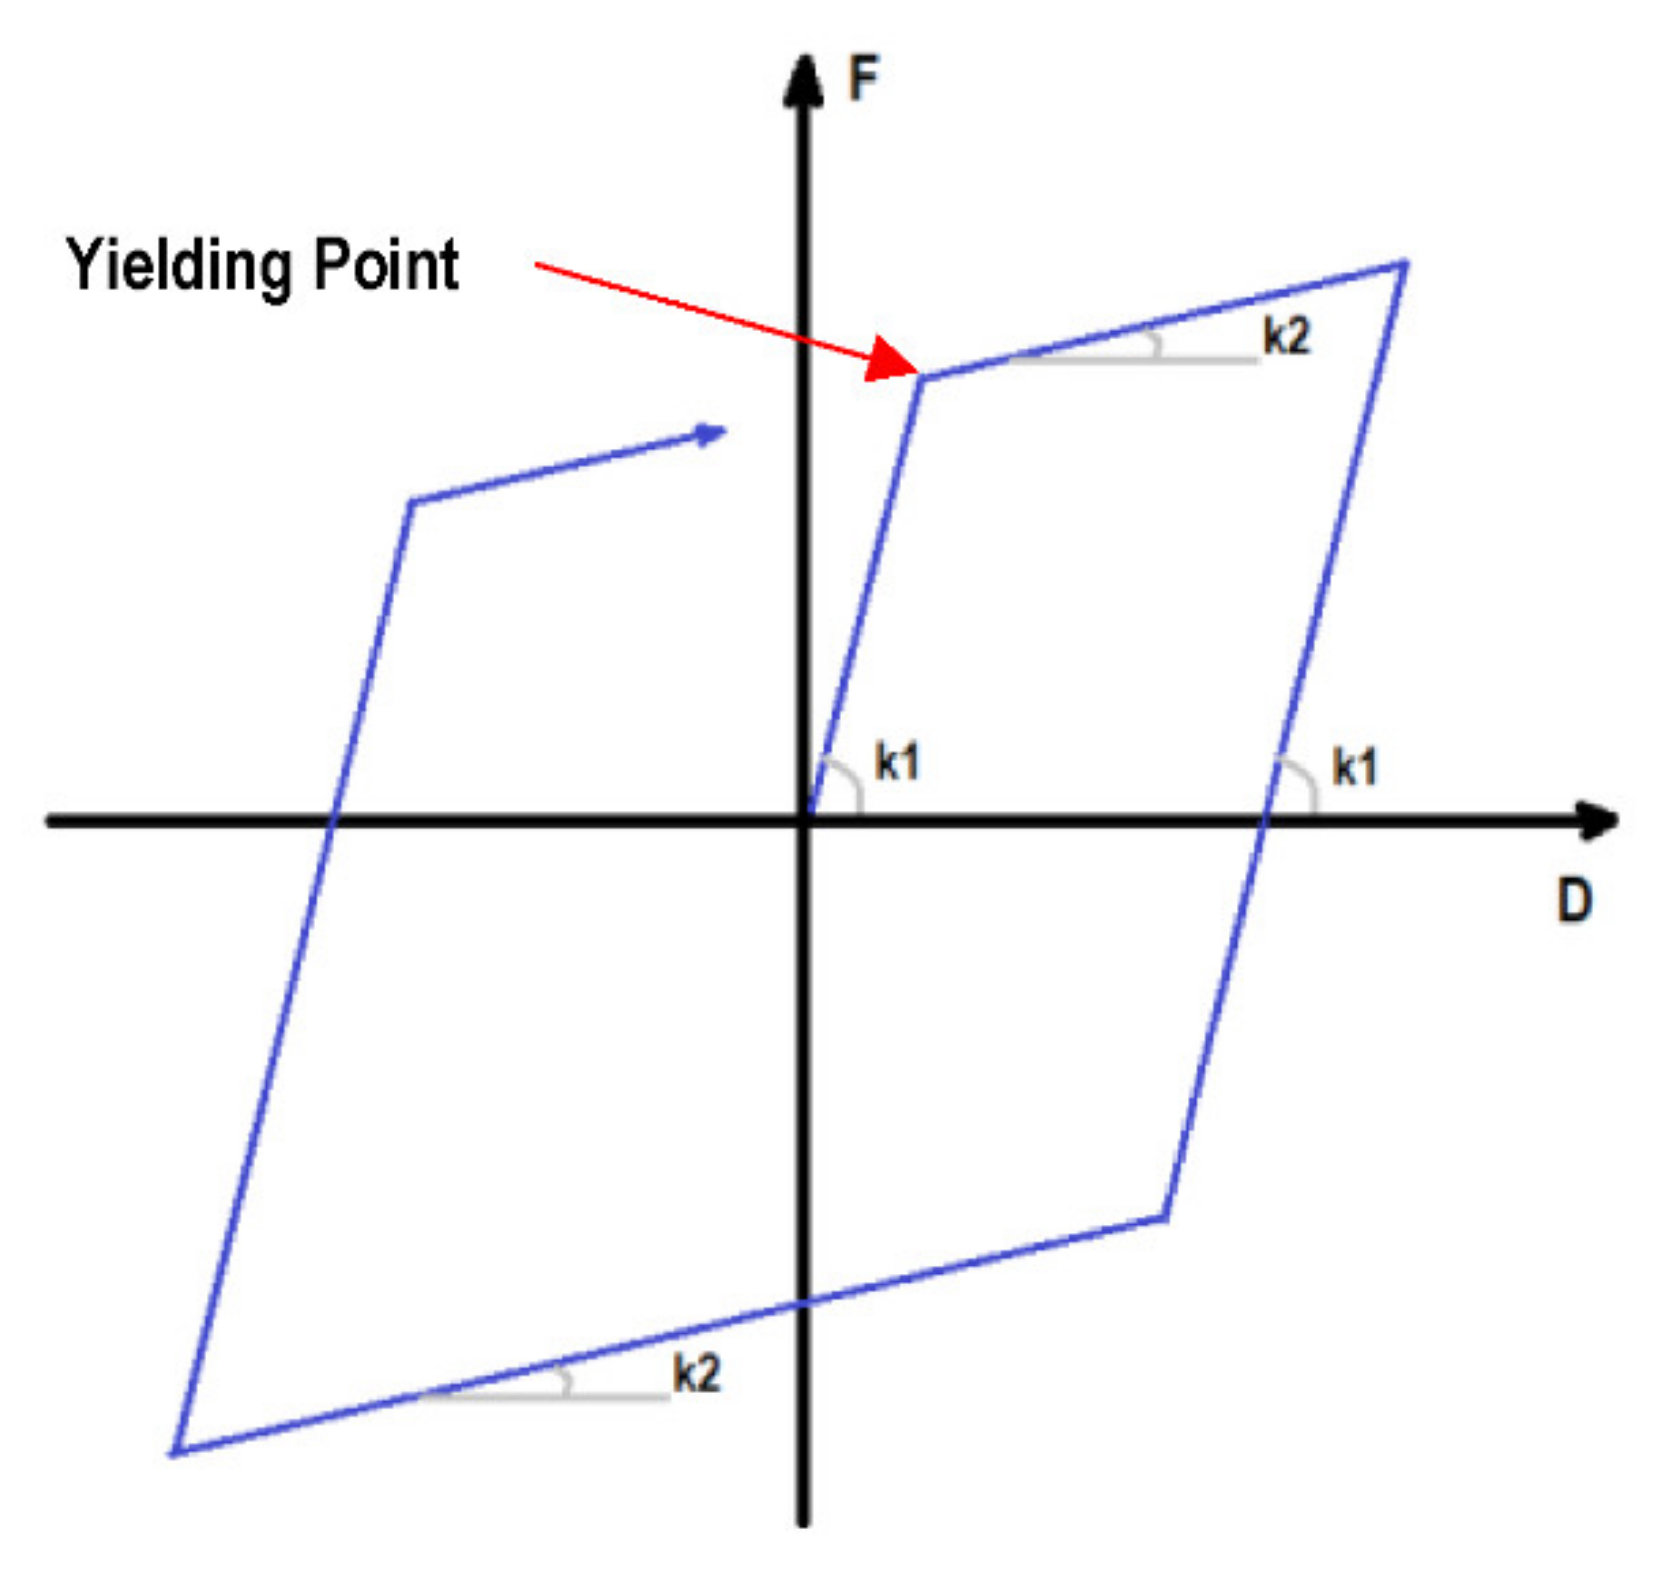
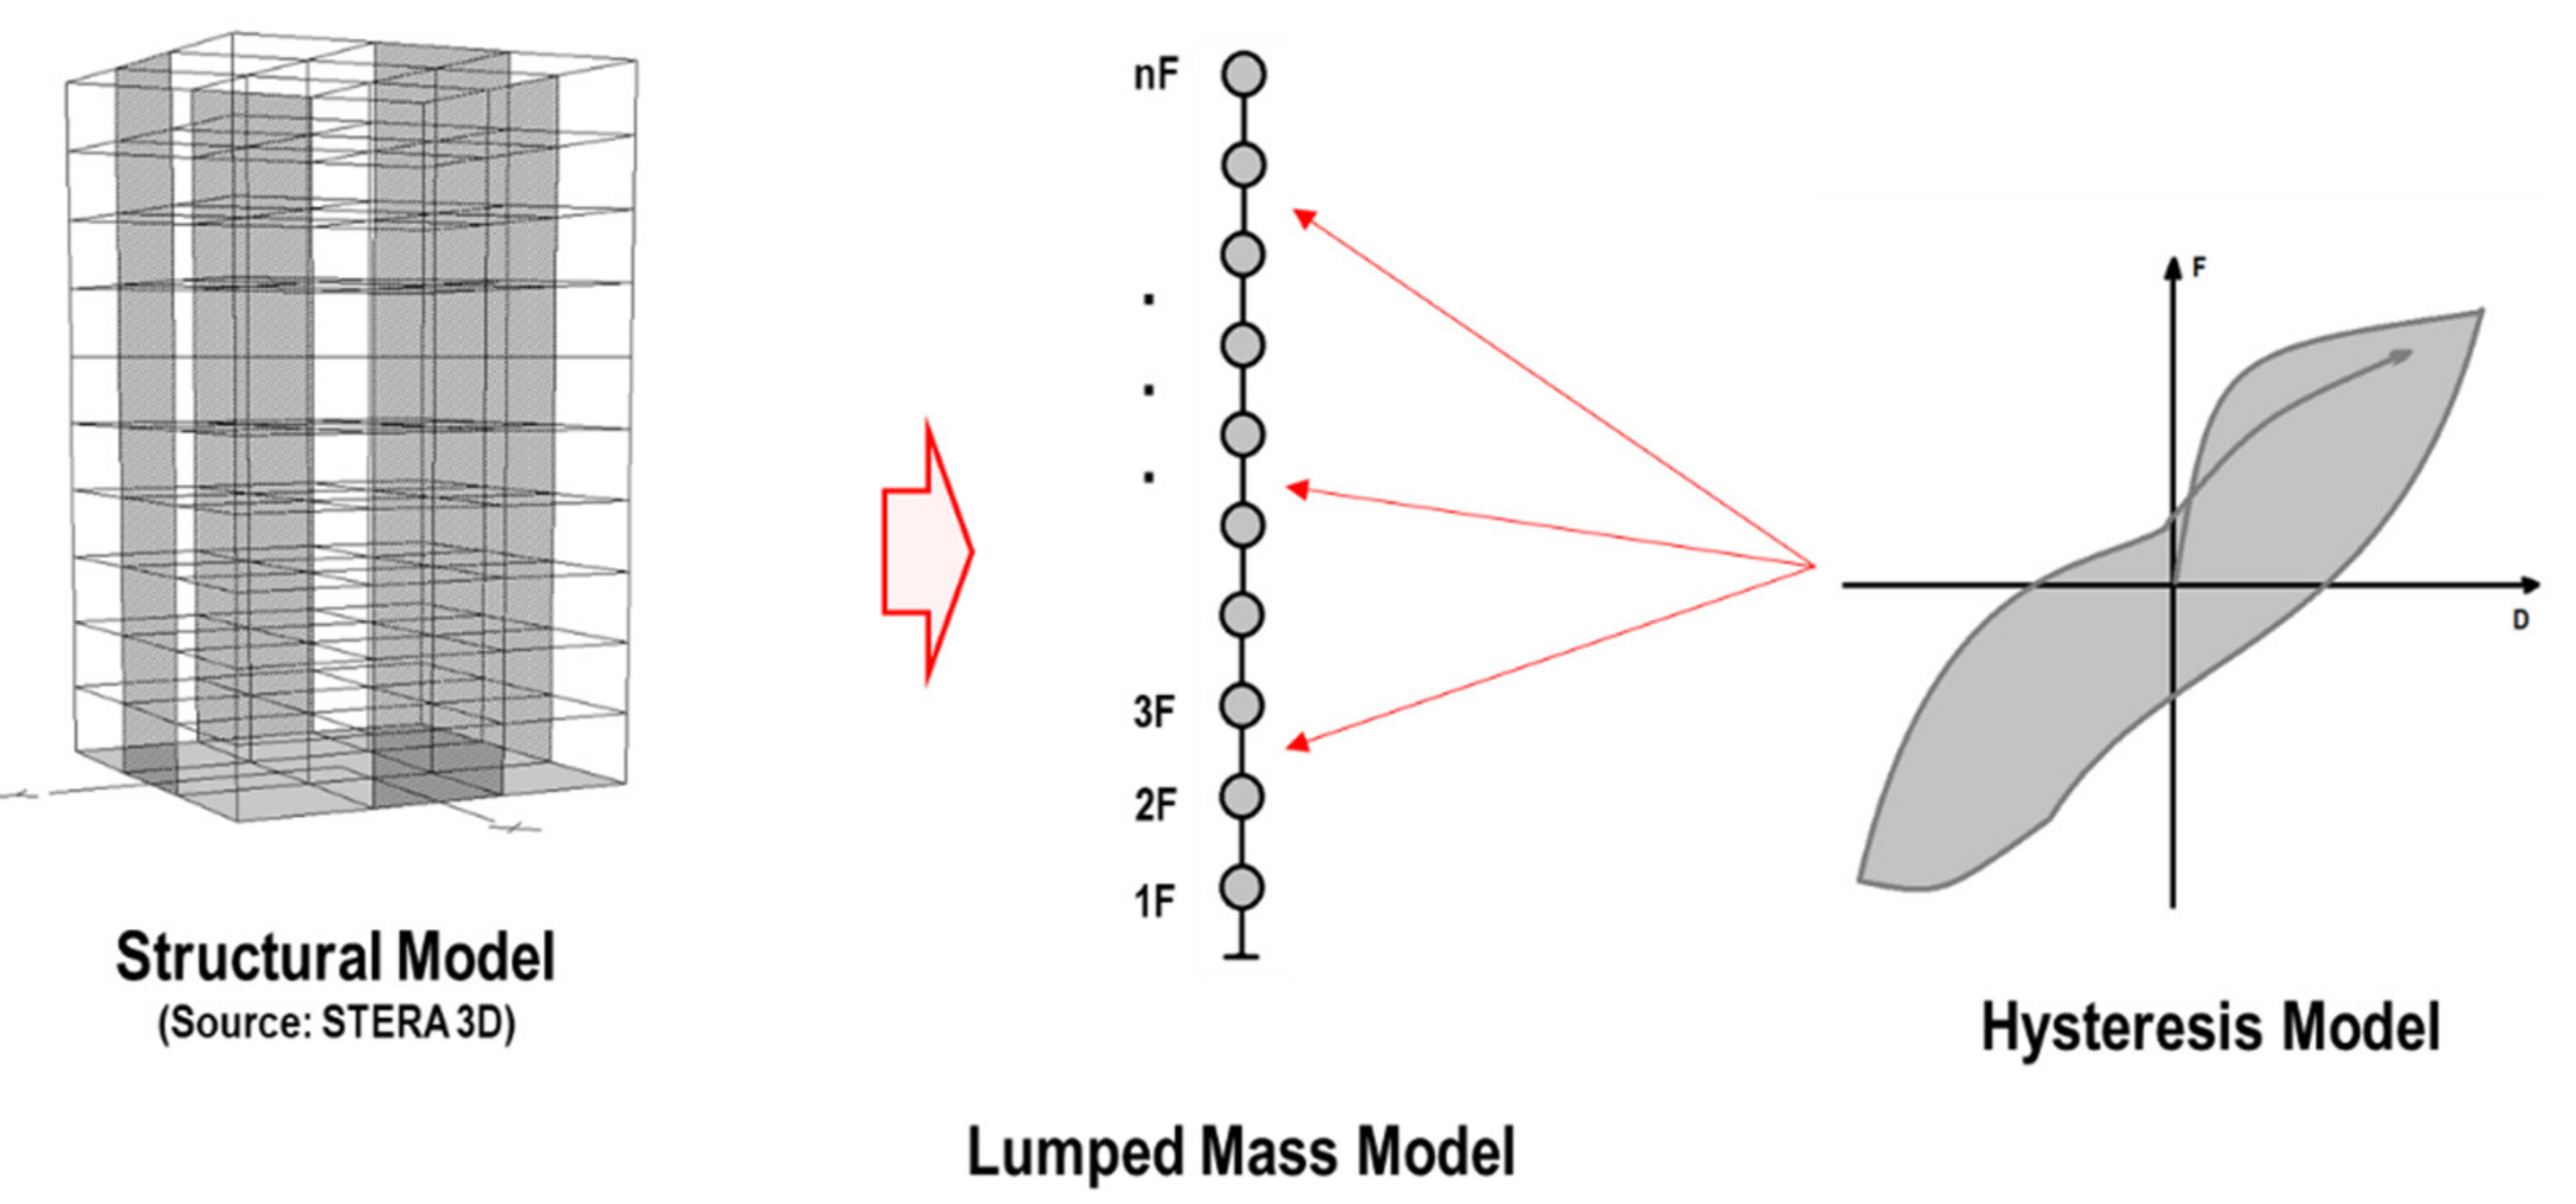
- LMM is used for the model of the building, and the bilinear hysteresis model (see Figure 5) is used to represent the nonlinear relationship between shear force and story drift for each story.
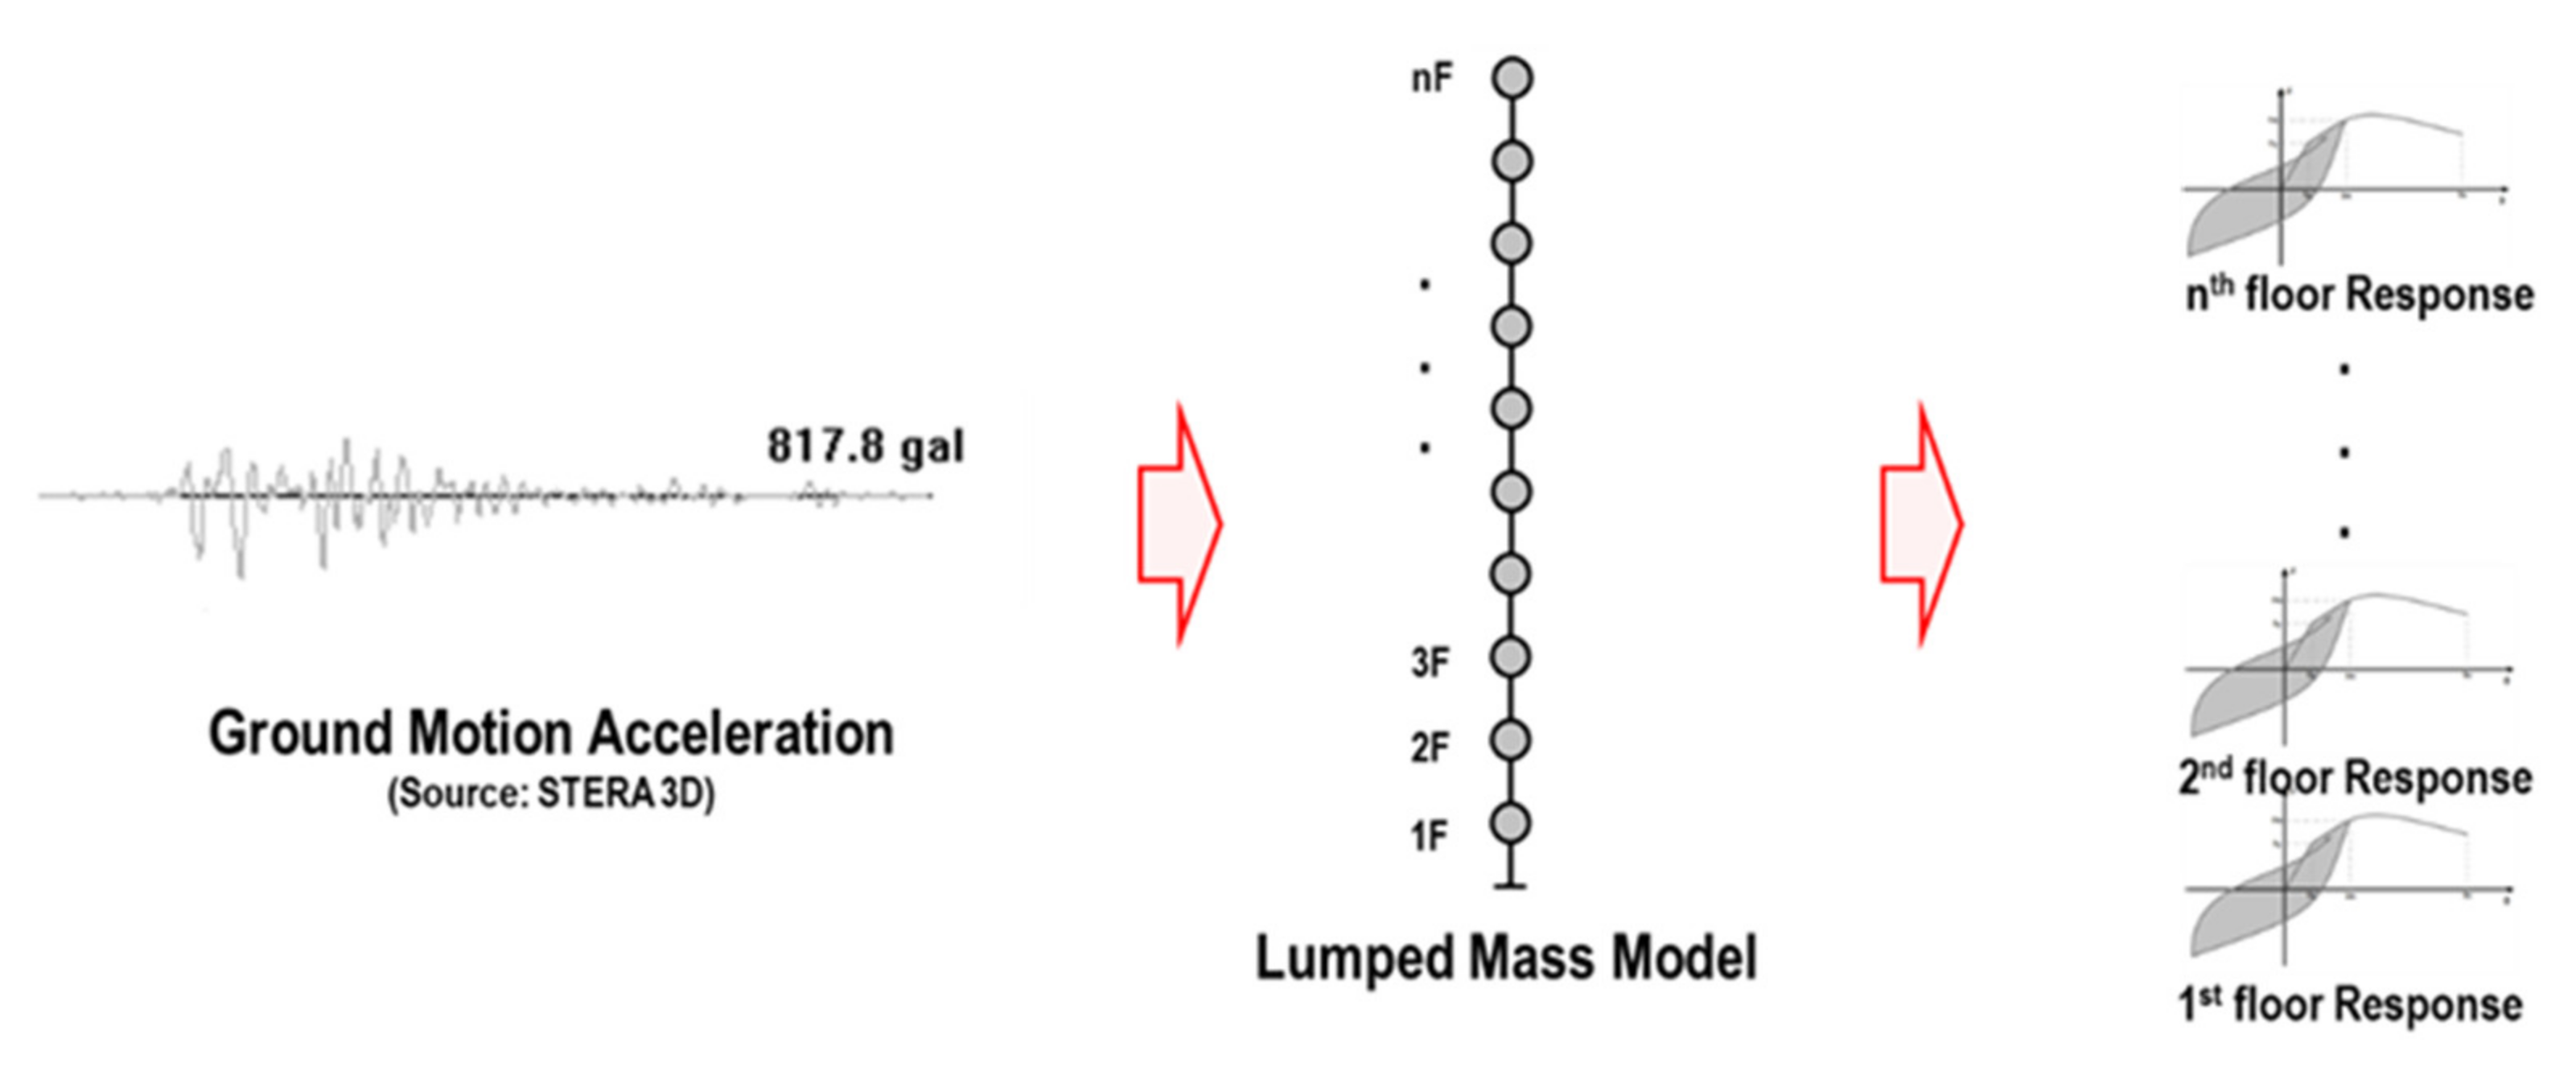
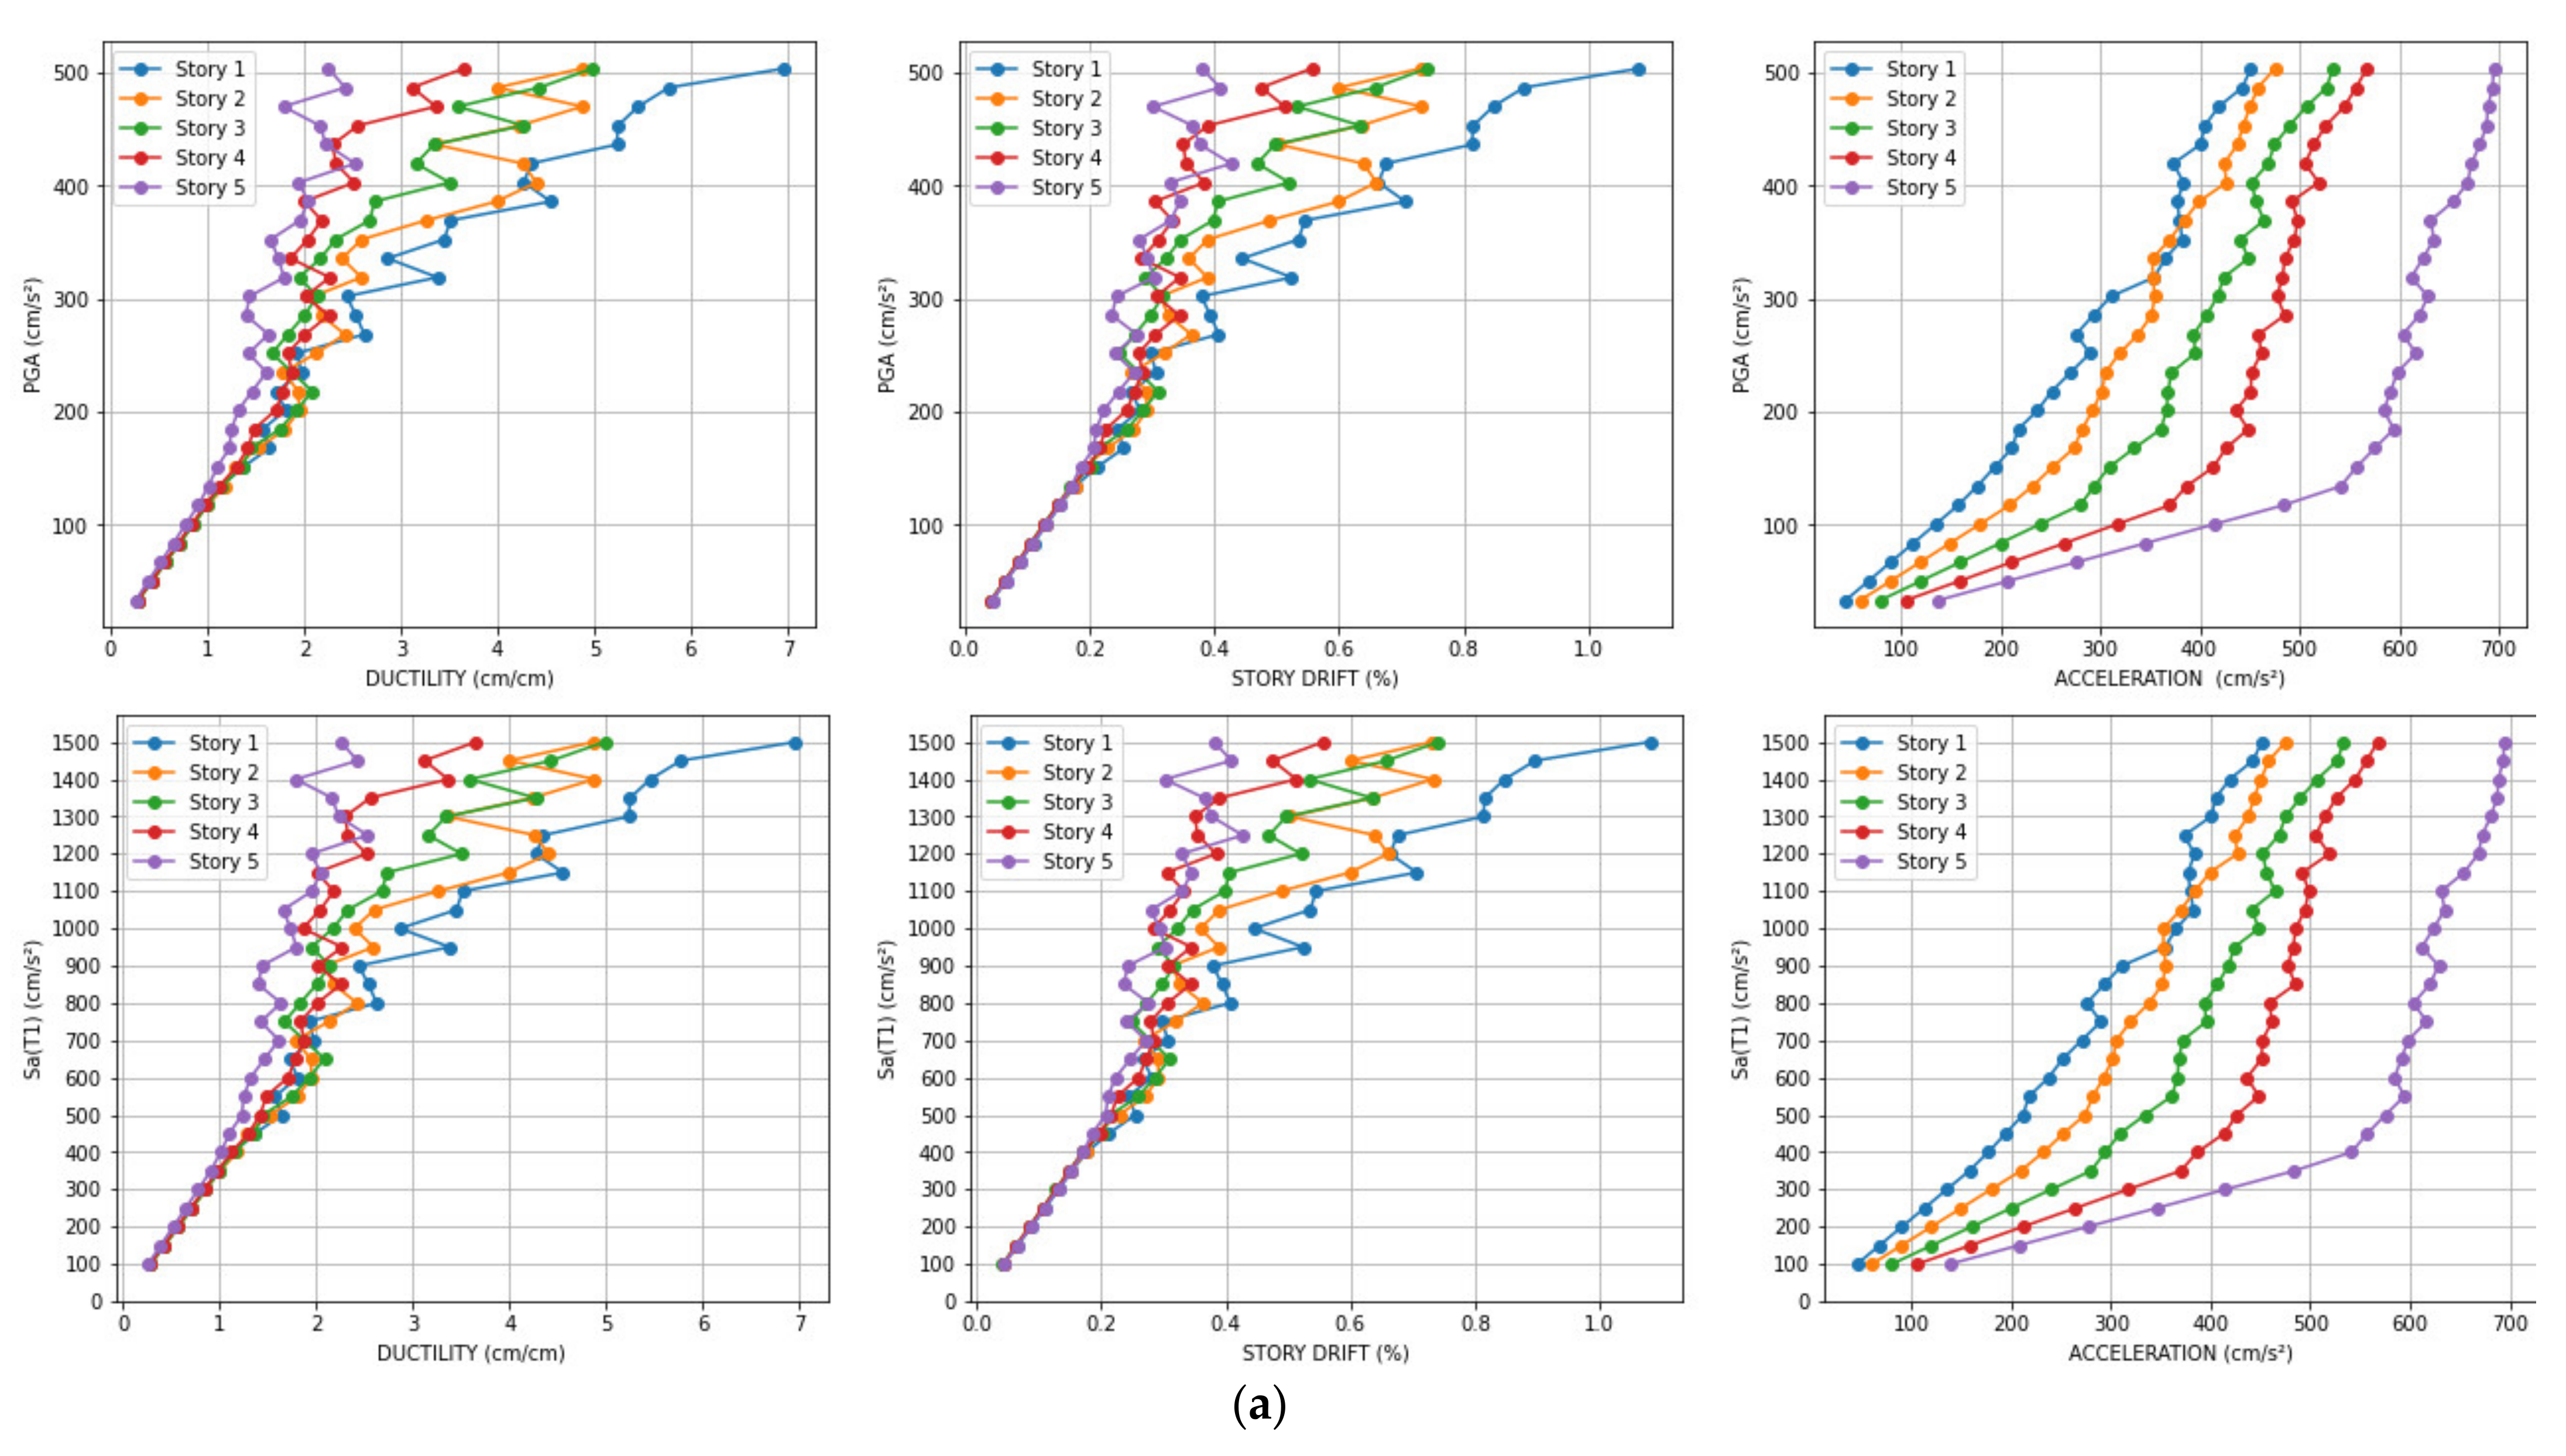
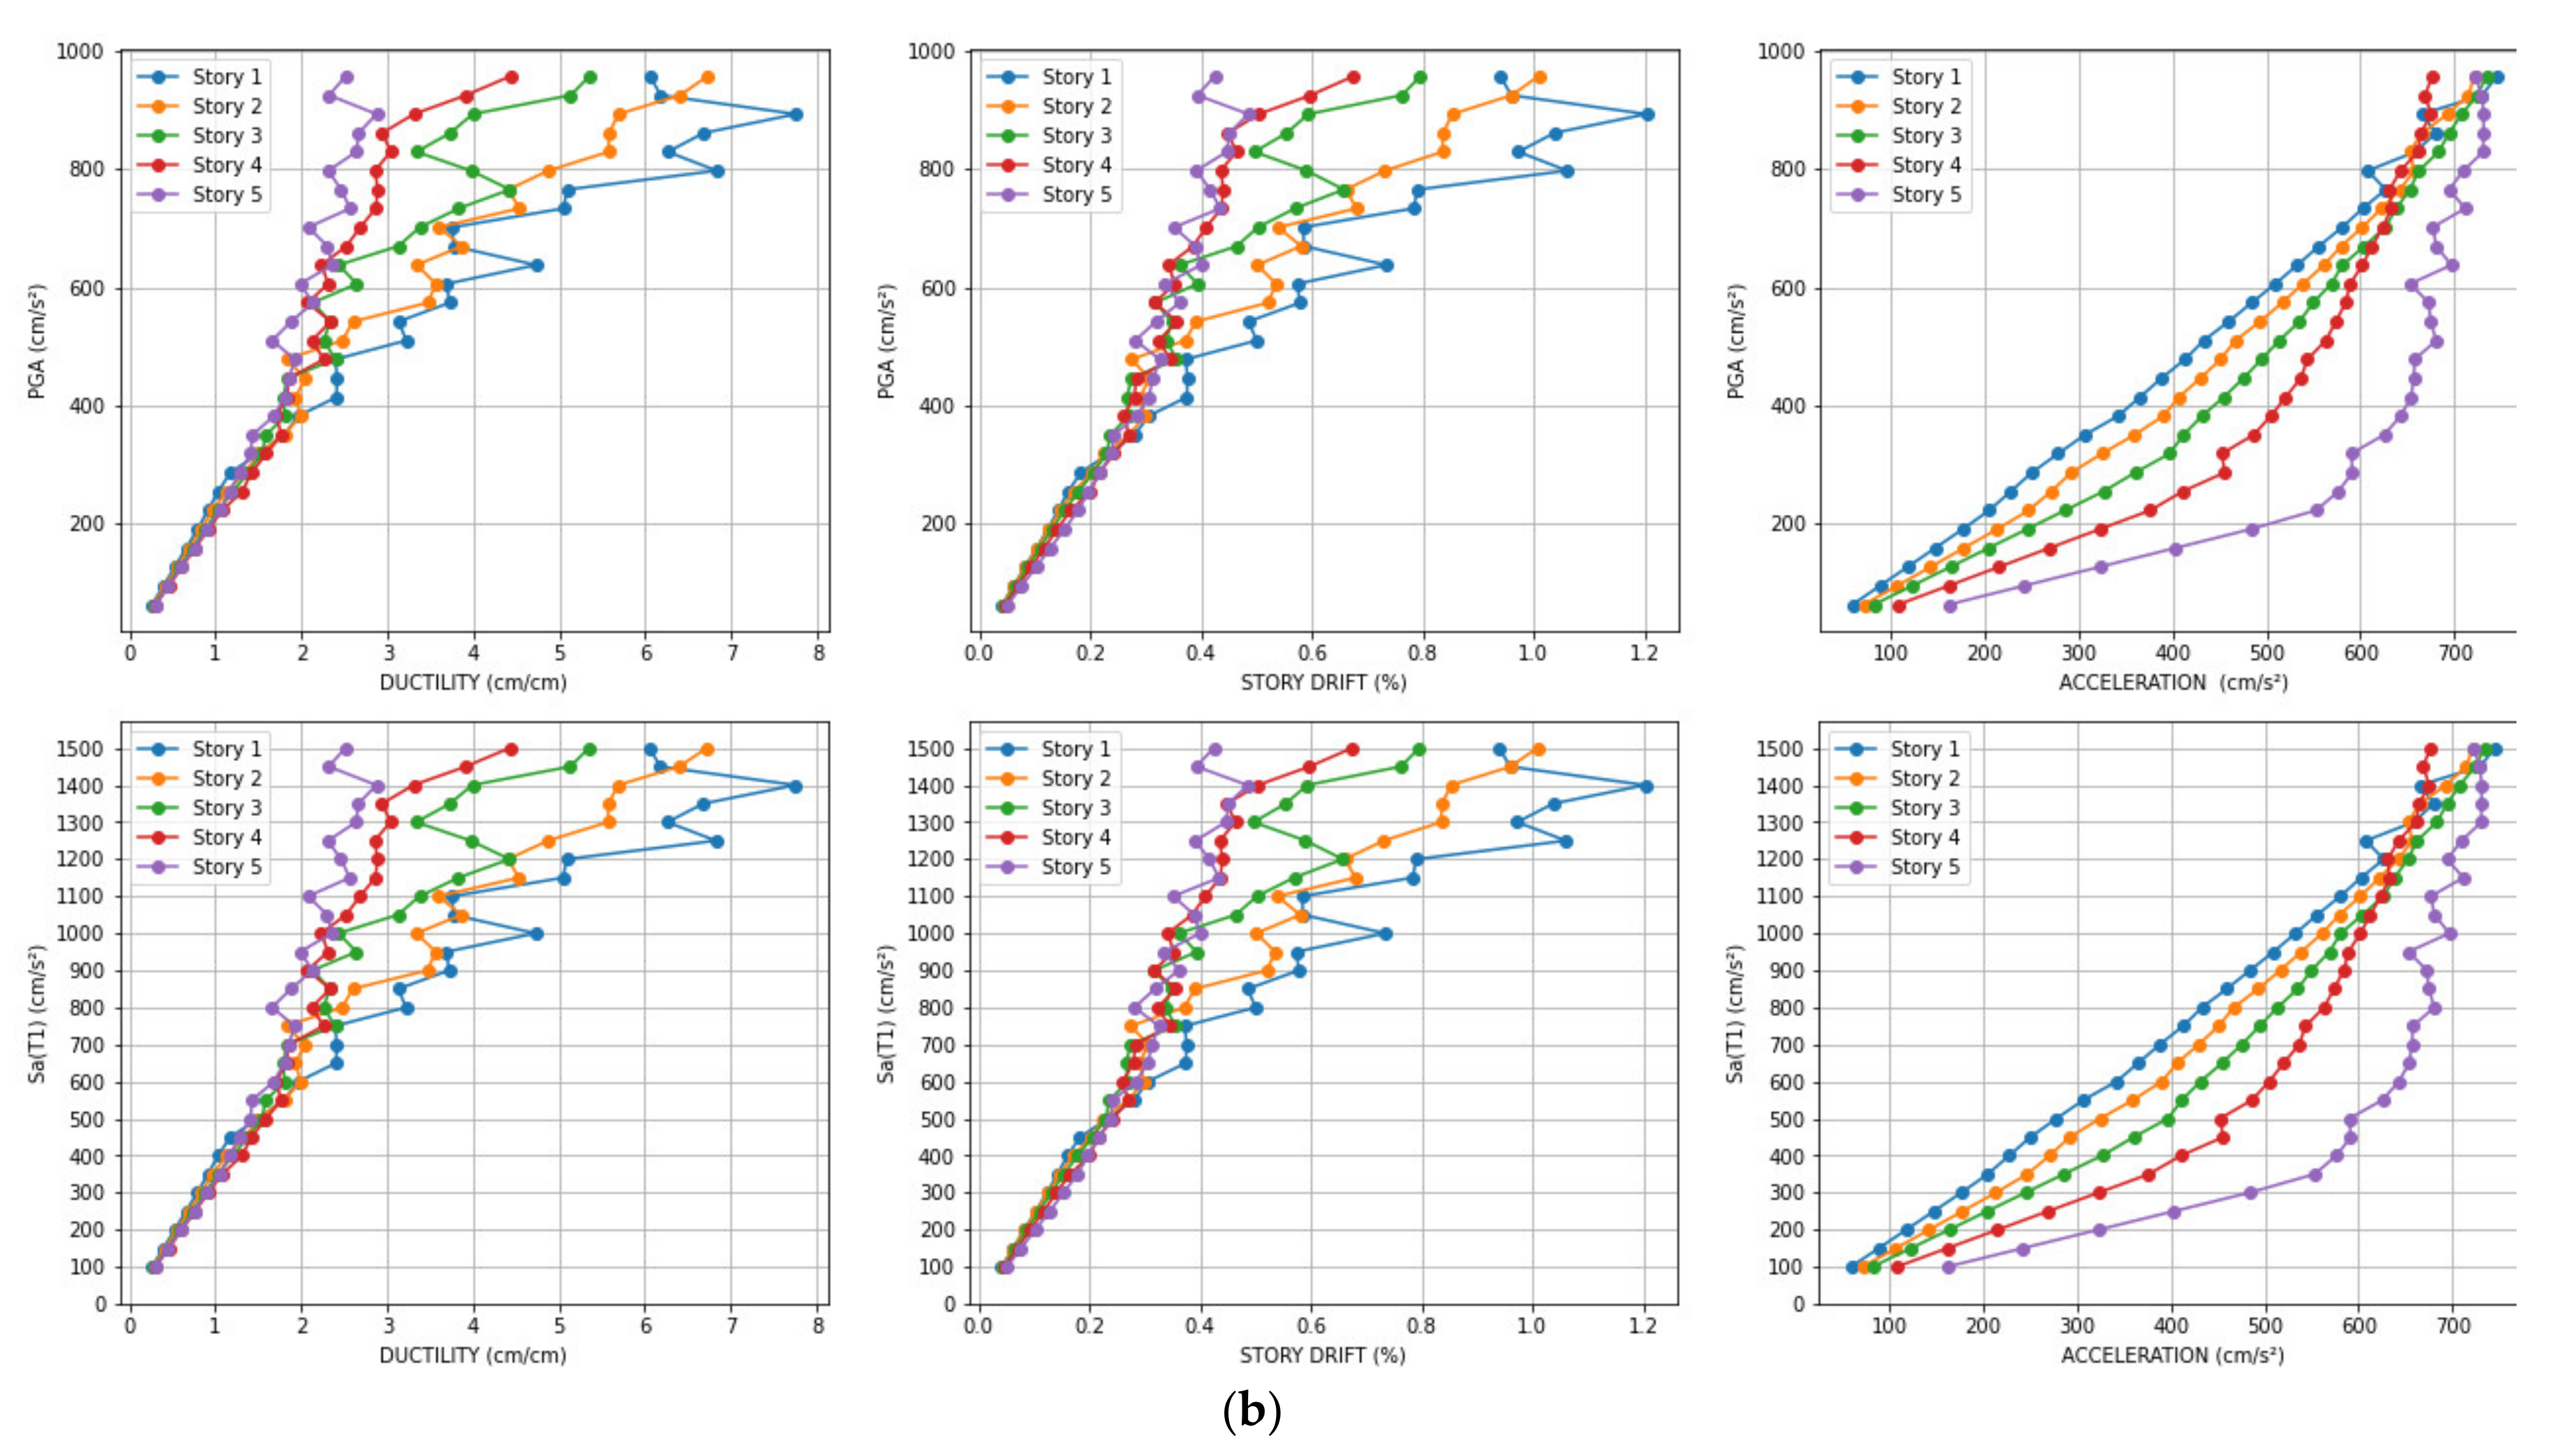
- The structural responses for damage identification (ductility ratio, story drift ratio, and acceleration) under earthquake ground motions are calculated by STERA 3D software [28].
2.4.2. Input Ground Motion
2.4.3. Scale Factor of Records
2.5. Machine Learning Methodology
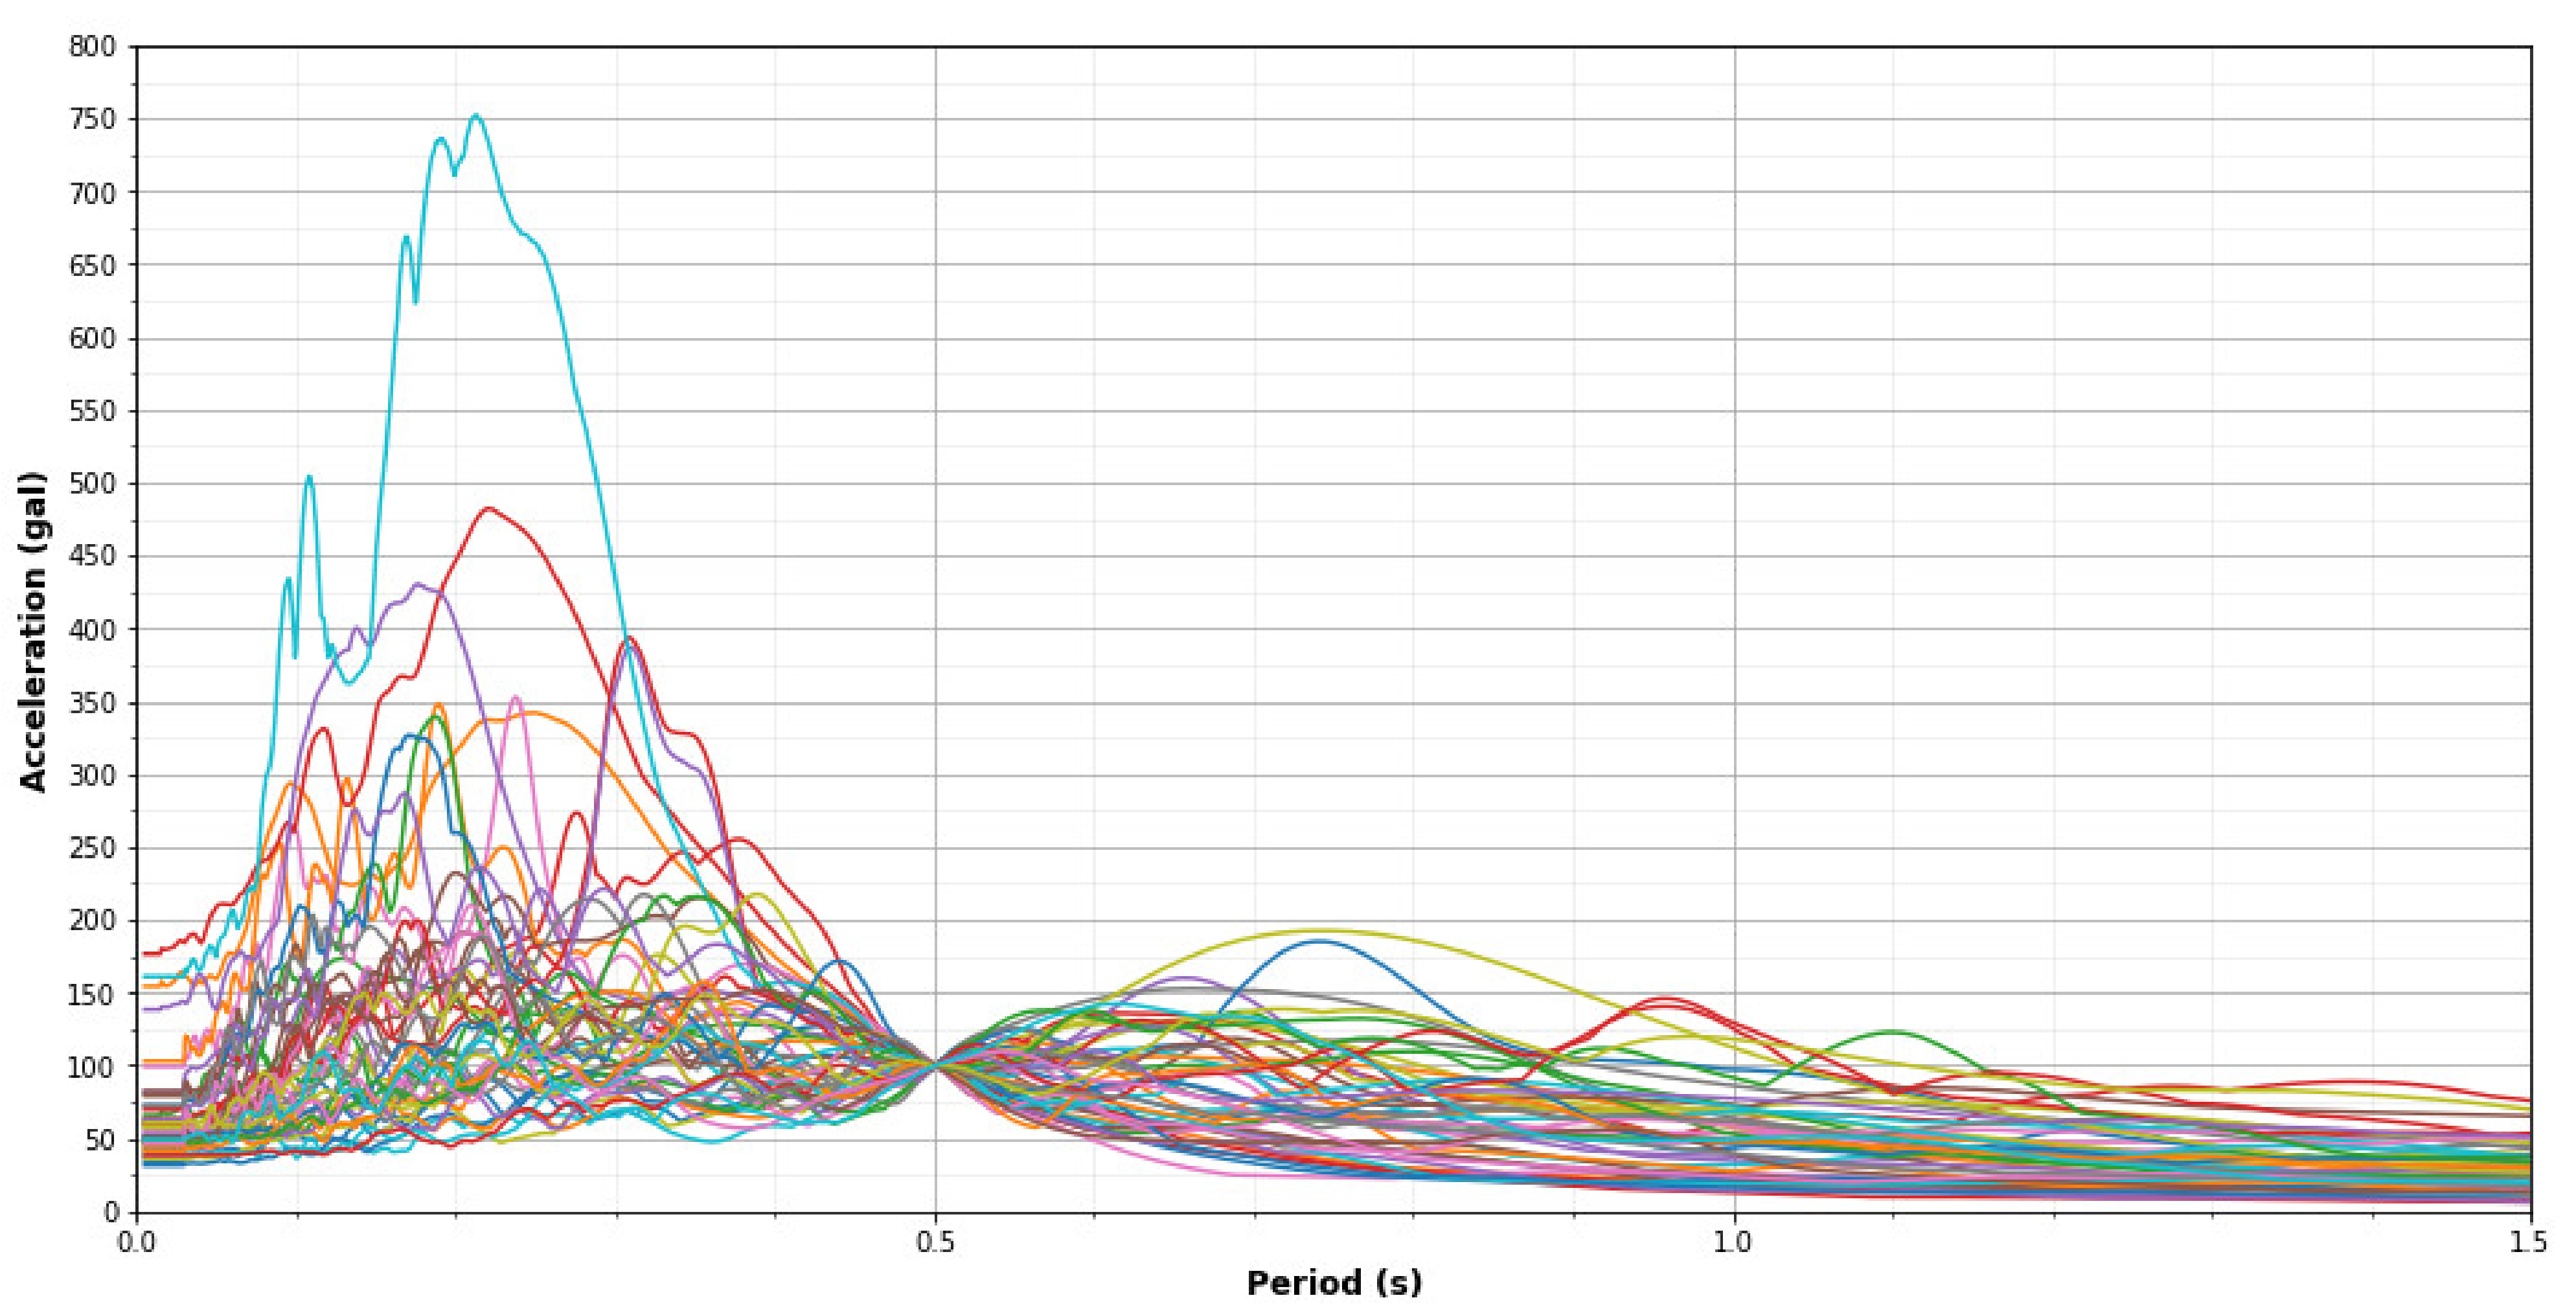
- The wavelet spectrum was obtained from the time–history acceleration response on the upper floor of the building. The frequency range was from 0.1/T1 to 5/T1, where T1 is the fundamental period of the case study structure (T1 = 0.5s), which is from 0.2 Hz to 10 Hz. This covered the high and low frequencies produced during high mode vibrations and nonlinear frequencies.
- There were two sets of scale factors for the training and validation of CNN processes.
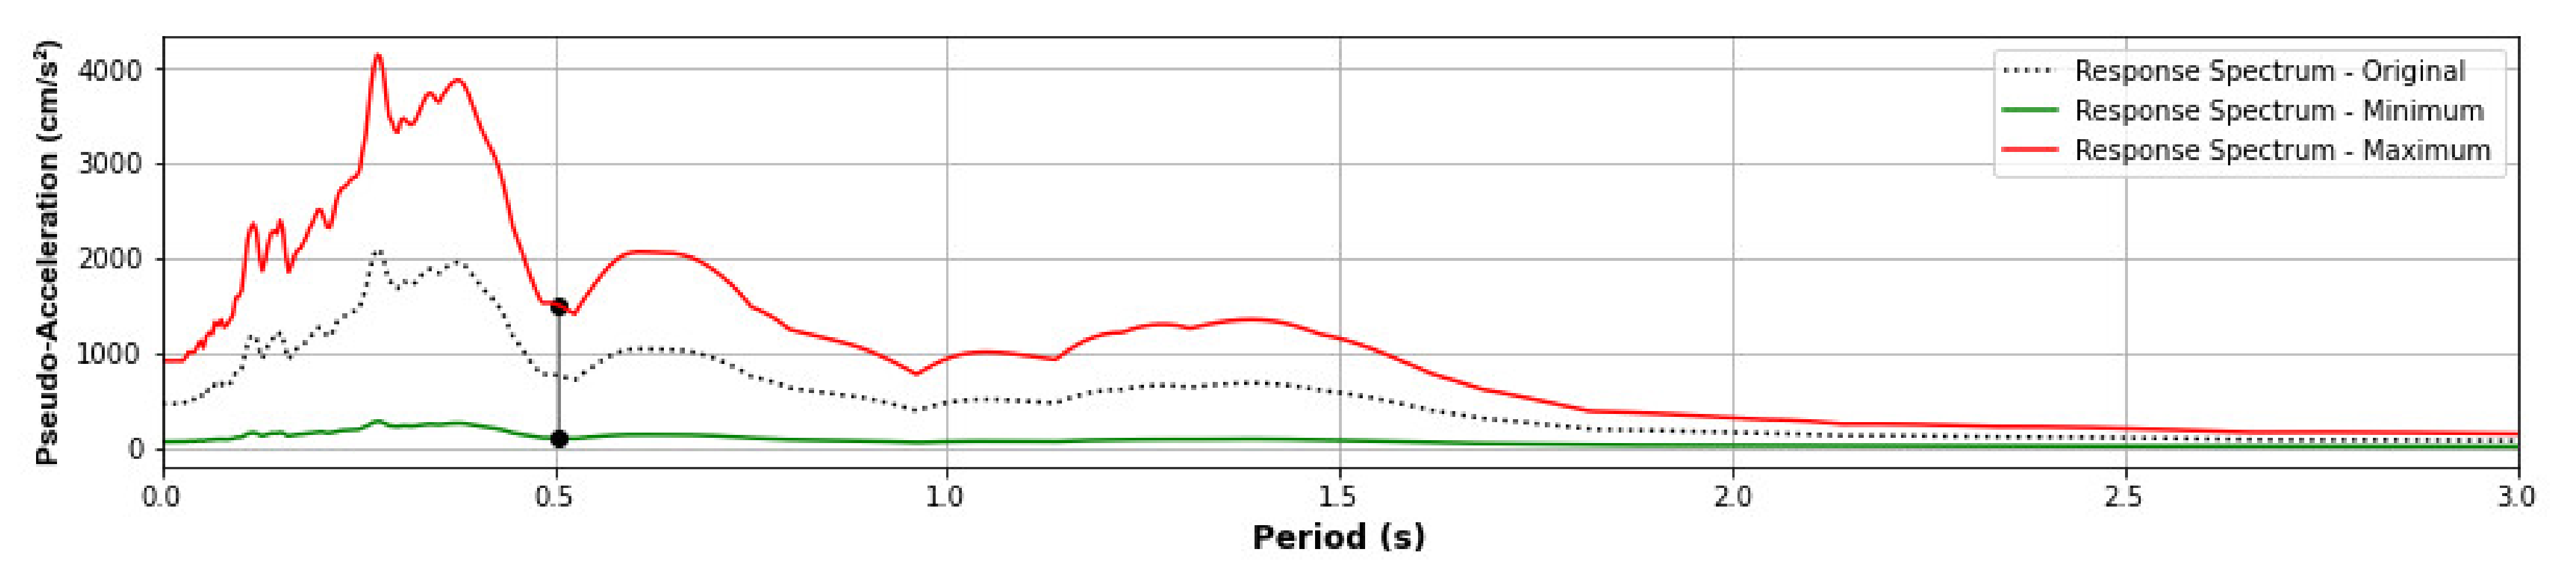
- The training scale factor set was the minimum scale factor, which produces Sa(T1) = 100 gal, to the maximum, which produces Sa(T1) = 1500 gal, at increments of 50 gal.
- The validation scale factor set was the minimum scale factor, which produces Sa(T1) = 100 gal, to the maximum, which produces Sa(T1) = 1000 gal, at increments of 25 gal.
- There were 1160 structural analyses conducted for the training process by considering 40 records with 29 scale factors, while there were 370 structural analyses conducted for the validation process by considering 10 new records with 37 scale factors. Therefore, 1530 structural analyses carried out were used in this study.
- STEP 01: 40 training records are scaled with 29 scale factors per record. As a result, 1160 scaled records are generated.
- STEP 02: 1160 structural analyses are carried out for the structural model of the case study. As a result, 1160 absolute acceleration data on the upper floor are obtained. Additionally, the responses for damage identification (ductility ratio, story drift, and acceleration) are computed from the structural analyses for validating and calibrating the CNN model.
- STEP 03: 1160 wavelet spectra are obtained from the absolute acceleration of the previous step. The wavelet spectra are the input data for training the CNN model.
- STEP 04: The CNN model is trained for each structural response for damage identification (ductility ratio, story drift ratio, and acceleration).
- STEP 01: 10 validation records are scaled with 37 scale factors per record. As a result, 570 scaled records are generated.
- STEP 02: 370 structural analyses are carried out for the structural model of the case study. As a result, 370 absolute acceleration data on the upper floor are obtained. Additionally, the responses for damage identification (ductility ratio, story drift, and acceleration) are computed as reference outputs to validate the prediction.
- STEP 03: 370 wavelet spectra are obtained from the absolute acceleration of the previous step. The wavelet spectra are the input data for predicting the structural response for the damage identification using the trained CNN model.
- STEP 04: Prediction outputs are calculated using the CNN model for each structural response for damage identification (ductility ratio, story drift ratio, and acceleration).
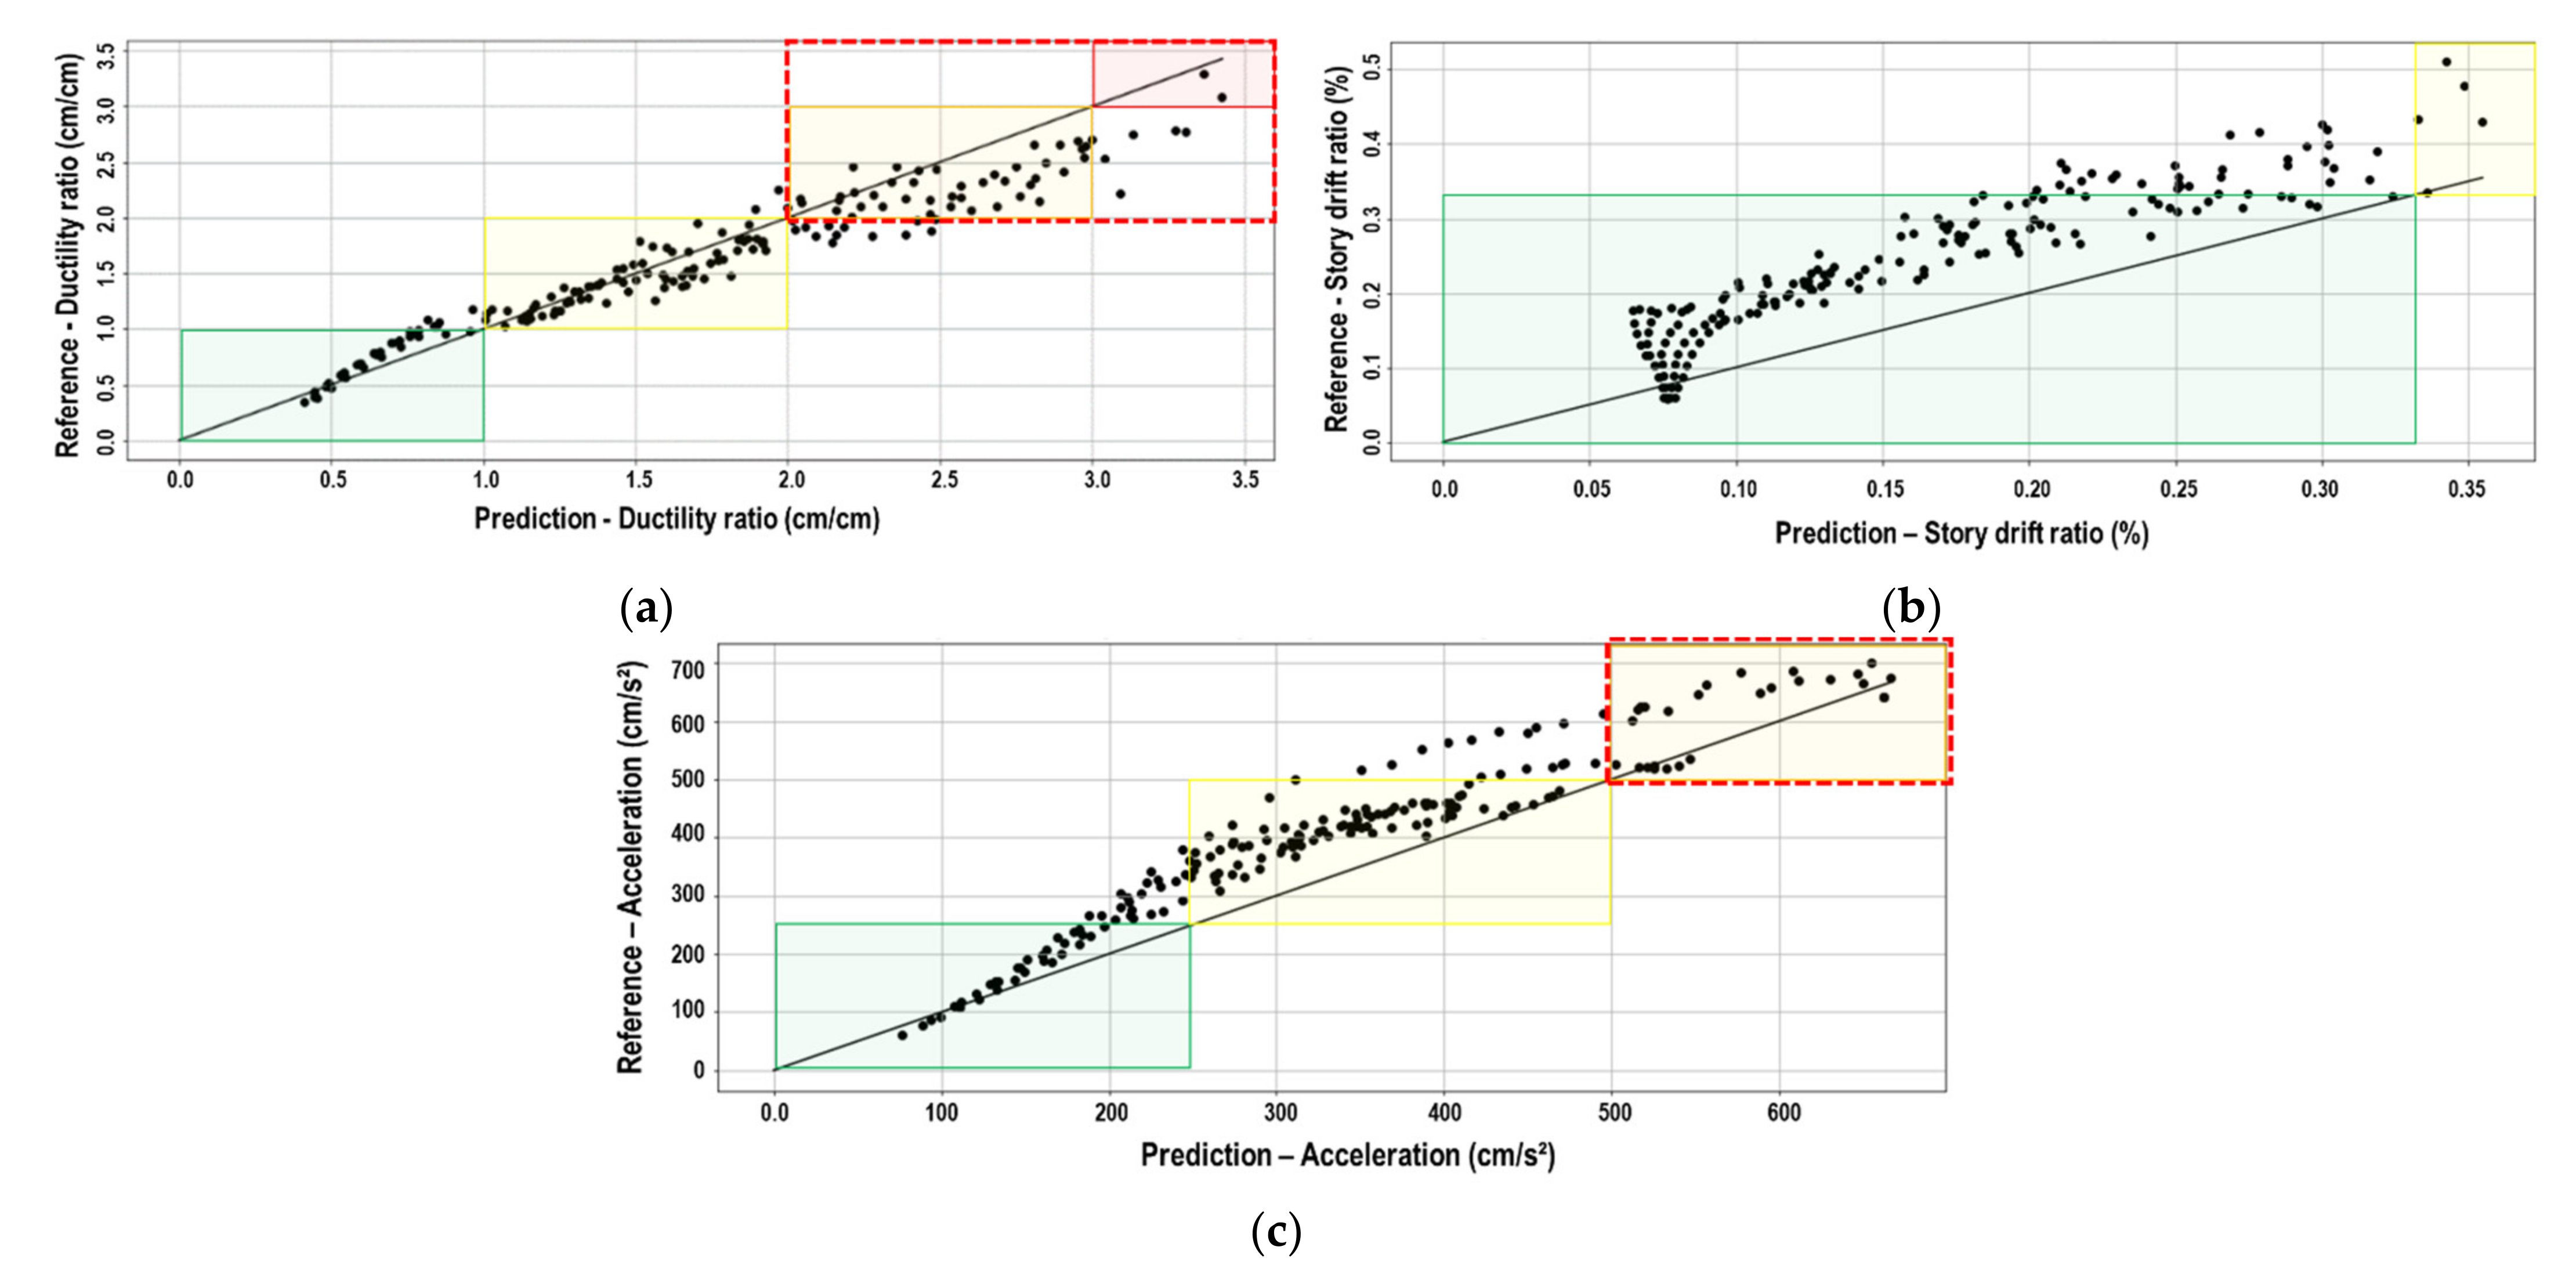
- STEP 05: The reference and prediction outputs are compared.
3. Prediction and Validation of the Case Study
4. Conclusions and Discussion
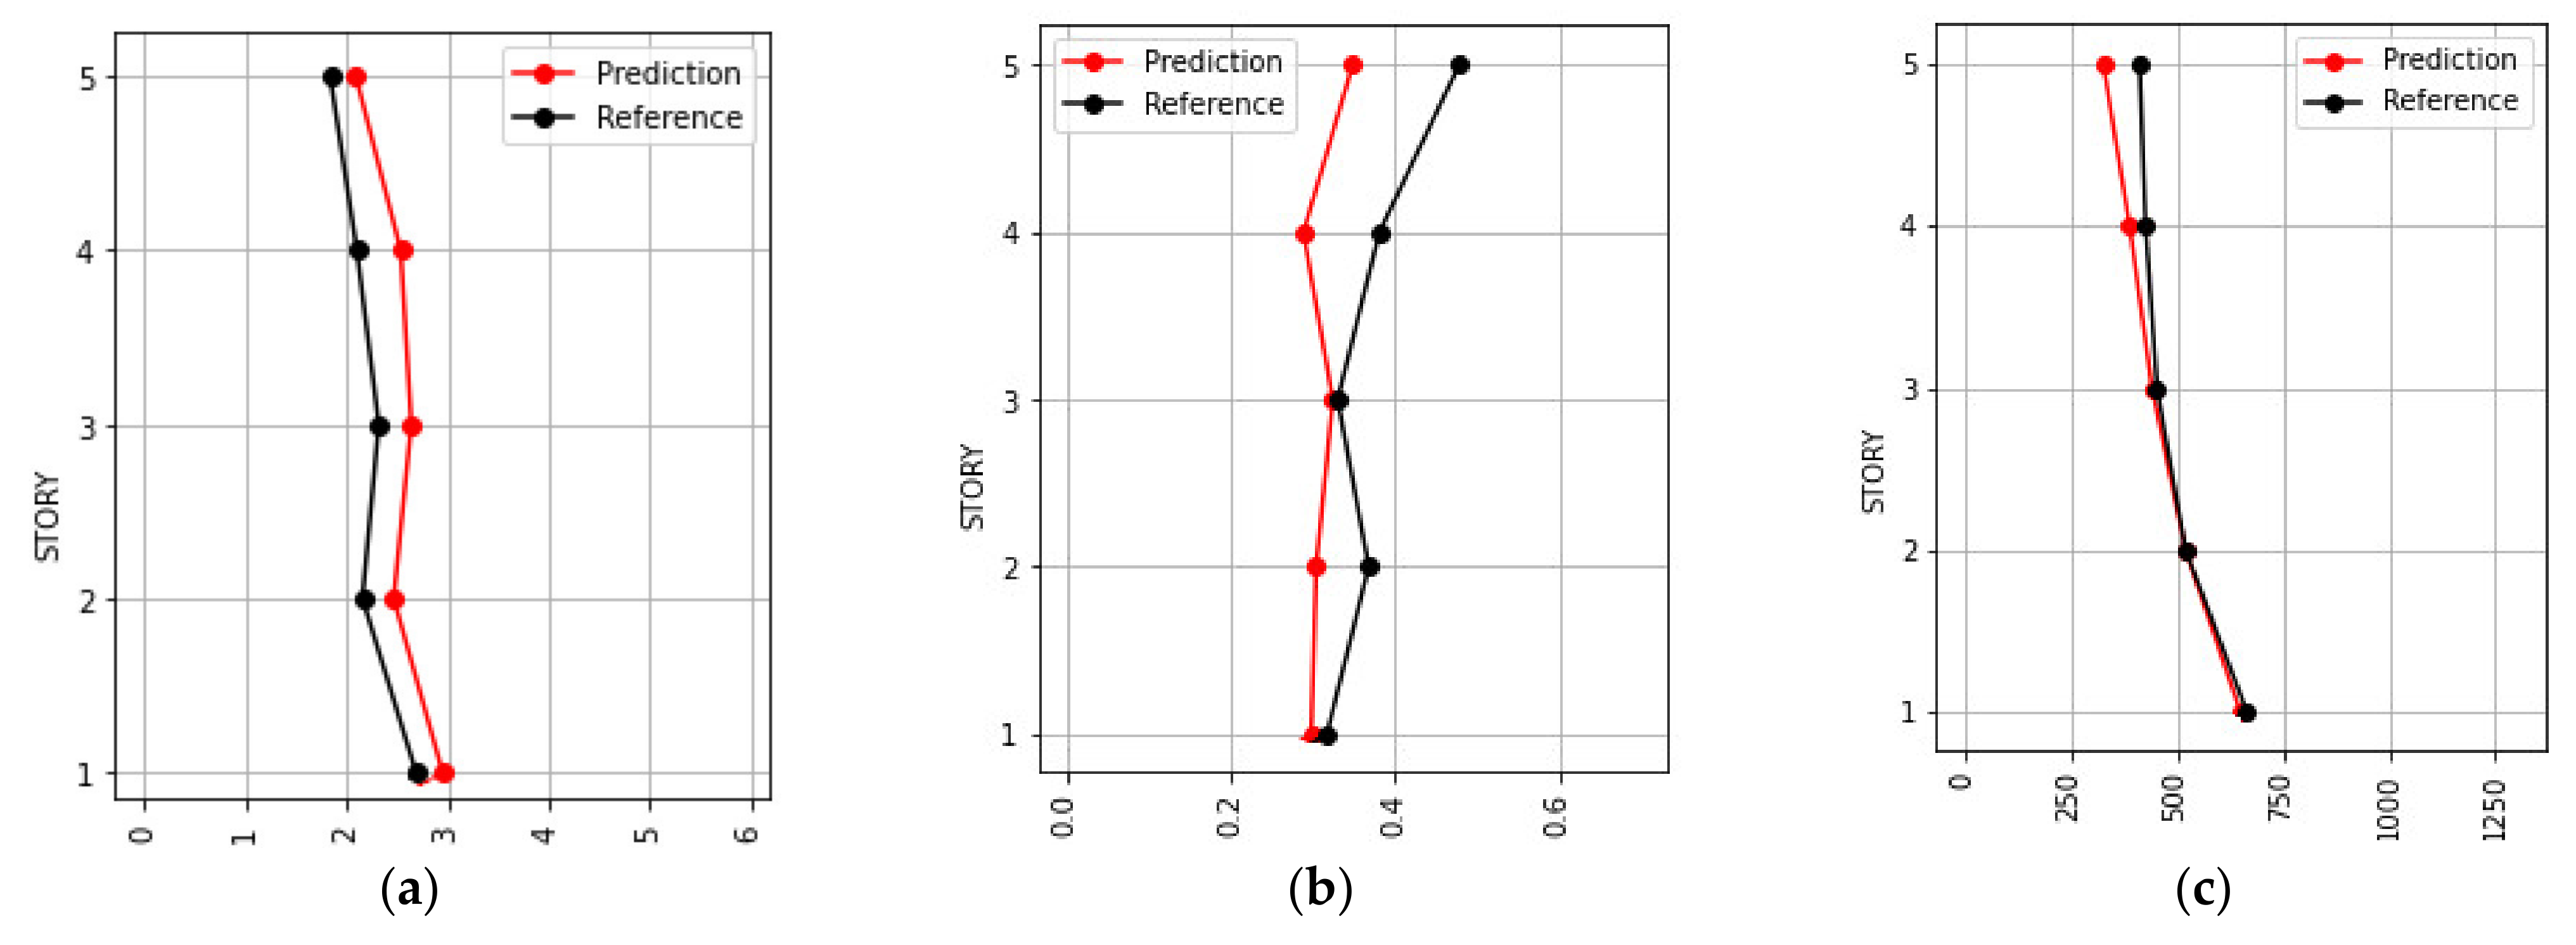
- The maximum ductility factor, inter-story drift ratio, and maximum response acceleration of each floor were predicted via a CNN model using the acceleration record at the upper floor of the building.
- The wavelet spectrum of the acceleration record of the upper floor of the building was used as the input of the CNN model to account for the non-stationarity of both the amplitude and frequency of the building response.
- A CNN model was trained for the linear to nonlinear response of a building by inputting two horizontal components of 20 different earthquake ground motions with varying scales. The trained CNN model was then validated by inputting the two-directional horizontal components of five different earthquake motions to the building with different scales.
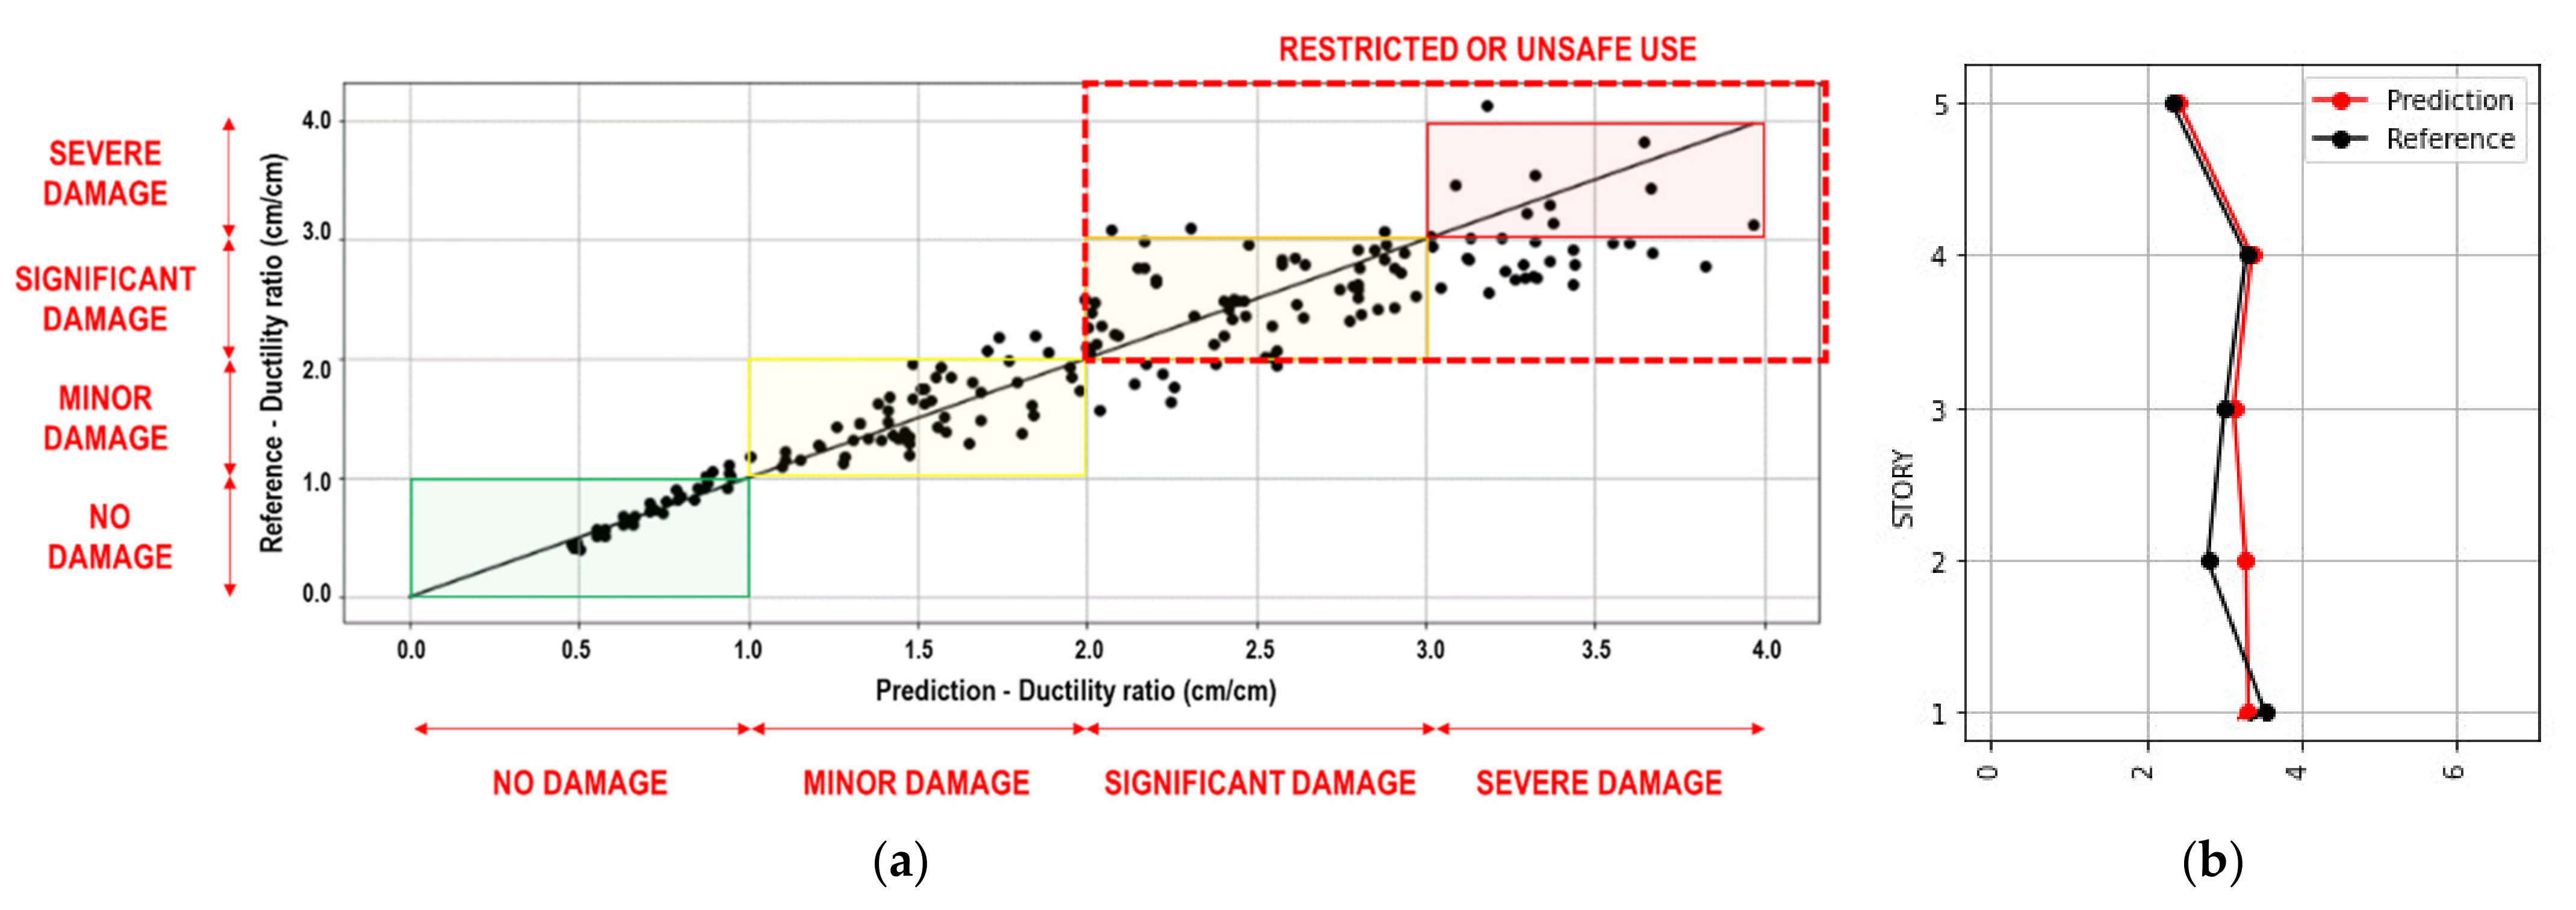
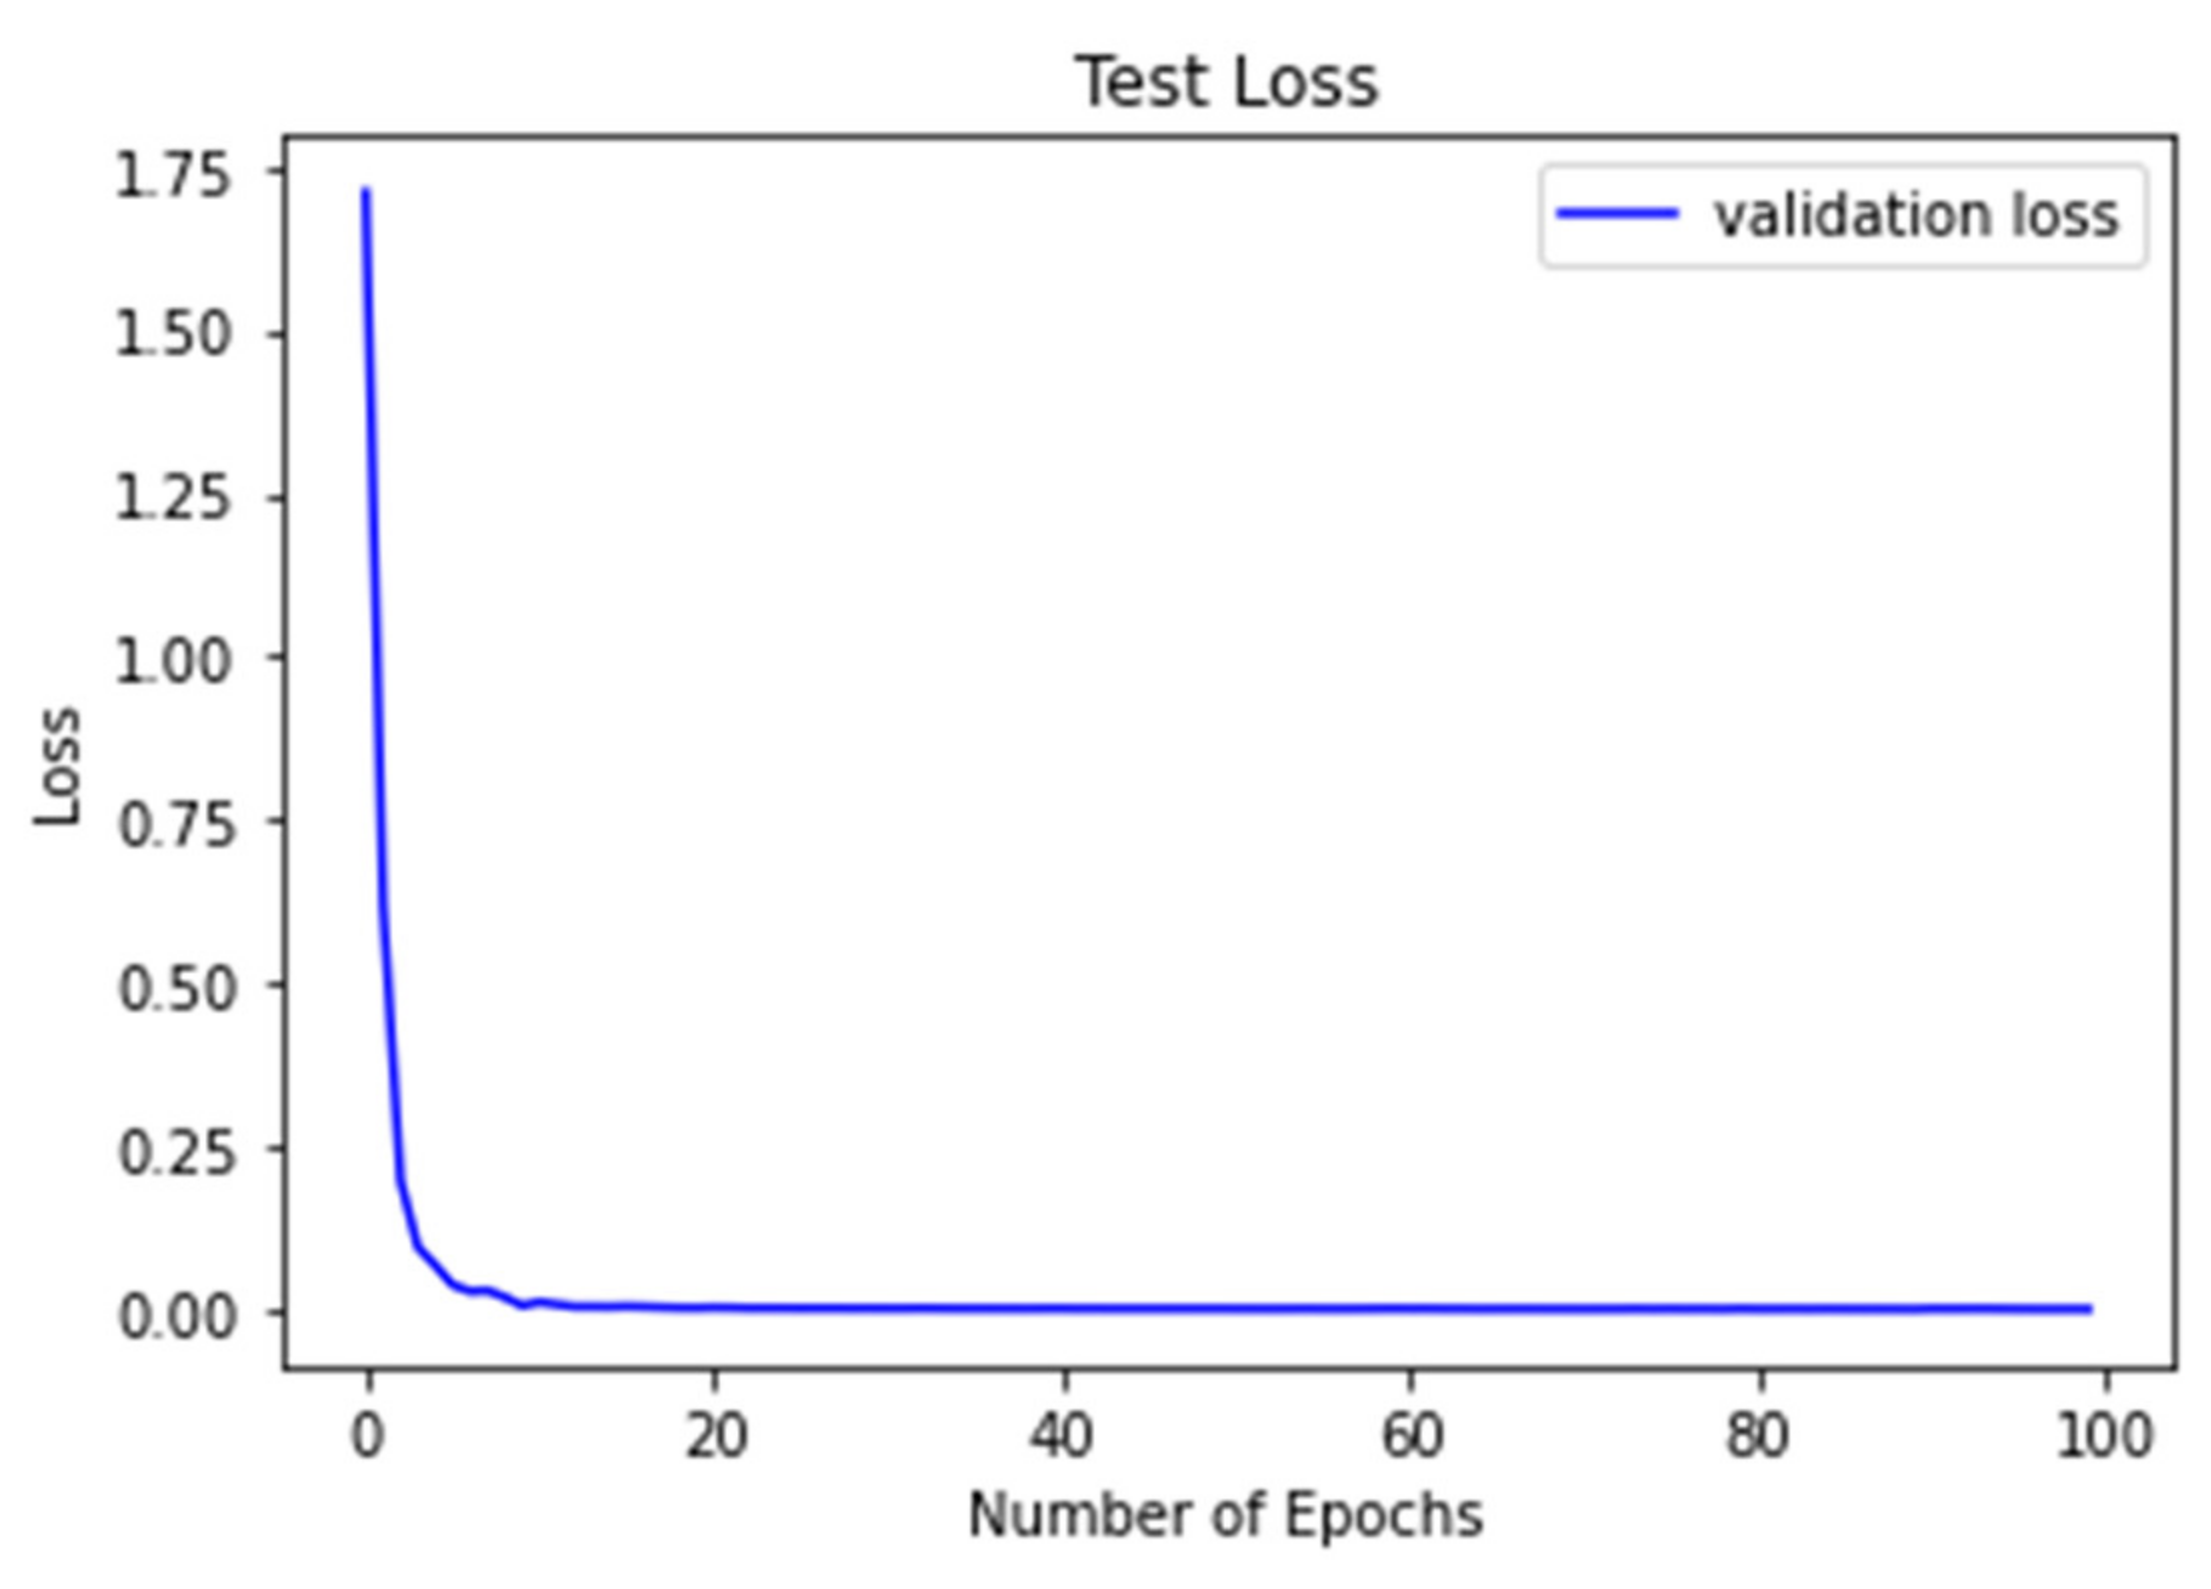
- The correlation coefficients between the predicted values and the reference values by the CNN model exceeded 0.8 for all response values, confirming the high accuracy of the model.
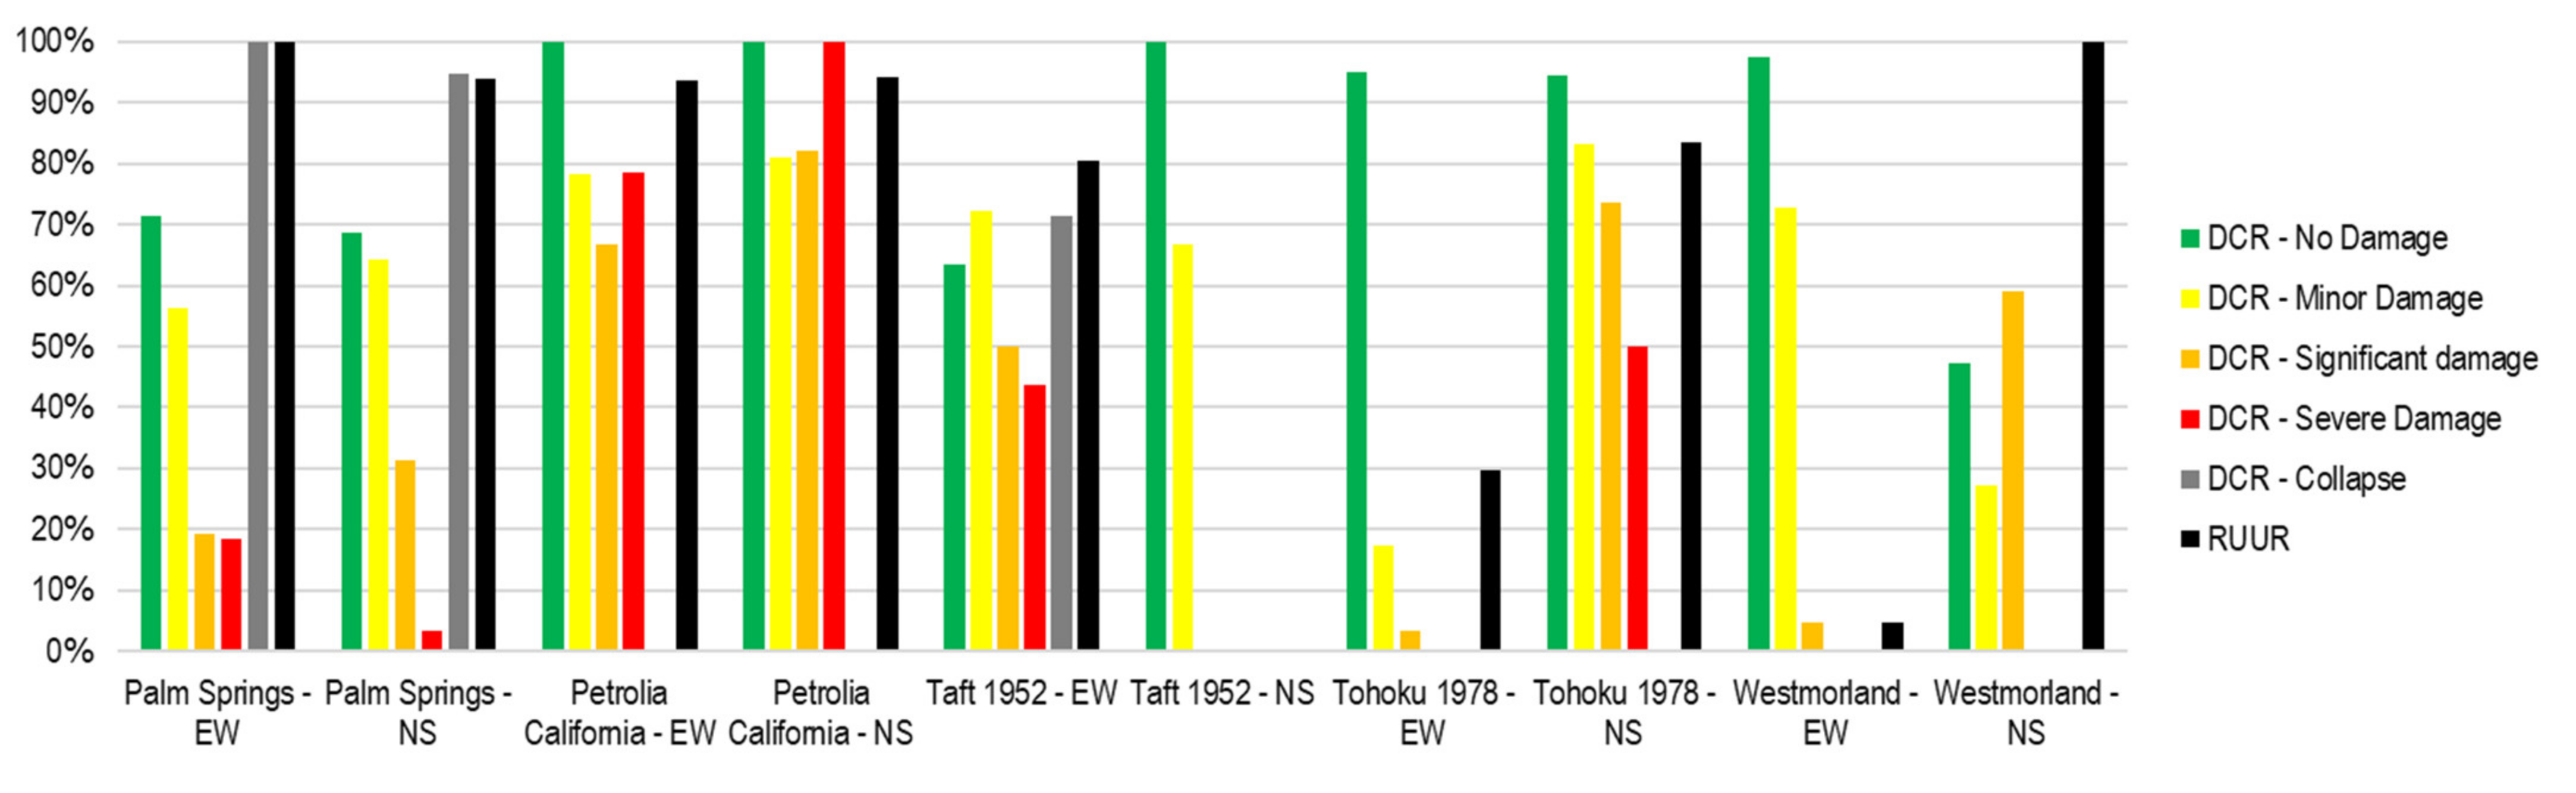
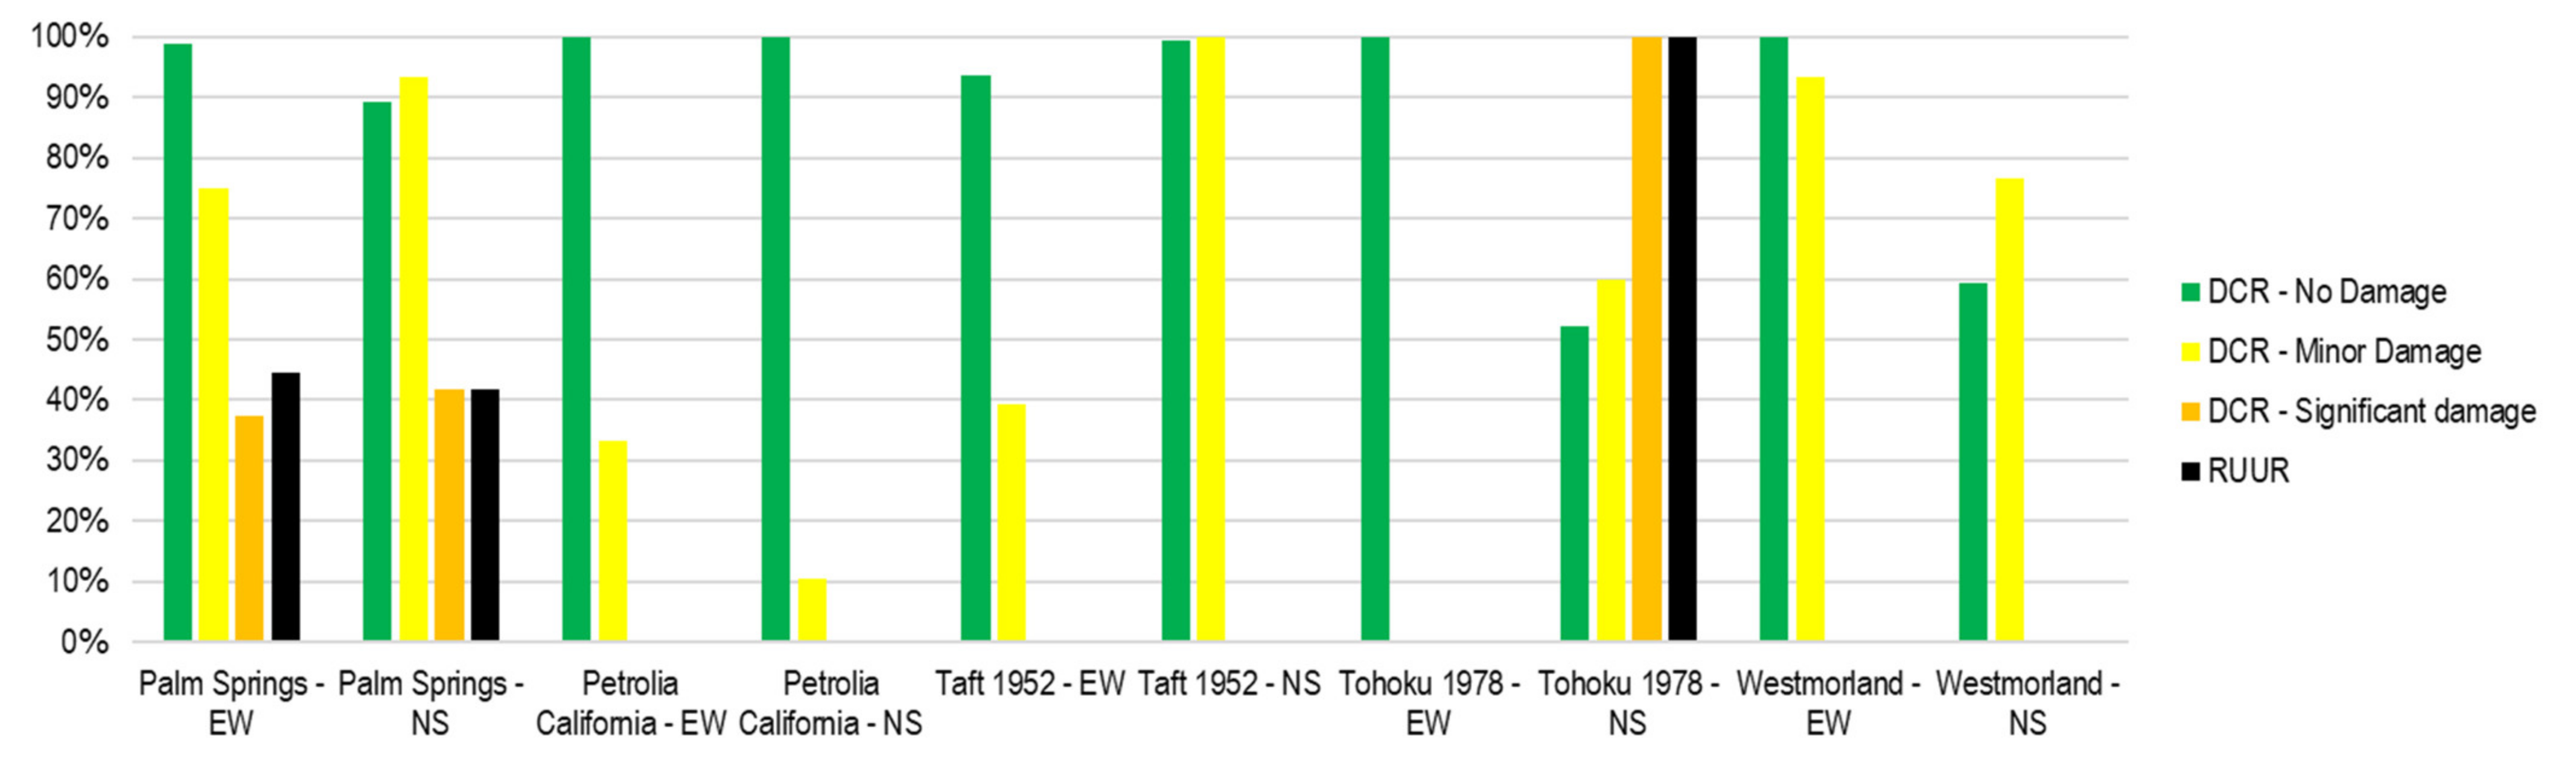
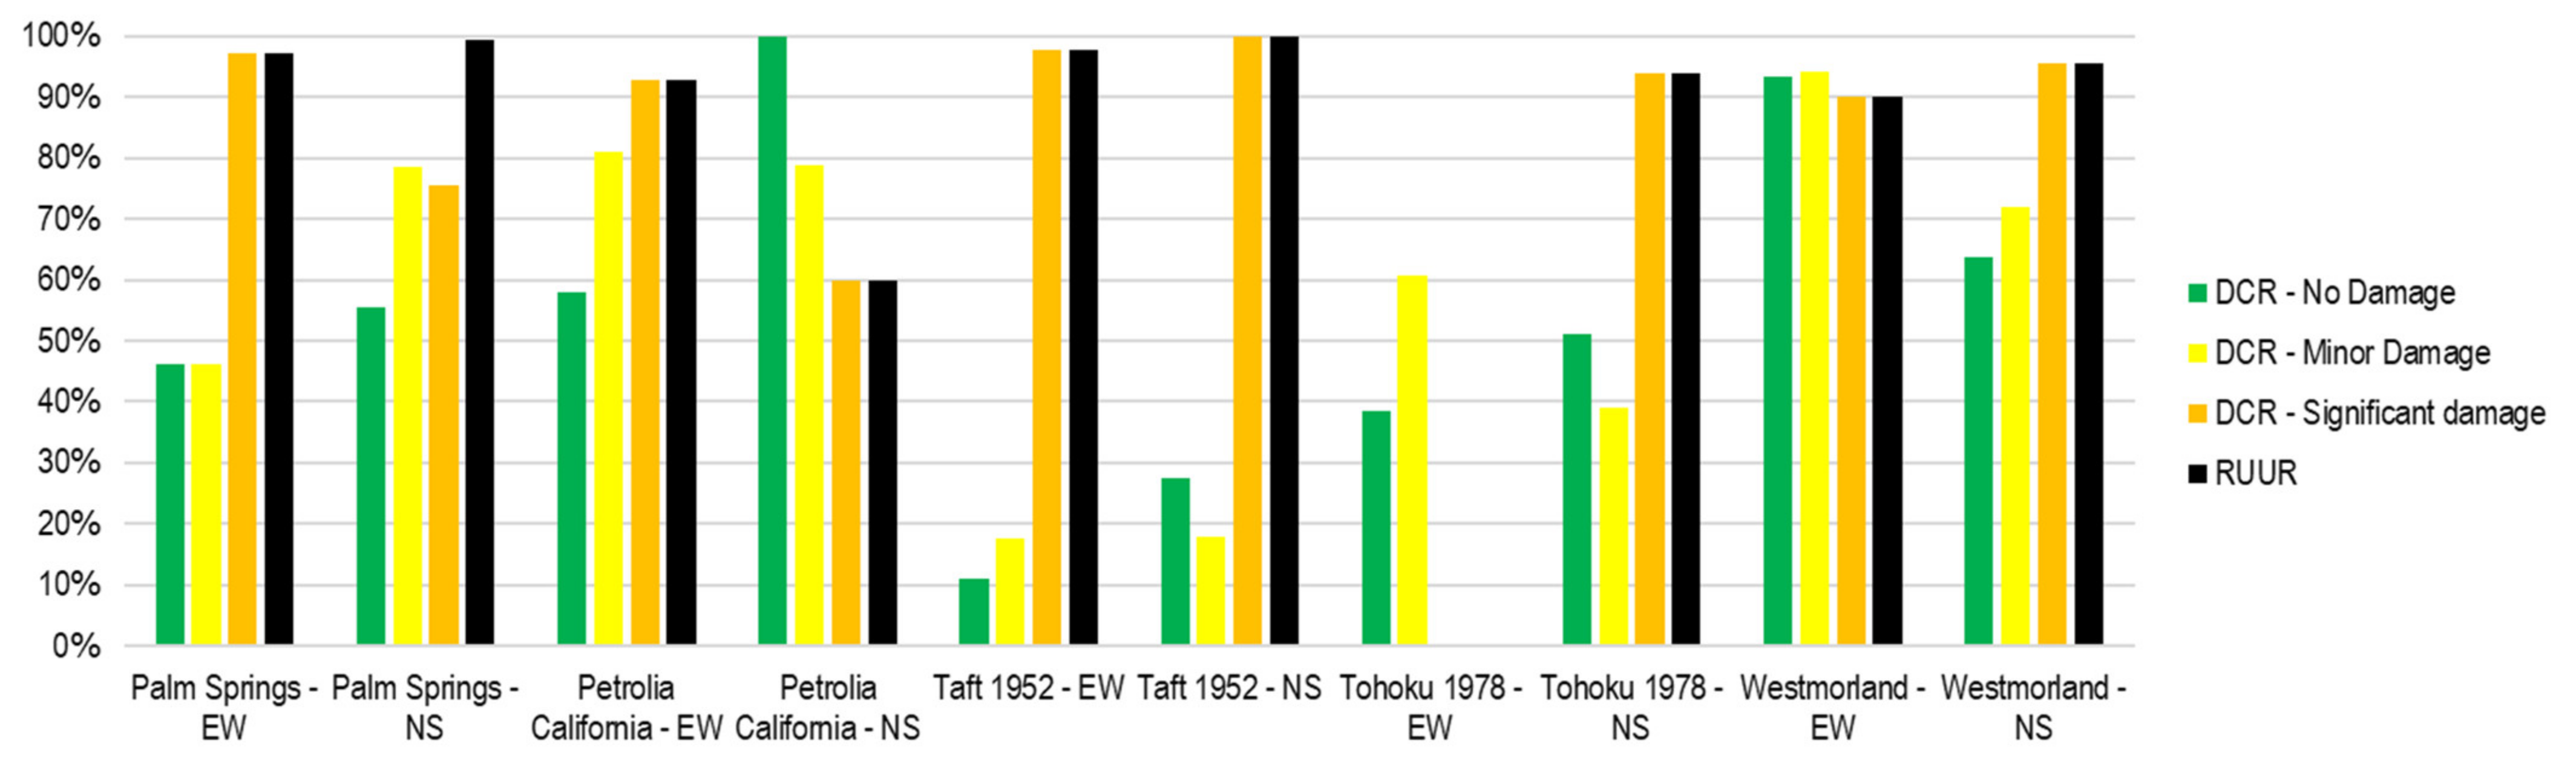
- The damage information evaluated by the CNN model was classified according to the target performance of the building as “no damage”, “minor damage”, “significant damage”, and “severe damage”. Furthermore, new ratios, DCR and RUUR, are proposed to examine the accuracy of the prediction of structural damage.
Author Contributions
Funding
Institutional Review Board Statement
Informed Consent Statement
Data Availability Statement
Conflicts of Interest
References
- National Institute of Civil Defense (INDECI) of Peru. Emergency Report No. 53—COEN-SINADECI; INDECI: Pisco, Peru, 2007. [Google Scholar]
- United Nations World Conference on Disaster Reduction. In Proceedings of the Report of the World Conference on Disaster Reduction, Kobe, Japan, 18–22 January 2005.
- Tilio, L.; Murgante, B.; Di Trani, F.; Vona, M.; Masi, A. Resilient City and Seismic Risk: A Spatial Multicriteria Approach. Comput. Sci. Appl.—ICCSA 2011, 6782, 410–422. [Google Scholar]
- Freddi, F.; Galasso, C.; Cremen, G.; Dall’Asta, A.; Di Sarno, L.; Giaralis, A.; Gutiérrez-Urzúa, F.; Málaga-Chuquitaype, C.; Mitoulis, S.A.; Petrone, C.; et al. Innovations in earthquake risk reduction for resilience: Recent advances and challenges. Int. J. Disaster Risk Reduct. 2021, 60, 102267. [Google Scholar] [CrossRef]
- Limongelli, M.P. Seismic Structural Health Monitoring: From Theory to Successful Applications; Springer: Berlin/Heidelberg, Germany, 2019. [Google Scholar]
- Gkoktsi, K.; Giaralis, A. A compressive MUSIC spectral approach for identification of closely-spaced structural natural frequencies and post-earthquake damage detection. Probabilistic Eng. Mech. 2020, 60, 103030. [Google Scholar] [CrossRef]
- Goulet, J.A.; Michel, C.; Der Kiureghian, A. Data-driven post-earthquake rapid structural safety assessment. Earthq. Eng. Struct. Dyn. 2015, 44, 549–562. [Google Scholar] [CrossRef] [Green Version]
- Sivasuriyan, A.; Vijayan, D.S.; Górski, W.; Wodzynski, Ł.; Vaverková, M.D.; Koda, E. Practical Implementation of Structural Health Monitoring in Multi-Story Buildings. Buildings 2021, 11, 263. [Google Scholar] [CrossRef]
- Antunes, P.; Lima, H.; Varum, H.; André, P. Optical fiber sensors for static and dynamic health monitoring of civil engineering infrastructures: Abode wall case study. Measurement 2012, 45, 1695–1705. [Google Scholar] [CrossRef]
- Roghaei, M.; Zabihollah, A. An Efficient and Reliable Structural Health Monitoring System for Buildings after Earthquake. APCBEE Procedia 2014, 9, 309–316. [Google Scholar] [CrossRef] [Green Version]
- Wang, J.F.; Lin, C.-C.; Yen, S.-M. A story damage index of seismically excited buildings based on modal frequency and mode shape. Eng. Struct. 2007, 29, 2143–2157. [Google Scholar] [CrossRef]
- Xu, K.; Mita, A. Estimation of maximum drift of multi-degree-of-freedom shear structures with unknown parameters using only one accelerometer. Struct. Control. Health Monit. 2021, 28, e2799. [Google Scholar] [CrossRef]
- Worden, K.; Manson, G. The application of machine learning to structural health monitoring. Phil. Trans. R. Soc. A 2007, 365, 515–537. [Google Scholar] [CrossRef]
- Oh, B.P.; Park, H. Seismic response prediction method for building structures using convolutional neural network. Struct. Control. Health Monit. 2020, 27, e2519. [Google Scholar] [CrossRef]
- Tsuchimoto, K.; Narazaki, Y.; Hoskere, V.; Spencer, B. Rapid postearthquake safety evaluation of buildings using sparse acceleration measurements. Struct. Health Monit. 2021, 20, 1822–1840. [Google Scholar] [CrossRef]
- Tsuchimoto, K.; Narazaki, Y.; Spencer, B., Jr. Development and Validation of a Post-Earthquake Safety Assessment System for High-Rise Buildings Using Acceleration Measurements. Mathematics 2021, 9, 1758. [Google Scholar] [CrossRef]
- Huerta-Lopez, C.; Shin, Y.; Powers, E.; Roesset, J. Time-Frequency Analysis of Earthquake Records. In Proceedings of the 12th World Conference on Earthquake Engineering, Auckland, New Zealand, 30 January–4 February 2000. [Google Scholar]
- Tao, D.; Lin, J.; Lu, Z. Time-Frequency Energy Distribution of Ground Motion and Its Effect on the Dynamic Response of Nonlinear Structures. Sustainability 2019, 11, 702. [Google Scholar] [CrossRef] [Green Version]
- Cao, H.; Friswell, M. The effect of energy concentration of earthquake ground motions on the nonlinear response of RC structures. Soil Dyn. Earthq. Eng. 2009, 29, 292–299. [Google Scholar] [CrossRef]
- Spanos, P.D.; Giaralis, A.; Politis, N.P.; Roesset, J.M. Numerical Treatment of Seismic Accelerograms and of Inelastic Seismic Structural Responses Using Harmonic Wavelets. Comput.-Aided Civ. Infrastruct. Eng. 2007, 22, 254–264. [Google Scholar] [CrossRef] [Green Version]
- Balafas, K.; Kiremidjian, A. Development and validation of a novel earthquake damage estimation scheme based on the continuous wavelet transform of input and output acceleration measurements. Earthq. Eng. Struct. Dyn. 2015, 44, 501–522. [Google Scholar] [CrossRef]
- Noh, H.Y.; Nair, K.K.; Lignos, D.G.; Kiremidjian, A.S. Use of Wavelet-Based Damage-Sensitive Features for Structural Damage Diagnosis Using Strong Motion Data. J. Struct. Eng. 2011, 137, 1215–1228. [Google Scholar]
- Xu, C.; Guan, J.; Bao, M.; Lu, J.; Ye, W. Pattern recognition based on time-frequency analysis and convolutional neural networks for vibrational events in φ-OTDR. Opt. Eng. 2018, 57, 016103. [Google Scholar] [CrossRef]
- Dokht, R.; Kao, H.; Visser, R.; Smith, B. Seismic Event and Phase Detection Using Time–Frequency Representation and Convolutional Neural Networks. Seismol. Res. Lett. 2019, 90, 481–490. [Google Scholar] [CrossRef]
- Mousavi, S.; Zhu, W.; Sheng, Y.; Beroza, G. CRED: A Deep Residual Network of Convolutional and Recurrent Units for Earthquake Signal Detection. Sci. Rep. 2019, 9, 1–14. [Google Scholar] [CrossRef]
- Liao, W.; Chen, X.; Lu, X.; Huang, Y.; Tian, Y. Deep Transfer Learning and Time-Frequency Characteristics-Based Identification Method for Structural Seismic Response. Front. Built Environ. 2021, 7, 627058. [Google Scholar] [CrossRef]
- The guide to safe buildings. In JSCA Performance-Based Seismic Design; JSCA: Tokyo, Japan, 2000. (In Japanese)
- Saito, T. Structural Earthquake Response Analysis, STERA_3D Version 10.8. Available online: http://www.rc.ace.tut.ac.jp/saito/software-e.html (accessed on 1 October 2020).
- Torrence, C.; Compor, G.P. A Practical Guide to Wavelet Analysis. Bull. Am. Meteorol. Soc. 1998, 79, 61–78. [Google Scholar] [CrossRef] [Green Version]
- Mueller, J.P.; Massaron, L. Deep Learning. In For Dummies, 1st ed.; IDG: Needham, MA, USA, 2019. [Google Scholar]
- Goodfellow, I.; Bengio, Y.; Courville, A. Deep Learning; MIT Press: Cambridge, MA, USA, 2016. [Google Scholar]
- Albawi, S.; Mohammed, A.; Al-Zawi, S. Understanding of a Convolutional Neural Network. In Proceedings of the 2017 International Conference on Engineering and Technology (ICET), Antalya, Turkey, 21–23 August 2017. [Google Scholar]
- Namatēvs, I. Deep Convolutional Neural Networks: Structure, Feature Extraction and Training. Inf. Technol. Manag. Sci. 2017, 20, 40–47. [Google Scholar] [CrossRef] [Green Version]
- Gerón, A. Hands-On Machine Learning with Scikit-Learn, Keras, and TensorFlow, 2nd ed.; O’Reilly: Newton, MA, USA, 2019. [Google Scholar]
- Kingma, D.P.; Ba, J. Adam: A Method for Stochastic Optimization. In Proceedings of the International Conference Learn. Represent. (ICLR), San Diego, CA, USA, 5–8 May 2015. [Google Scholar]


| Damage Condition | No Damage | Minor Damage | Significant Damage | Severe Damage | Collapse |
|---|---|---|---|---|---|
| Ductility ratio | <1 | ≥1.0 but <2.0 | ≥2.0 but <3.0 | ≥3.0 but <4.0 | ≥4.0 |
| Story drift ratio | <1/300 | ≥1/300 but <1/150 | ≥1/150 but <1/100 | ≥1/100 but < 1/75 | ≥1/75 |
| Acceleration (gal) | <250 | ≥250 but <500 | ≥500 but <1000 | ≥1000 but < 1500 | ≥1500 |
| No. of Layer | No. Kernels | Kernel Size | Padding | Kernel Initializer | Activation Function |
|---|---|---|---|---|---|
| Convolutional Layer 01 | 10 | 10 × 10 | Same | He Normal | ReLU |
| Convolutional Layer 02 | 8 | 3 × 3 | Same | He Normal | ReLU |
| Convolutional Layer 03 | 8 | 3 × 3 | Same | He Normal | ReLU |
| Convolutional Layer 04 | 8 | 3 × 3 | Same | He Normal | ReLU |
| Convolutional Layer 05 | 8 | 3 × 3 | Same | glorot_uniform | ReLU |
| Convolutional Layer 06 | 8 | 3 × 3 | Same | glorot_uniform | ReLU |
| Convolutional Layer 07 | 8 | 3 × 3 | Same | glorot_uniform | ReLU |
| Convolutional Layer 08 | 8 | 3 × 3 | Same | glorot_uniform | ReLU |
| Convolutional Layer 09 | 8 | 3 × 3 | Same | glorot_uniform | ReLU |
| Convolutional Layer 10 | 8 | 3 × 3 | Same | glorot_uniform | ReLU |
| Convolutional Layer 11 | 8 | 3 × 3 | Same | glorot_uniform | ReLU |
| Convolutional Layer 12 | 8 | 3 × 3 | Same | glorot_uniform | ReLU |
| Convolutional Layer 13 | 8 | 3 × 3 | Same | glorot_uniform | ReLU |
| Convolutional Layer 14 | 8 | 3 × 3 | Same | glorot_uniform | ReLU |
| Convolutional Layer 15 | 8 | 3 × 3 | Same | glorot_uniform | ReLU |
| Convolutional Layer 16 | 8 | 3 × 3 | Same | glorot_uniform | ReLU |
| Convolutional Layer 17 | 8 | 3 × 3 | Same | glorot_uniform | ReLU |
| Description | Nomenclature (Units) | Value |
|---|---|---|
| Number of stories | N | 5 |
| Story height | h (m) | 4 |
| Building height | H (m) = h × N | 20 |
| Width | B (m) | 30 |
| Area of floor | A = B2 (m2) | 900 |
| Weight per floor area | w (kN/m2) | 12 |
| Weight of floor | W (kN) | 1080 |
| Fundamental Period | T1 (s) | 0.5 |
| Story | ki (kN/mm) | Qi (kN) |
|---|---|---|
| 5 | 87 | 587.87 |
| 4 | 157 | 954.15 |
| 3 | 209 | 1240.66 |
| 2 | 244 | 1460.87 |
| 1 | 261 | 1620.00 |
| No. | Name | Location | Station Reference | Magnitude | Date |
|---|---|---|---|---|---|
| Training Process * | |||||
| 01 | Anza_01 | USA | 33.706N, 116.235W/Ground Floor: South Wing | Mw = 5.2 | 12/06/2005 |
| 02 | Anza_02 | USA | 33.706N, 116.235W/Roof: Center Hallway of S. Wing | Mw = 5.2 | 12/06/2005 |
| 03 | El Centro 1940 | USA | Imperial Valley Earthquake | Mw = 6.9 | 18/05/1940 |
| 04 | Kobe 1995 | Japan | Great Hanshin Earthquake/Kobe Marine Observatory | Mw = 6.9 | 17/01/1995 |
| 05 | Loma Prieta_01 | USA | 36.974N, 121.952W/Capitola—Fire Station | Ms = 7.1 | 18/10/1989 |
| 06 | Loma Prieta_02 | USA | 36.973N, 121.572W/Gilroy #1—Gavilan College | Ms = 7.1 | 18/10/1989 |
| 07 | Loma Prieta_03 | USA | 36.987N, 121.536W/Gilroy #3—Gilroy Sewage Plant | Ms = 7.1 | 18/10/1989 |
| 08 | Loma Prieta_04 | USA | 37.046N, 121.803W/Corralitos—Eureka Canyon Rd. | Ms = 7.1 | 18/10/1989 |
| 09 | Loma Prieta_05 | USA | 37.118N, 121.550W/Coyote Lake Dam | Ms = 7.1 | 18/10/1989 |
| 10 | Loma Prieta_06 | USA | 37.255N, 122.031W/Saratoga—Aloha Ave. | Ms = 7.1 | 18/10/1989 |
| 11 | Northridge_01 | USA | 34.068N, 118.439W/Los Angeles—UCLA Grounds | Mw = 6.7 | 17/01/1994 |
| 12 | Northridge_02 | USA | 34.236N, 118.439W/Arleta—NordHoff Ave. Fire Station | Mw = 6.7 | 17/01/1994 |
| 13 | Northridge_03 | USA | 34.387N, 118.530W/Newhall—LA County Fire Station | Mw = 6.7 | 17/01/1994 |
| 14 | Petrolia_01 | USA | 40.325N, 124.287W/Petrolia | Mw = 7.0 | 25/04/1992 |
| 15 | Petrolia_02 | USA | 40.503N, 124.100W/Rio Dell—101/Painter St. Overpass | Mw = 7.0 | 25/04/1992 |
| 16 | Petrolia Aftershock_01 | USA | 40.325N, 124.287W/Petrolia/04/26/92, 07:41:40 UTC | Ms = 6.6 | 26/04/1992 |
| 17 | Petrolia Aftershock_02 | USA | 40.325N, 124.287W/Petrolia/04/26/92, 11:18:25 UTC | Ms = 6.6 | 26/04/1992 |
| 18 | Petrolia Aftershock_03 | USA | 40.026N, 124.069W/Shelter Cove—Airport | Ms = 6.6 | 26/04/1992 |
| 19 | Whittier_01 | USA | 34.037N, 118.178W/Los Angeles—Obregon Park | Ml = 6.1 | 01/10/1987 |
| 20 | Whittier_02 | USA | 34.160N, 118.534W/Tarzana—Cedar Hill Nursery | Ml = 6.1 | 01/10/1987 |
| Validation Process * | |||||
| 21 | Palm Springs | USA | 33.962N, 116.509W/Desert Hot Springs | Ml = 6.1 | 08/07/1986 |
| 22 | Petrolia California | USA | 40.325N, 124.287W/Petrolia | Ml = 5.9 | 17/08/1991 |
| 23 | Taft 1952 | USA | Kern County, California Earthquake | Mw = 7.3 | 21/07/1952 |
| 24 | Tohoku 1978 | Japan | Miyagi Earthquake/Recorded at Tohoku University | Ms = 7.7 | 12/06/1978 |
| 25 | Westmorland | USA | 33.037N, 115.623W/Westmorland | Ml = 6.0 | 26/04/1981 |
| No. | Record | Ductility Ratio | Story Drift Ratio | Acceleration |
|---|---|---|---|---|
| 01 | Palm Springs E–W | 0.953 | 0.947 | 0.928 |
| 02 | Palm Springs N–S | 0.895 | 0.917 | 0.951 |
| 03 | Petrolia California E–W | 0.933 | 0.845 | 0.873 |
| 04 | Petrolia California N–S | 0.972 | 0.926 | 0.956 |
| 05 | Taft 1952 E–W | 0.872 | 0.771 | 0.417 |
| 06 | Taft 1952 N–S | 0.806 | 0.848 | 0.870 |
| 07 | Tohoku 1978 E–W | 0.833 | 0.466 | 0.562 |
| 08 | Tohoku 1978 N–S | 0.943 | 0.890 | 0.797 |
| 09 | Westmorland E–W | 0.925 | 0.969 | 0.985 |
| 10 | Westmorland N–S | 0.916 | 0.883 | 0.950 |
| Average | 0.905 | 0.846 | 0.829 |
Publisher’s Note: MDPI stays neutral with regard to jurisdictional claims in published maps and institutional affiliations. |
© 2021 by the authors. Licensee MDPI, Basel, Switzerland. This article is an open access article distributed under the terms and conditions of the Creative Commons Attribution (CC BY) license (https://creativecommons.org/licenses/by/4.0/).
Share and Cite
Moscoso Alcantara, E.A.; Bong, M.D.; Saito, T. Structural Response Prediction for Damage Identification Using Wavelet Spectra in Convolutional Neural Network. Sensors 2021, 21, 6795. https://doi.org/10.3390/s21206795
Moscoso Alcantara EA, Bong MD, Saito T. Structural Response Prediction for Damage Identification Using Wavelet Spectra in Convolutional Neural Network. Sensors. 2021; 21(20):6795. https://doi.org/10.3390/s21206795
Chicago/Turabian StyleMoscoso Alcantara, Edisson Alberto, Michelle Diana Bong, and Taiki Saito. 2021. "Structural Response Prediction for Damage Identification Using Wavelet Spectra in Convolutional Neural Network" Sensors 21, no. 20: 6795. https://doi.org/10.3390/s21206795
APA StyleMoscoso Alcantara, E. A., Bong, M. D., & Saito, T. (2021). Structural Response Prediction for Damage Identification Using Wavelet Spectra in Convolutional Neural Network. Sensors, 21(20), 6795. https://doi.org/10.3390/s21206795