
Fusion Method to Estimate Heart Rate from Facial Videos Based on RPPG and RBCG


Abstract
:1. Introduction
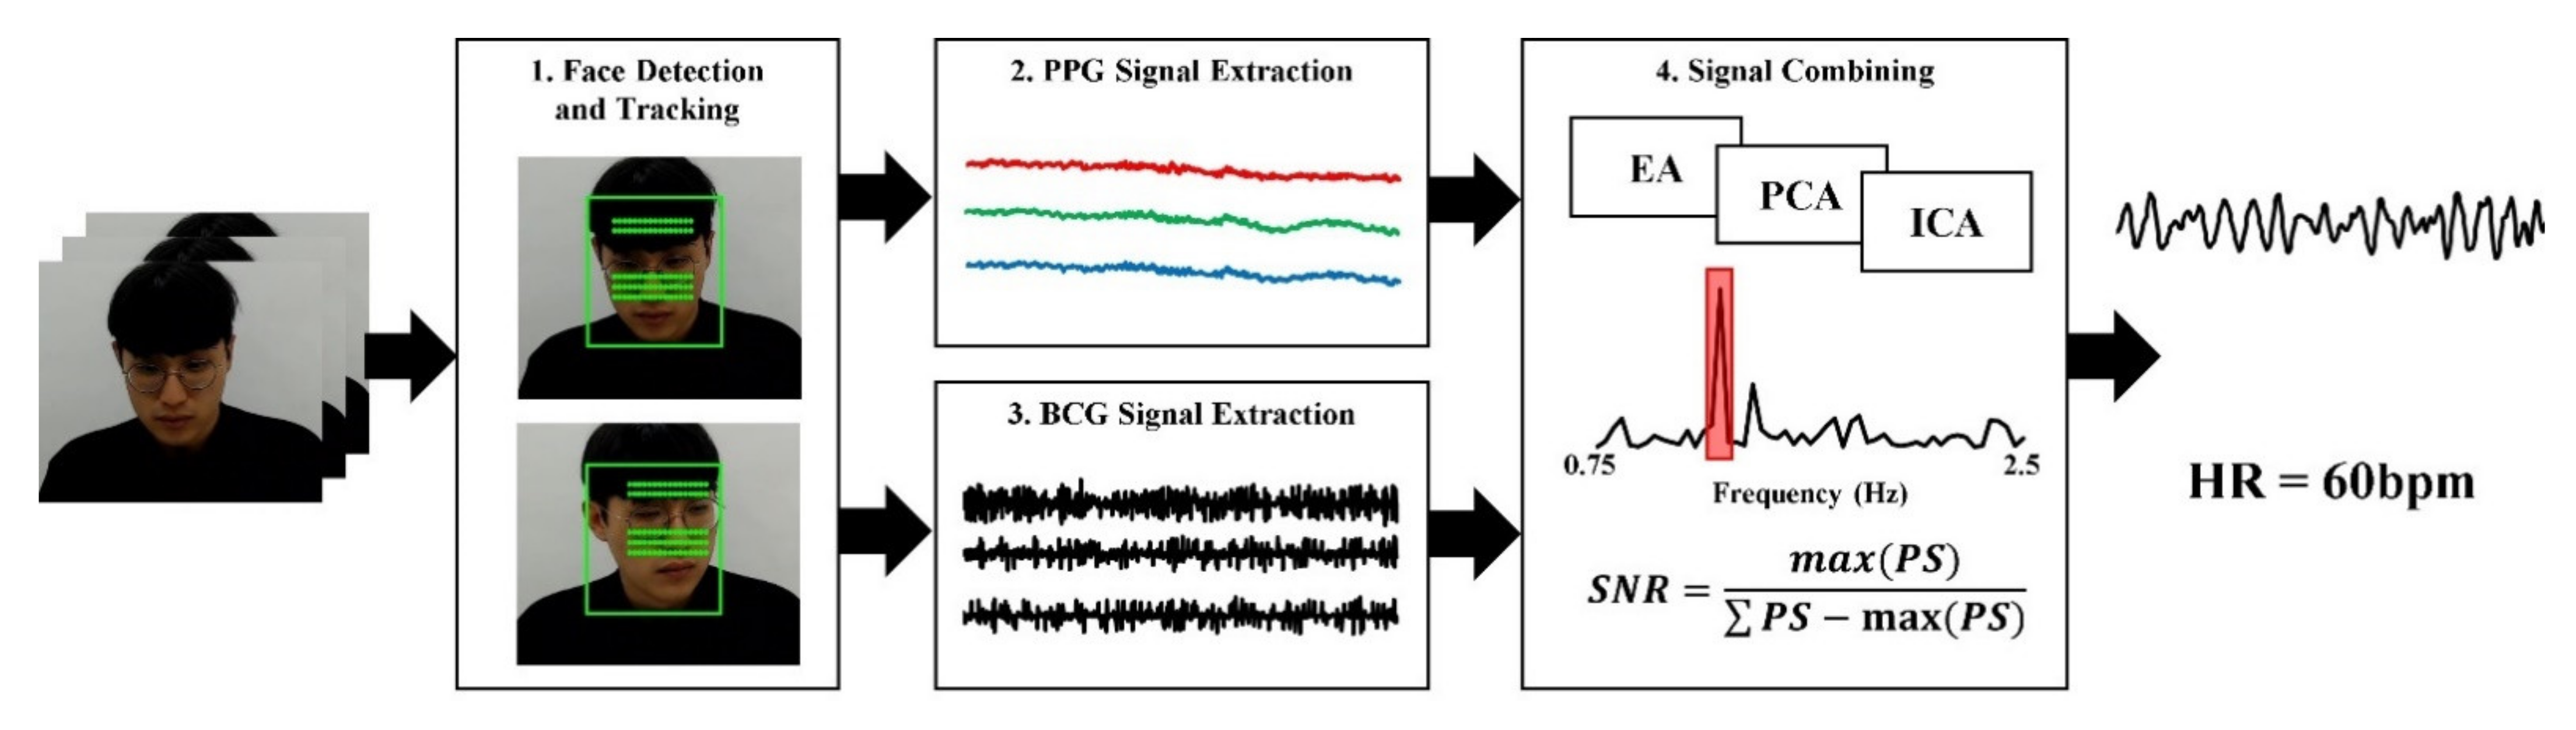
2. Proposed Method
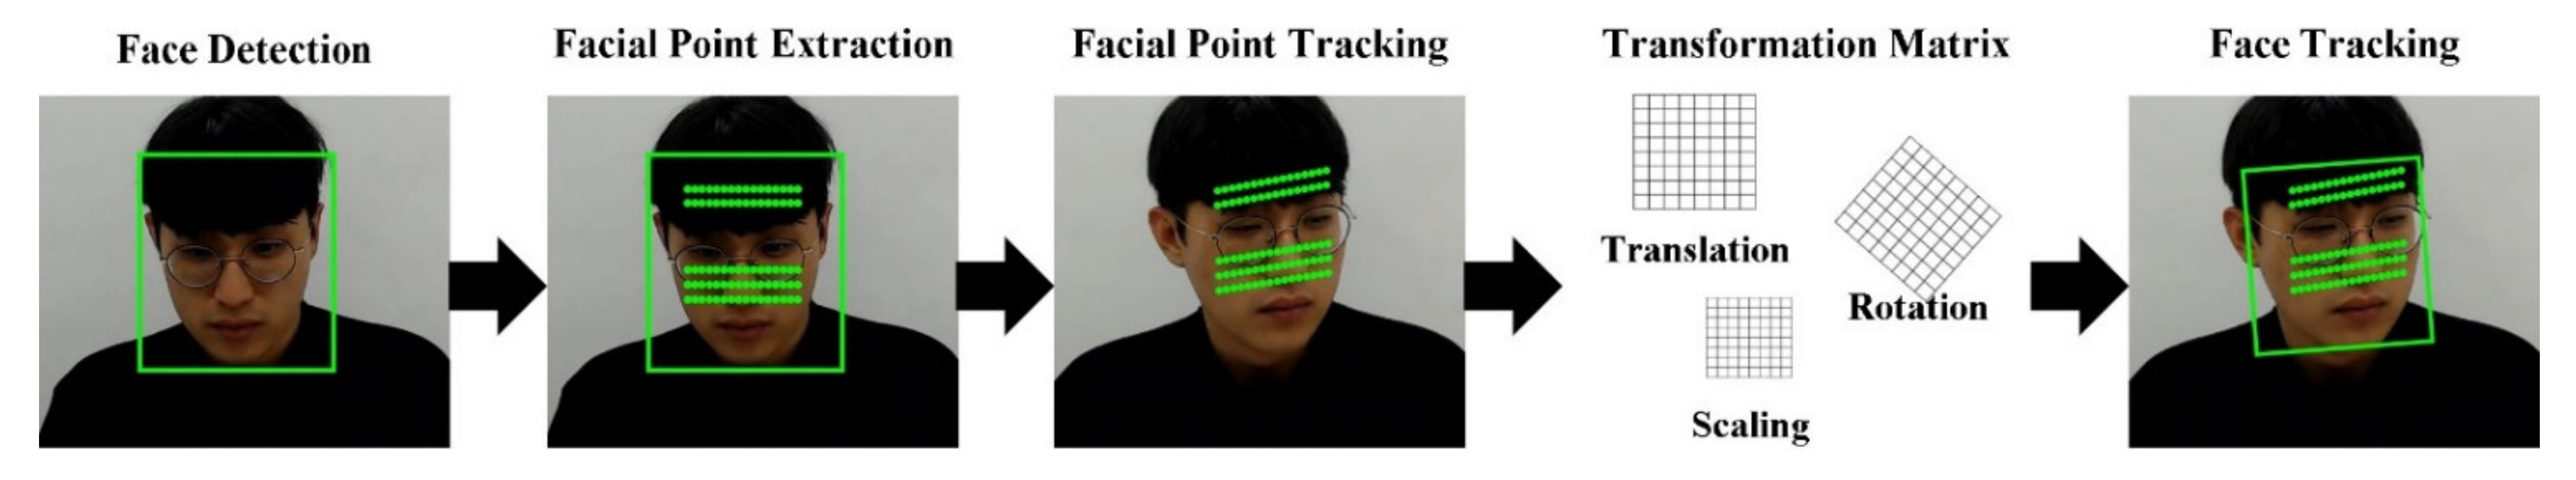
2.1. Face Detection and Tracking
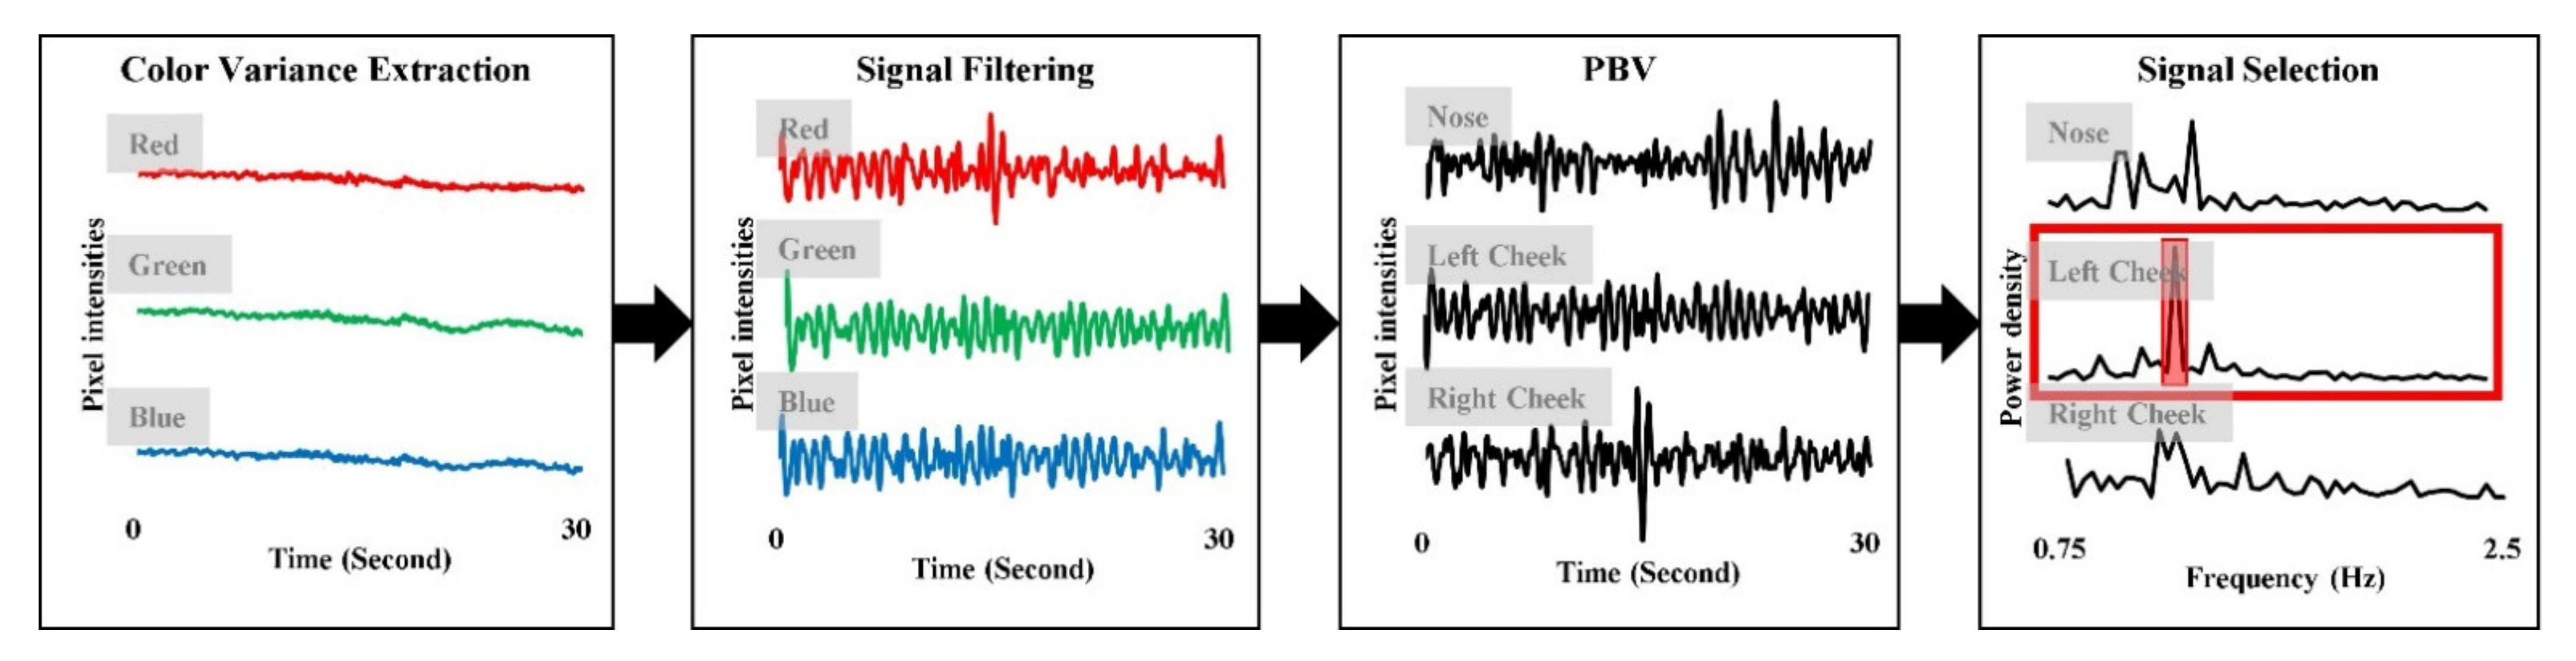
2.2. Photoplethysmographic Signal Extraction
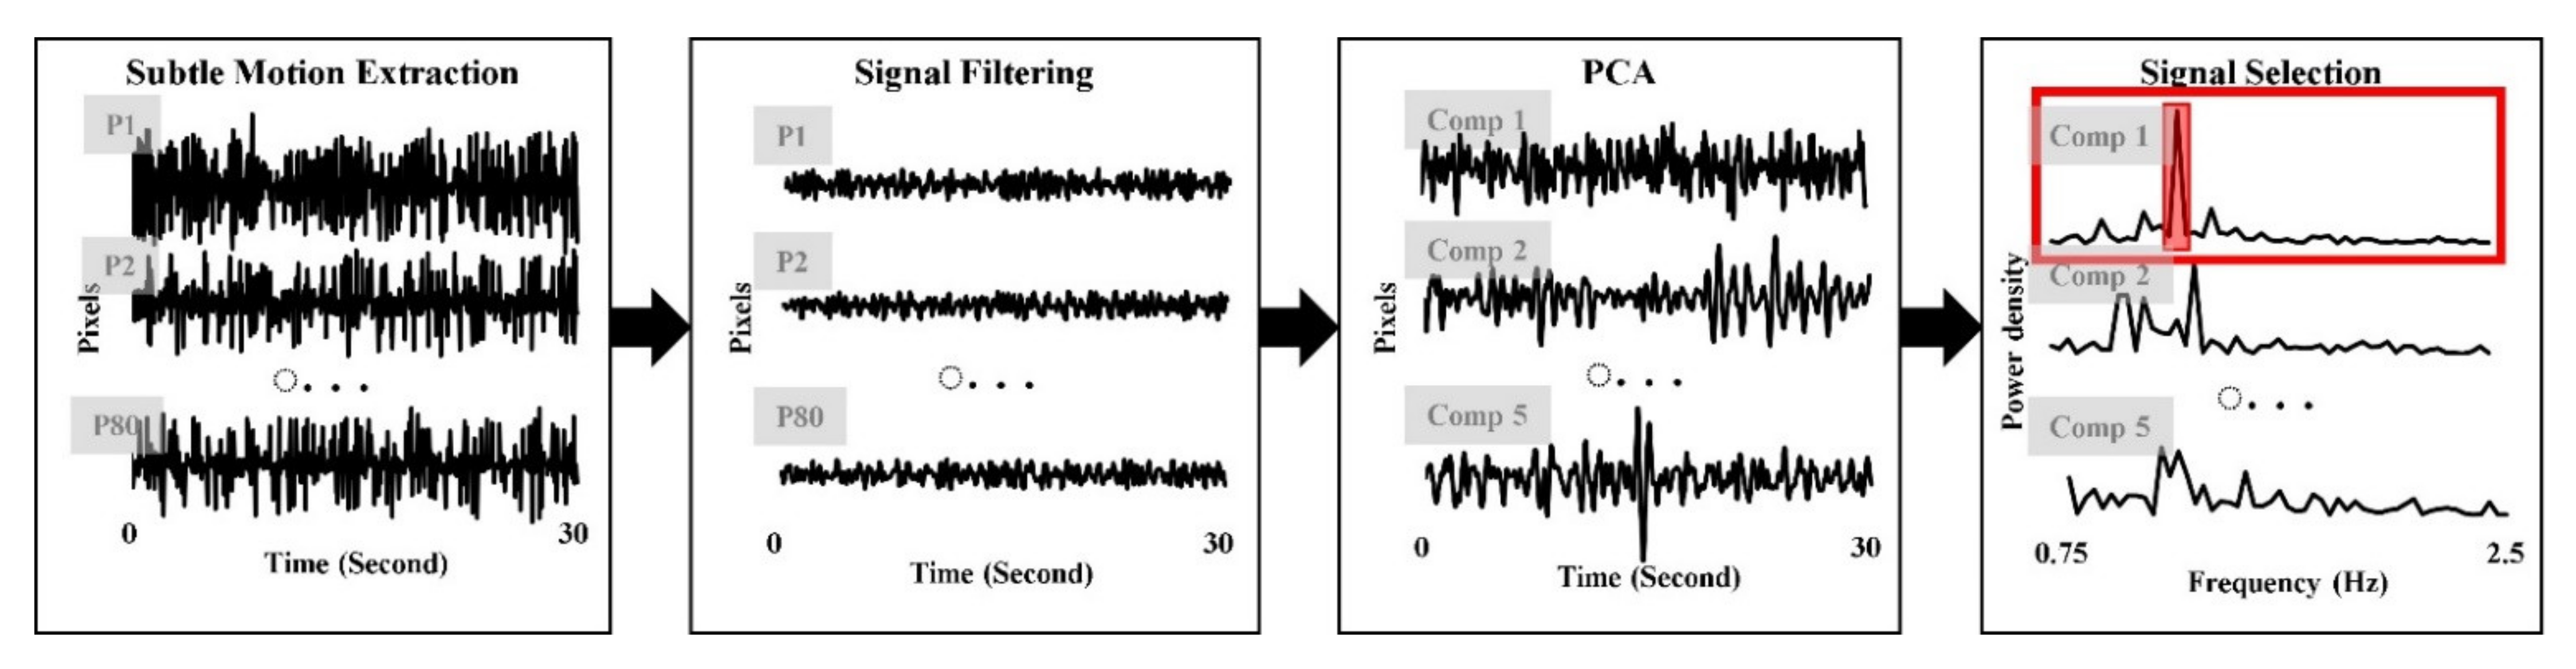
2.3. Ballistocardiographic Signal Extraction
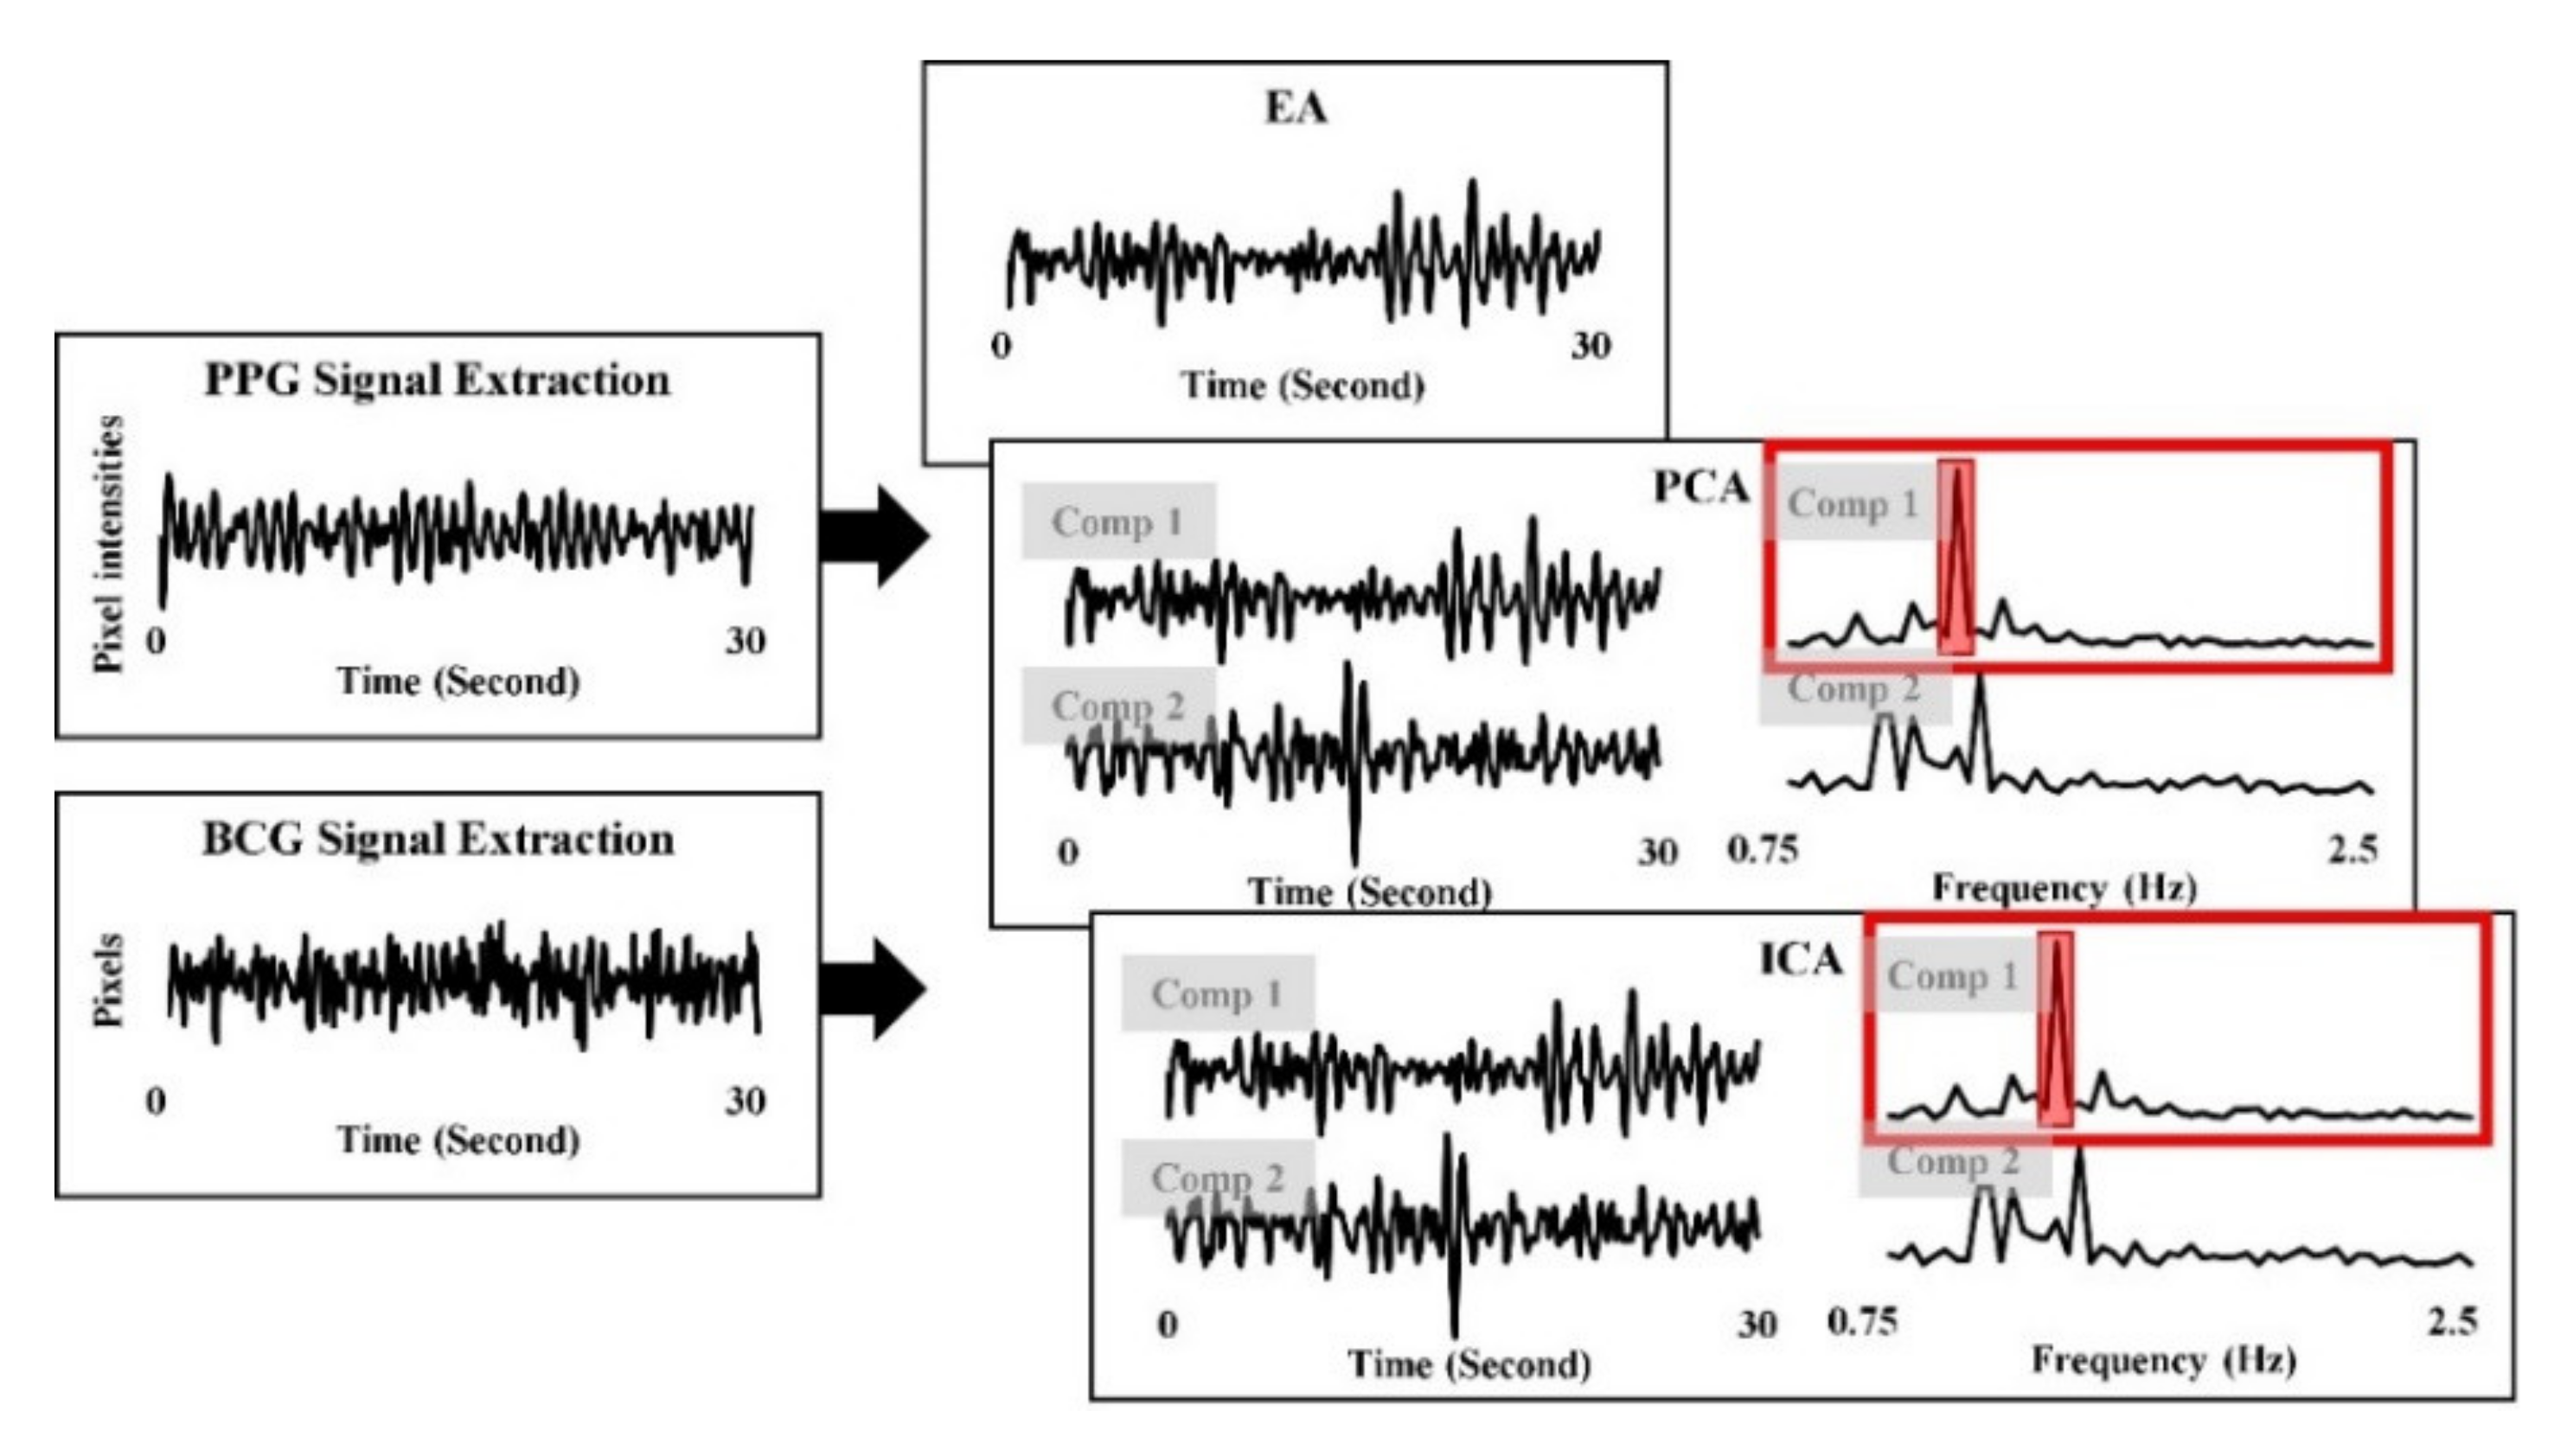
2.4. Signial Combining
2.5. Heart Rate Estimation
3. Experiments
3.1. Experiment 1: Normal
3.2. Experiment 2: Facial Expressions
3.3. Experiment 3: Human Computer Interactions
4. Results
4.1. Experiment 1: Normal
4.2. Experiment 2: Facial Expressions
4.3. Experiment 3: Human Computer Interactions
5. Discussion
6. Conclusions
Author Contributions
Funding
Institutional Review Board Statement
Informed Consent Statement
Data Availability Statement
Conflicts of Interest
References
- Rouast, P.V.; Adam, M.T.P.; Chiong, R.; Cornforth, D.; Lux, E. Remote heart rate measurement using low-cost RGB face video: A technical literature review. Front. Comput. Sci. 2018, 12, 858–872. [Google Scholar] [CrossRef]
- Hertzman, A.B.; Dillon, J.B. Applications of photoelectric plethysmography in peripheral vascular disease. Am. Heart J. 1940, 20, 750–761. [Google Scholar] [CrossRef]
- Kamshilin, A.A.; Nippolainen, E.; Sidorov, I.S.; Vasilev, P.V.; Erofeev, N.P.; Podolian, N.P.; Romashko, R.V. A new look at the essence of the imaging photoplethysmography. Sci. Rep. 2015, 5, 1–9. [Google Scholar] [CrossRef] [PubMed] [Green Version]
- Poh, M.Z.; McDuff, D.J.; Picard, R.W. Non-contact, automated cardiac pulse measurements using video imaging and blind source separation. Opt. Express 2010, 18, 10762–10774. [Google Scholar] [CrossRef] [PubMed]
- Xu, L.; Cheng, J.; Chen, X. Illumination variation interference suppression in remote PPG using PLS and MEMD. Electron. Lett. 2017, 53, 216–218. [Google Scholar] [CrossRef]
- Zhang, Y.; Dong, Z.; Zhang, K.; Shu, S.; Lu, F.; Chen, J. Illumination variation-resistant video-based heart rate monitoring using LAB color space. Opt. Lasers Eng. 2021, 136, 106328. [Google Scholar] [CrossRef]
- Starr, I.; Rawson, A.J.; Schroeder, H.A.; Joseph, N.R. Studies on the Estimation of Cardiac Output in Man, and of Abnormalities in Cardiac Function, from the heart’s Recoil and the blood’s Impacts; the Ballistocardiogram. Am. J. Physiol. Leg. Content 1939, 127, 1–28. [Google Scholar] [CrossRef]
- Balakrishnan, G.; Durand, F.; Guttag, J. Detecting pulse from head motions in video. In Proceedings of the IEEE Conference on Computer Vision and Pattern Recognition (CVPR), Portland, OR, USA, 23–28 June 2013; pp. 3430–3437. [Google Scholar]
- Shan, L.; Yu, M. Video-based heart rate measurement using head motion tracking and ICA. In Proceedings of the 2013 6th International Congress on Image and Signal Processing (CISP), Hangzhou, China, 16–18 December 2013; pp. 160–164. [Google Scholar]
- Haque, M.A.; Nasrollahi, K.; Moeslund, T.B.; Irani, R. Facial video-based detection of physical fatigue for maximal muscle activity. IET Comput. Vis. 2016, 10, 323–330. [Google Scholar] [CrossRef] [Green Version]
- Hassan, M.A.; Malik, A.S.; Fofi, D.; Saad, N.M.; Ali, Y.S.; Meriaudeau, F. Video-Based Heartbeat Rate Measuring Method Using Ballistocardiography. IEEE Sens. J. 2017, 17, 4544–4557. [Google Scholar] [CrossRef]
- Shao, D.; Tsow, F.; Liu, C.; Yang, Y.; Tao, N. Simultaneous monitoring of ballistocardiogram and photoplethysmogram using a camera. IEEE Trans. Biomed. Eng. 2016, 64, 1003–1010. [Google Scholar] [CrossRef] [PubMed] [Green Version]
- Liu, Y.; Qin, B.; Li, R.; Li, X.; Huang, A.; Liu, H.; Liu, M. Motion-Robust Multimodal Heart Rate Estimation Using BCG Fused Remote-PPG With Deep Facial ROI Tracker and Pose Constrained Kalman Filter. IEEE Trans. Instrum. Meas. 2021, 70, 1–15. [Google Scholar]
- Viola, P.; Jones, M. Rapid object detection using a boosted cascade of simple features. In Proceedings of the IEEE Conference on Computer Vision and Pattern Recognition (CVPR), Kauai, HI, USA, 8–14 December 2001; pp. 511–518. [Google Scholar]
- OpenCV: Cascade Classifier. Available online: https://docs.opencv.org/4.2.0/db/d28/tutorial_cascade_classifier.html (accessed on 28 May 2020).
- Dalal, N.; Triggs, B. Histograms of oriented gradients for human detection. In Proceedings of the IEEE Computer Society Conference on Computer Vision and Pattern Recognition (CVPR), San Diego, CA, USA, 20–26 June 2005; pp. 886–893. [Google Scholar]
- Dlib: Face Detector. Available online: http://dlib.net/face_detector.py.html (accessed on 28 May 2020).
- Abadi, M.; Barham, P.; Chen, J.; Chen, Z.; Davis, J.; Kudlur, M. Tensorflow: A system for large-scale machine learning. In Proceedings of the USENIX Symposium on Operating Systems Design and Implementation (OSDI), Savannah, GA, USA, 2–4 November 2016; pp. 265–283. [Google Scholar]
- Liu, W.; Anguelov, D.; Erhan, D.; Szegedy, C.; Reed, S.; Fu, C.Y.; Berg, A.C. Ssd: Single shot multibox detector. In Proceedings of the European Conference on Computer Vision (ECCV), Amsterdam, The Netherlands, 8–16 October 2016; pp. 21–37. [Google Scholar]
- He, K.; Zhang, X.; Ren, S.; Sun, J. Deep residual learning for image recognition. In Proceedings of the IEEE Conference on Computer Vision and Pattern Recognition (CVPR), Las Vegas, NV, USA, 27–30 June 2016; pp. 770–778. [Google Scholar]
- Yang, S.; Luo, P.; Loy, C.C.; Tang, X. Wider face: A face detection benchmark. In Proceedings of the IEEE Conference on Computer Vision and Pattern Recognition (CVPR), Las Vegas, NV, USA, 27–30 June 2016; pp. 5525–5533. [Google Scholar]
- OpenCV: Face Detector by SSD in DNN Module. Available online: https://github.com/opencv/opencv/tree/master/samples/dnn/face_detector (accessed on 28 May 2020).
- Bouguet, J.Y. Pyramidal implementation of the affine lucas kanade feature tracker description of the algorithm. Intel Corp. 2001, 5, 4. [Google Scholar]
- Lempe, G.; Zaunseder, S.; Wirthgen, T.; Zipser, S.; Malberg, H. ROI selection for remote photoplethysmography. In Proceedings of the Bildverarbeitung für die Medizin, Heidelberg, Germany, 3–5 March 2013; pp. 99–103. [Google Scholar]
- De Hann, G.; Jeanne, V. Robust pulse rate from chrominance-based rPPG. IEEE Trans. Biomed. Eng. 2013, 60, 2878–2886. [Google Scholar] [CrossRef] [PubMed]
- De Haan, G.; Van Leest, A. Improved motion robustness of remote-PPG by using the blood volume pulse signature. Physiol. Meas. 2014, 35, 1913. [Google Scholar] [CrossRef] [PubMed]
- Lee, H.; Lee, H.; Whang, M. An enhanced method to estimate heart rate from seismocardiography via ensemble averaging of boy movements at six degrees of freedom. Sensors 2018, 18, 238. [Google Scholar] [CrossRef] [PubMed] [Green Version]
- Russell, J.A. A circumplex model of affect. J. Personal. Soc. Psychol. 1980, 39, 1161. [Google Scholar] [CrossRef]
- Pan, J.; Tompkins, W.J. A real-time QRS detection algorithm. IEEE Trans. Biomed. Eng. 1985, 3, 230–236. [Google Scholar] [CrossRef] [PubMed]


| Methods | MAE (bpm) | SDAE (bpm) | RMSE (bpm) | CC (r) |
|---|---|---|---|---|
| RPPG | 1.84 | 1.66 | 2.49 | 0.981 ** |
| RBCG | 2.56 | 2.26 | 3.48 | 0.927 ** |
| Fusion (EA) | 1.05 | 0.93 | 1.42 | 0.996 ** |
| Fusion (PCA) | 1.08 | 0.99 | 1.49 | 0.996 ** |
| Fusion (ICA) | 1.04 | 0.91 | 1.39 | 0.999 ** |
| Methods | MAE (bpm) | SDAE (bpm) | RMSE (bpm) | CC (r) |
|---|---|---|---|---|
| RPPG | 3.13 | 2.59 | 4.09 | 0.947 ** |
| RBCG | 3.94 | 4.07 | 5.71 | 0.920 ** |
| Fusion (EA) | 3.06 | 2.56 | 4.53 | 0.955 ** |
| Fusion (PCA) | 2.76 | 2.34 | 3.23 | 0.968 ** |
| Fusion (ICA) | 2.99 | 2.53 | 4.17 | 0.972 ** |
| Methods | MAE (bpm) | SDAE (bpm) | RMSE (bpm) | CC (r) |
|---|---|---|---|---|
| RPPG | 5.68 | 2.93 | 6.53 | 0.713 ** |
| RBCG | 14.06 | 6.75 | 15.86 | 0.051 |
| Fusion (EA) | 4.79 | 2.13 | 5.81 | 0.629 ** |
| Fusion (PCA) | 5.42 | 4.2.84 | 6.13 | 0.622 ** |
| Fusion (ICA) | 5.66 | 3.59 | 6.48 | 0.617 ** |
Publisher’s Note: MDPI stays neutral with regard to jurisdictional claims in published maps and institutional affiliations. |
© 2021 by the authors. Licensee MDPI, Basel, Switzerland. This article is an open access article distributed under the terms and conditions of the Creative Commons Attribution (CC BY) license (https://creativecommons.org/licenses/by/4.0/).
Share and Cite
Lee, H.; Cho, A.; Whang, M. Fusion Method to Estimate Heart Rate from Facial Videos Based on RPPG and RBCG. Sensors 2021, 21, 6764. https://doi.org/10.3390/s21206764
Lee H, Cho A, Whang M. Fusion Method to Estimate Heart Rate from Facial Videos Based on RPPG and RBCG. Sensors. 2021; 21(20):6764. https://doi.org/10.3390/s21206764
Chicago/Turabian StyleLee, Hyunwoo, Ayoung Cho, and Mincheol Whang. 2021. "Fusion Method to Estimate Heart Rate from Facial Videos Based on RPPG and RBCG" Sensors 21, no. 20: 6764. https://doi.org/10.3390/s21206764
APA StyleLee, H., Cho, A., & Whang, M. (2021). Fusion Method to Estimate Heart Rate from Facial Videos Based on RPPG and RBCG. Sensors, 21(20), 6764. https://doi.org/10.3390/s21206764