
Strategies for Deploying a Sensor Network to Explore Planetary Lava Tubes


Abstract
:1. Introduction
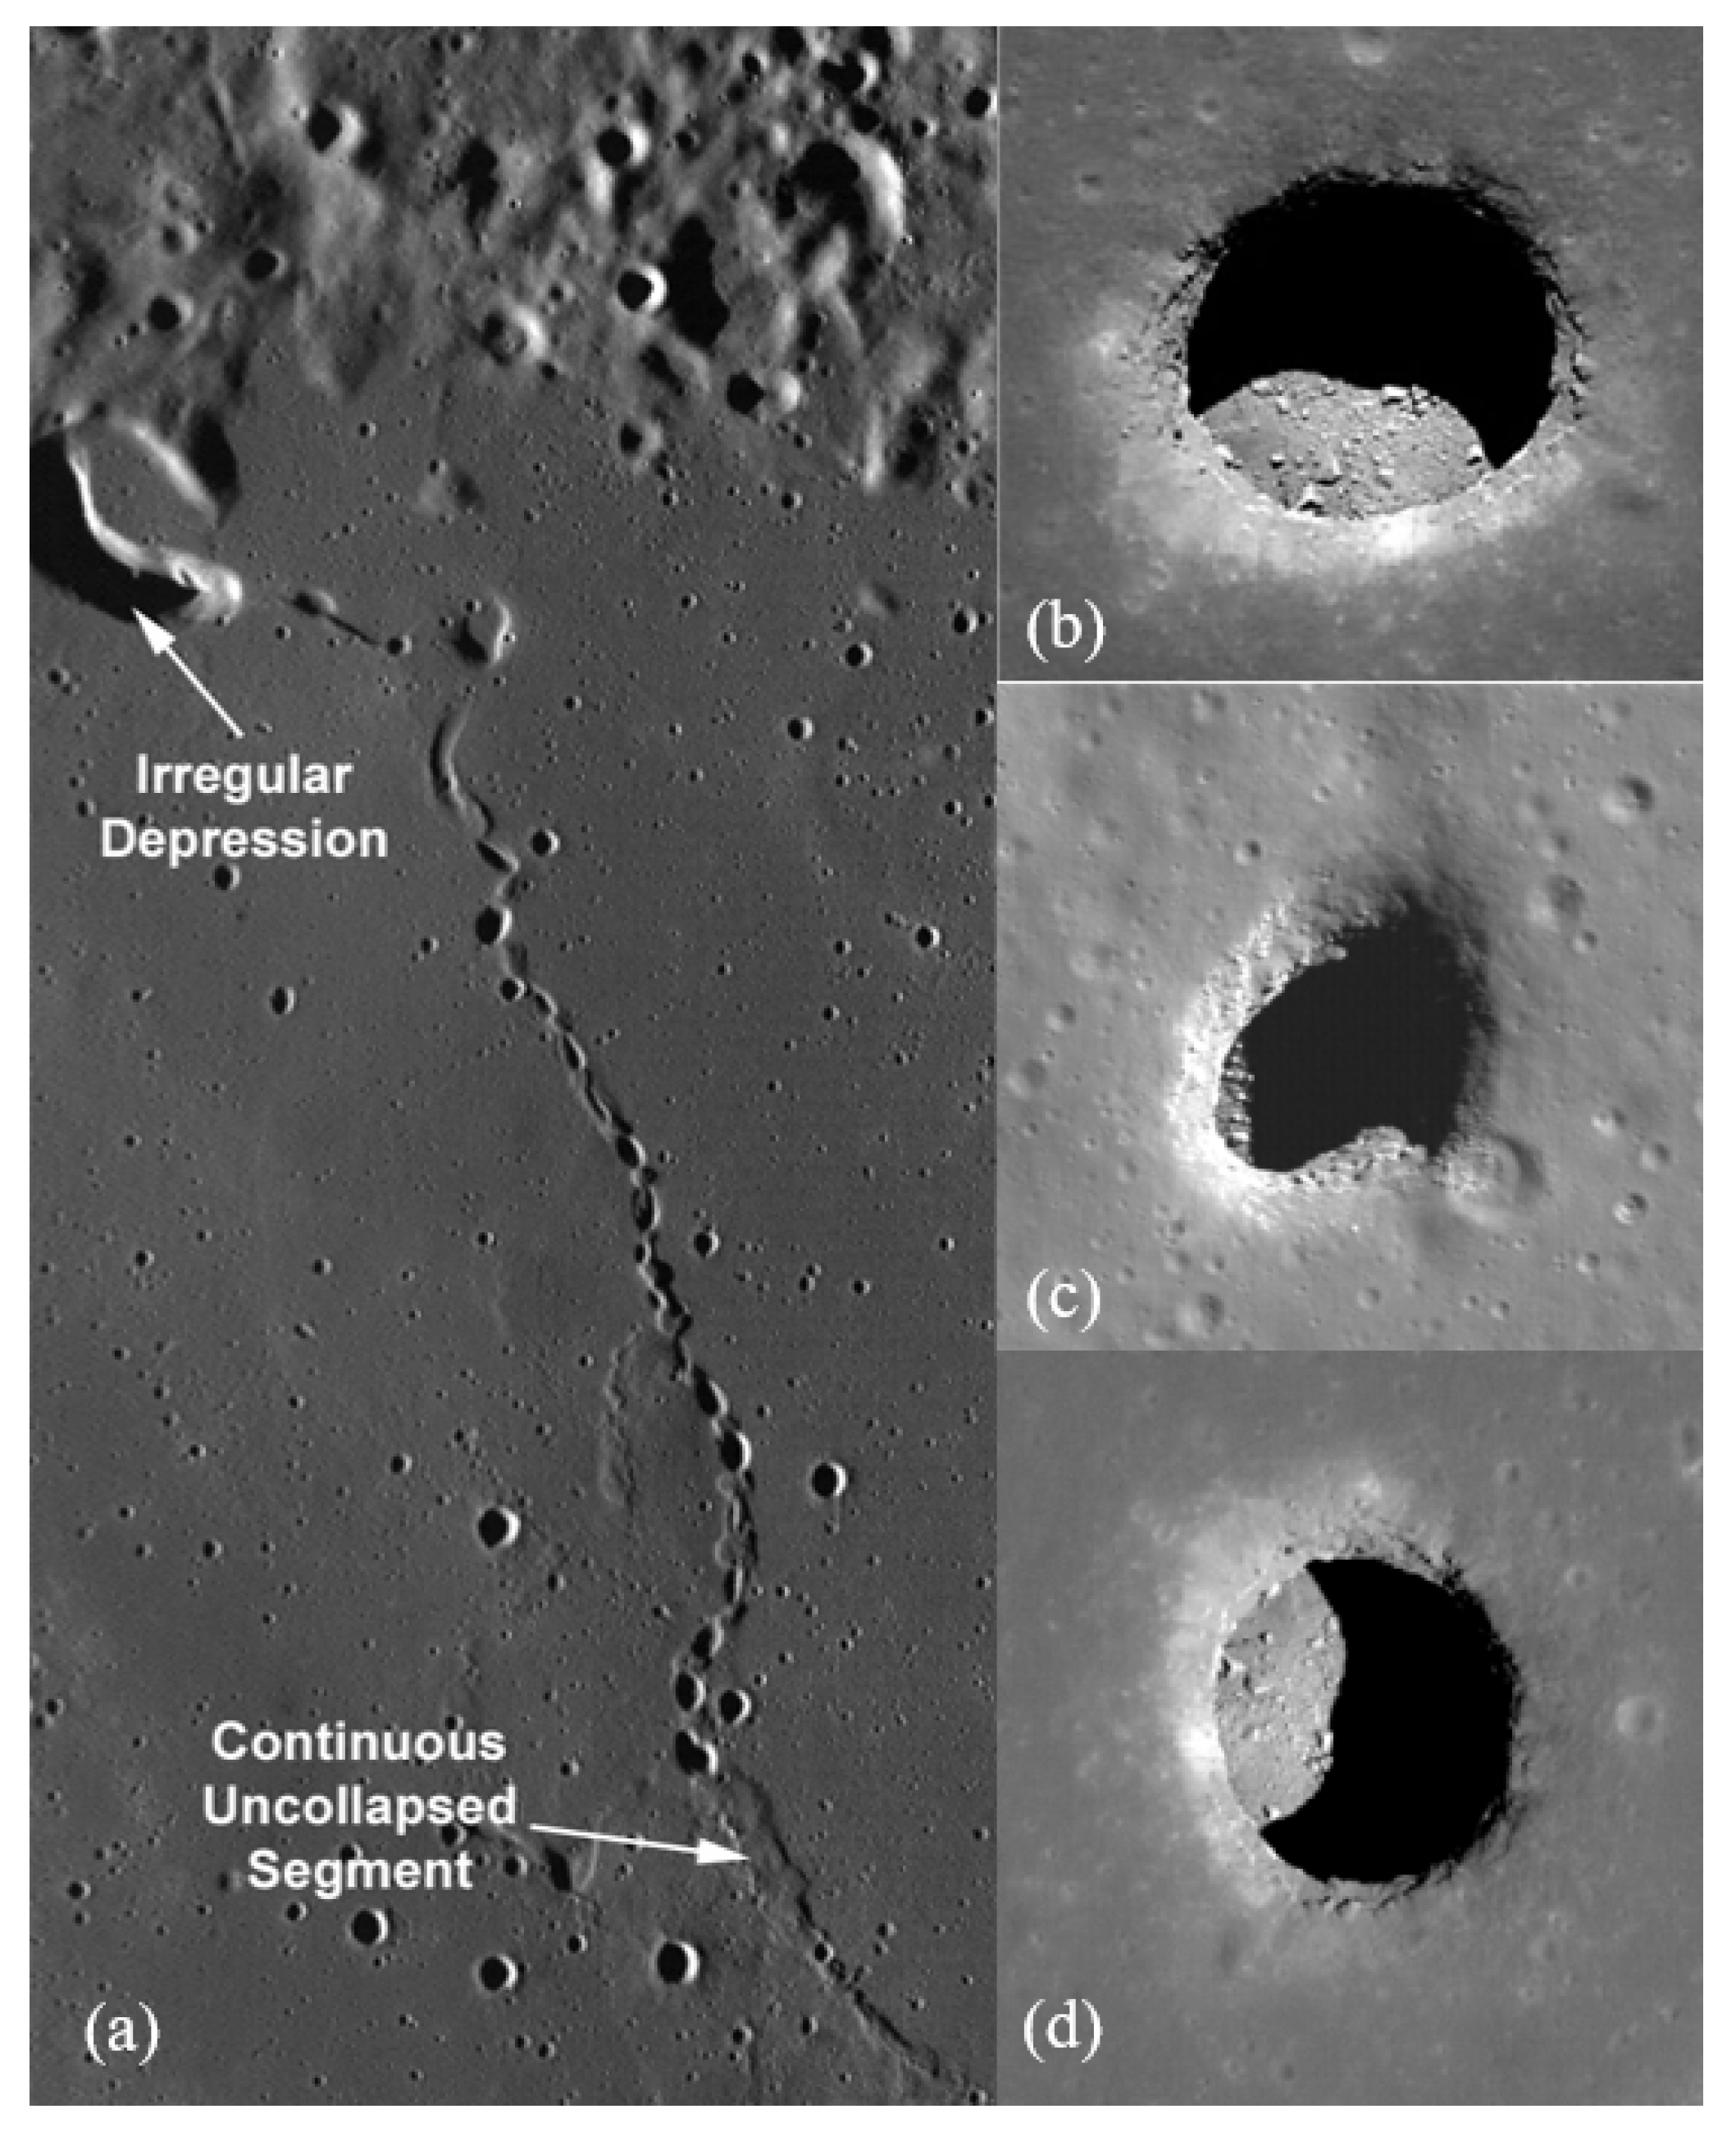
1.1. High-Resolution Lunar Imaging
1.2. Potential Utility of Lunar Lava Tubes
1.3. Martian Lava Tubes
1.4. Robotics for Exploring Rugged Environments
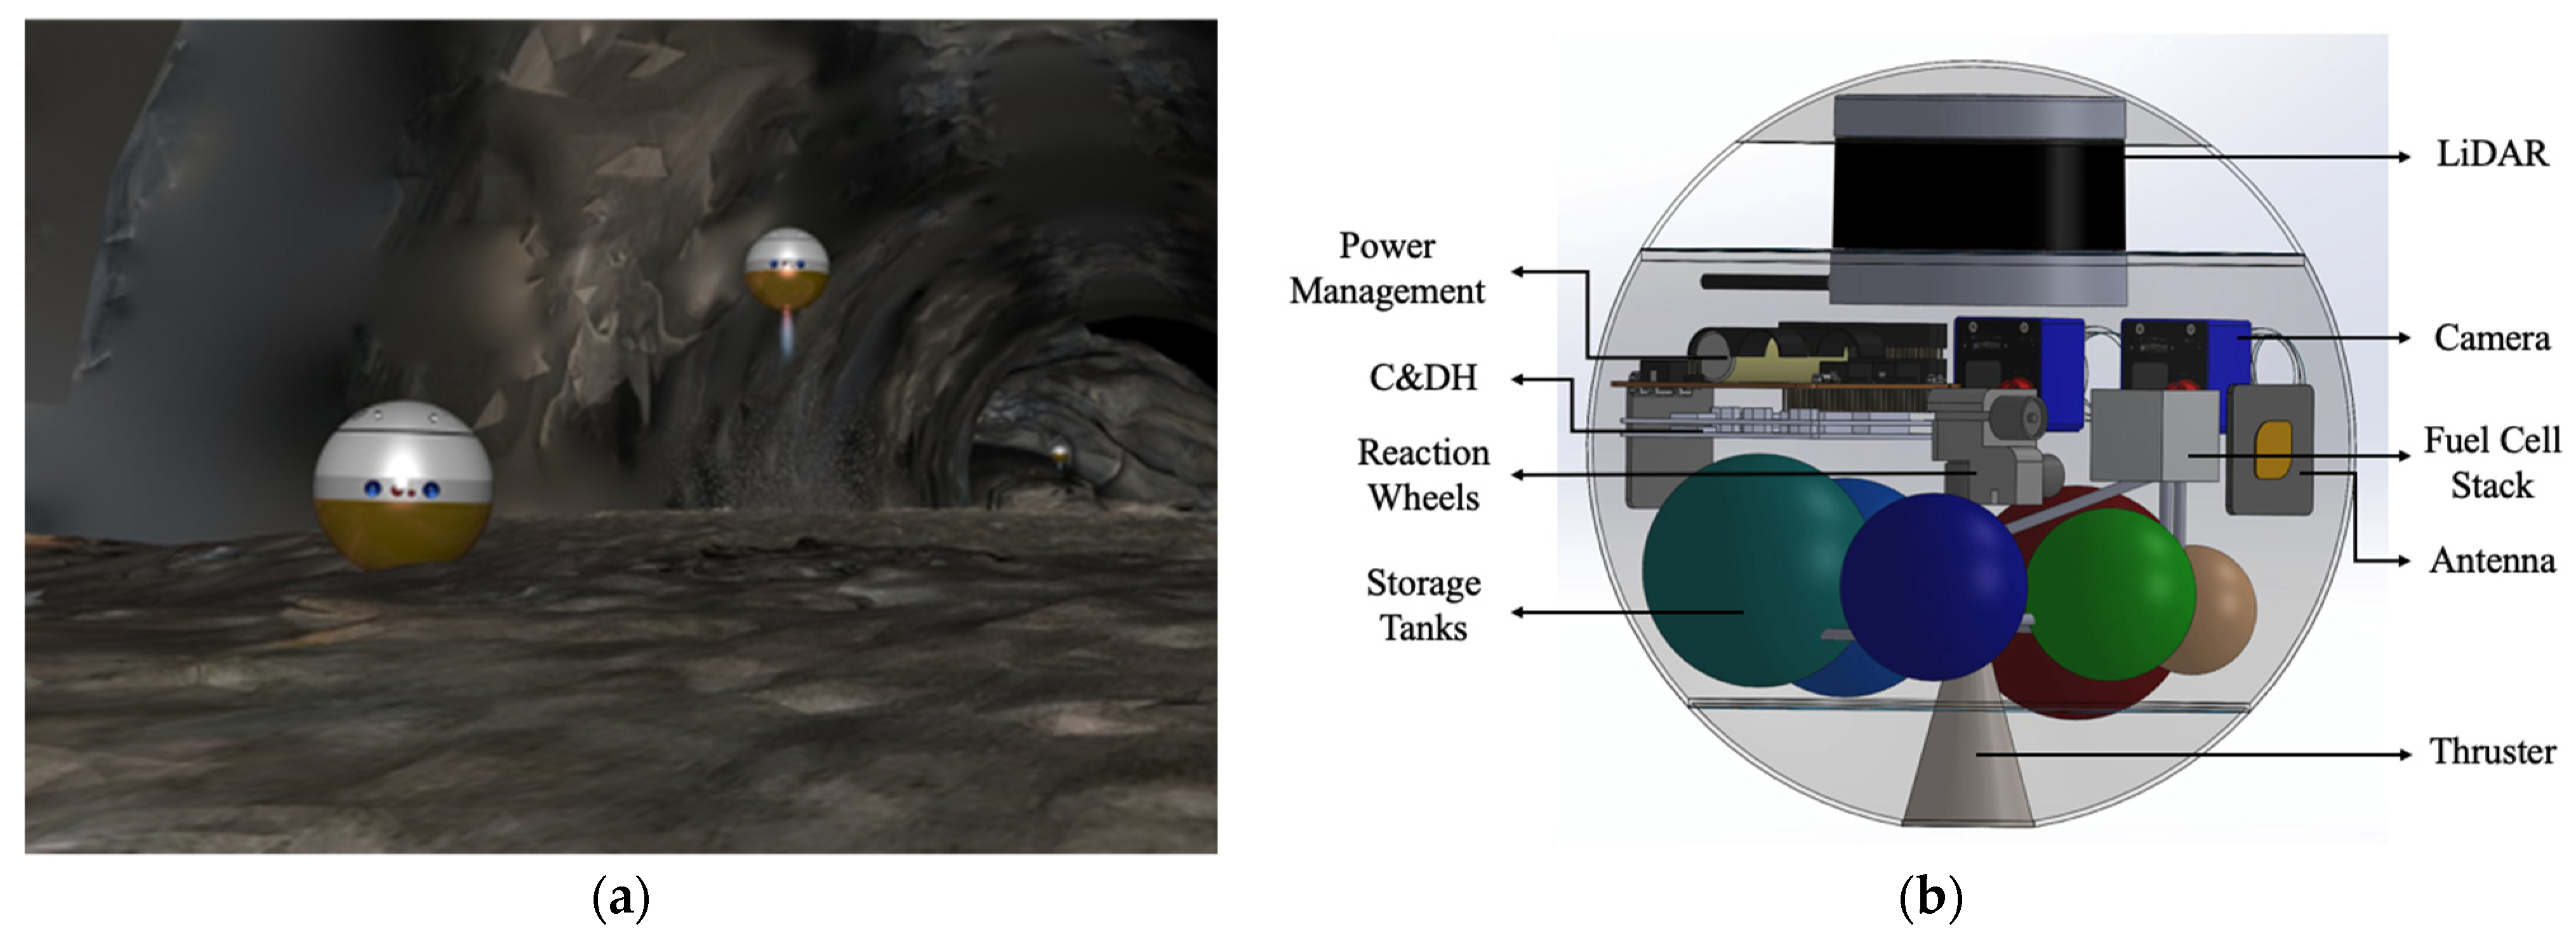
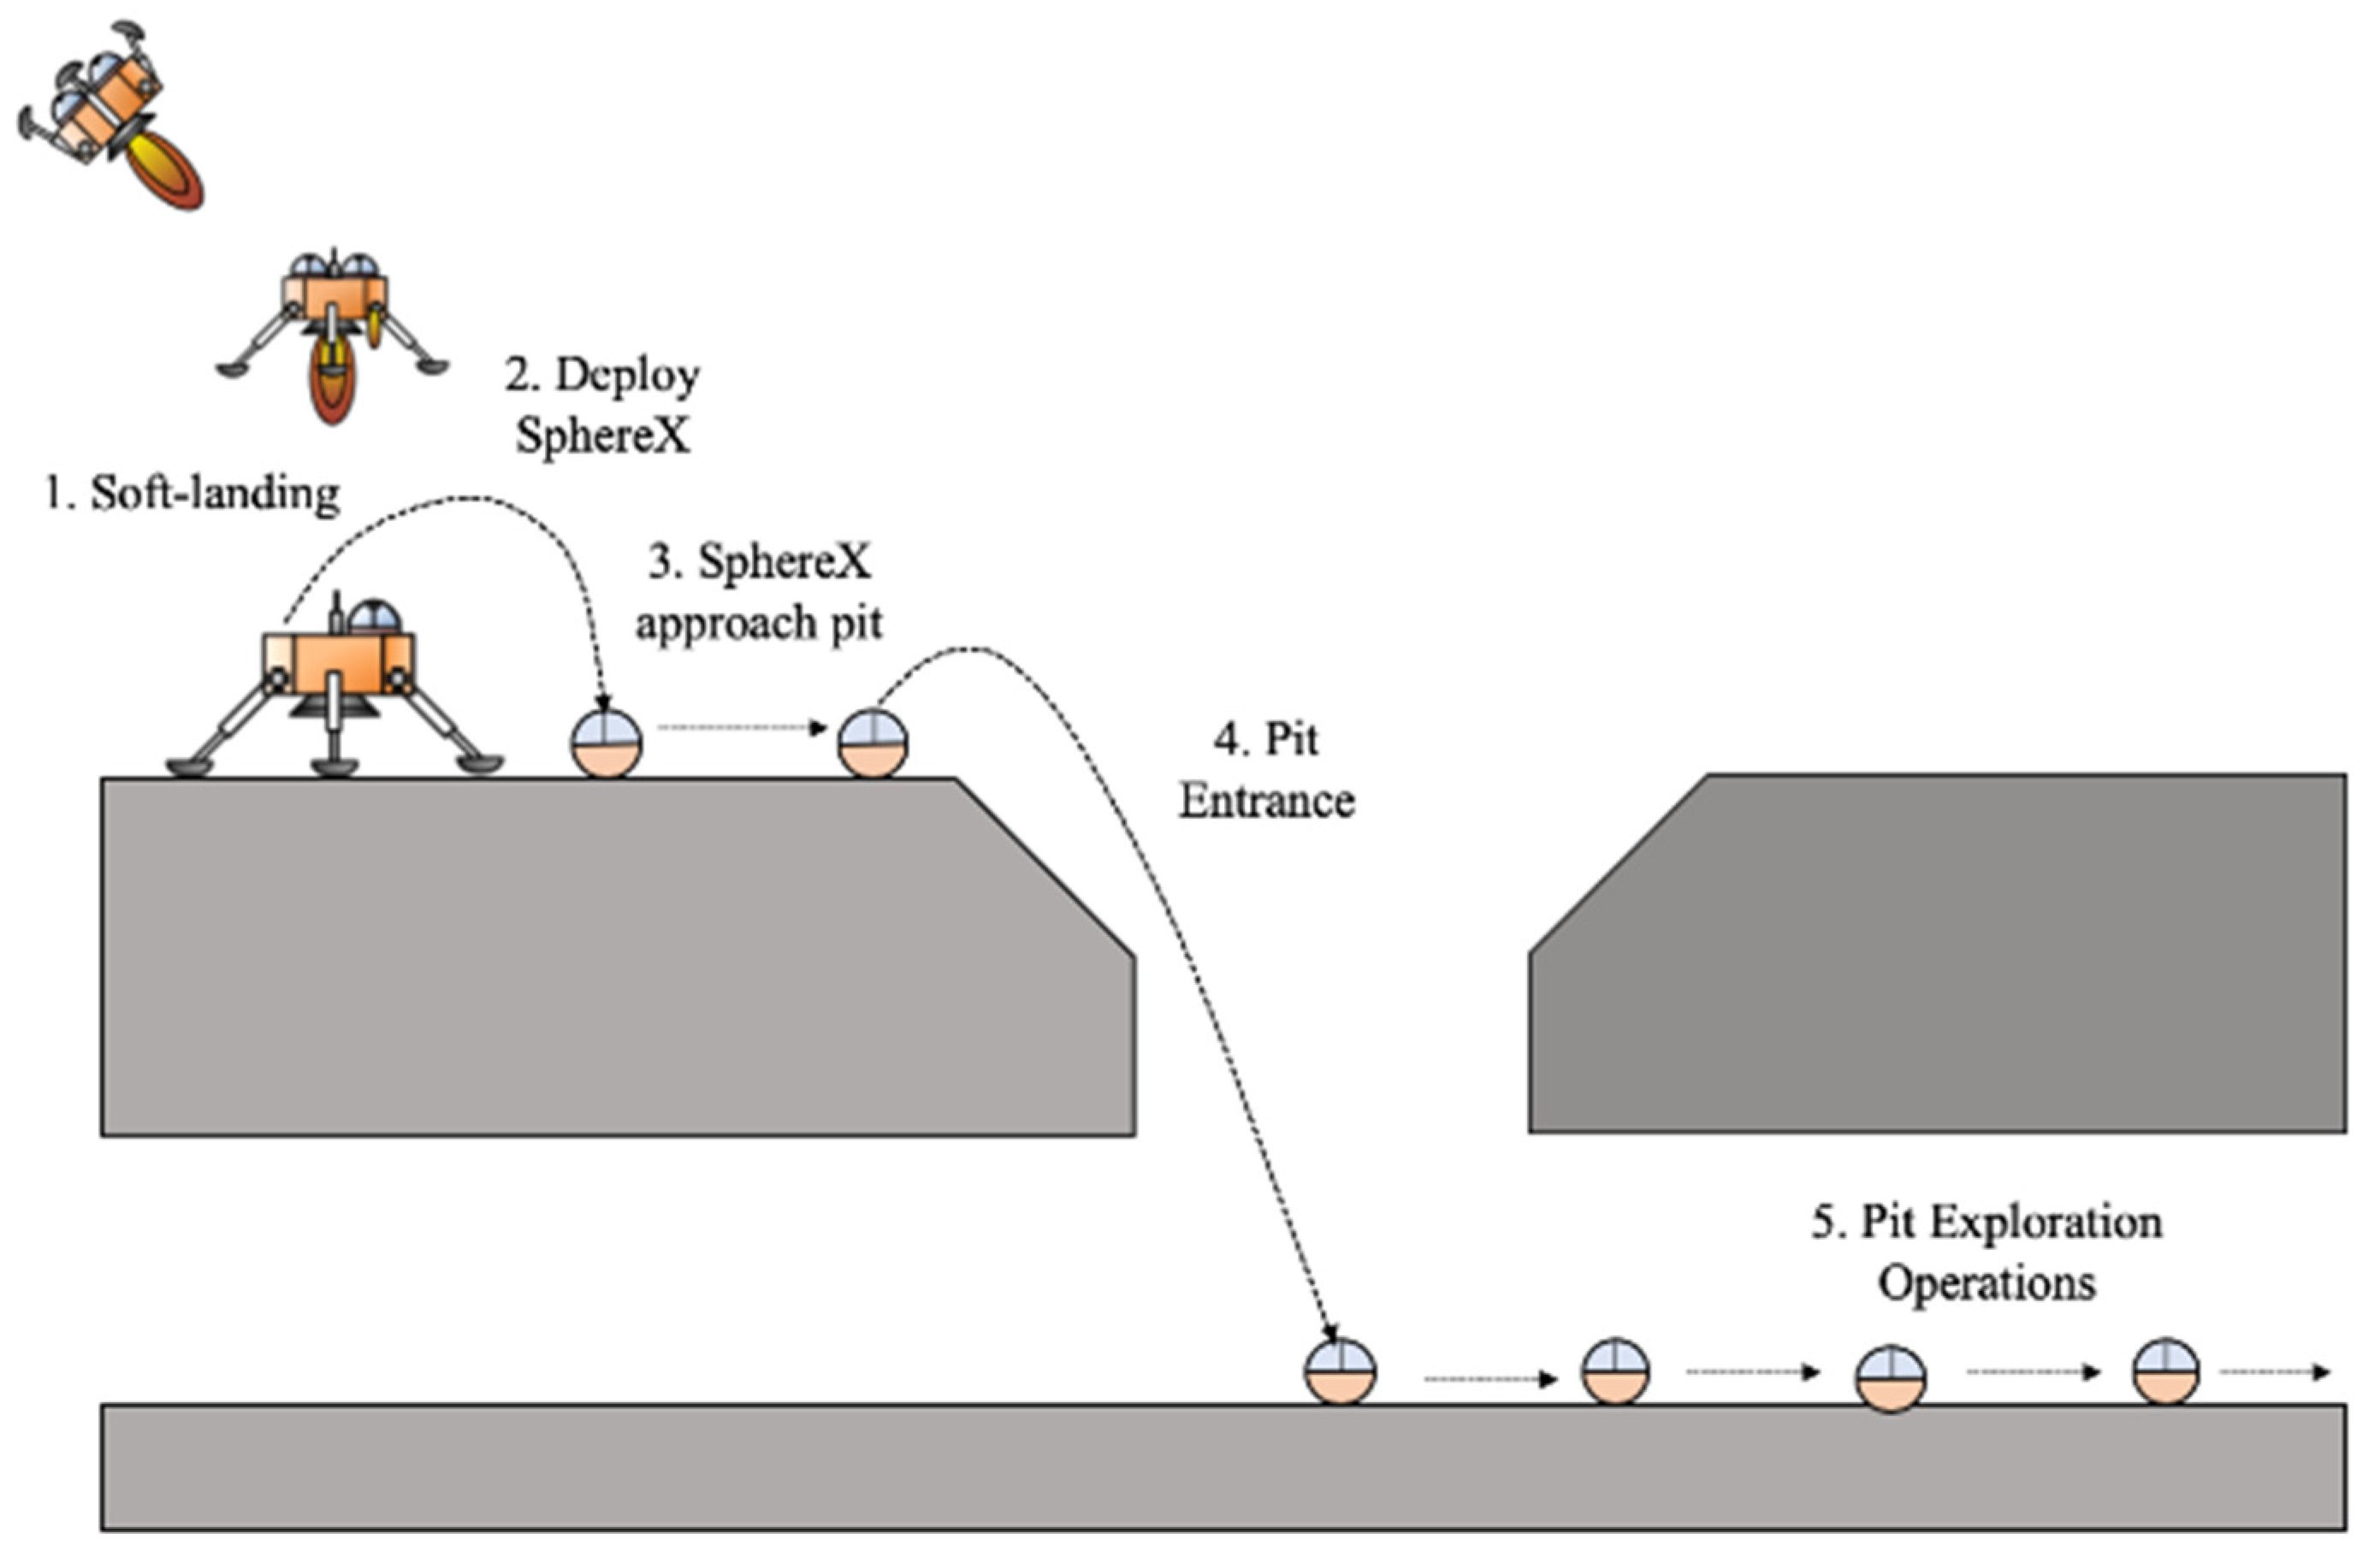
2. Mission Architecture
Preliminaries
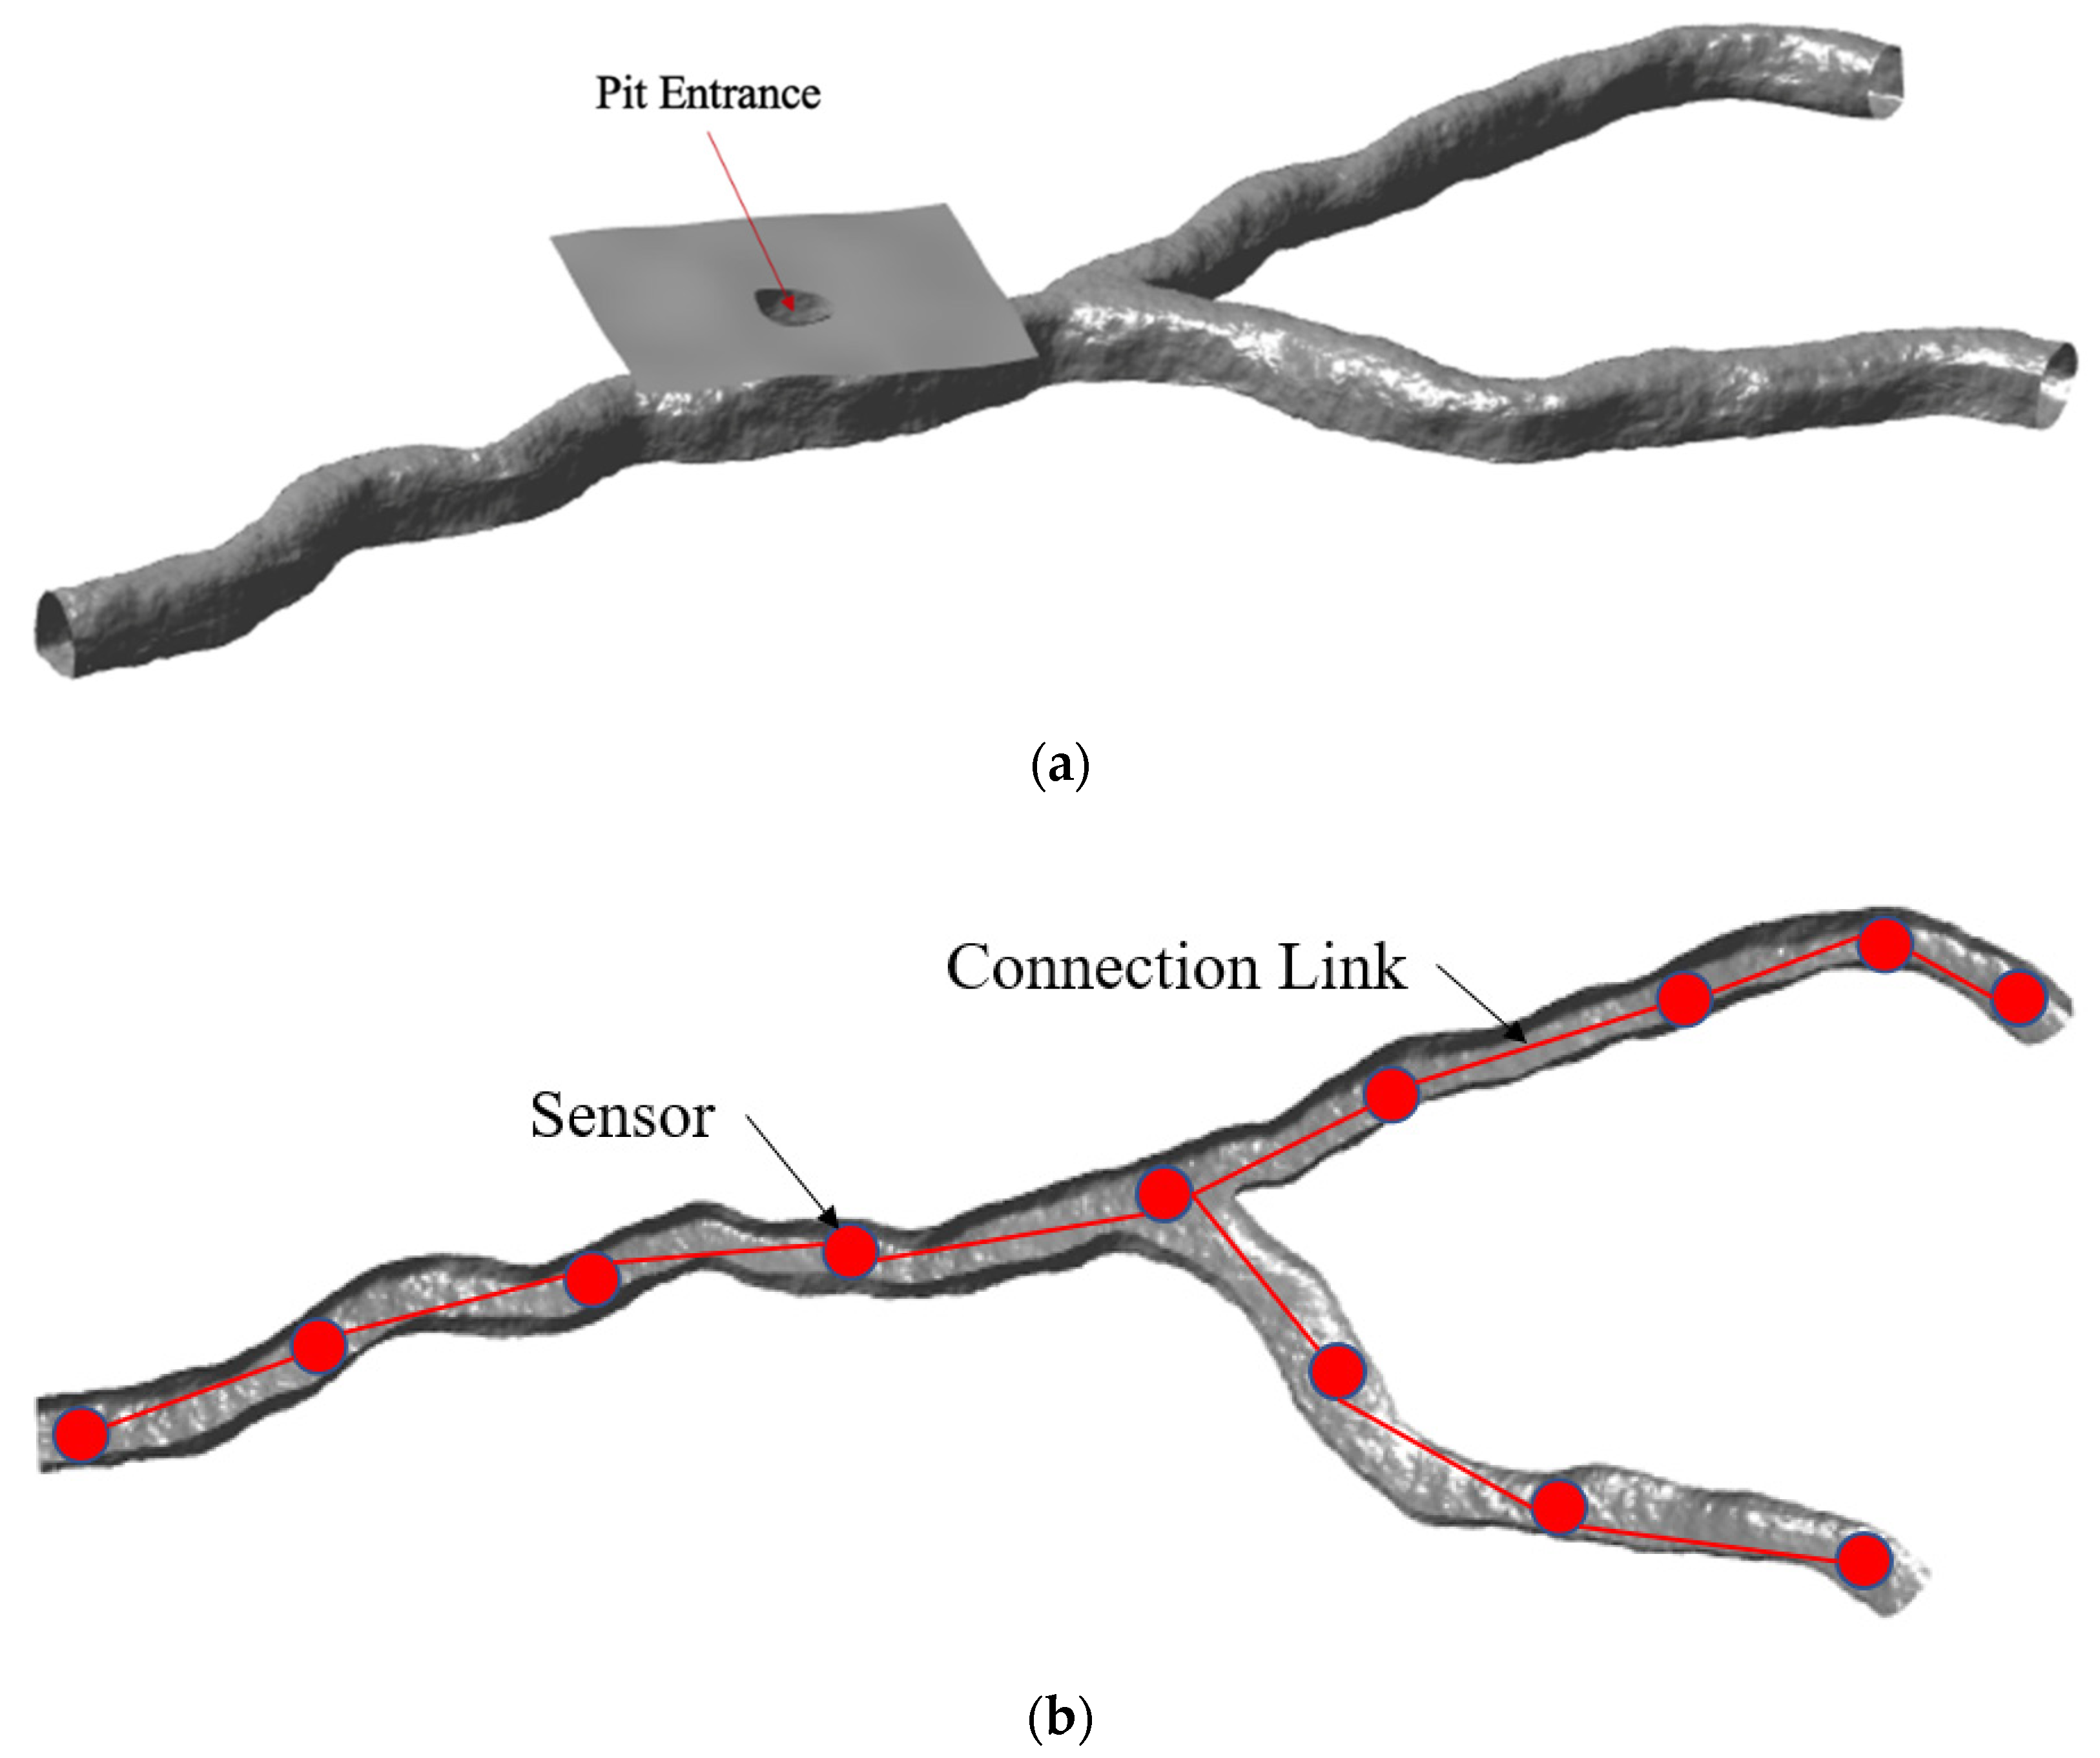
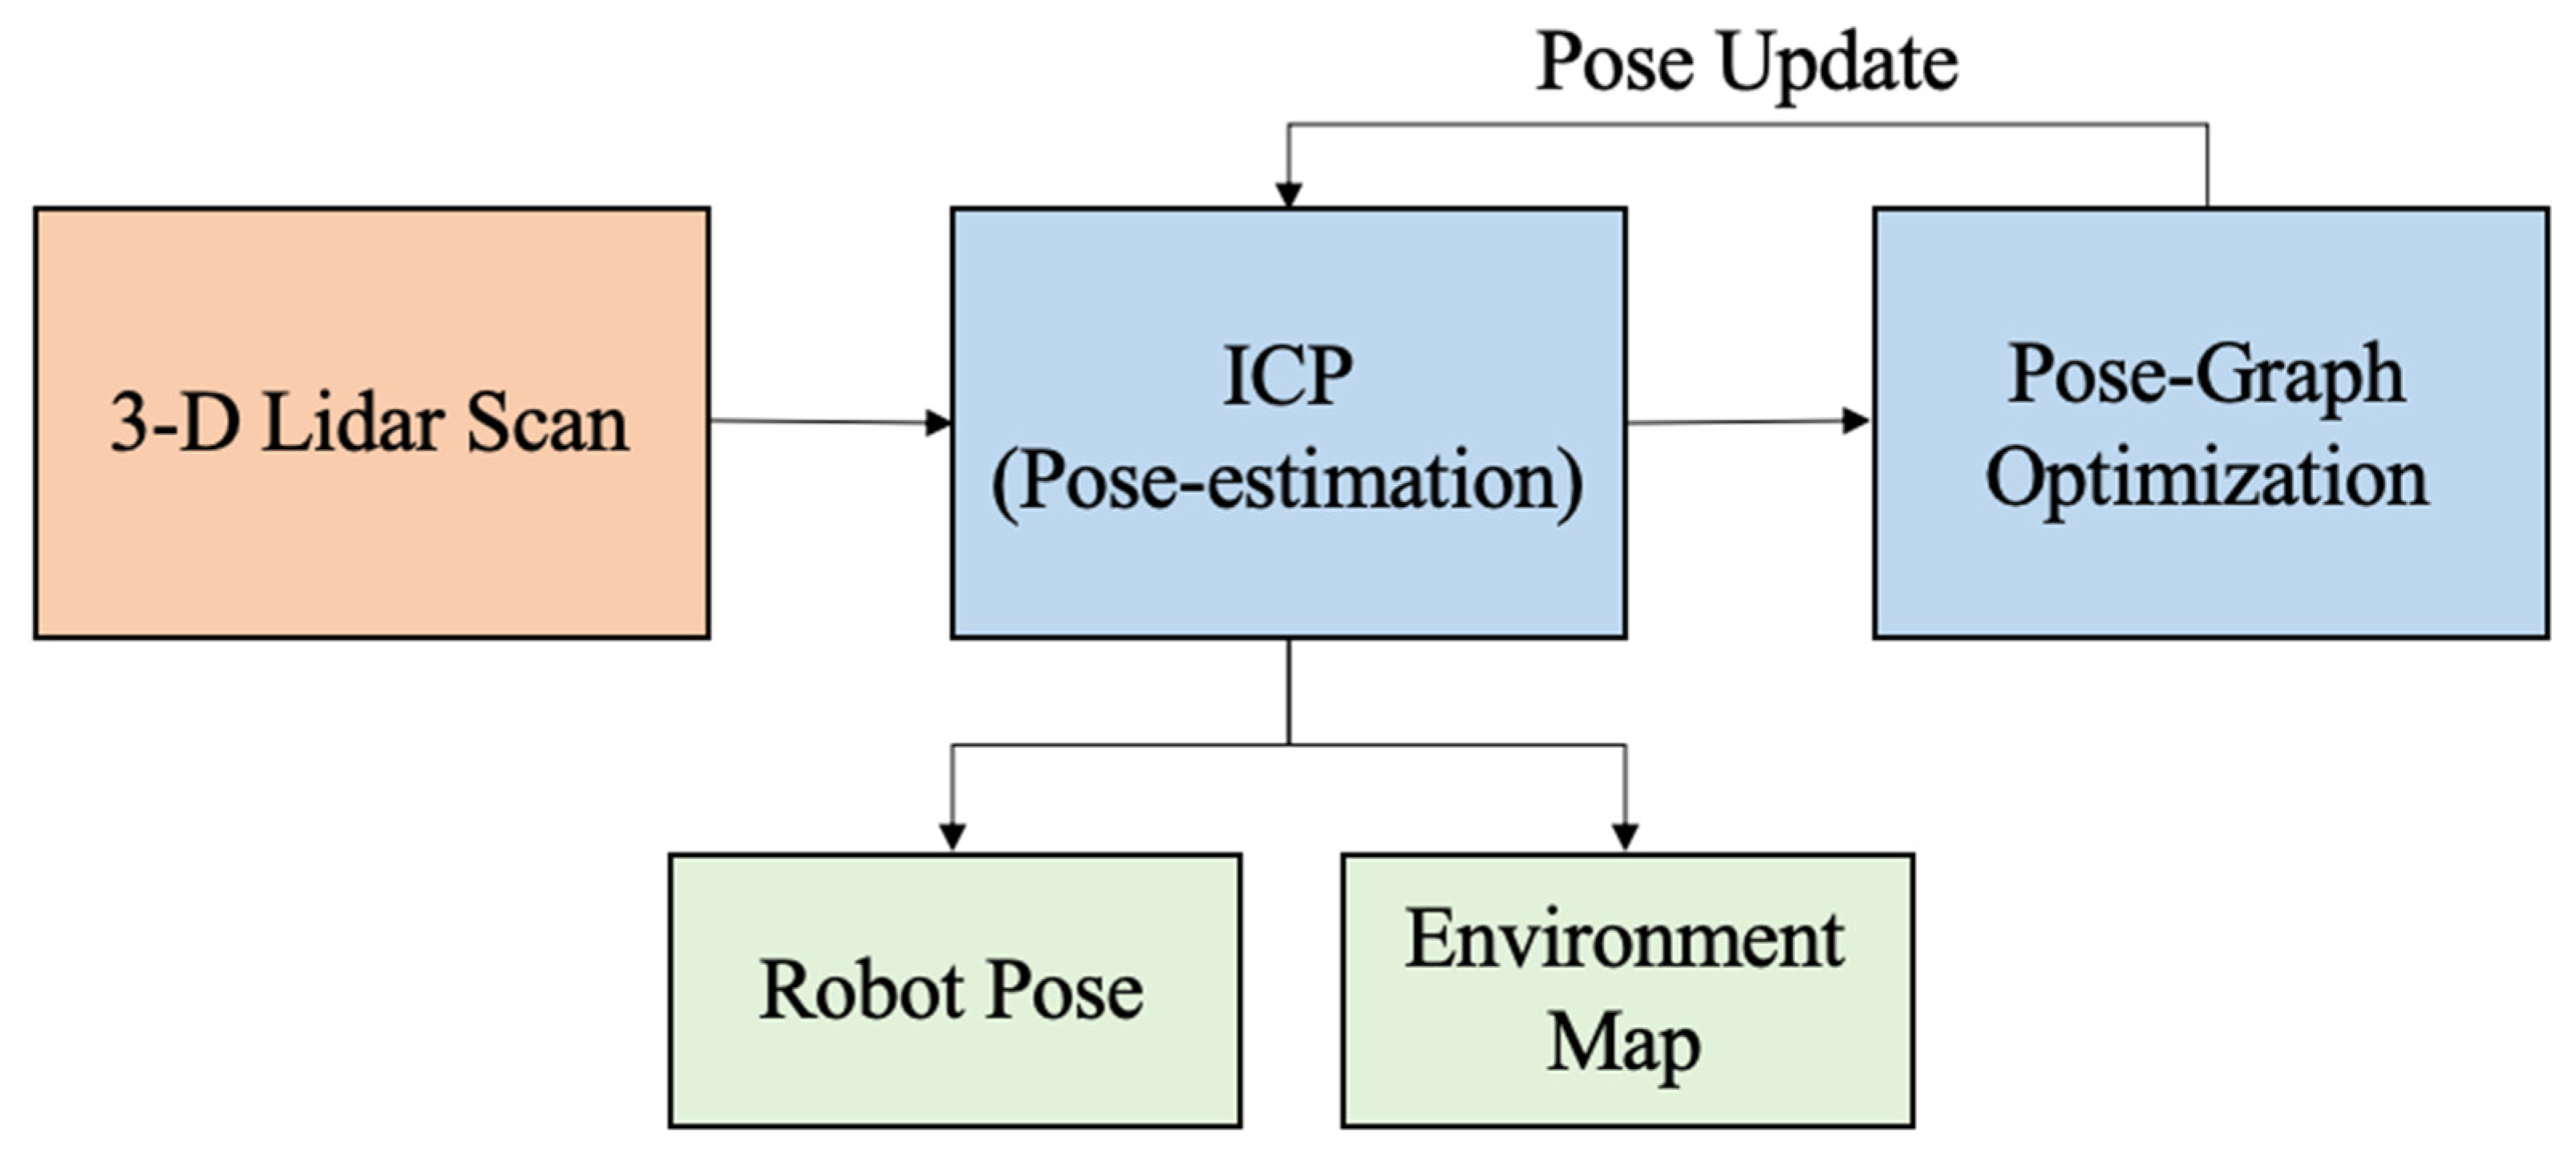
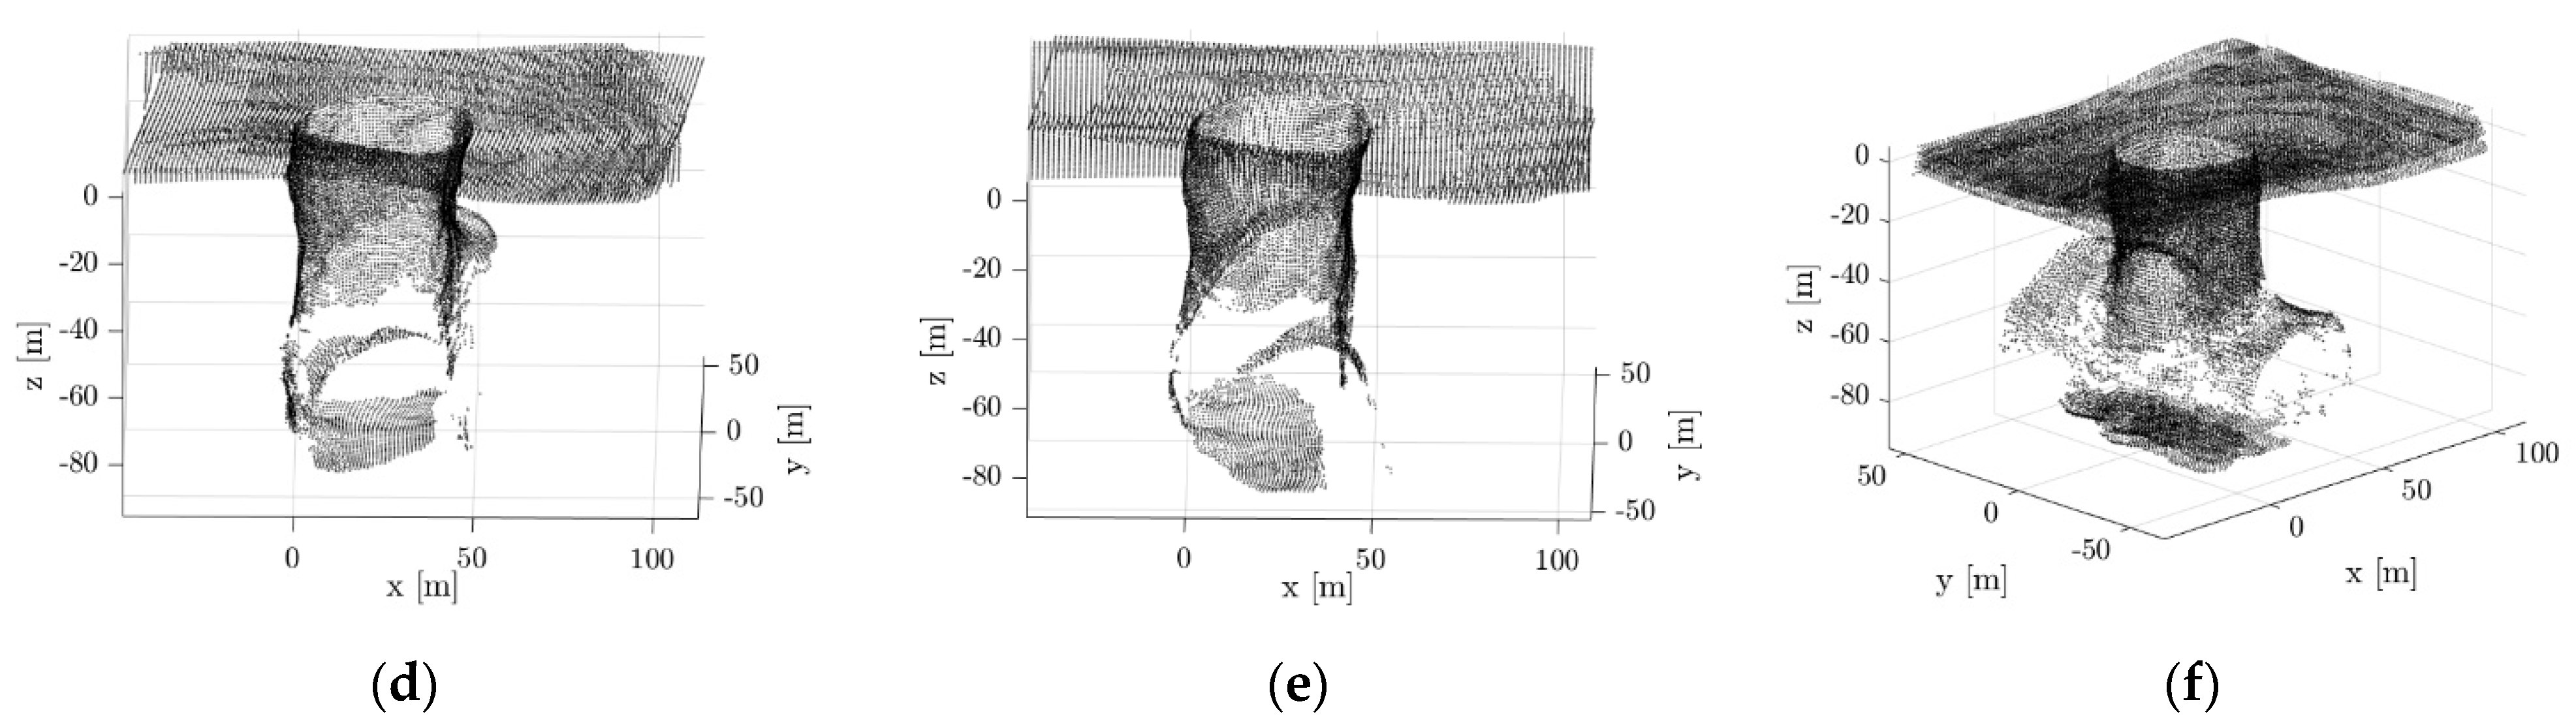
3. Mapping and Localization
3.1. Pit Survey Phase
3.2. Pit Entrance Phase
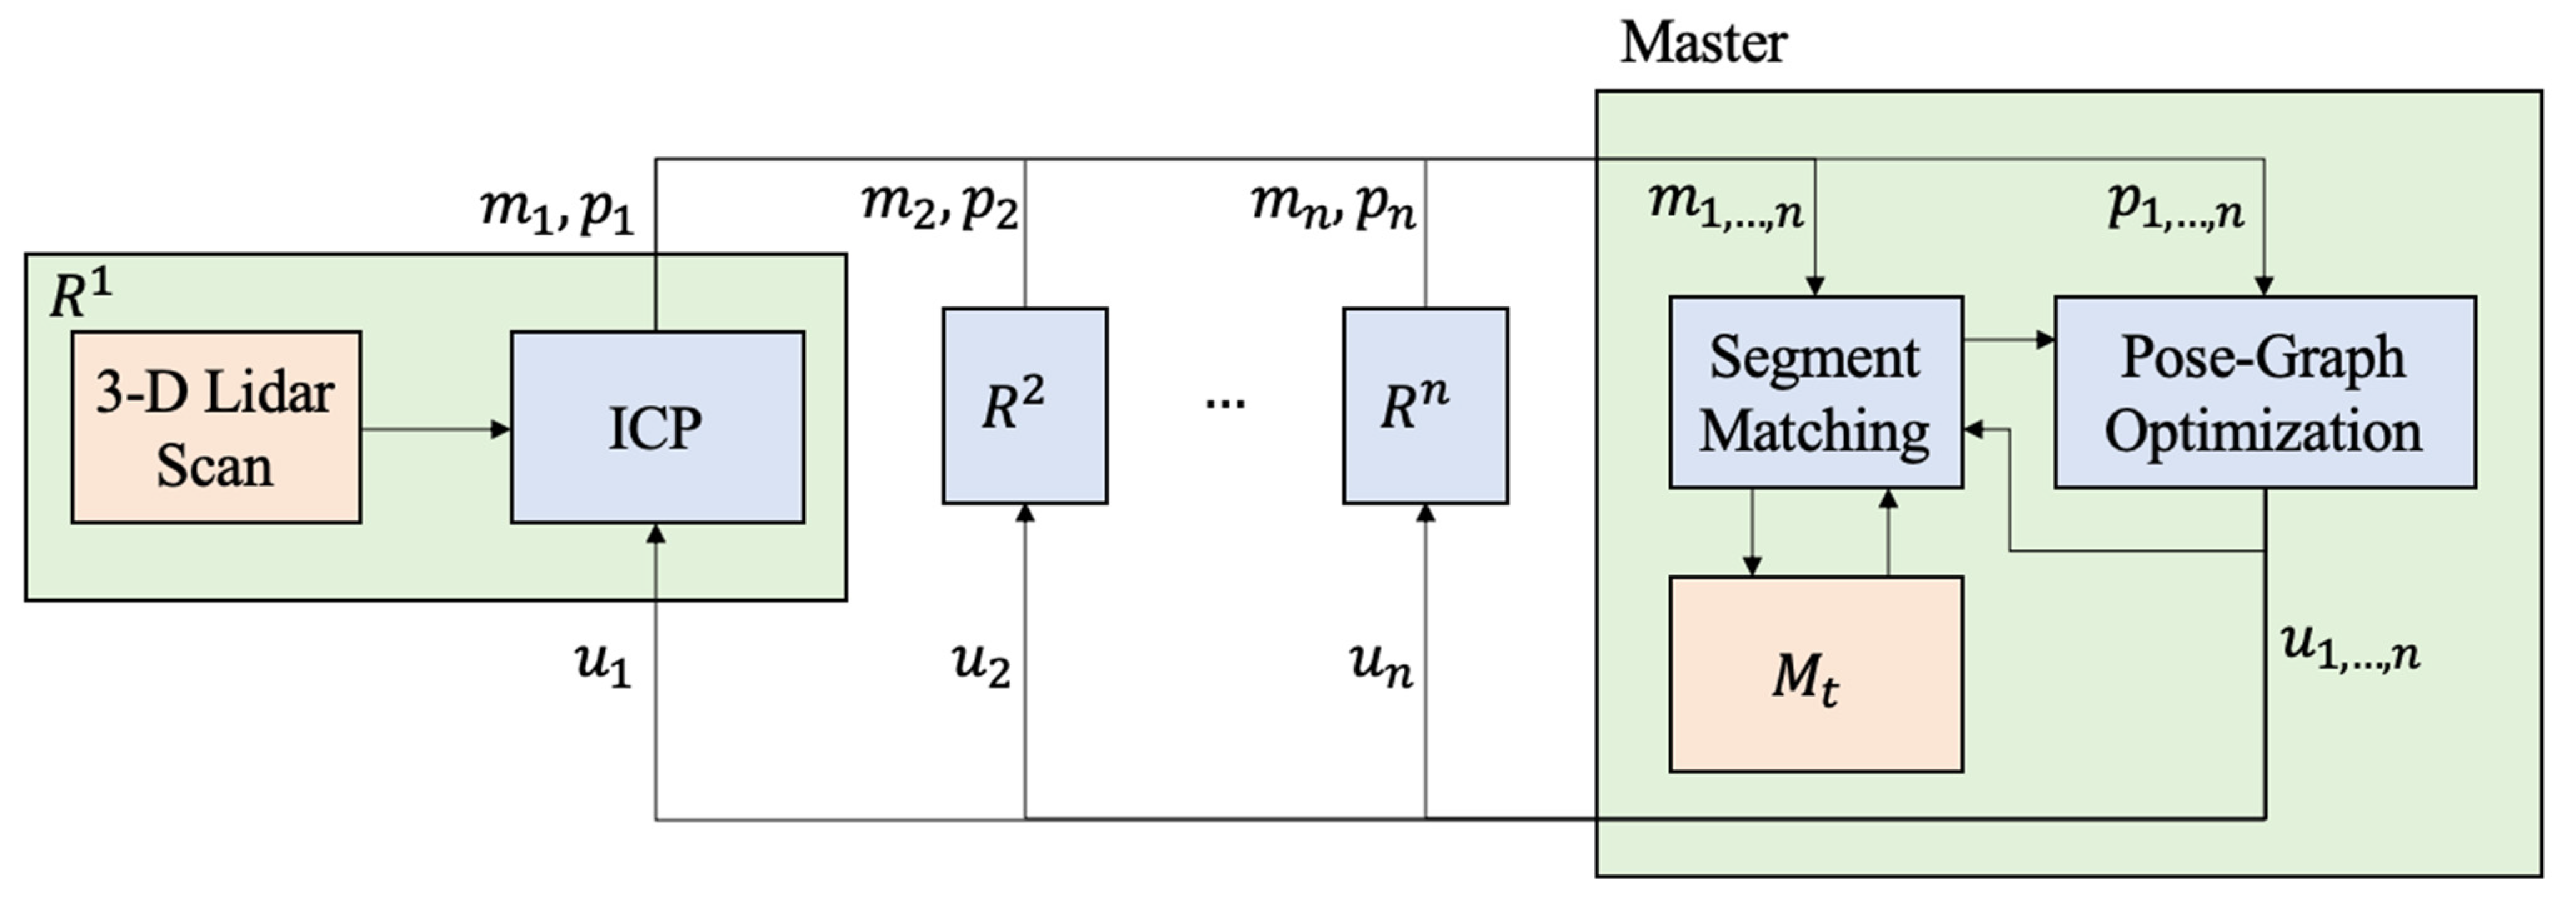
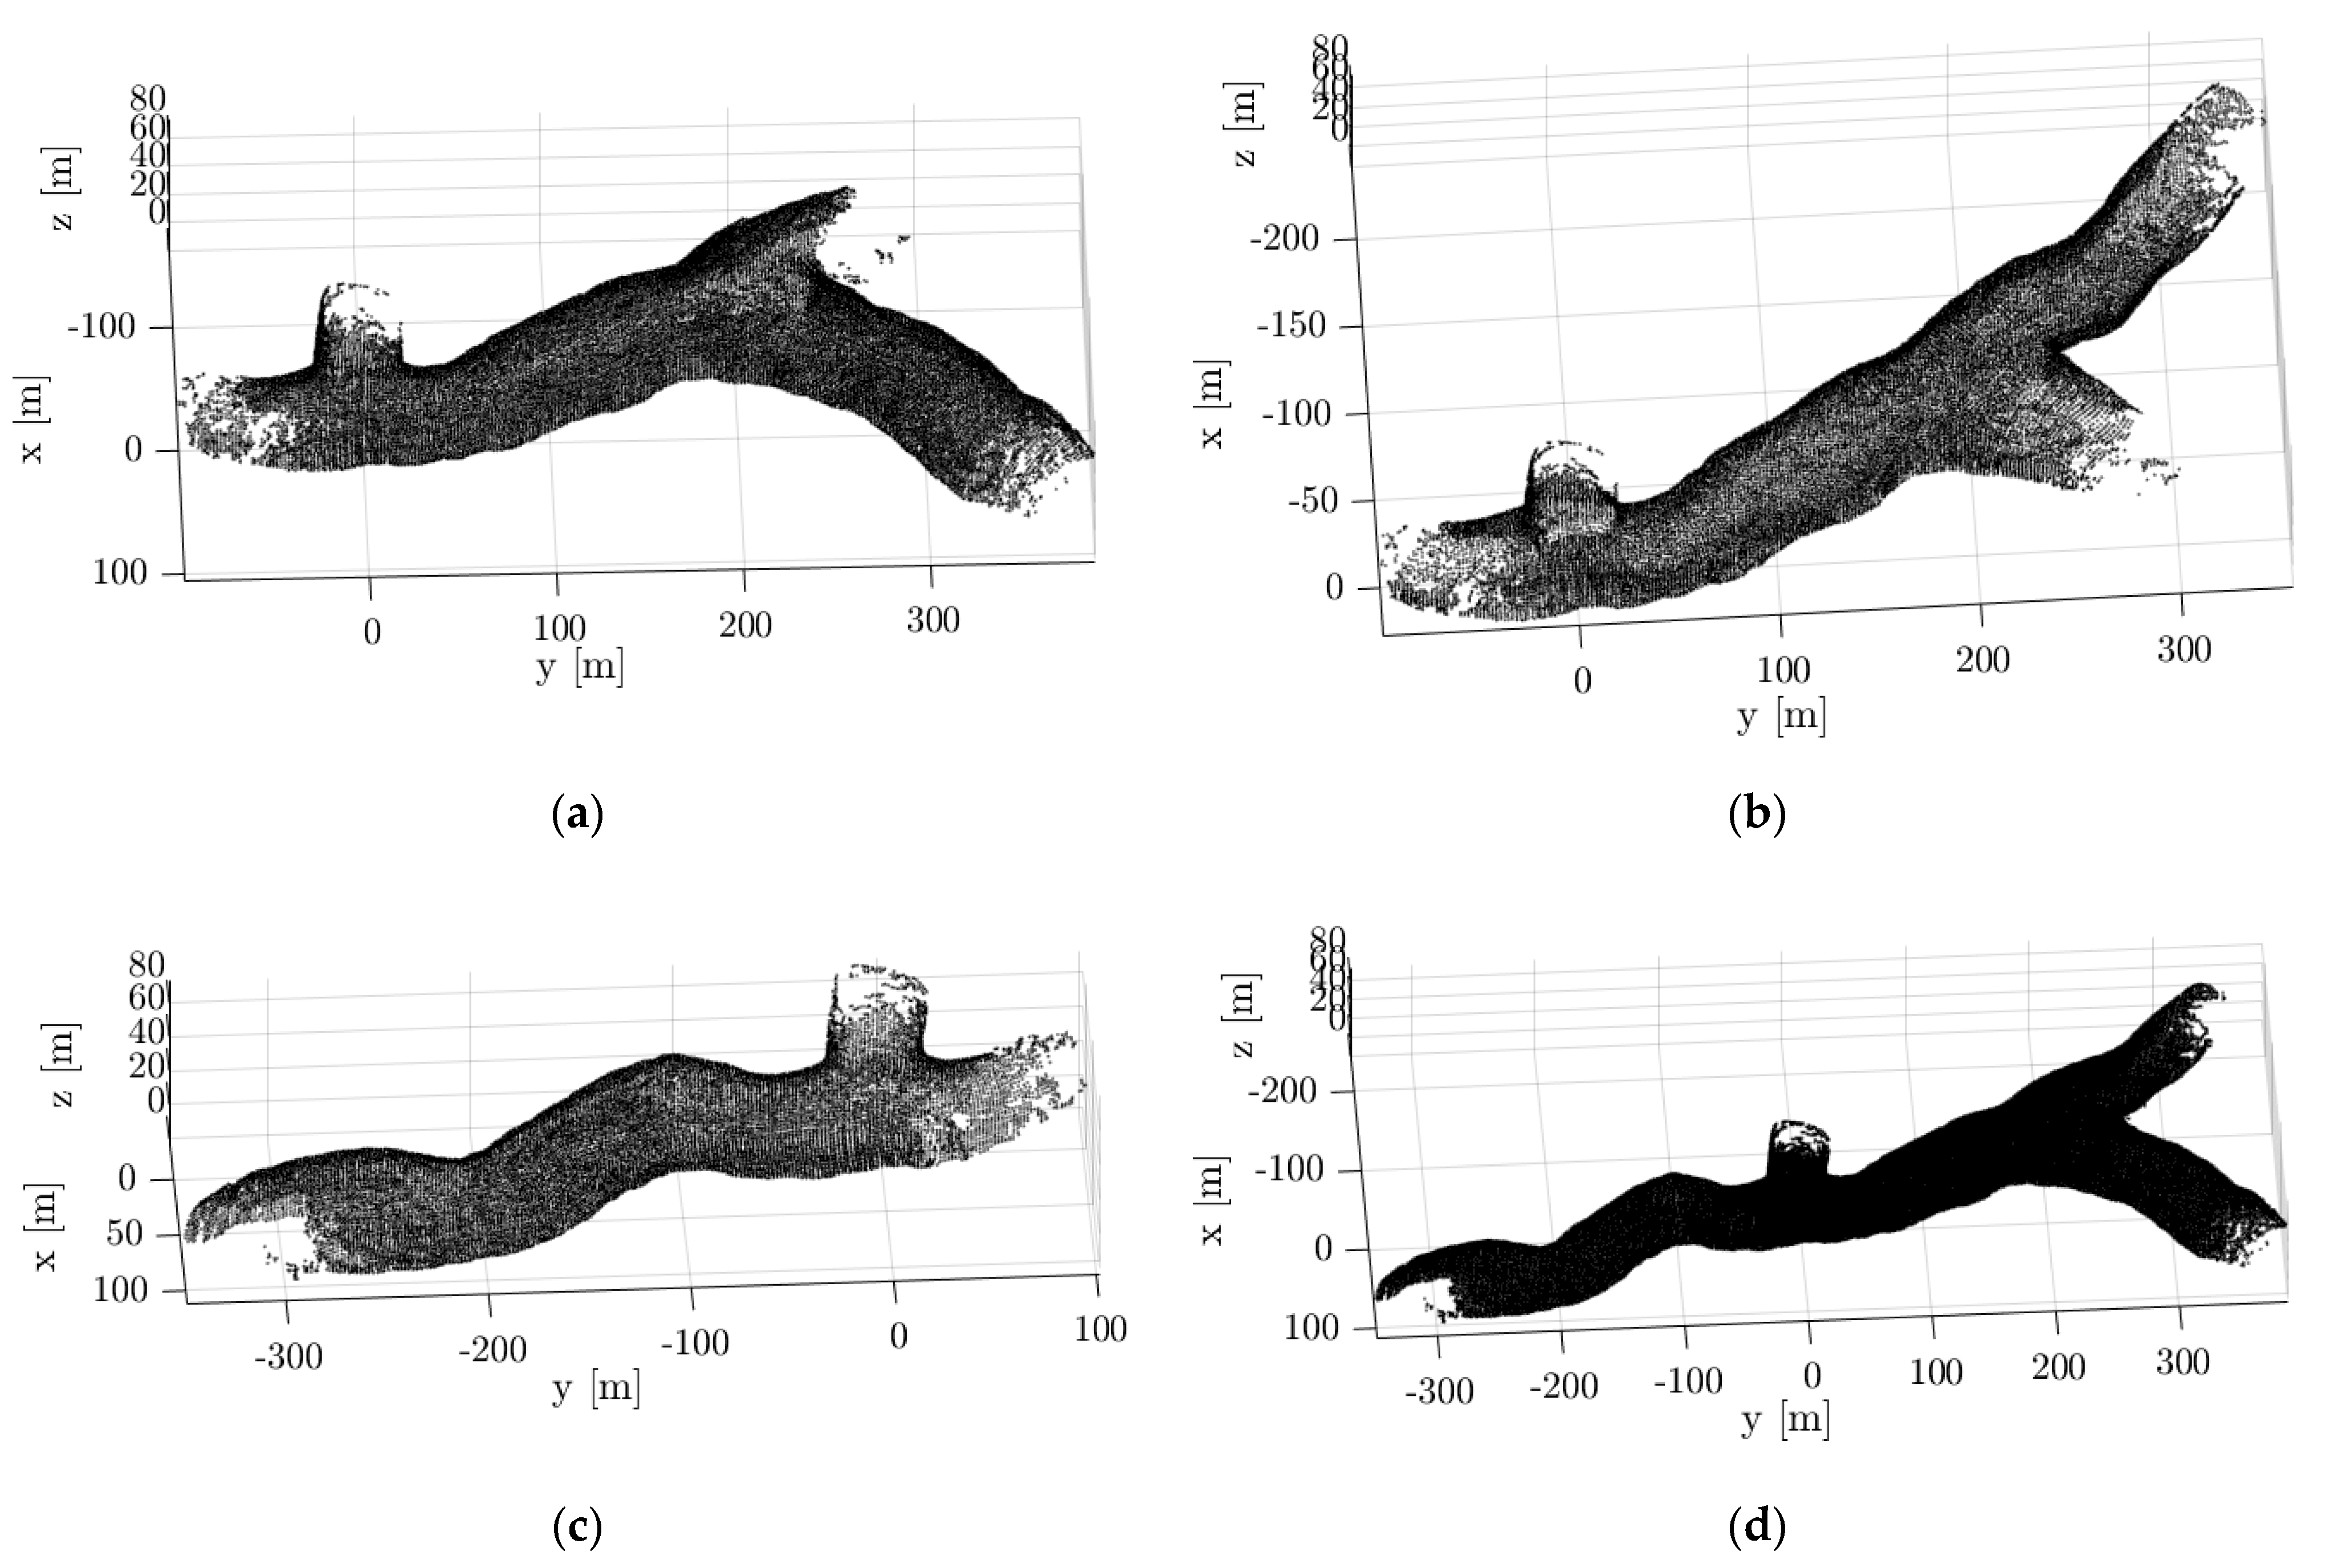
3.3. Multi-Robot Mapping
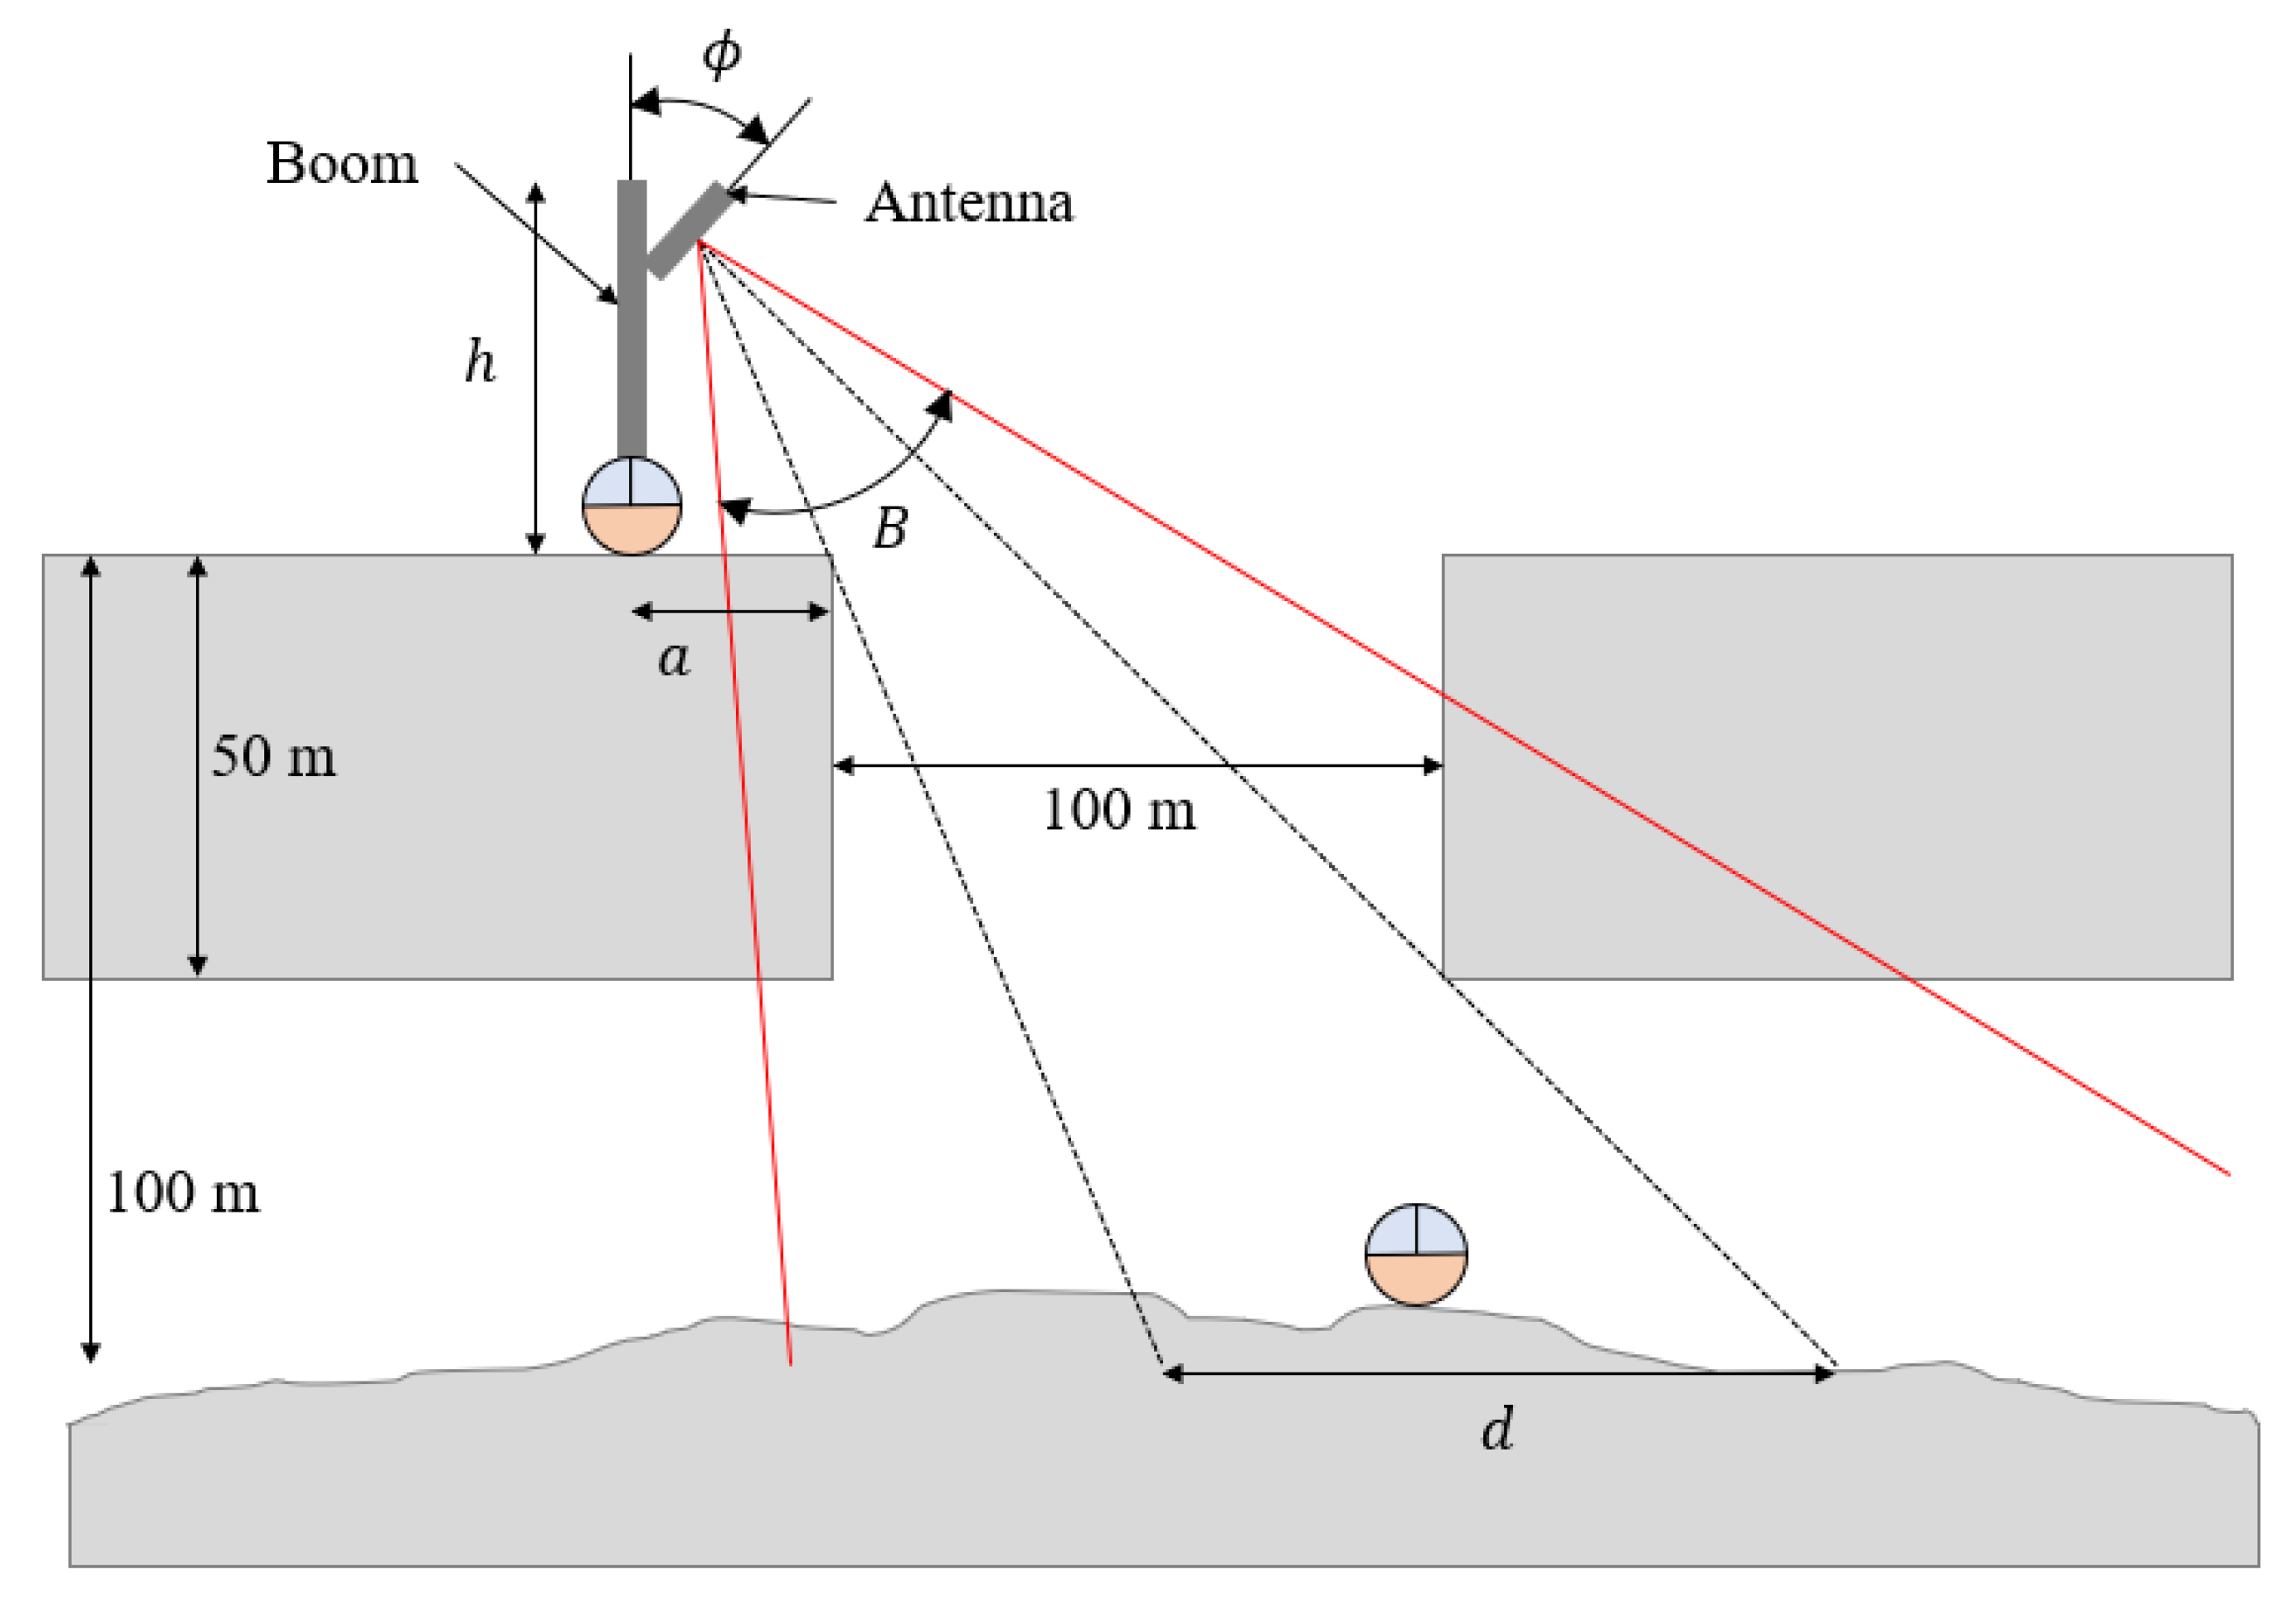
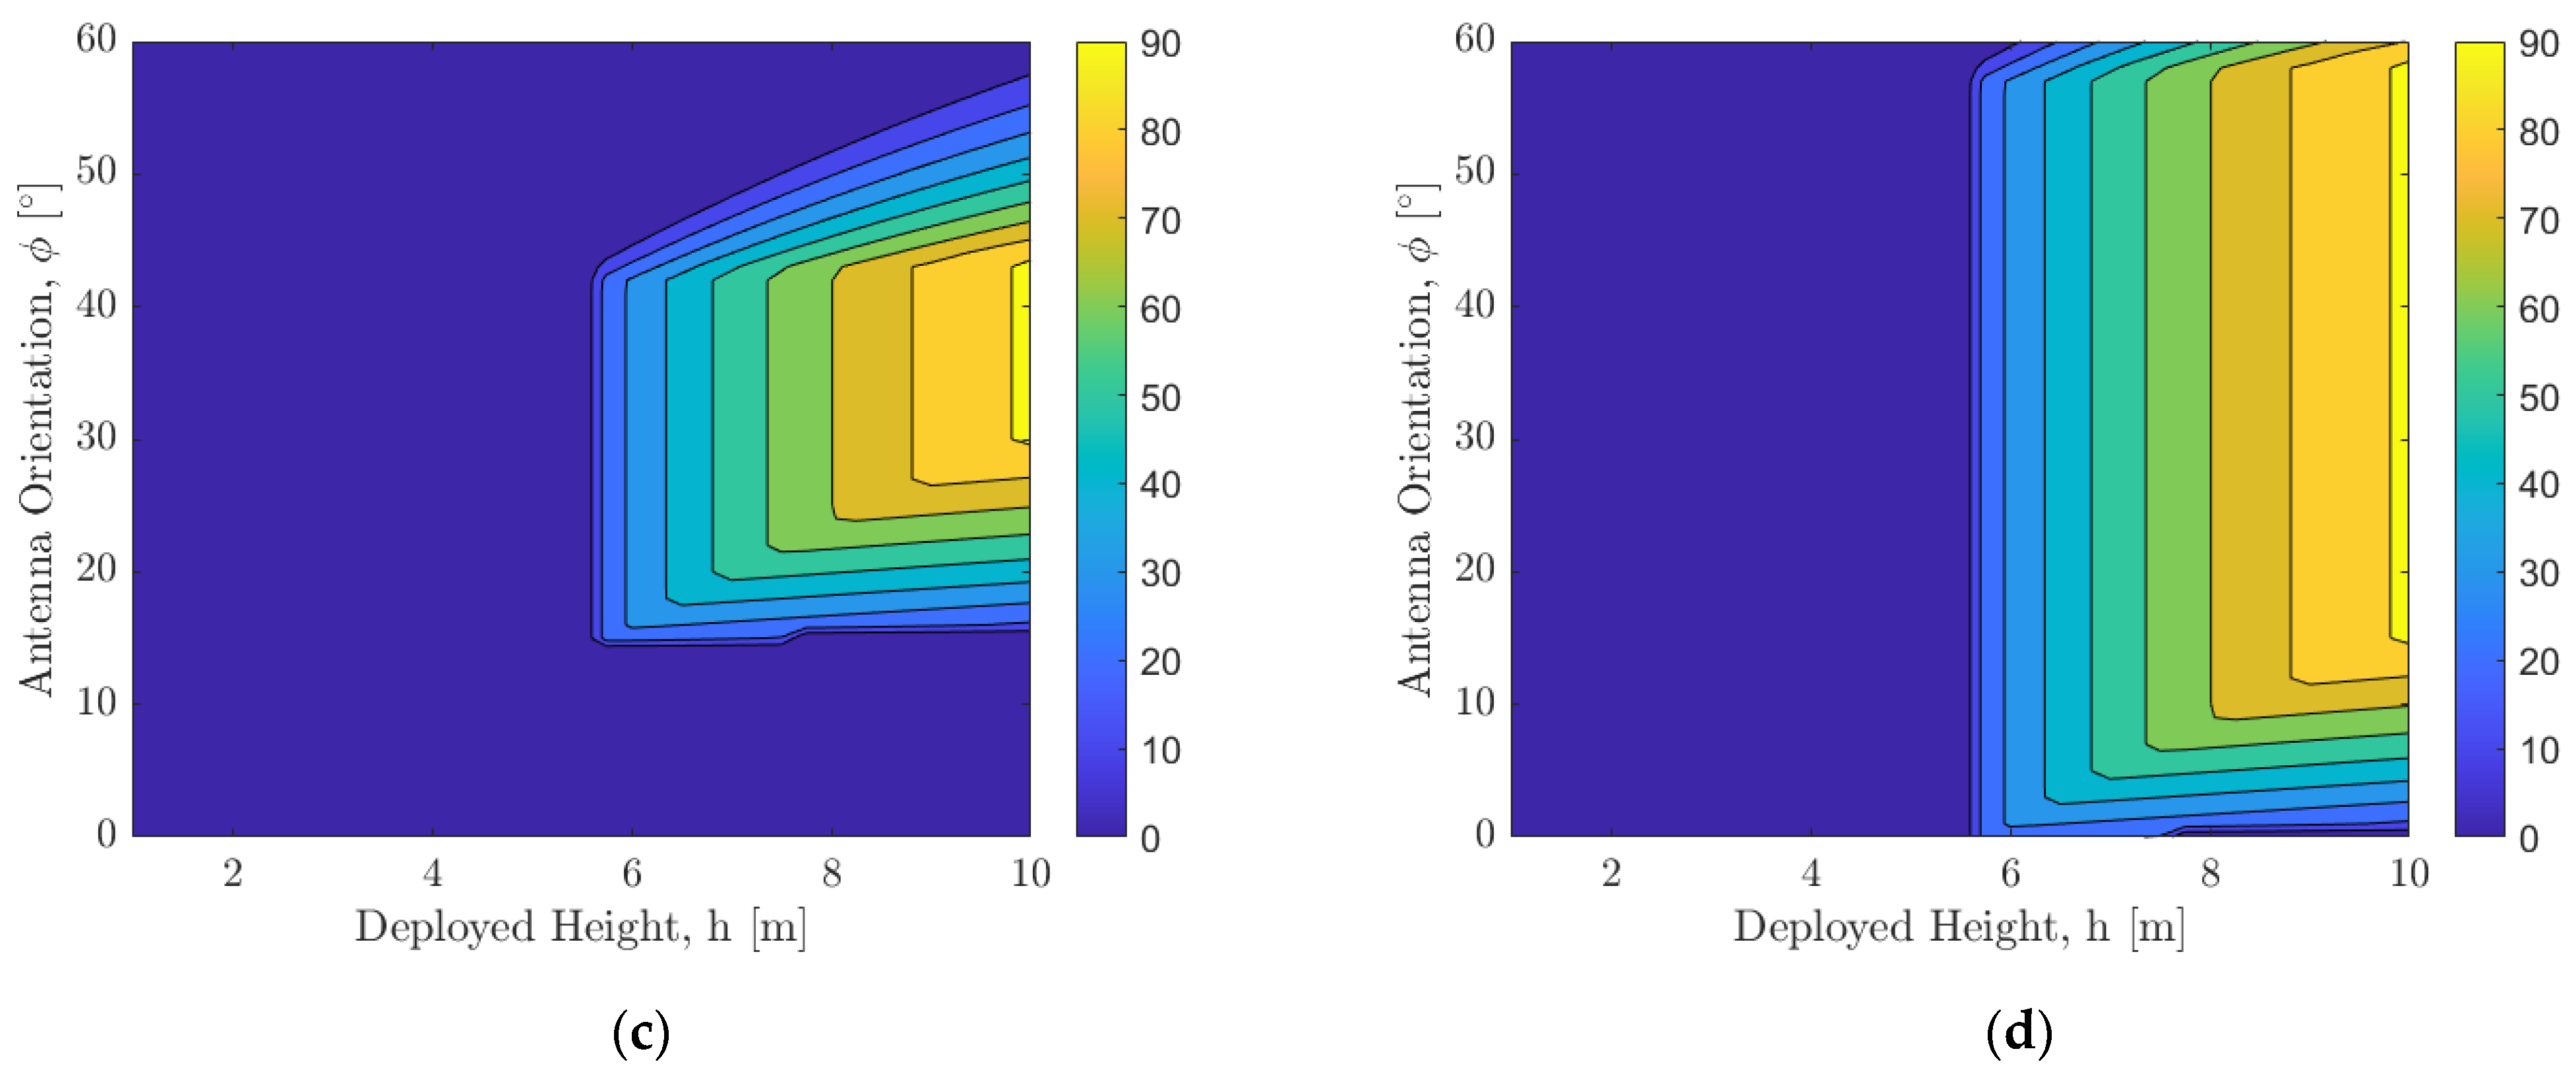
4. Line-of-Sight Analysis
4.1. Line-of-Sight from Pit Surface to Pit Floor
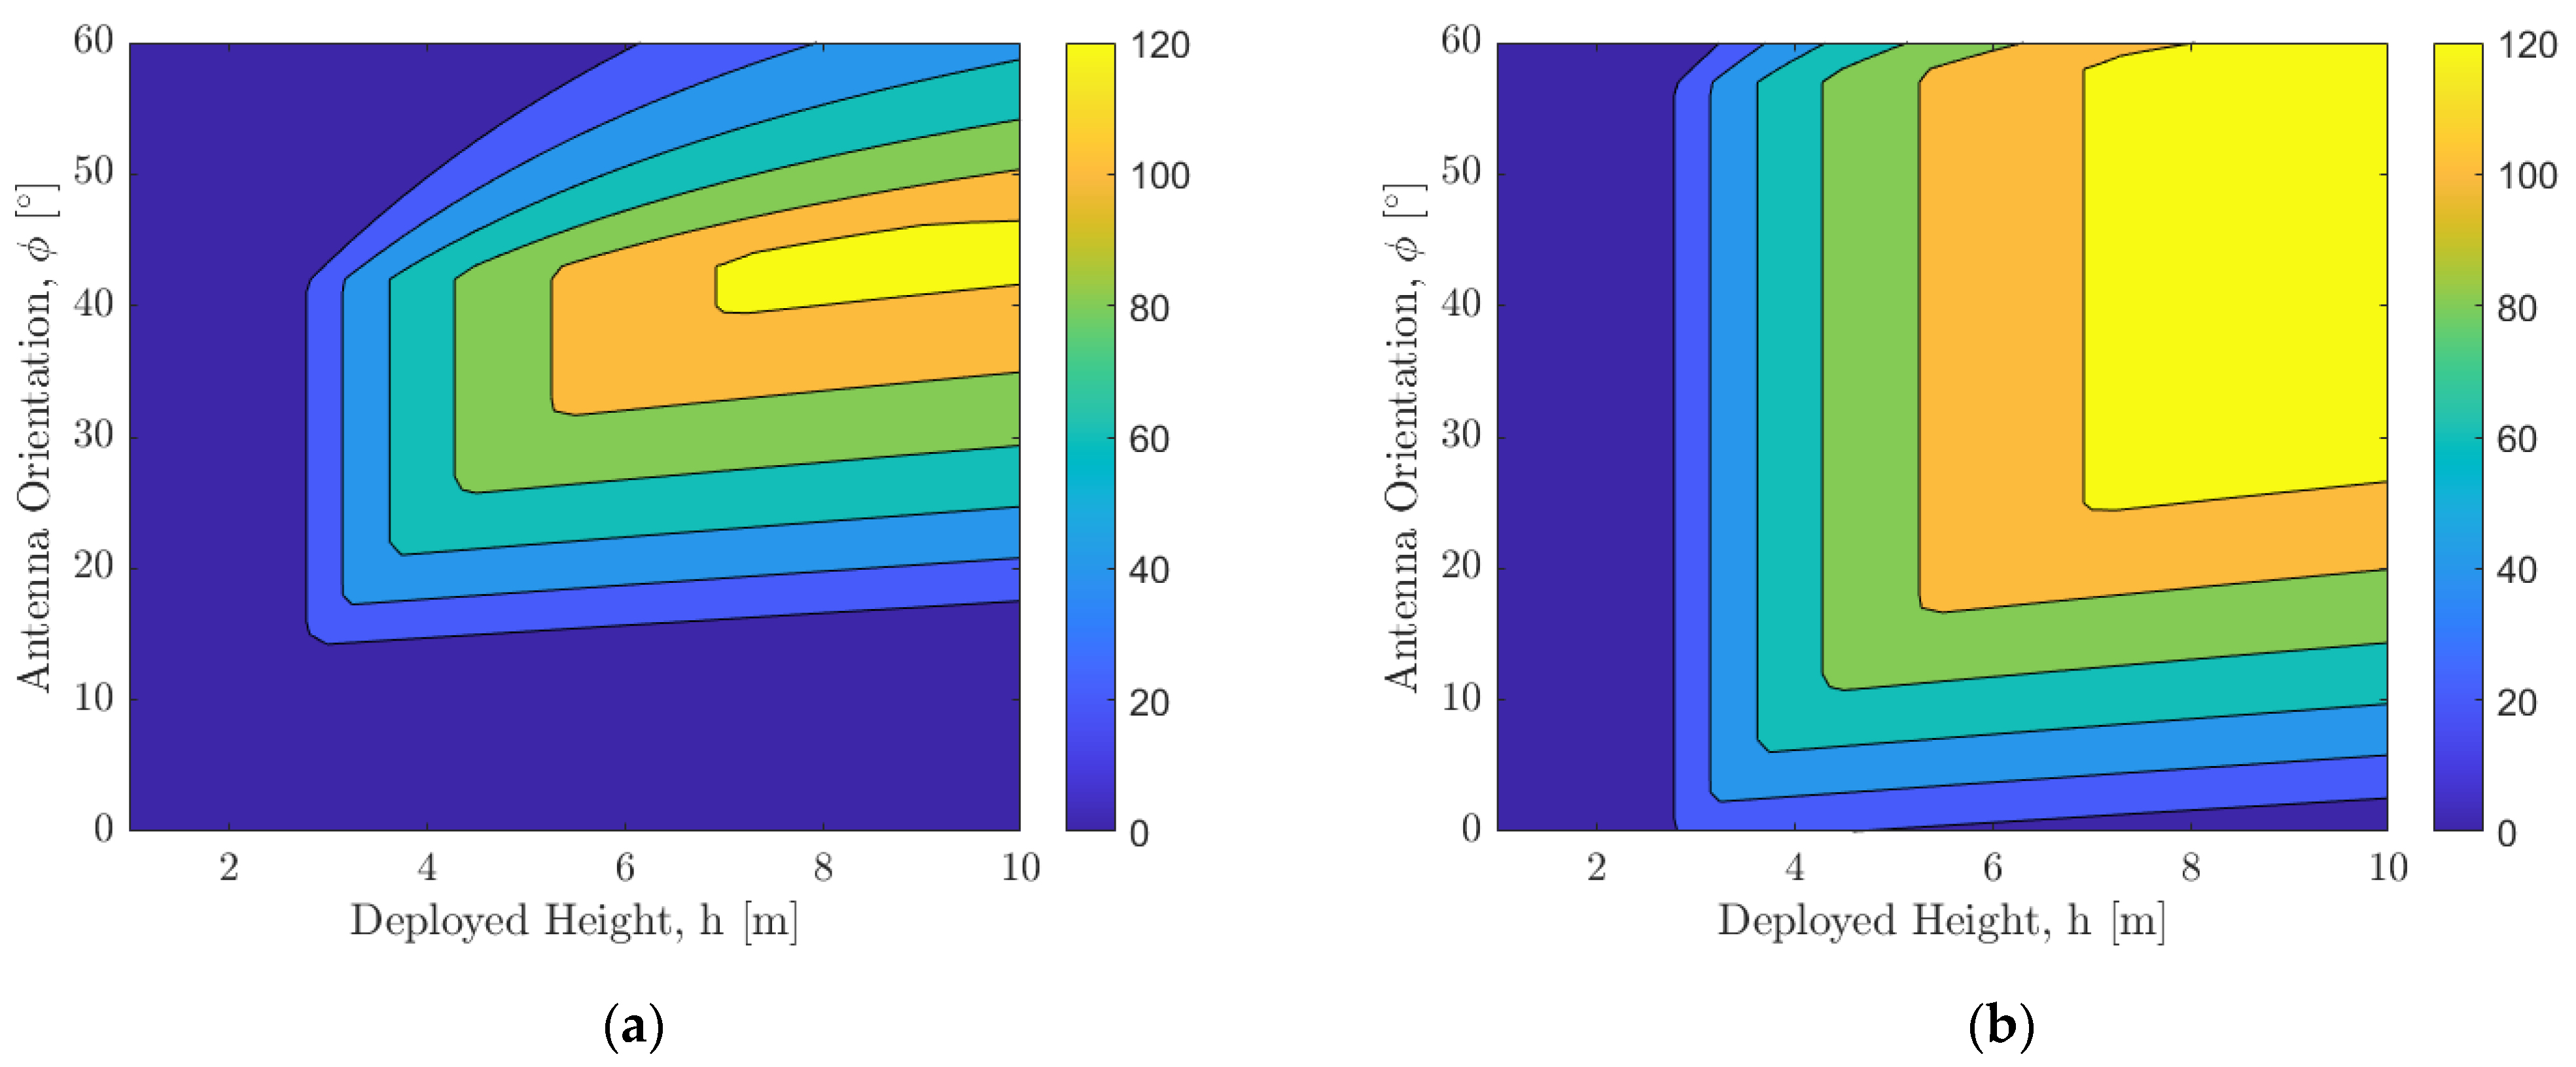
4.2. Optimal Sensor Placement for Direct Line-of-Sight
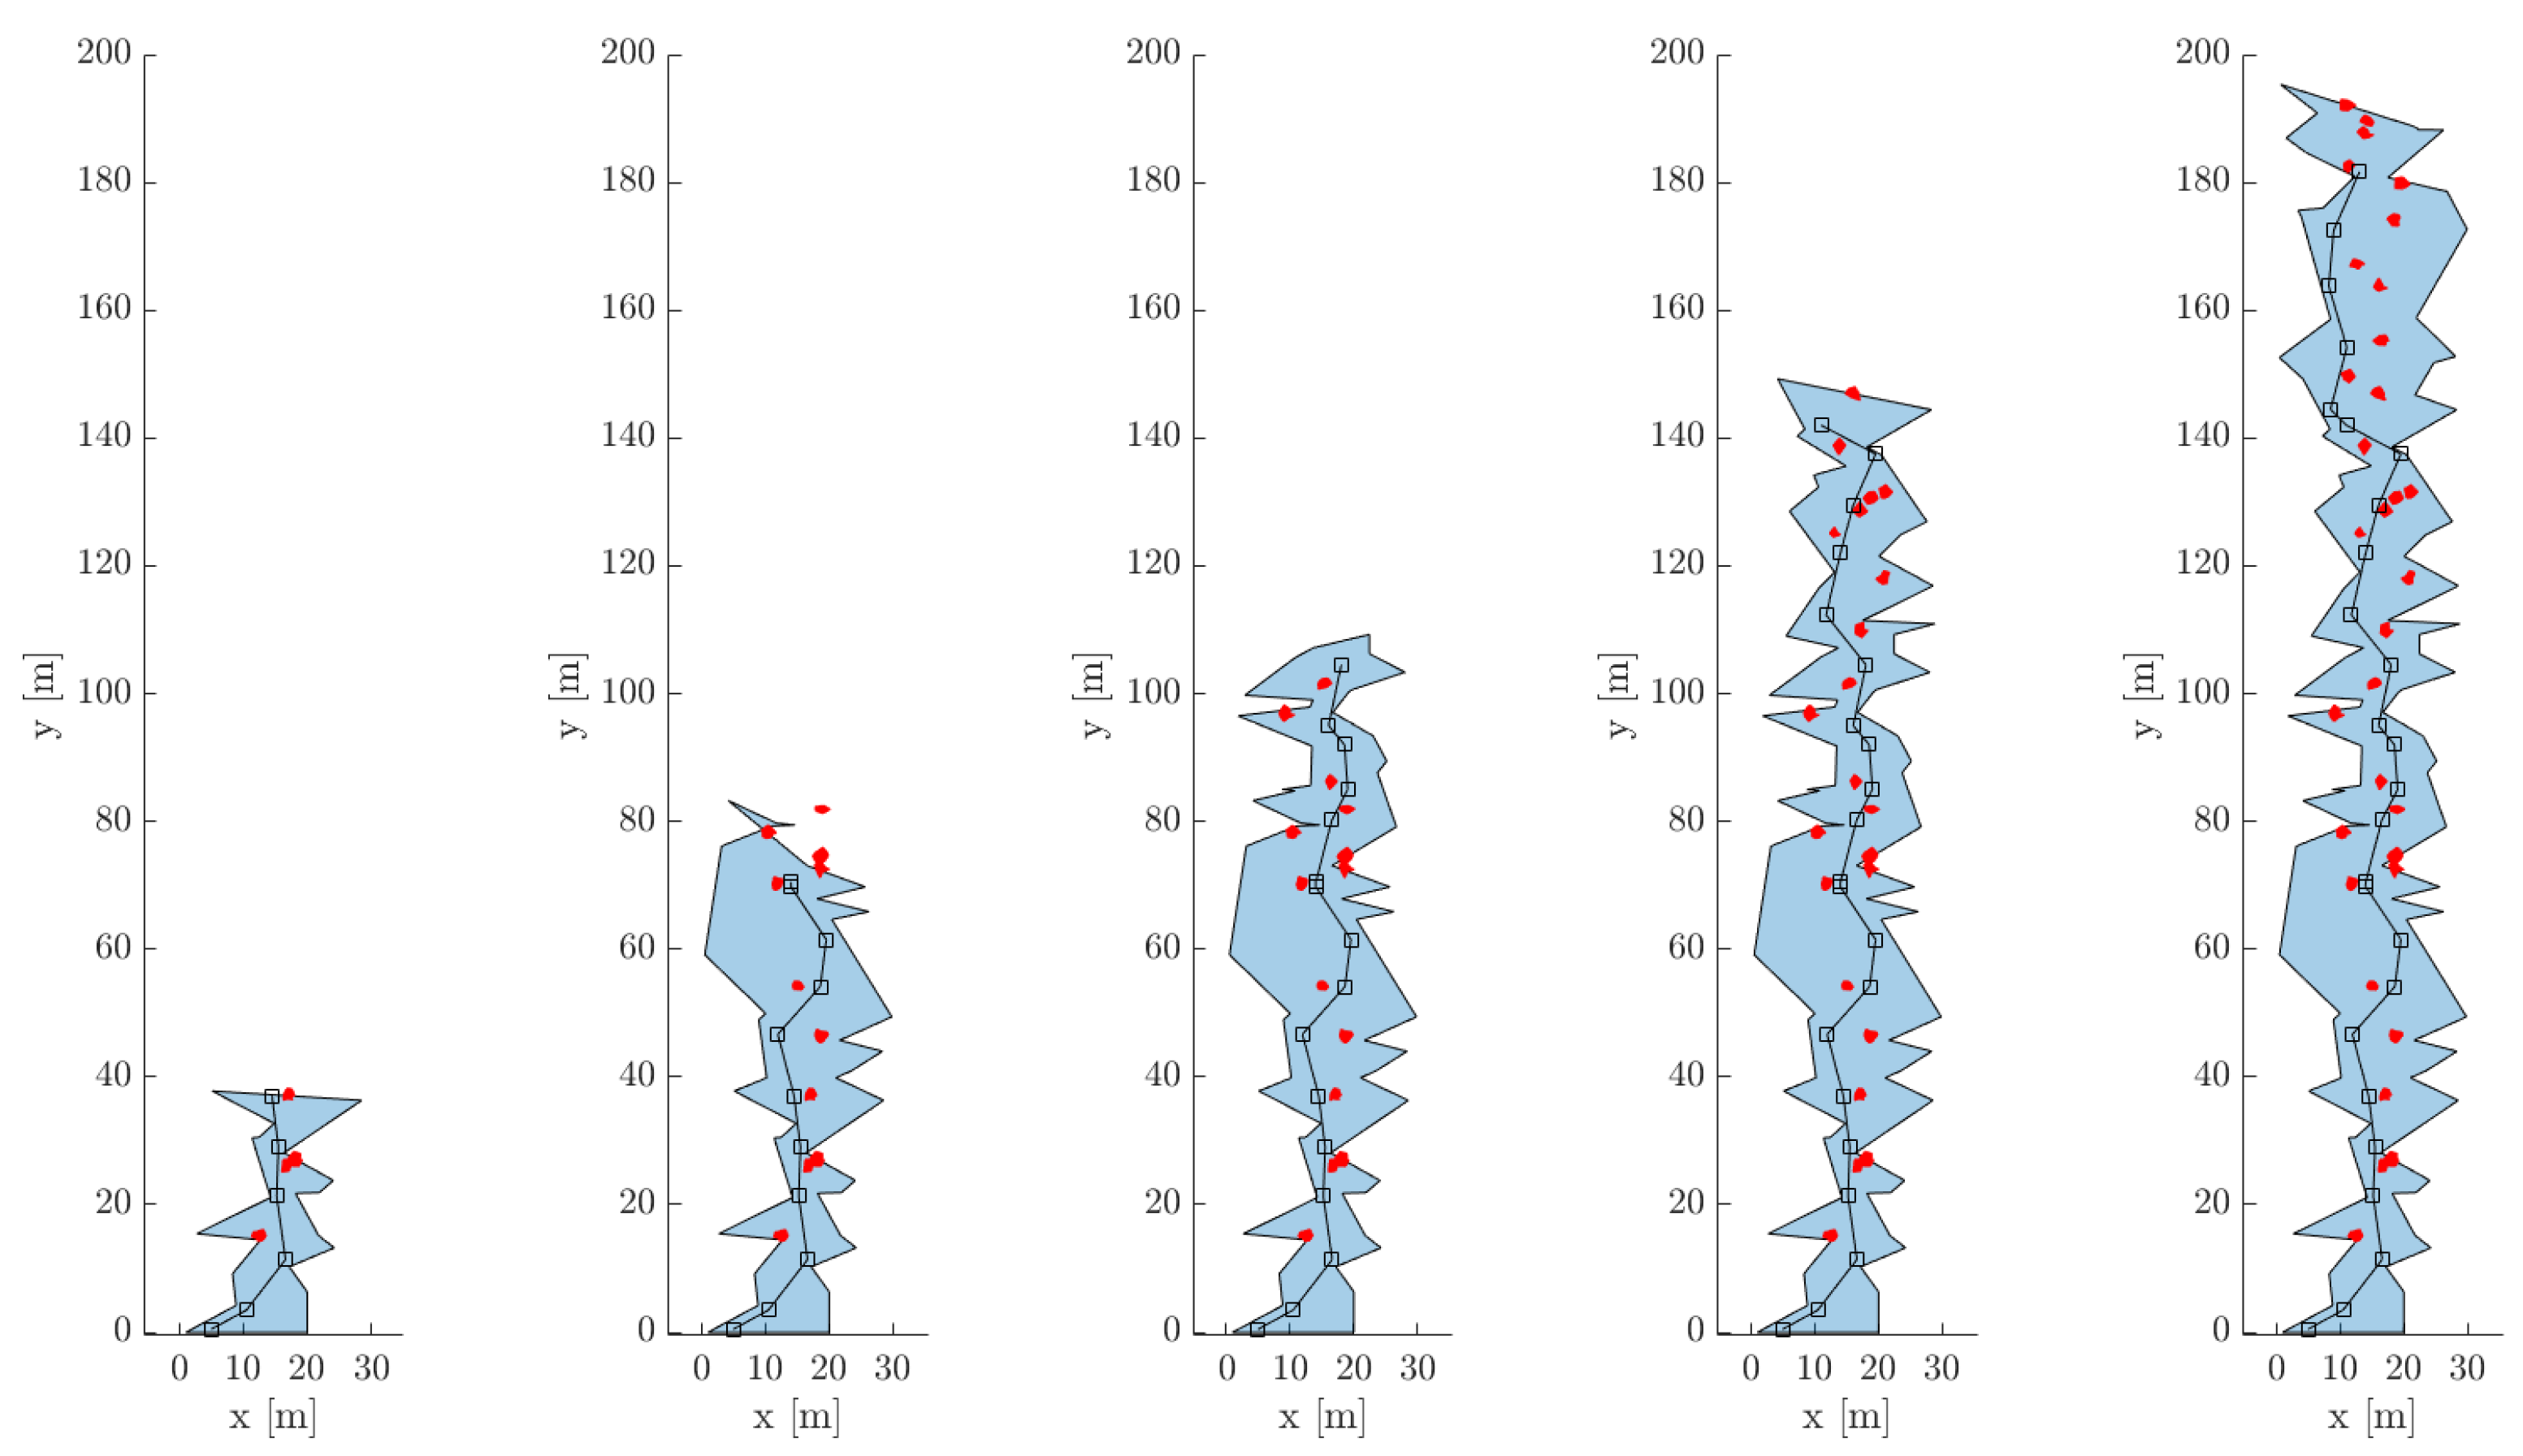
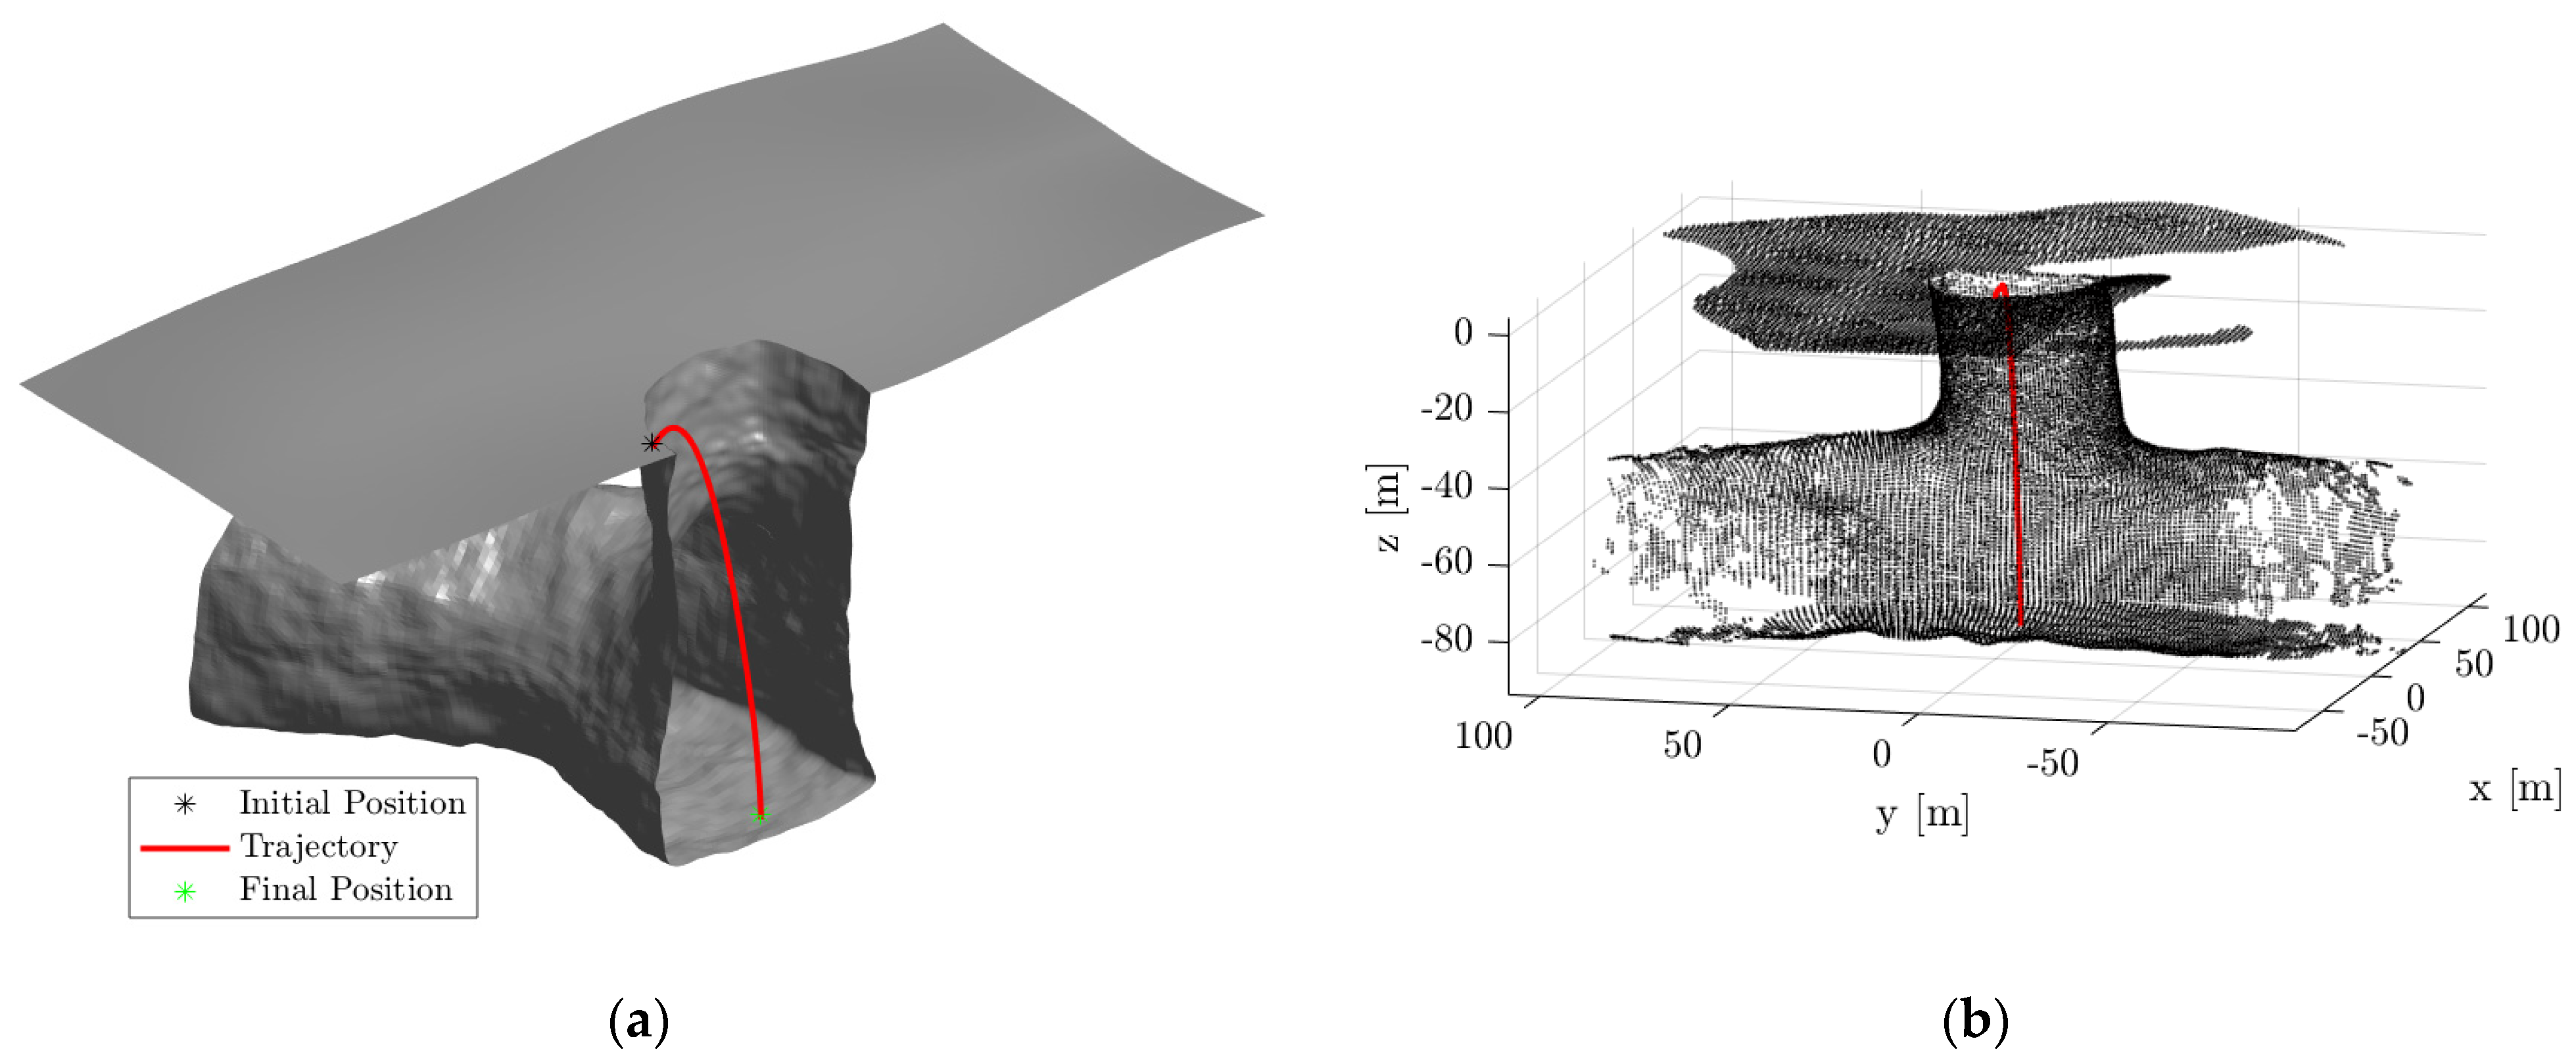
4.3. Sensor Placement in an Unknown Environment
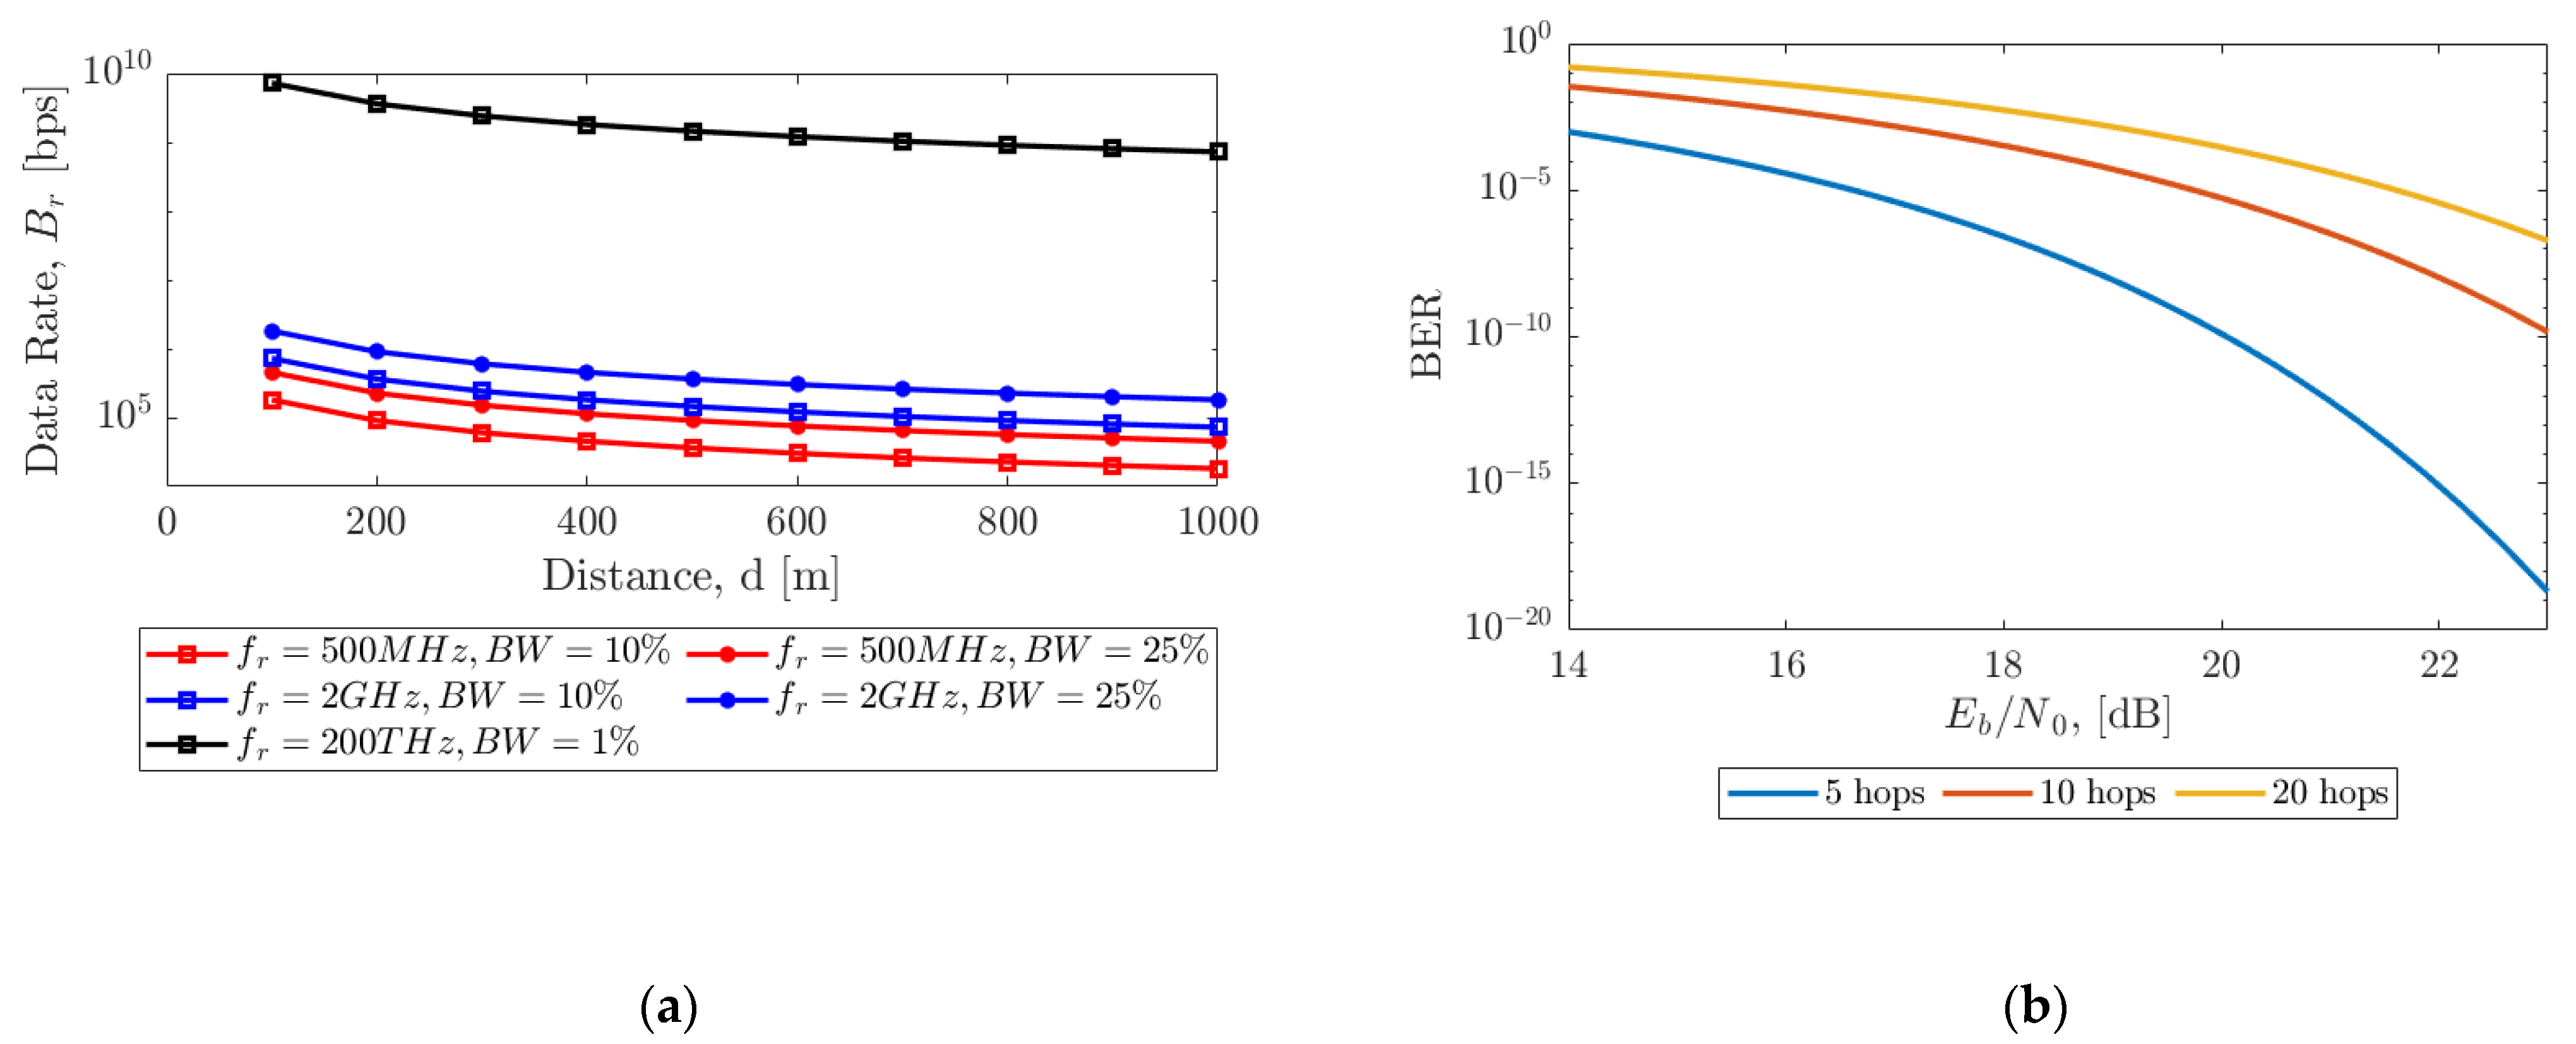
5. Communication
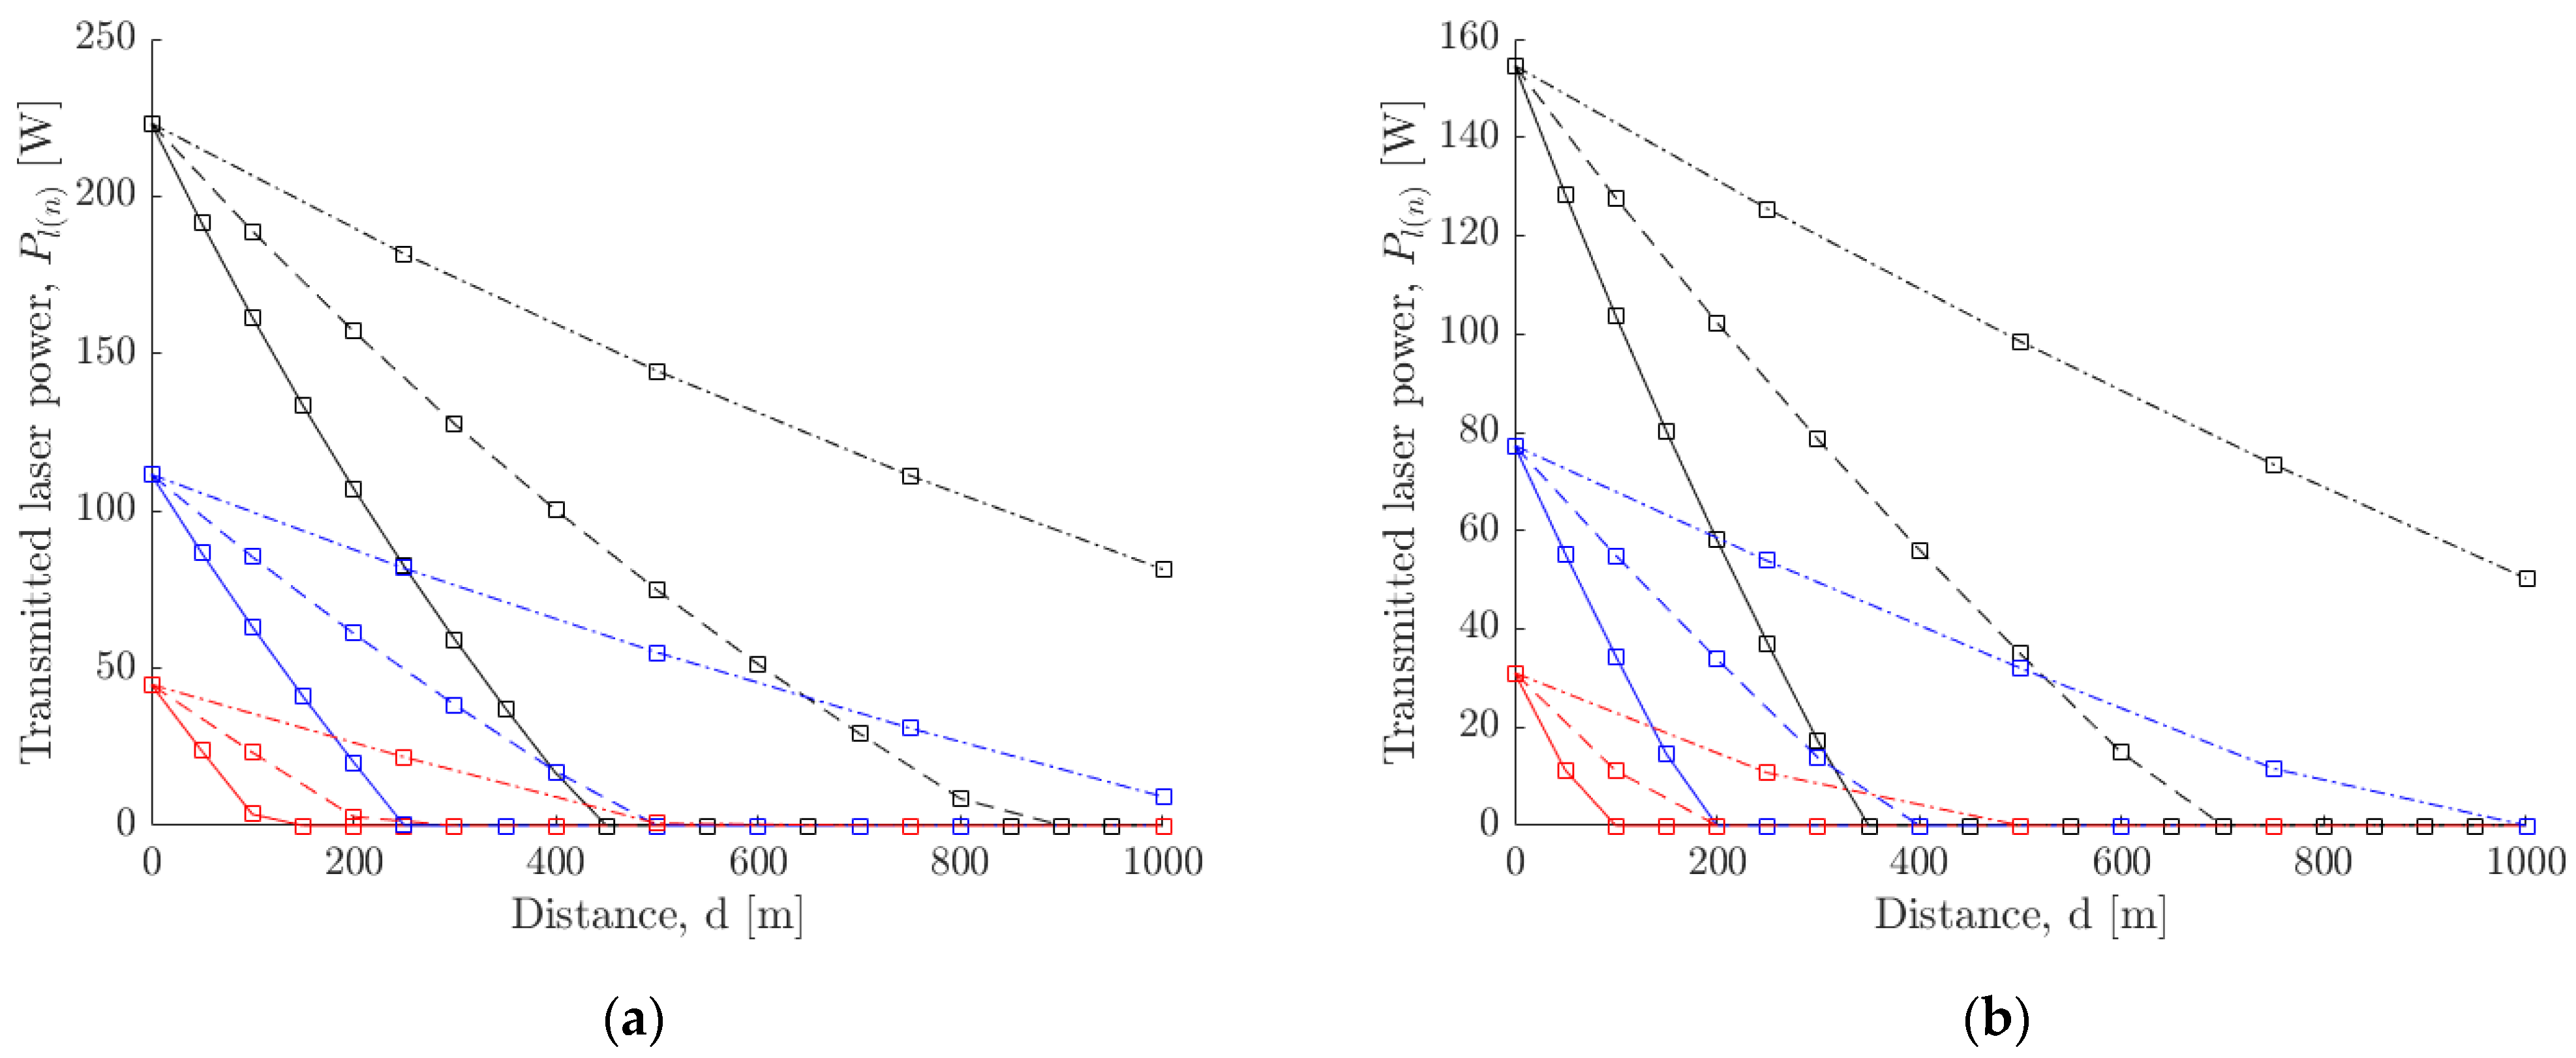
6. Power Transfer
6.1. Electricity to Laser Conversion
6.2. Laser Transmission
6.3. Laser to Electricity Conversion
6.4. Power Transmission over a Multi-Hop Channel
7. Discussion
8. Conclusions
9. Patents
Author Contributions
Funding
Institutional Review Board Statement
Informed Consent Statement
Data Availability Statement
Acknowledgments
Conflicts of Interest
References
- Haruyama, J.; Hioki, K.; Shirao, M.; Morota, T.; Hiesinger, H.; van der Bogert, C.H.; Miyamoto, H.; Iwasaki, A.; Yokota, Y.; Ohtake, M.; et al. Possible lunar lava tube skylight observed by SELENE cameras. Geophys. Res. Let. 2009, 36, L21206. [Google Scholar] [CrossRef] [Green Version]
- Greeley, R. Lava tubes and channels in the Lunar Marius Hills. Moon 1971, 3, 289–314. [Google Scholar] [CrossRef] [Green Version]
- Robinson, M.S.; Ashley, J.W.; Boyd, A.K.; Wagner, R.V.; Speyerer, E.J.; Hawke, B.R.; Hiesinger, H.; van der Bogert, C.H. Confirmation of sublunarean voids and this layering in mare deposits. Planet. Space Sci. 2012, 69, 18–27. [Google Scholar] [CrossRef]
- Wagner, R.V.; Robinson, M.S. Distribution, formation mechanisms, and significance of lunar pits. Icarus 2014, 237, 52–60. [Google Scholar] [CrossRef] [Green Version]
- Haruyama, J.; Ohtake, M.; Matsunaga, T.; Morota, T.; Honda, C.; Yokota, Y.; Abe, M.; Ogawa, Y.; Miyamoto, H.; Iwasaki, A.; et al. Long-lived volcanism on the lunar farside revealed by SELENE Terrain Camera. Science 2009, 323, 905–908. [Google Scholar] [CrossRef] [PubMed] [Green Version]
- Morota, T.; Haruyama, J.; Ohtake, M.; Matsunaga, T.; Honda, C.; Yokota, Y.; Kimura, J.; Ogawa, Y.; Hirata, N.; Demura, H.; et al. Timing and characteristics of the latest mare eruption on the Moon. Earth Planet. Sci. Lett. 2011, 302, 255–266. [Google Scholar] [CrossRef]
- McCord, T.B.; Taylor, L.A.; Combe, J.-P.; Kramer, G.; Pieters, C.M.; Sunshine, J.M.; Clark, R.N. Sources and physical processes responsible for OH/H2O in the lunar soil as revealed by the Moon Mineralogy Mapper (M3). J. Geophys. Res. 2010, 116, E00G05. [Google Scholar] [CrossRef] [Green Version]
- Harayuma, J.; Morota, T.; Kobayashi, S.; Sawai, S.; Lucey, P.G.; Shirao, M.; Nishino, M.N. Lunar holes and lava tubes as resources for lunar dcience and exploration. In Moon, 1st ed.; Badescu, V., Ed.; Springer: New York, NY, USA, 2012. [Google Scholar]
- Keihm, S.J.; Langseth, M.G. Surface brightness temperatures at the Apollo 17 heat flow site: Thermal conductivity of the upper 15 cm of regolith. In Proceedings of the Lunar Science Conference IV, Palisades, NY, USA, 17 August 1973; pp. 2503–2513. [Google Scholar]
- Langseth, M.G.; Keihm, S.J.; Peters, K. Revised lunar heat-flow values. In Proceedings of the Lunar Science Conference VII, Houston, TX, USA, 15–19 March 1976. [Google Scholar]
- Riedel, S.J.; Sakimoto, S.E.H. MOLA topographic constraints on lava tube effusion rates for Alba Patera, Mars. In Proceedings of the 33rd Lunar and Planetary Science Conference, Houston, TX, USA, 11–15 March 2002. [Google Scholar]
- Keszthelyi, L.; Jaeger, W.L.; Milazzo, M.P.; McEwen, A.S.; HiRISE Team. High resolution imaging science experiment (HiRISE) images of volcanic terrains from the first 6 months of the Mars reconnaissance orbiter primary science phase. In Proceedings of the Seventh International Conference on Mars, Pasadena, CA, USA, 9-13 July 2007. [Google Scholar]
- Parcheta, C.; Bruno, B.C.; Fagents, S.A. Lava flows in the Tharsis region of Mars: Estimates of flow speeds and volume fluxes. In Fall Meeting; American Geophysical Union: San Francisco, CA, USA, 2005. [Google Scholar]
- Bleacher, J.E.; Greeley, R.; Williams, D.A.; Neukum, G.; HRSC Co-Investigator Team. Comparison of effusive volcanism at Olympus, Arsia, Pavonis, and Ascraeus Montes, Mars from lava flow mapping using Mars Express HRSC data. In Proceedings of the 37th Lunar and Planetary Science Conference, League City, TX, USA, 13–17 March 2006. [Google Scholar]
- Cushing, G.E.; Titus, T.N.; Wynne, J.J.; Christensen, P.R. THEMIS observes possible cave skylights on Mars. Geophys. Res. Lett. 2007, 34. [Google Scholar] [CrossRef] [Green Version]
- Boston, P.J.; Frederick, R.D.; Welch, S.M.; Werker, J.; Meyer, T.R.; Sprungman, B.; Hildreth-Werker, V.; Thompson, S.L. Extraterrestrial Subsurface Technology Test Bed: Human Use and Scientific Value of Martian Caves. In Proceedings of the AIP Conference Proceedings, Albuquerque, NM, USA, 8–11 February 2004. [Google Scholar]
- Léveillé, R.J.; Datta, S. Lava tubes and basaltic caves as astrobiological targets on Earth and Mars: A review. Planet. Space Sci. 2010, 58, 592–598. [Google Scholar] [CrossRef]
- Boston, P.J.; Ivanov, M.V.; McKay, C.P. On the possibility of chemosynthetic ecosystems in subsurface habitats on Mars. Icarus 1992, 95, 300. [Google Scholar] [CrossRef]
- Boston, P.J.; Spilde, M.N.; Northup, D.E.; Melim, L.A.; Soroka, D.S.; Kleina, L.G.; Lavoie, K.H.; Hose, L.D.; Mallory, L.M.; Dahm, C.N.; et al. Cave biosignature suites: Microbes, minerals, and Mars. Astrobiology 2001, 1, 25. [Google Scholar] [CrossRef] [PubMed]
- NASA Space Technology Roadmaps and Priorities Revisited. National Academies of Sciences, Engineering, and Medicine; The National Academies Press: Washington, DC, USA, 2018. [Google Scholar]
- Abad-Manterola, P.; Edlund, J.A.; Burdick, J.W.; Wu, A.; Oliver, T.; Issa, d.L.; Cecava, J. Axel: A Minimalist Tethered Rover for Exploration of Extreme Planetary Terrains. IEEE Robot. Autom. Mag. 2009, 16, 44–52. [Google Scholar] [CrossRef]
- Matthew, J.B.; Nesnas, I.A. On the design of the Axel and DuAxel rovers for extreme terrain exploration. In Proceedings of the IEEE Aerospace Conference, Big Sky, MT, USA, 3–10 March 2012. [Google Scholar]
- Koelbel, L.; Bradley, D.; Tomooka, P.; Gillies, M.; Pudwill, D.; Sjoquist, P.; Fuehrer, D. Lunar Acquisition Vehicle and Analysis (LAVA) Final Report, NASA RASCAL 2021 Final Competition; NASA: Washington, DC, USA, 2021. [Google Scholar]
- Staehle, R.L.; Anderson, B.; Betts, B.; Blaney, D.; Chow, C.; Friedman, L.; Wilson, T. Interplanetary CubeSats: Opening the Solar System to a Broad Community at Lower Cost. J. Small Satell. 2013, 2, 161–186. [Google Scholar]
- Thangavelautham, J.; Robinson, M.S.; Taits, A.; McKinney, T.J.; Amidan, S.; Polak, A. Flying, hopping Pit-Bots for cave and lava tube exploration on the Moon and Mars. In Proceedings of the 2nd International Workshop on Instrumentation for Planetary Missions, NASA Goddard, Greenbelt, MD, USA, 4–7 November 2014. [Google Scholar]
- Kalita, H.; Gholap, A.S.; Thangavelautham, J. Dynamics and Control of a Hopping Robot for Extreme Environment Exploration on the Moon and Mars. In Proceedings of the IEEE Aerospace Conference, Big Sky, MT, USA, 7–14 March 2020. [Google Scholar]
- Kalita, H.; Thangavelautham, J. Mobility, Power and Thermal control of SphereX for planetary exploration. In Proceedings of the AAS GN&C Conference, Breckenridge, CO, USA, 1–5 February 2020. [Google Scholar]
- Siegwart, R.; Lamon, P.; Estier, T.; Lauria, M.; Piguet, R. Innovative design for wheeled locomotion in rough terrain. Robot. Auton. Syst. 2002, 40, 151–162. [Google Scholar] [CrossRef]
- Kobayashi, T.; Fujiwara, Y.; Yamakawa, J.; Yasufuku, N.; Omine, K. Mobility performance of a rigid wheel in low gravity environments. J. Terramechanics 2018, 47, 261–274. [Google Scholar] [CrossRef]
- Chottiner, J.E. Simulation of a Six Wheeled Martian Rover Called the Rocker Bogie. Ph.D. Thesis, The Ohio State University, Columbus, OH, USA, 1992. [Google Scholar]
- Genta, G.; Genta, A. Preliminary assessment of a small robotic rover for Titan exploration. Acta Astronaut. 2011, 68, 556–566. [Google Scholar] [CrossRef]
- Robinson, M.S.; Thangavelautham, J.; Wagner, R.V.; Hernandez, V.A. Arne—Sublunarean Explorer. In Proceedings of the Lunar Exploration Analysis Group, Laurel, MD, USA, 22–24 October 2014. [Google Scholar]
- Kalita, H.; Thangavelautham, J. Lunar CubeSat Lander to Explore Mare Tranquilitatis Pit. In Proceedings of the AIAA SciTech Forum, Orlando, FL, USA, 6–10 January 2020. [Google Scholar]
- Kalita, H.; Morad, S.; Ravindran, A.; Thangavelautham, J. Path Planning and Navigation Inside Off-World Lava Tubes and Caves. In Proceedings of the IEEE/ION PLANS, Monterey, CA, USA, 23–26 April 2018. [Google Scholar]
- Mendes, E.; Koch, P.; Lacroix, S. ICP-Based Pose-Graph SLAM. In Proceedings of the International Symposium on Safety, Security and Rescue Robotics, Lausanne, Switzerland, 23–27 October 2016. [Google Scholar]
- Dube, R.; Gawel, A.; Sommer, H.; Nieto, J.; Siegwart, R.; Cadena, C. An Online Multi-Robot SLAM System for 3D LiDARs. In Proceedings of the IEEE/RSJ International Conference on Intelligent Robots and Systems (IROS), Vancouver, BC, Canada, 24–28 September 2017. [Google Scholar]
- LaValle, S.M. Rapidly-Exploring Random Trees: A New Tool for Path Planning; TR 98-11; Computer Science Department, Iowa State University: Ames, IA, USA, 1998. [Google Scholar]
- Karaman, S.; Frazzoli, E. Sampling-based algorithms for optimal motion planning. Int. J. Robot. Res. 2011, 30, 846–894. [Google Scholar] [CrossRef]
- Tse, D.; Viswanath, P. Capacity of wireless channels. In Fundamentals of Wireless Communication, 2nd ed.; Cambridge University Press: New York, NY, USA, 2005; pp. 166–227. [Google Scholar]
- Zhang, Q.; Fang, W.; Liu, Q.; Wu, J.; Xia, P.; Yang, L. Distributed Laser Charging: A Wireless Power Transfer Approach. IEEE Internet Things J. 2018, 5, 3853–3864. [Google Scholar] [CrossRef] [Green Version]


| LineSpec | Property |
|---|---|
| Color—‘red’ | W |
| Color—‘blue’ | W |
| Color—‘black’ | W |
| LineStyle—‘Solid’ | m |
| LineStyle—‘Dashed’ | m |
| LineStyle—‘Dash-dot’ | m |
Publisher’s Note: MDPI stays neutral with regard to jurisdictional claims in published maps and institutional affiliations. |
© 2021 by the authors. Licensee MDPI, Basel, Switzerland. This article is an open access article distributed under the terms and conditions of the Creative Commons Attribution (CC BY) license (https://creativecommons.org/licenses/by/4.0/).
Share and Cite
Kalita, H.; Thangavelautham, J. Strategies for Deploying a Sensor Network to Explore Planetary Lava Tubes. Sensors 2021, 21, 6203. https://doi.org/10.3390/s21186203
Kalita H, Thangavelautham J. Strategies for Deploying a Sensor Network to Explore Planetary Lava Tubes. Sensors. 2021; 21(18):6203. https://doi.org/10.3390/s21186203
Chicago/Turabian StyleKalita, Himangshu, and Jekan Thangavelautham. 2021. "Strategies for Deploying a Sensor Network to Explore Planetary Lava Tubes" Sensors 21, no. 18: 6203. https://doi.org/10.3390/s21186203
APA StyleKalita, H., & Thangavelautham, J. (2021). Strategies for Deploying a Sensor Network to Explore Planetary Lava Tubes. Sensors, 21(18), 6203. https://doi.org/10.3390/s21186203