
A Mosaic Method for Side-Scan Sonar Strip Images Based on Curvelet Transform and Resolution Constraints


Abstract
:1. Introduction
2. Image Resolution Assessment Methods
2.1. Assessment Method Based on Image Gradient
2.1.1. Energy Gradient Function
2.1.2. Brenner Gradient Function
2.1.3. Tenengrad Gradient Function
2.2. Assessment Method Based on Image Transform Domain
2.2.1. Discrete Fourier Transform (DFT)
2.2.2. Discrete Cosine Transform (DCT)
2.3. Assessment Method Based on Entropy Function
2.4. Assessment Method Based on Variance Function
3. Strip Mosaic Method Based on Curvelet Transform and Resolution Constraints
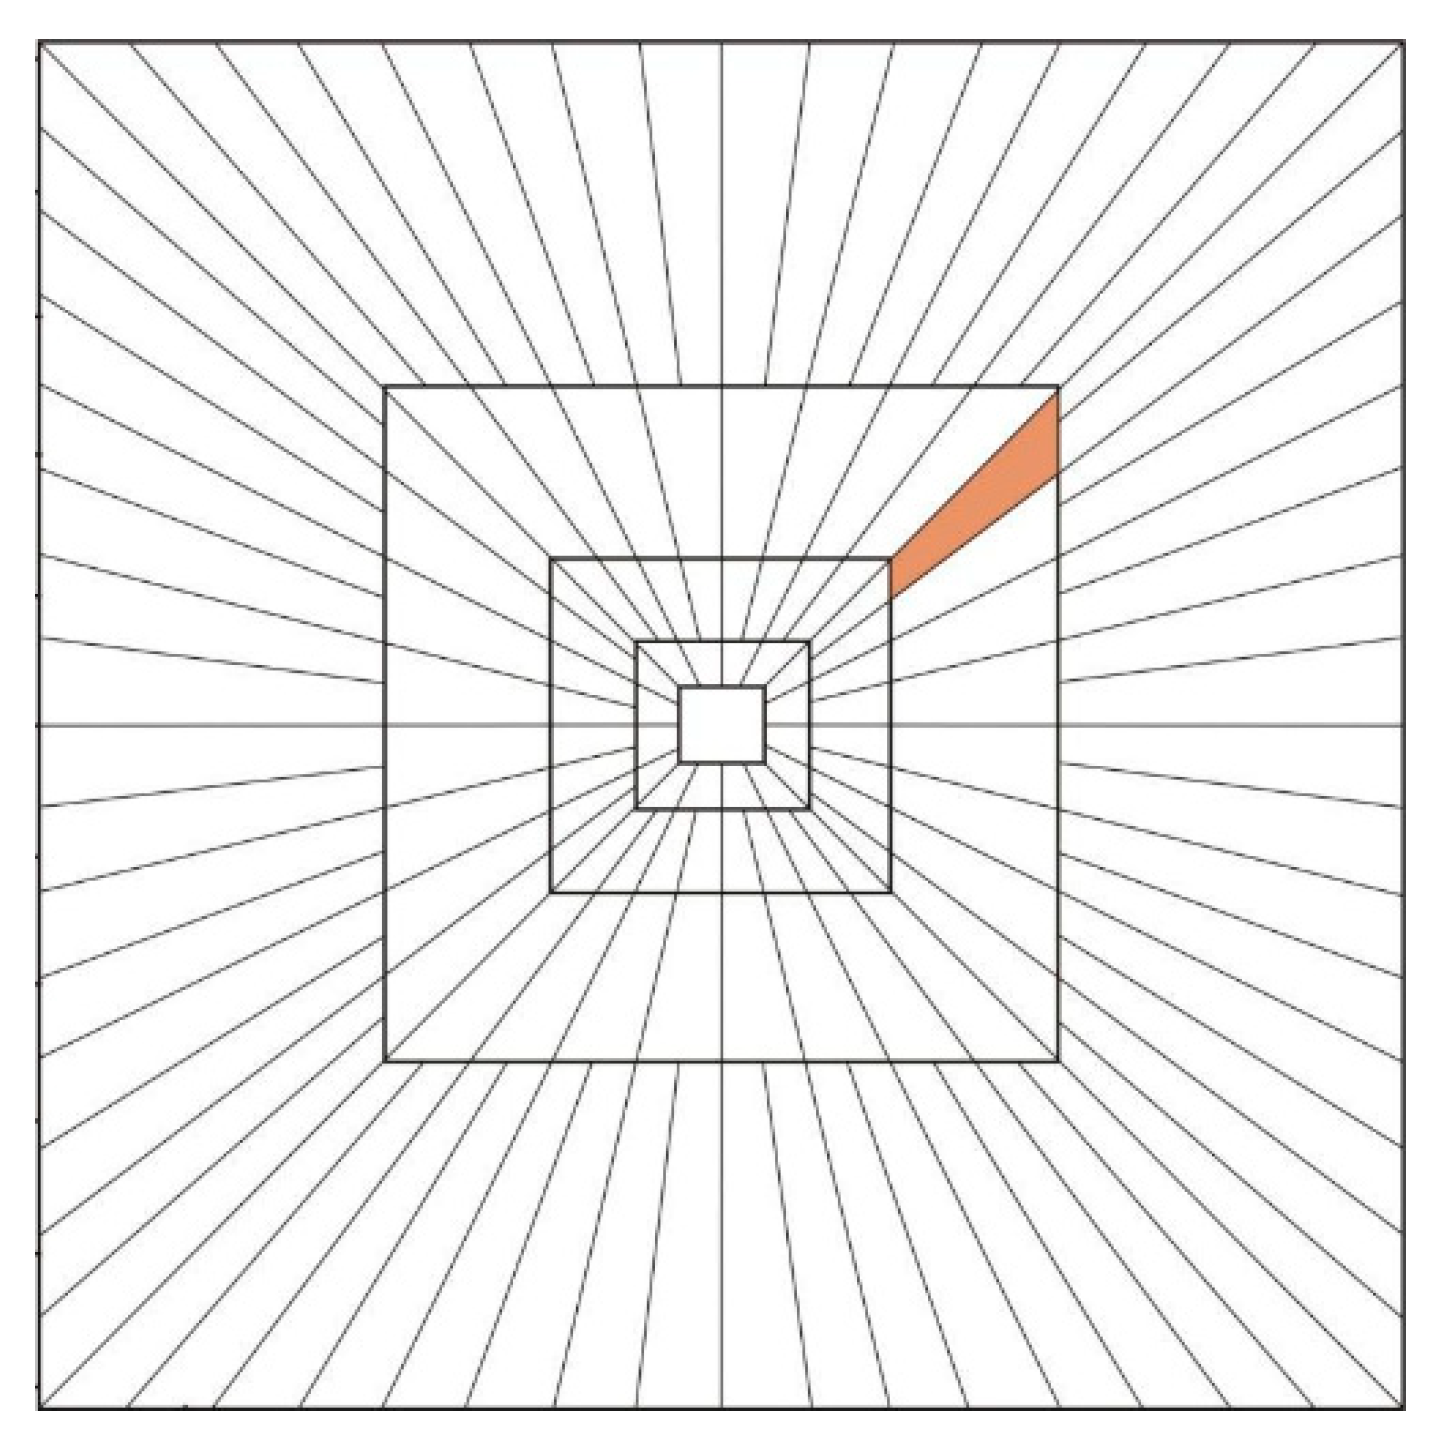
3.1. Image Fusion Algorithm Based on Curvelet Transform
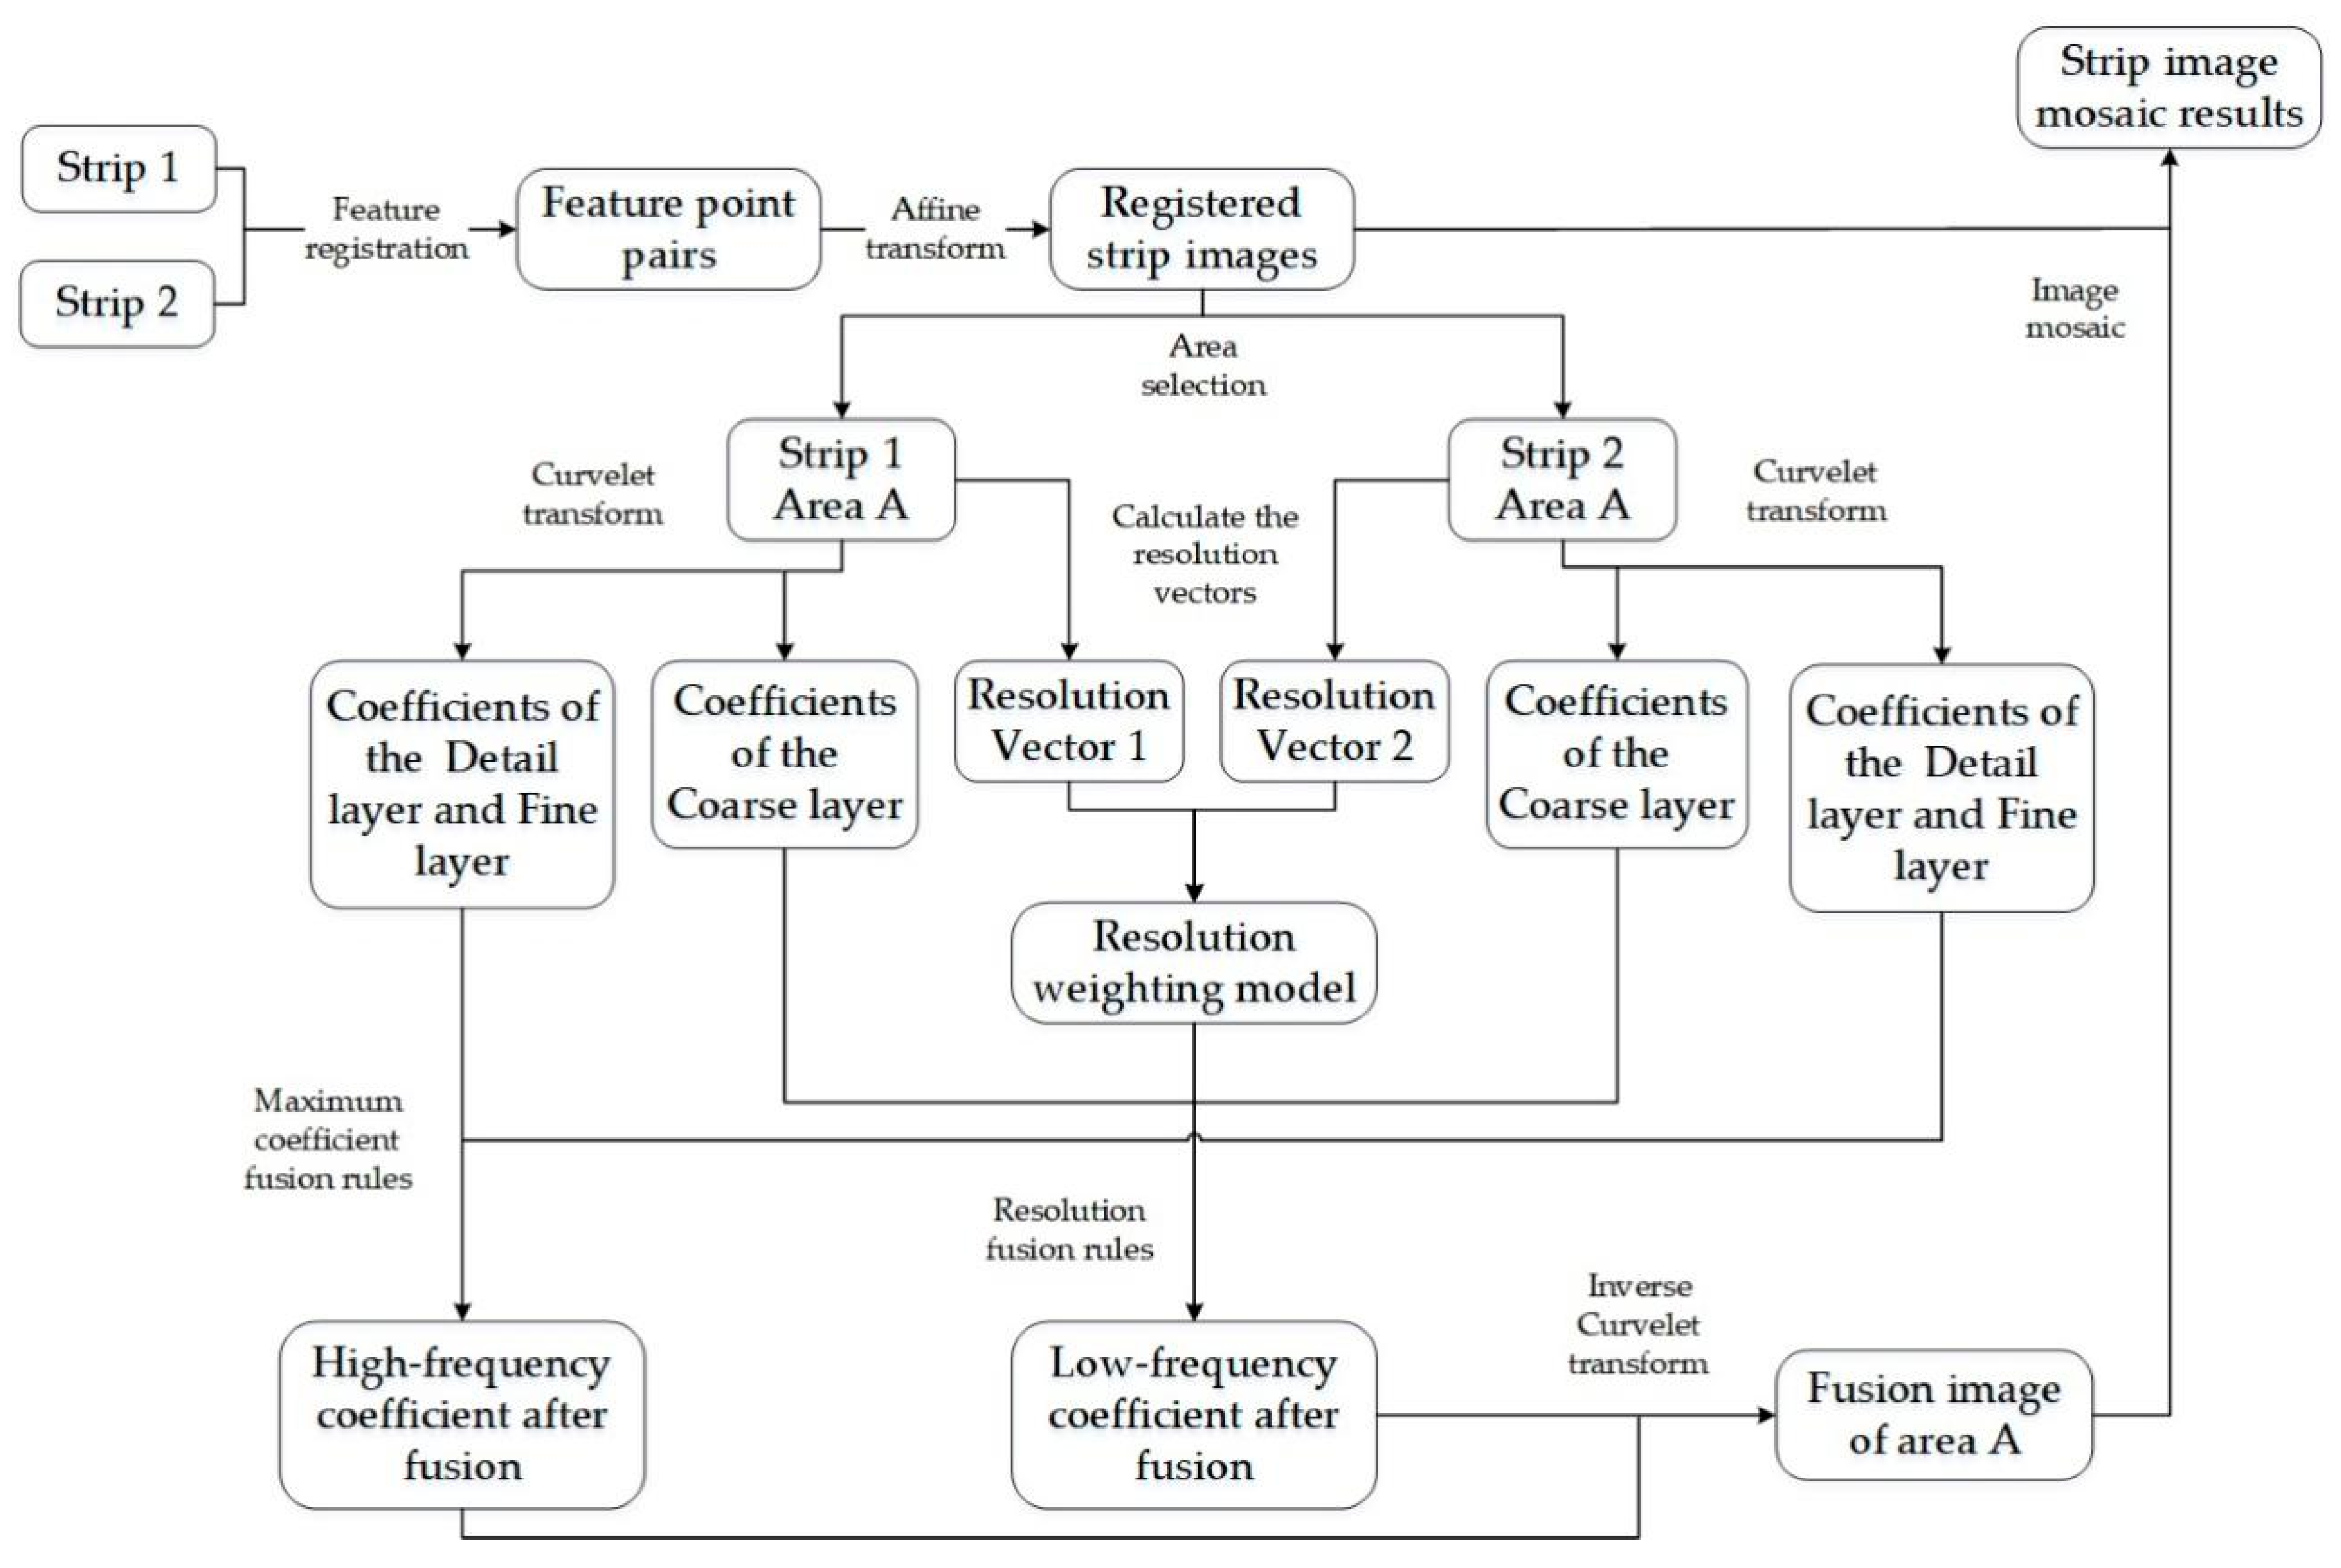
3.2. Strip Image Mosaicking Based on Curvelet Transform and Resolution Constraints
- Extract and match feature points of adjacent strip images and obtain registered mosaic strips using the affine transformation.
- Select the common area A from two strip images.
- Perform Curvelet transform for two images to obtain the coefficients in the Coarse layer, Detail layer, and Fine layer.
- Calculate the resolution vectors of the two images to obtain the corresponding resolution weight.
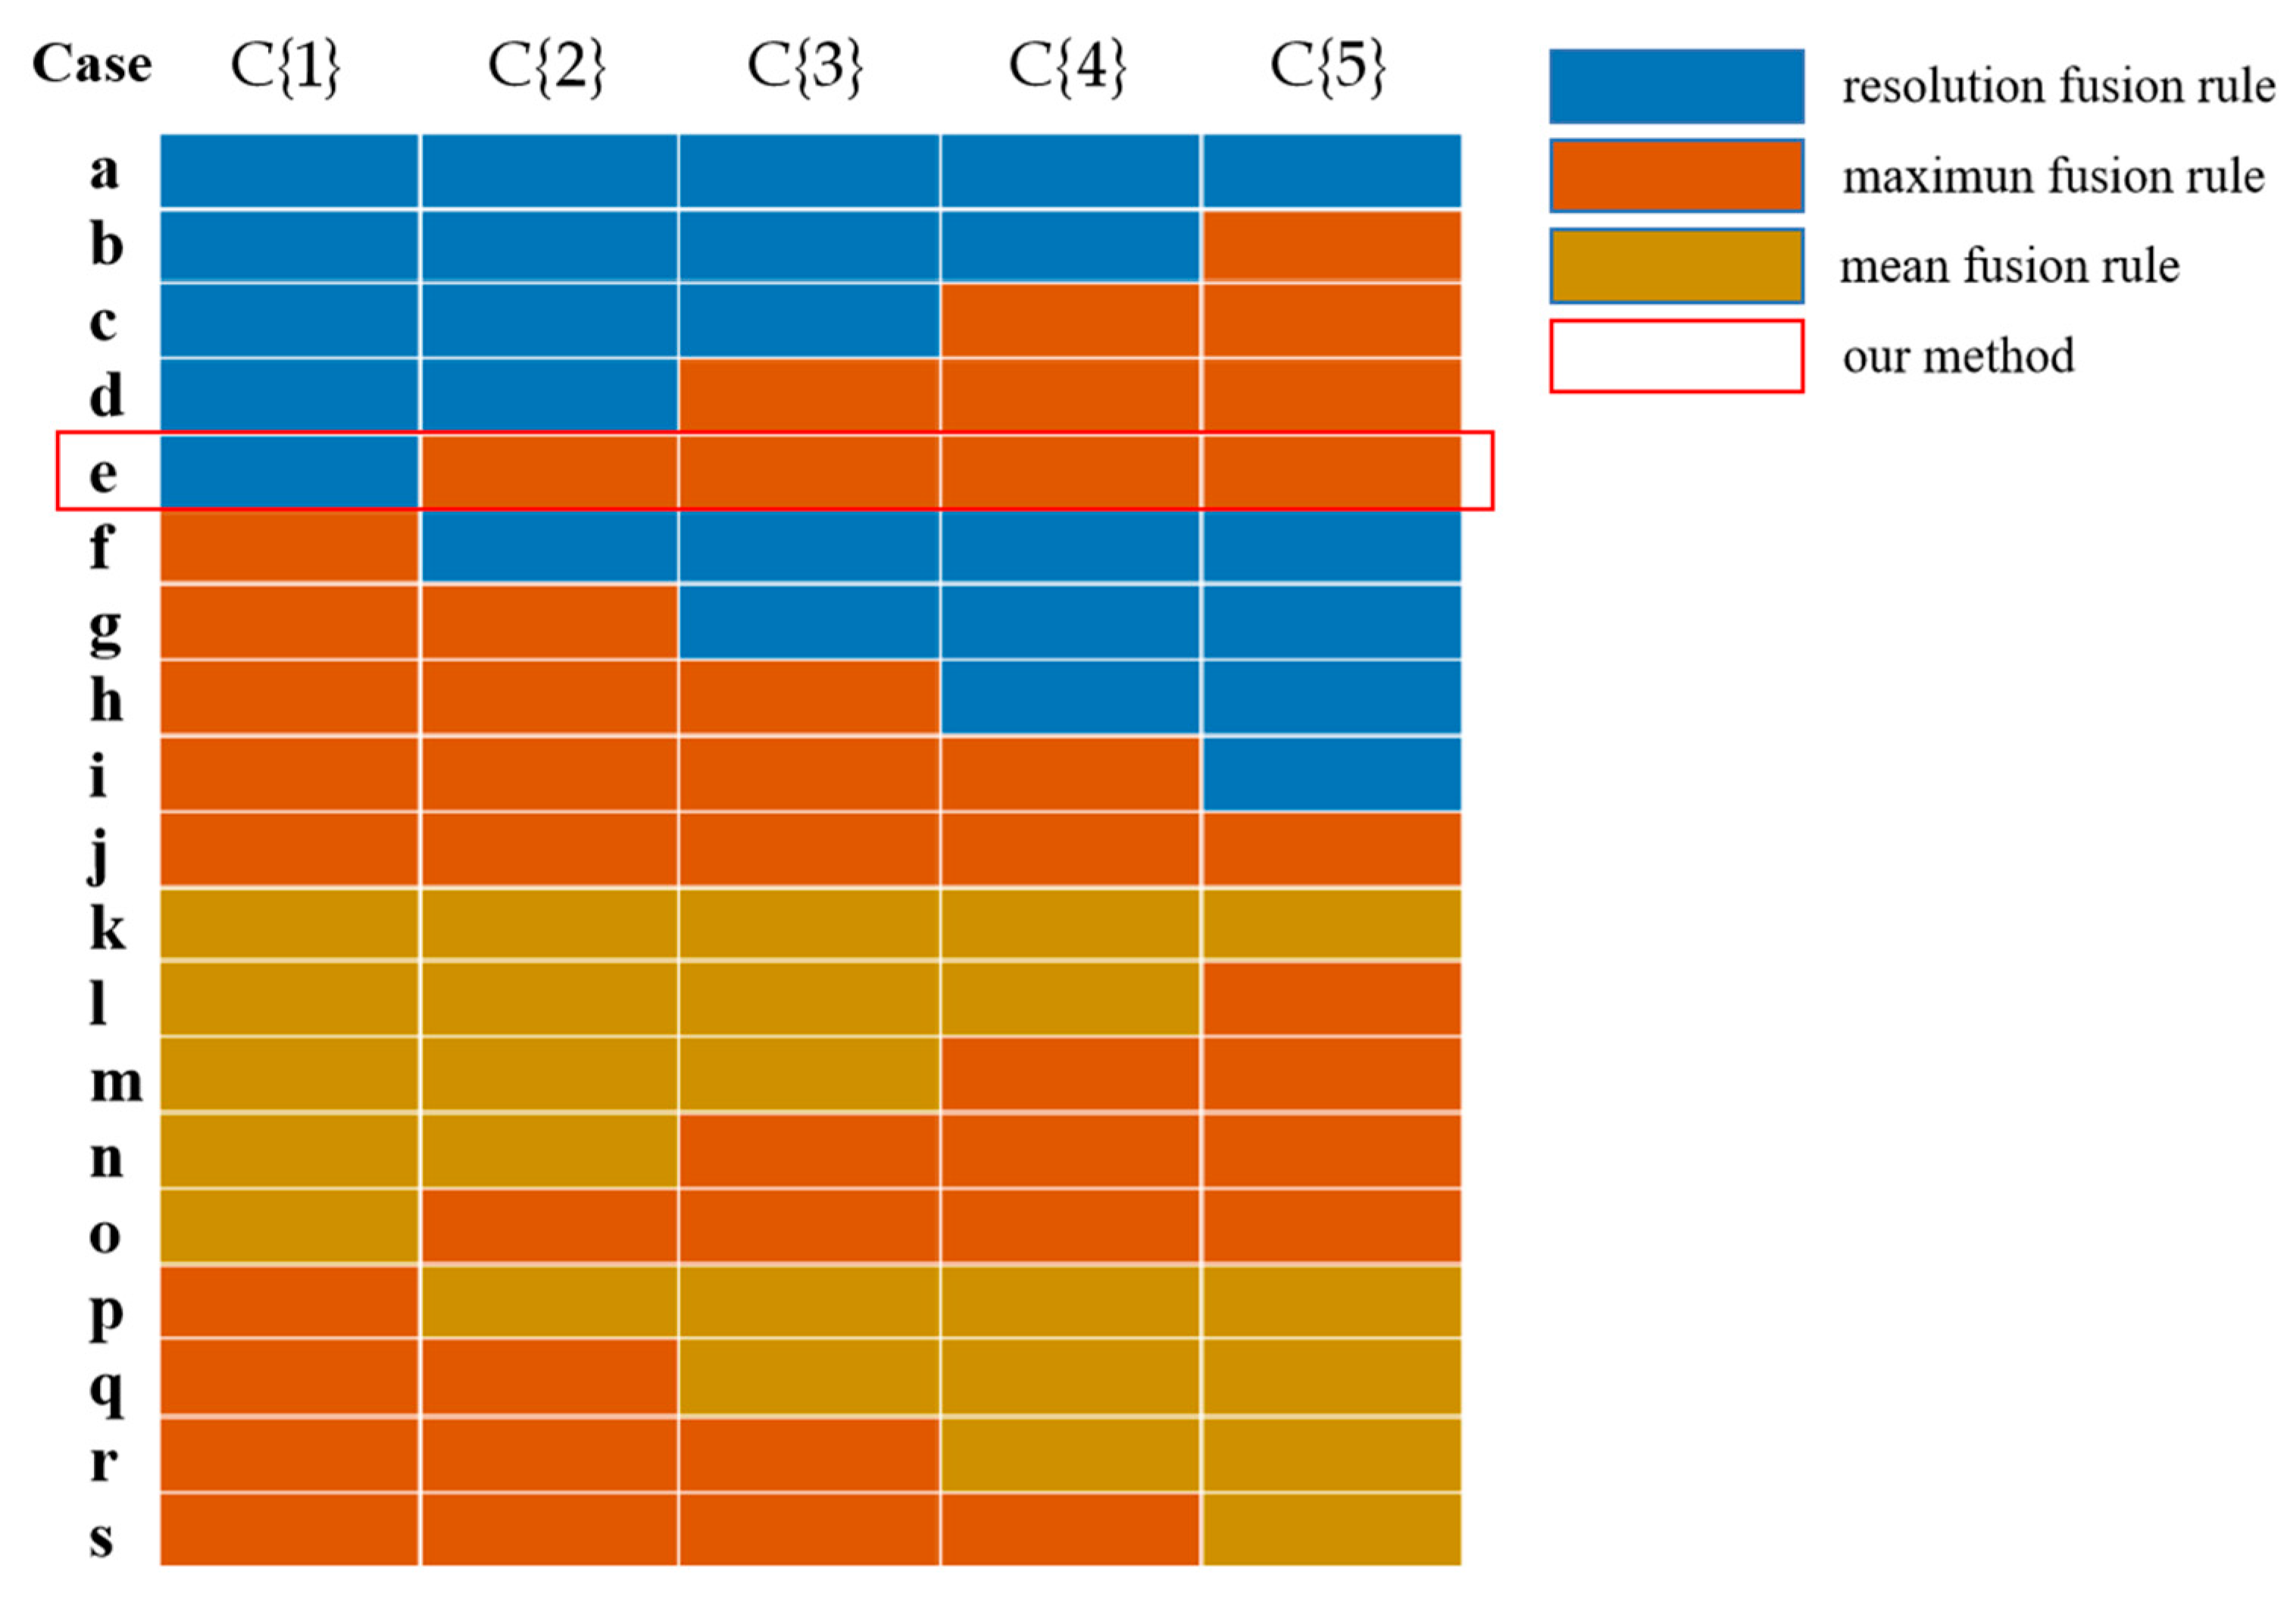
- Fuse the Coarse layer coefficients using resolution fusion rules to obtain the low-frequency coefficients. Fuse the Detail layer and Fine layer coefficients using the maximum coefficient fusion rules to obtain the high-frequency coefficients.
- Perform inverse Curvelet transform on the fusion coefficients to obtain the fusion image in area A, which is then mosaicked to the registered strip images.
- Repeat steps 2–6 until the whole mosaic image is obtained.
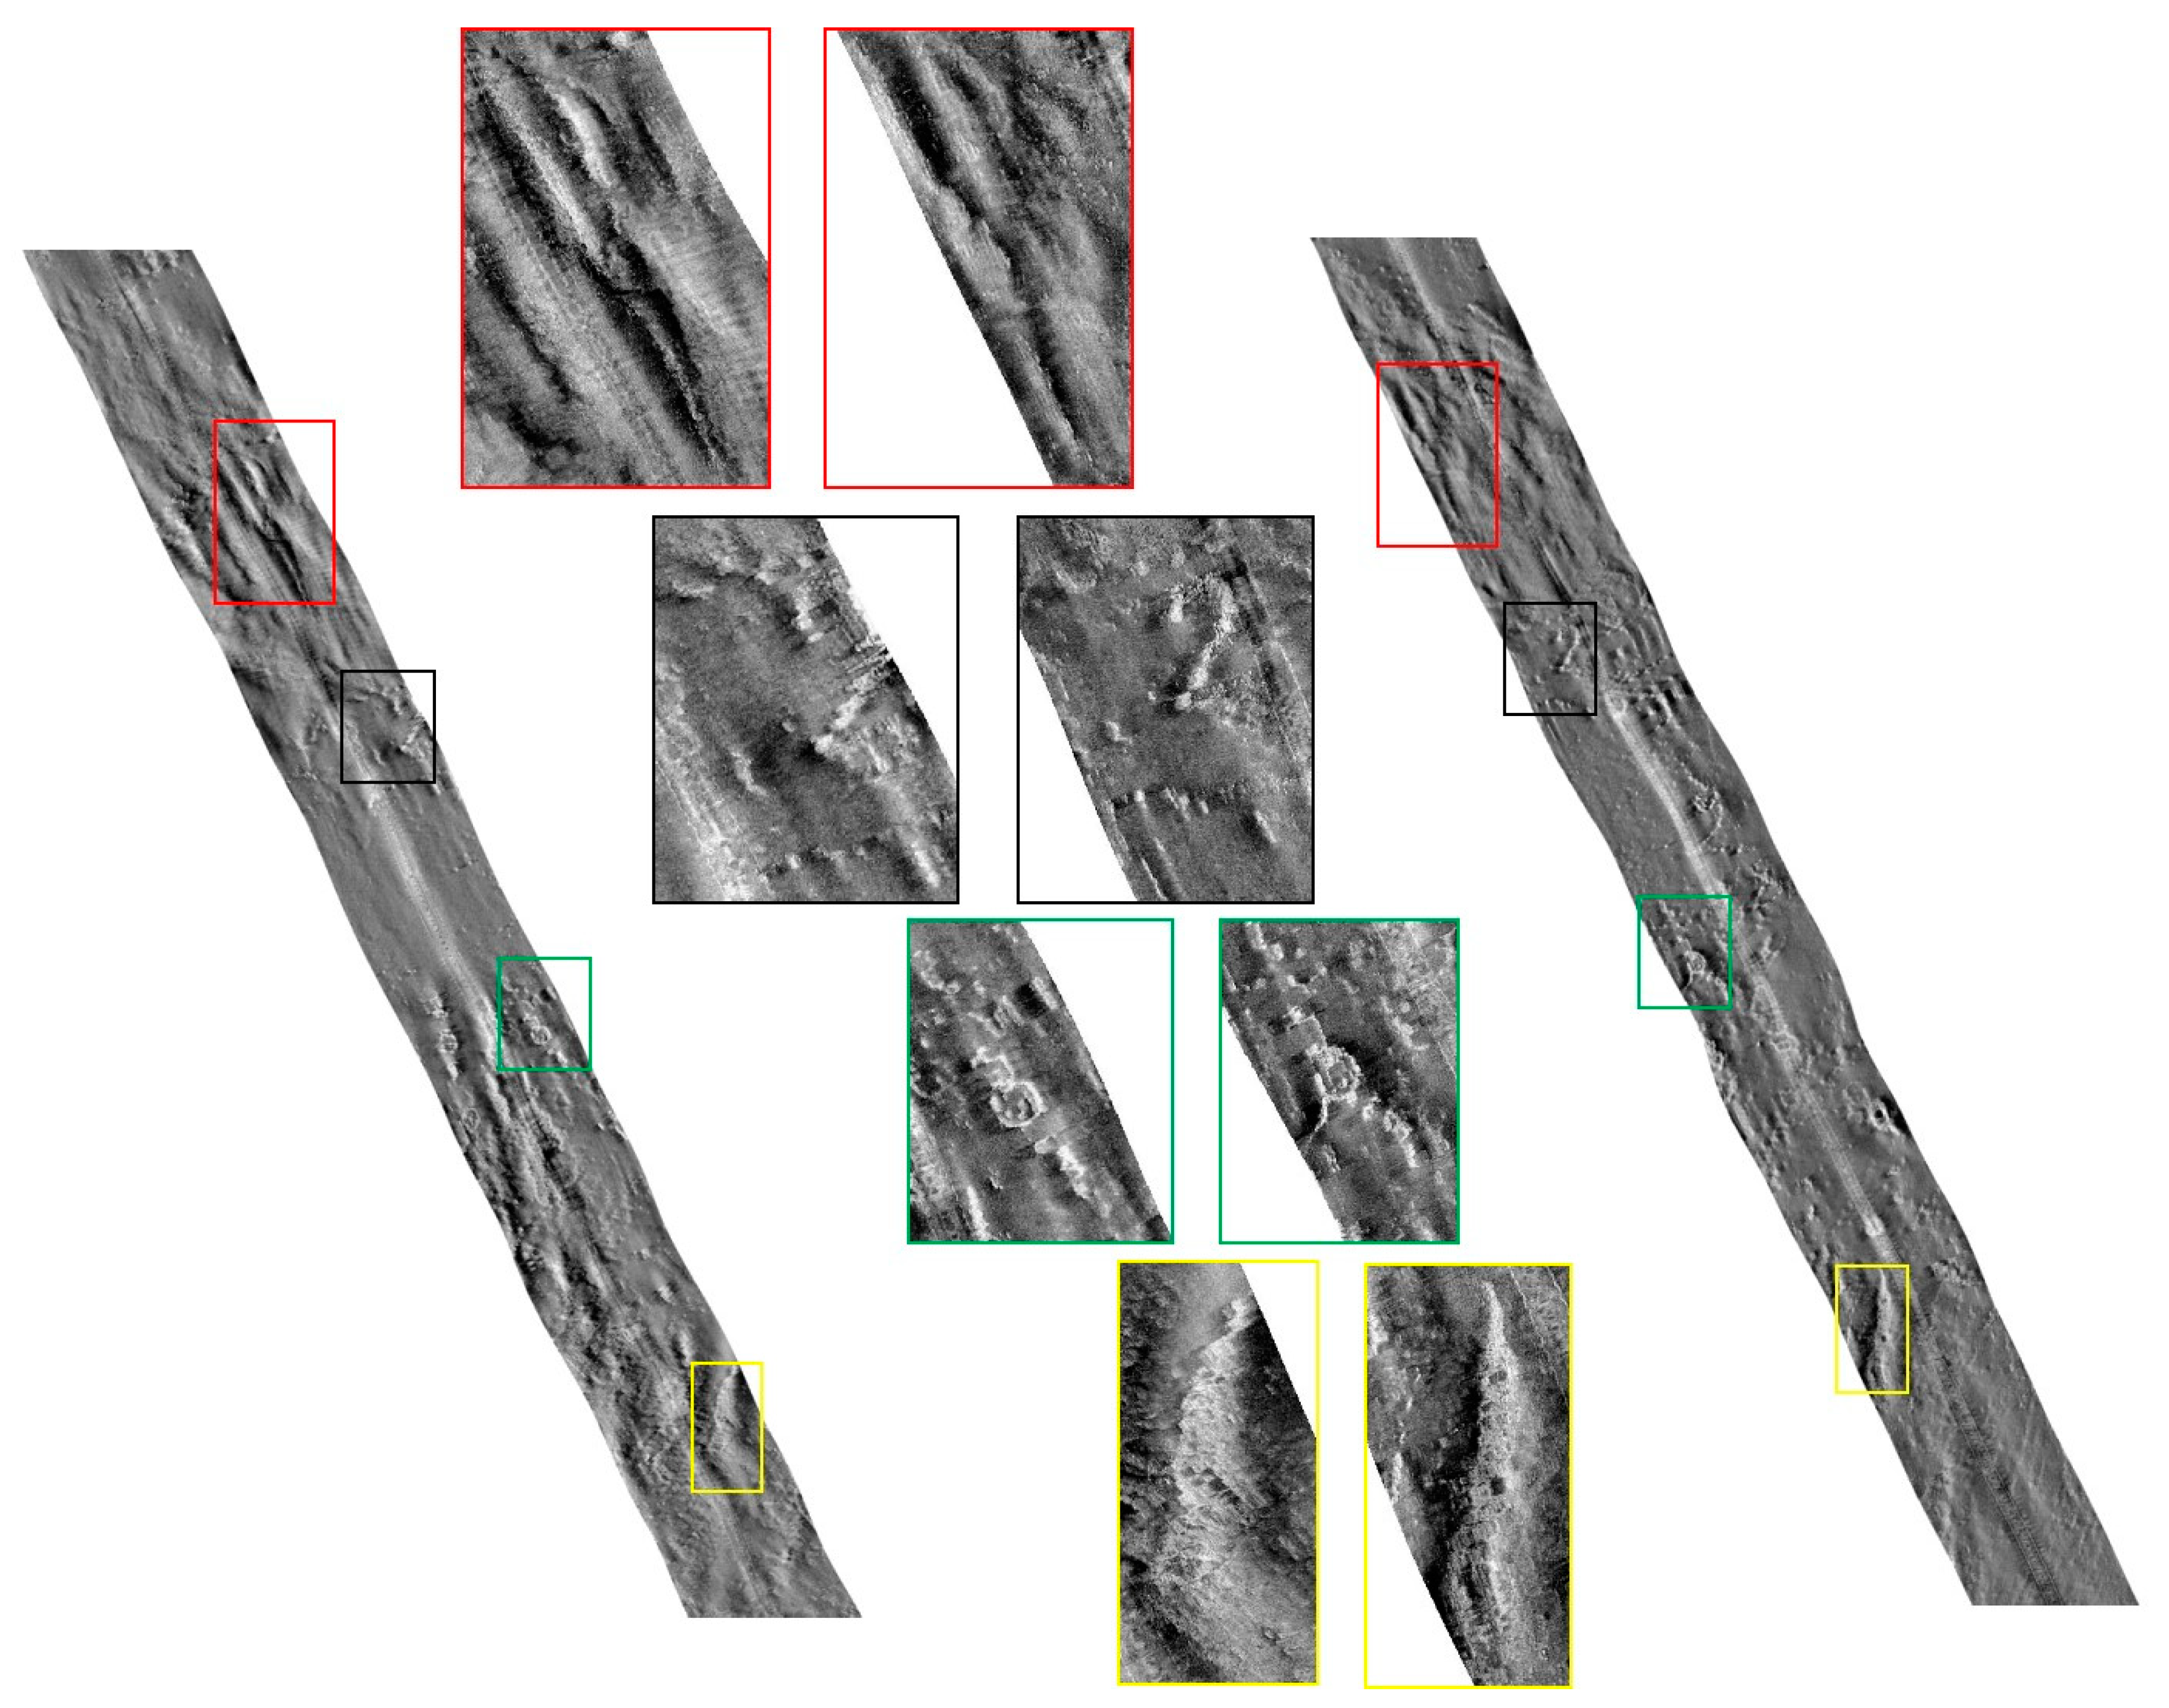
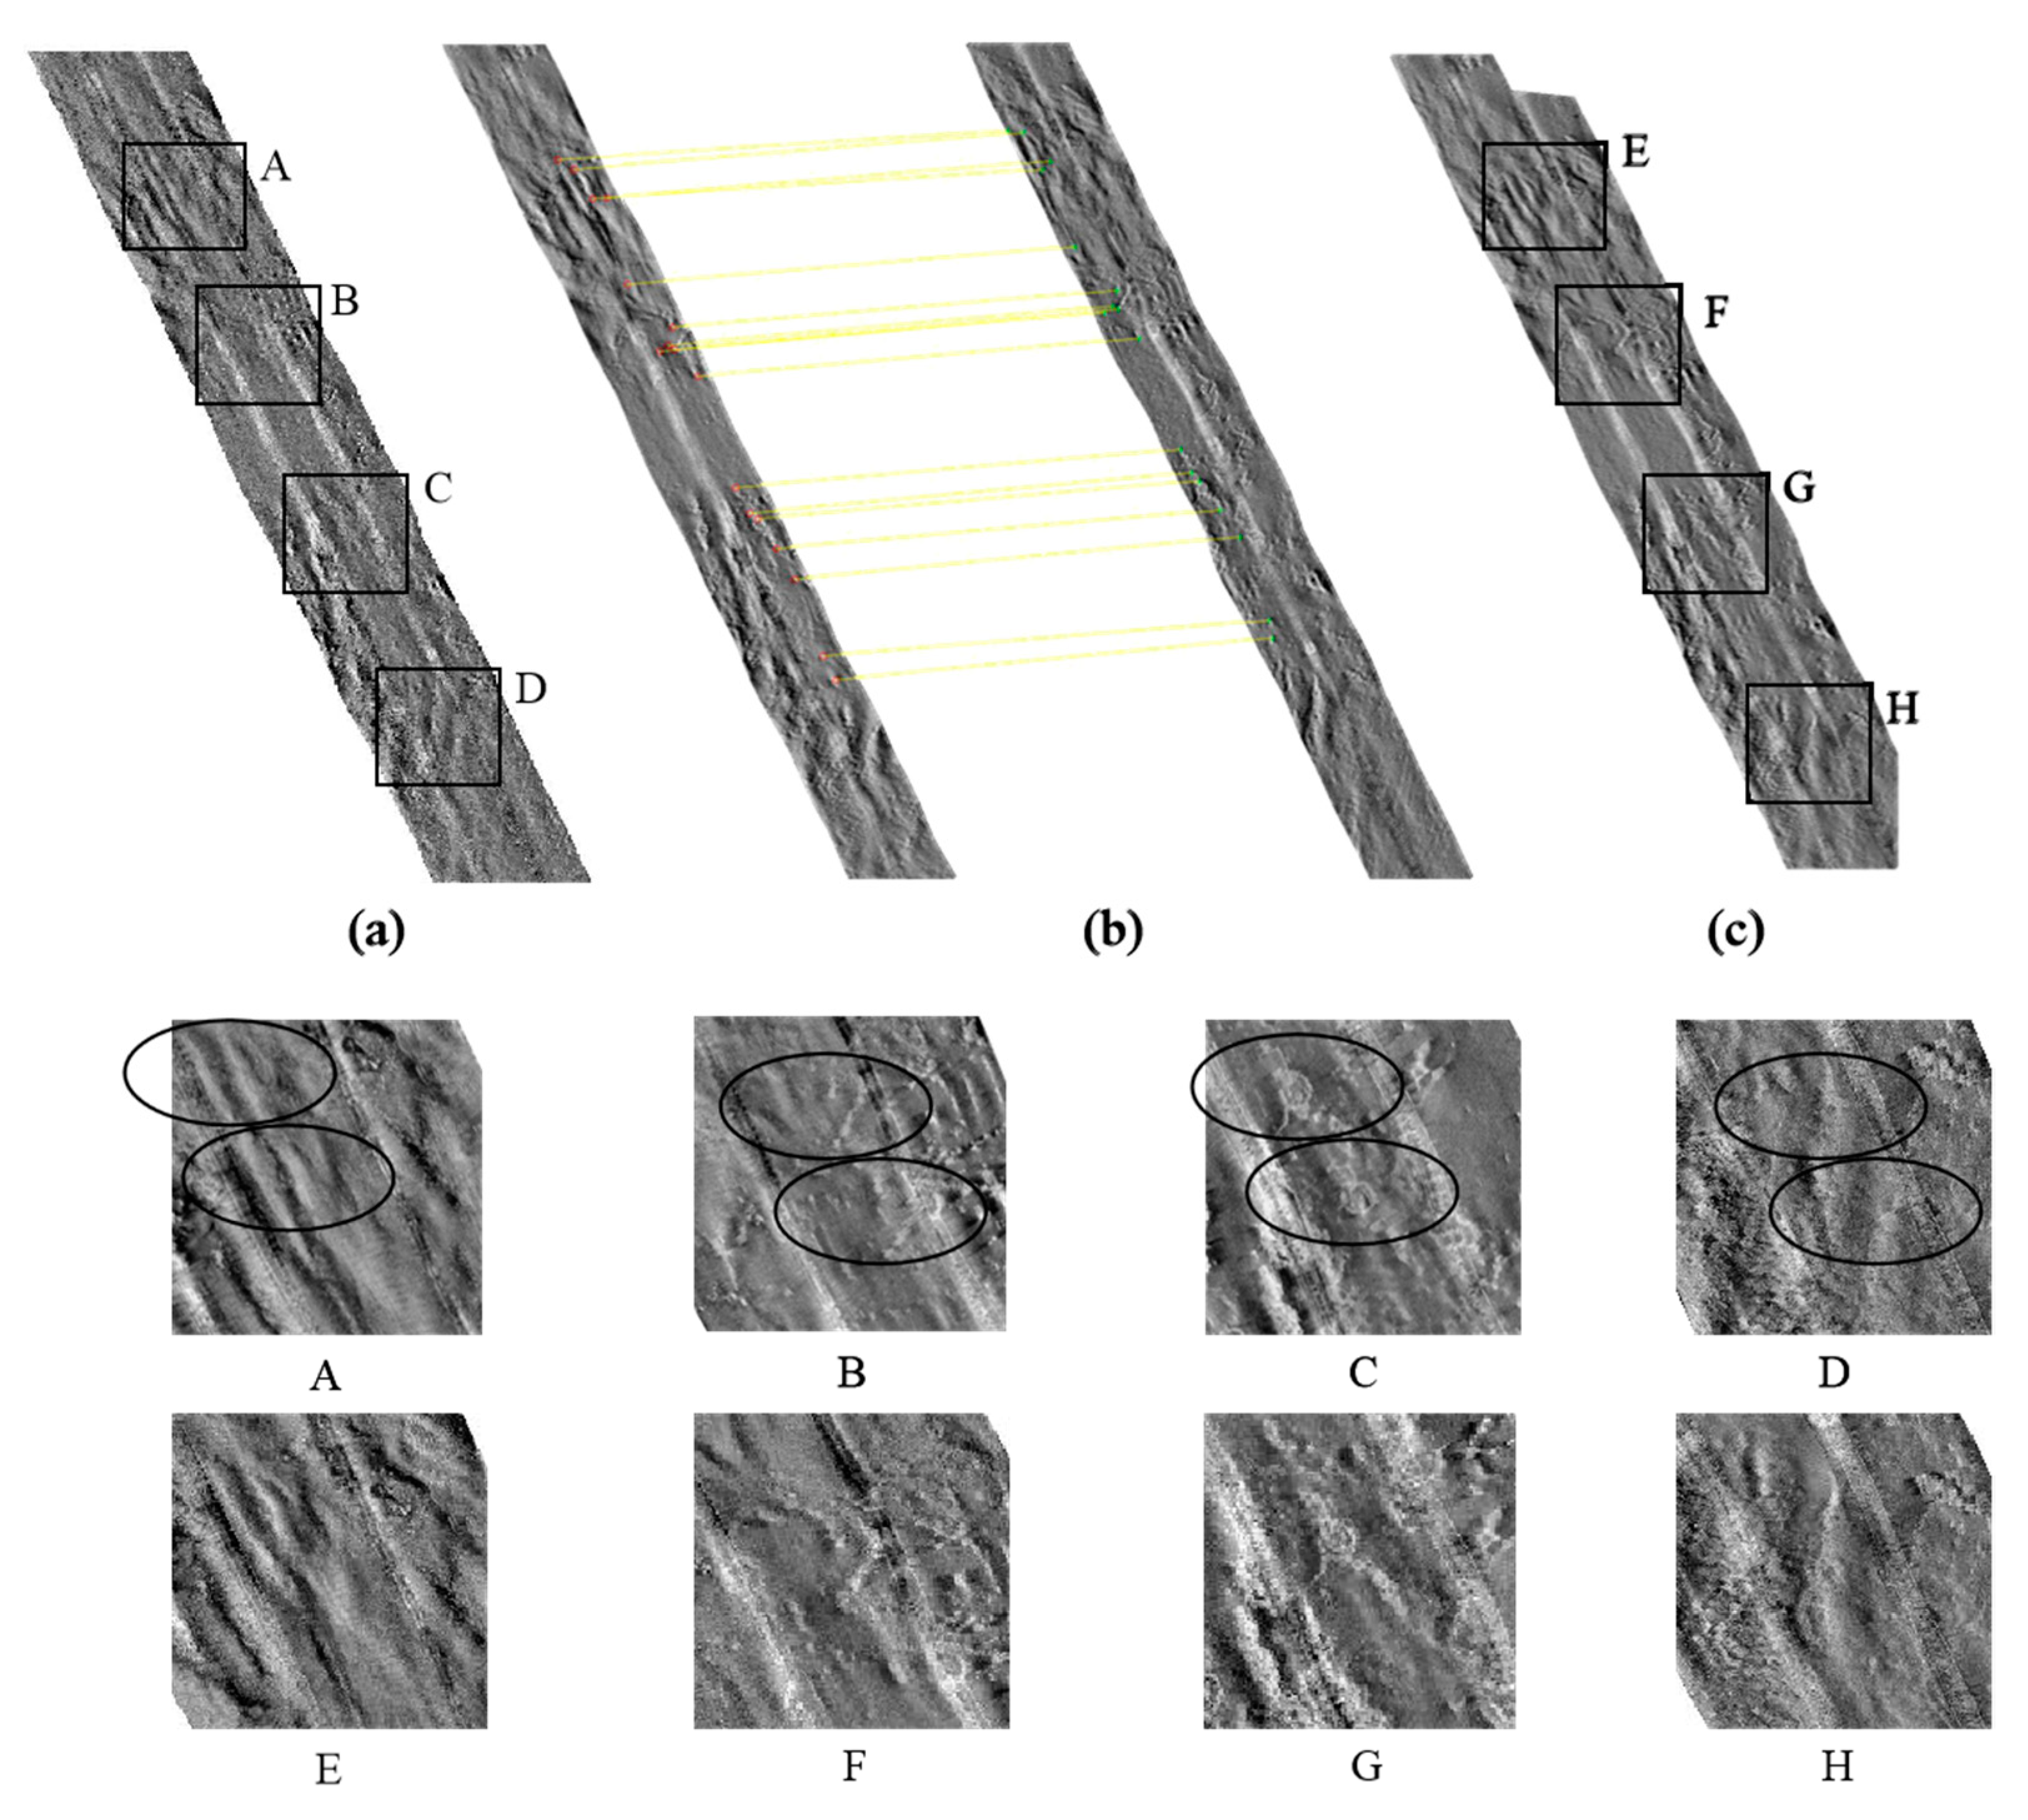
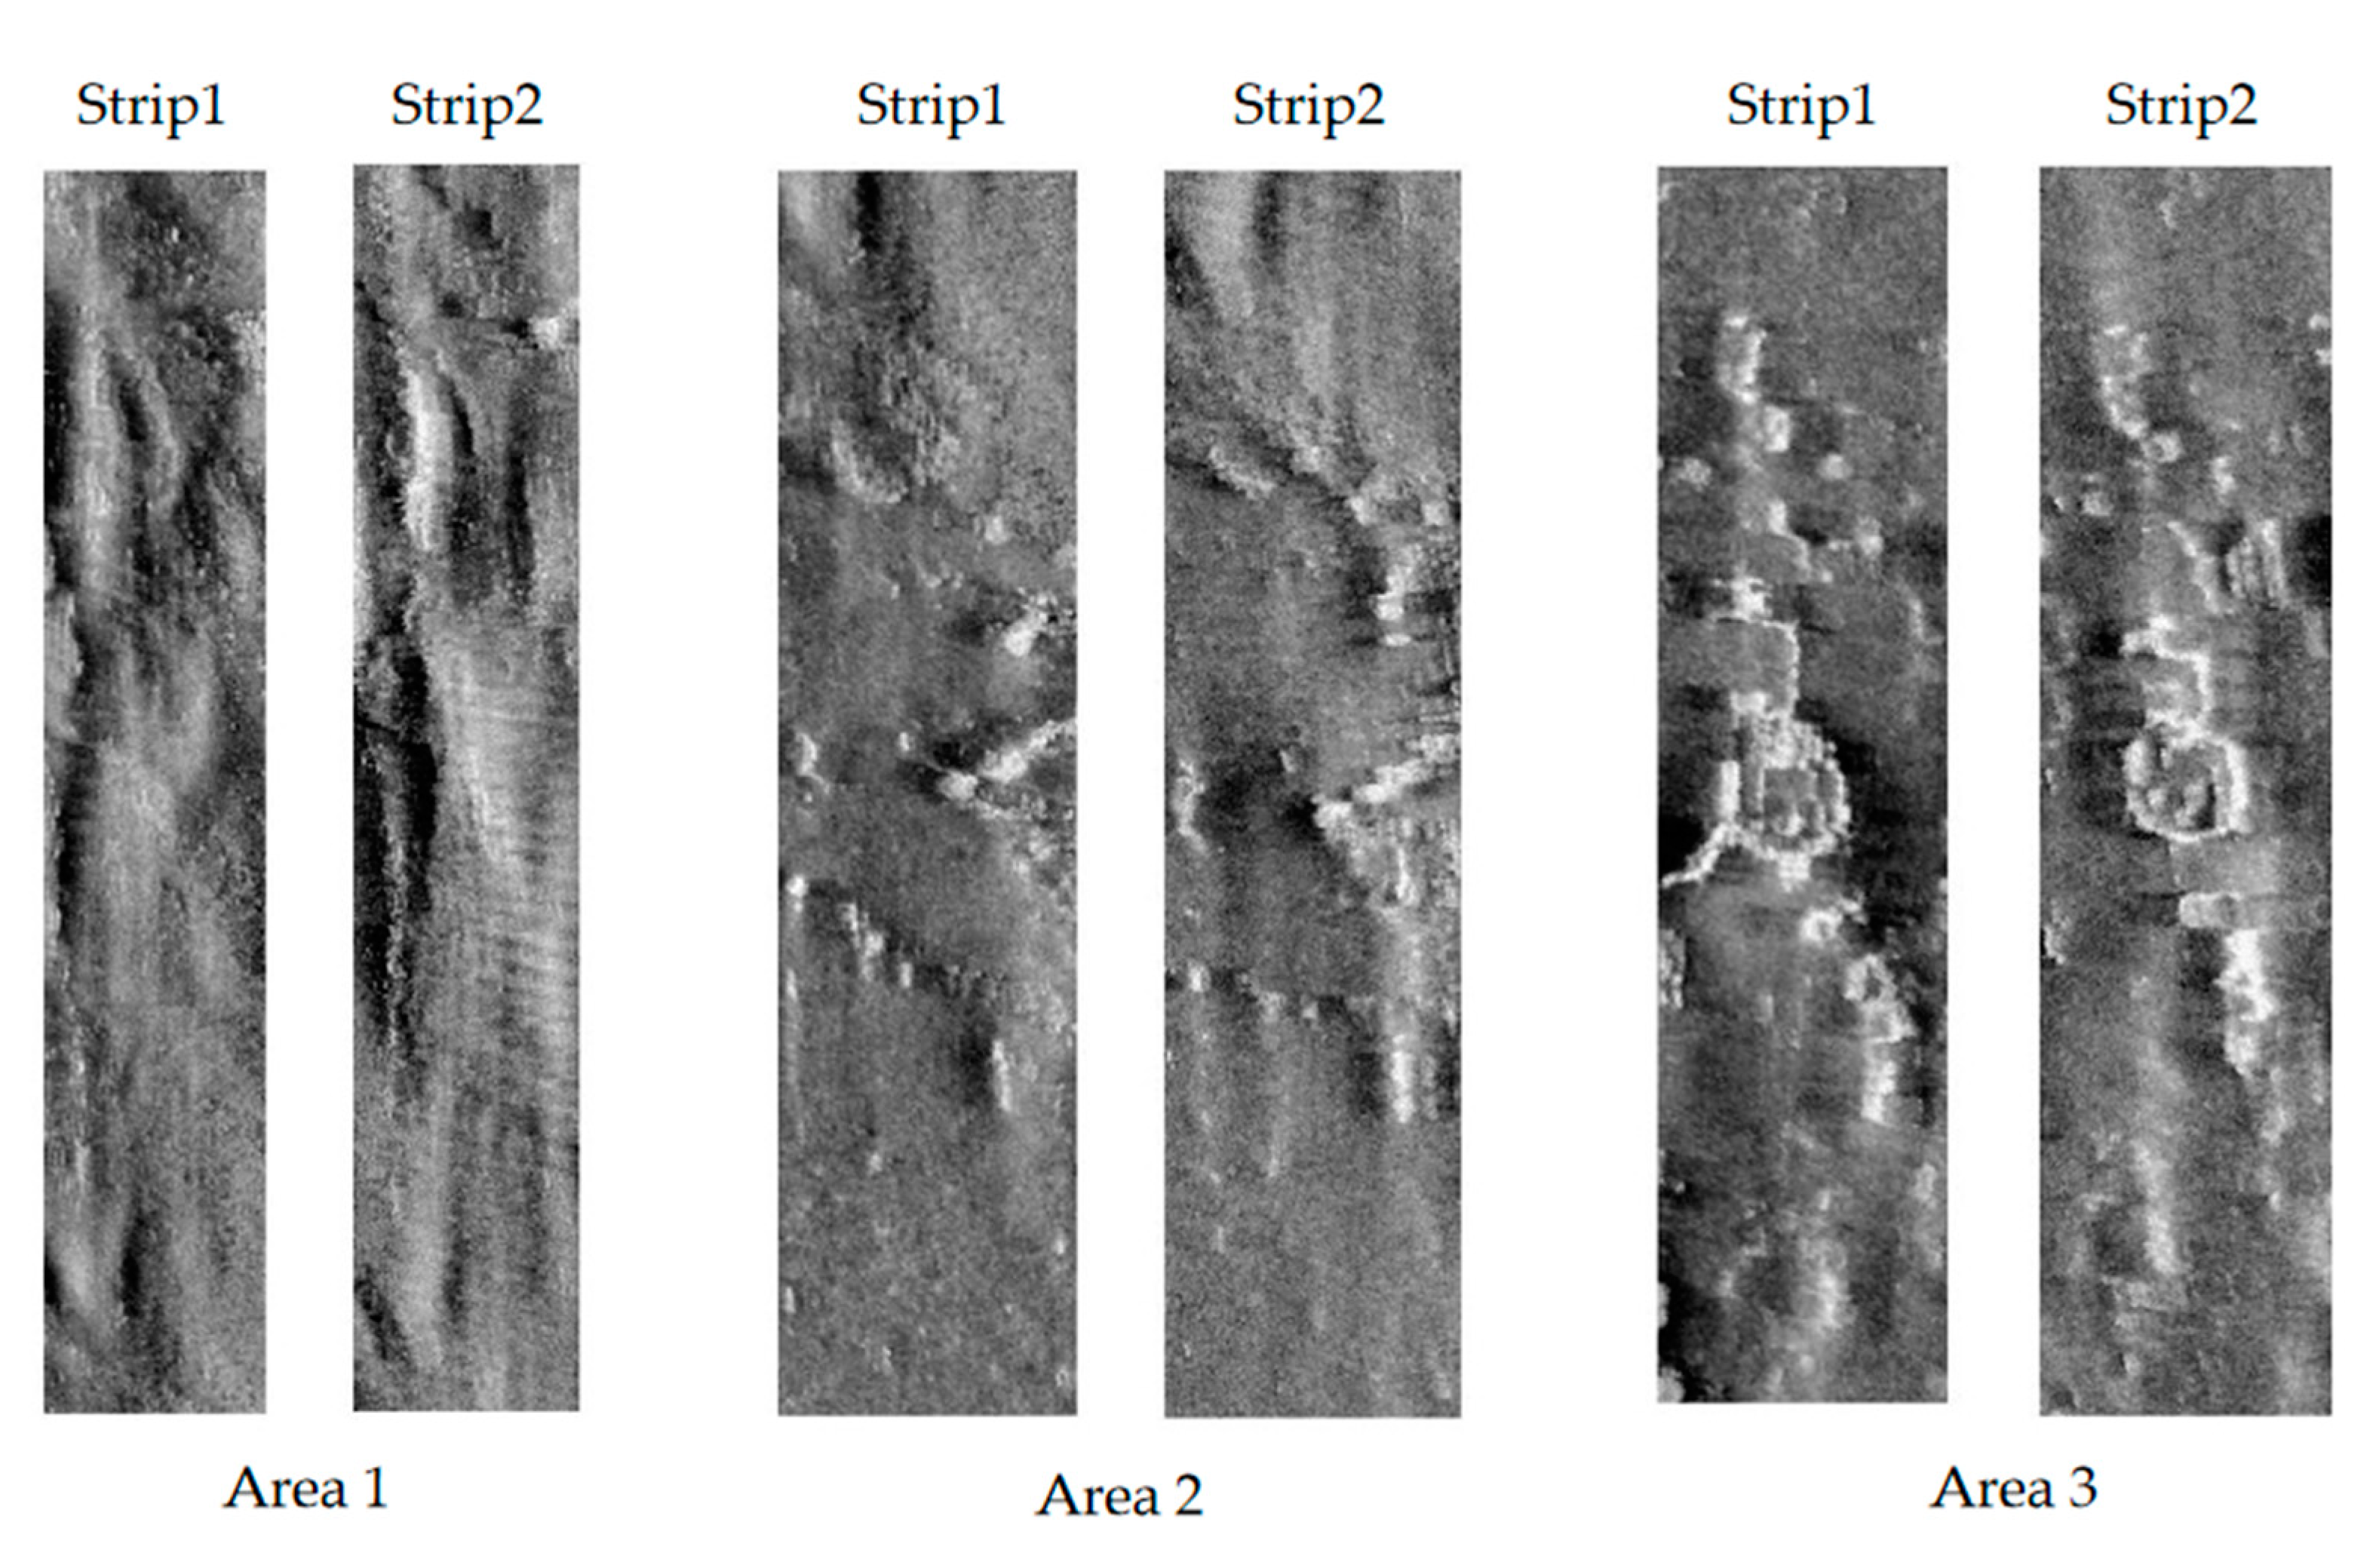
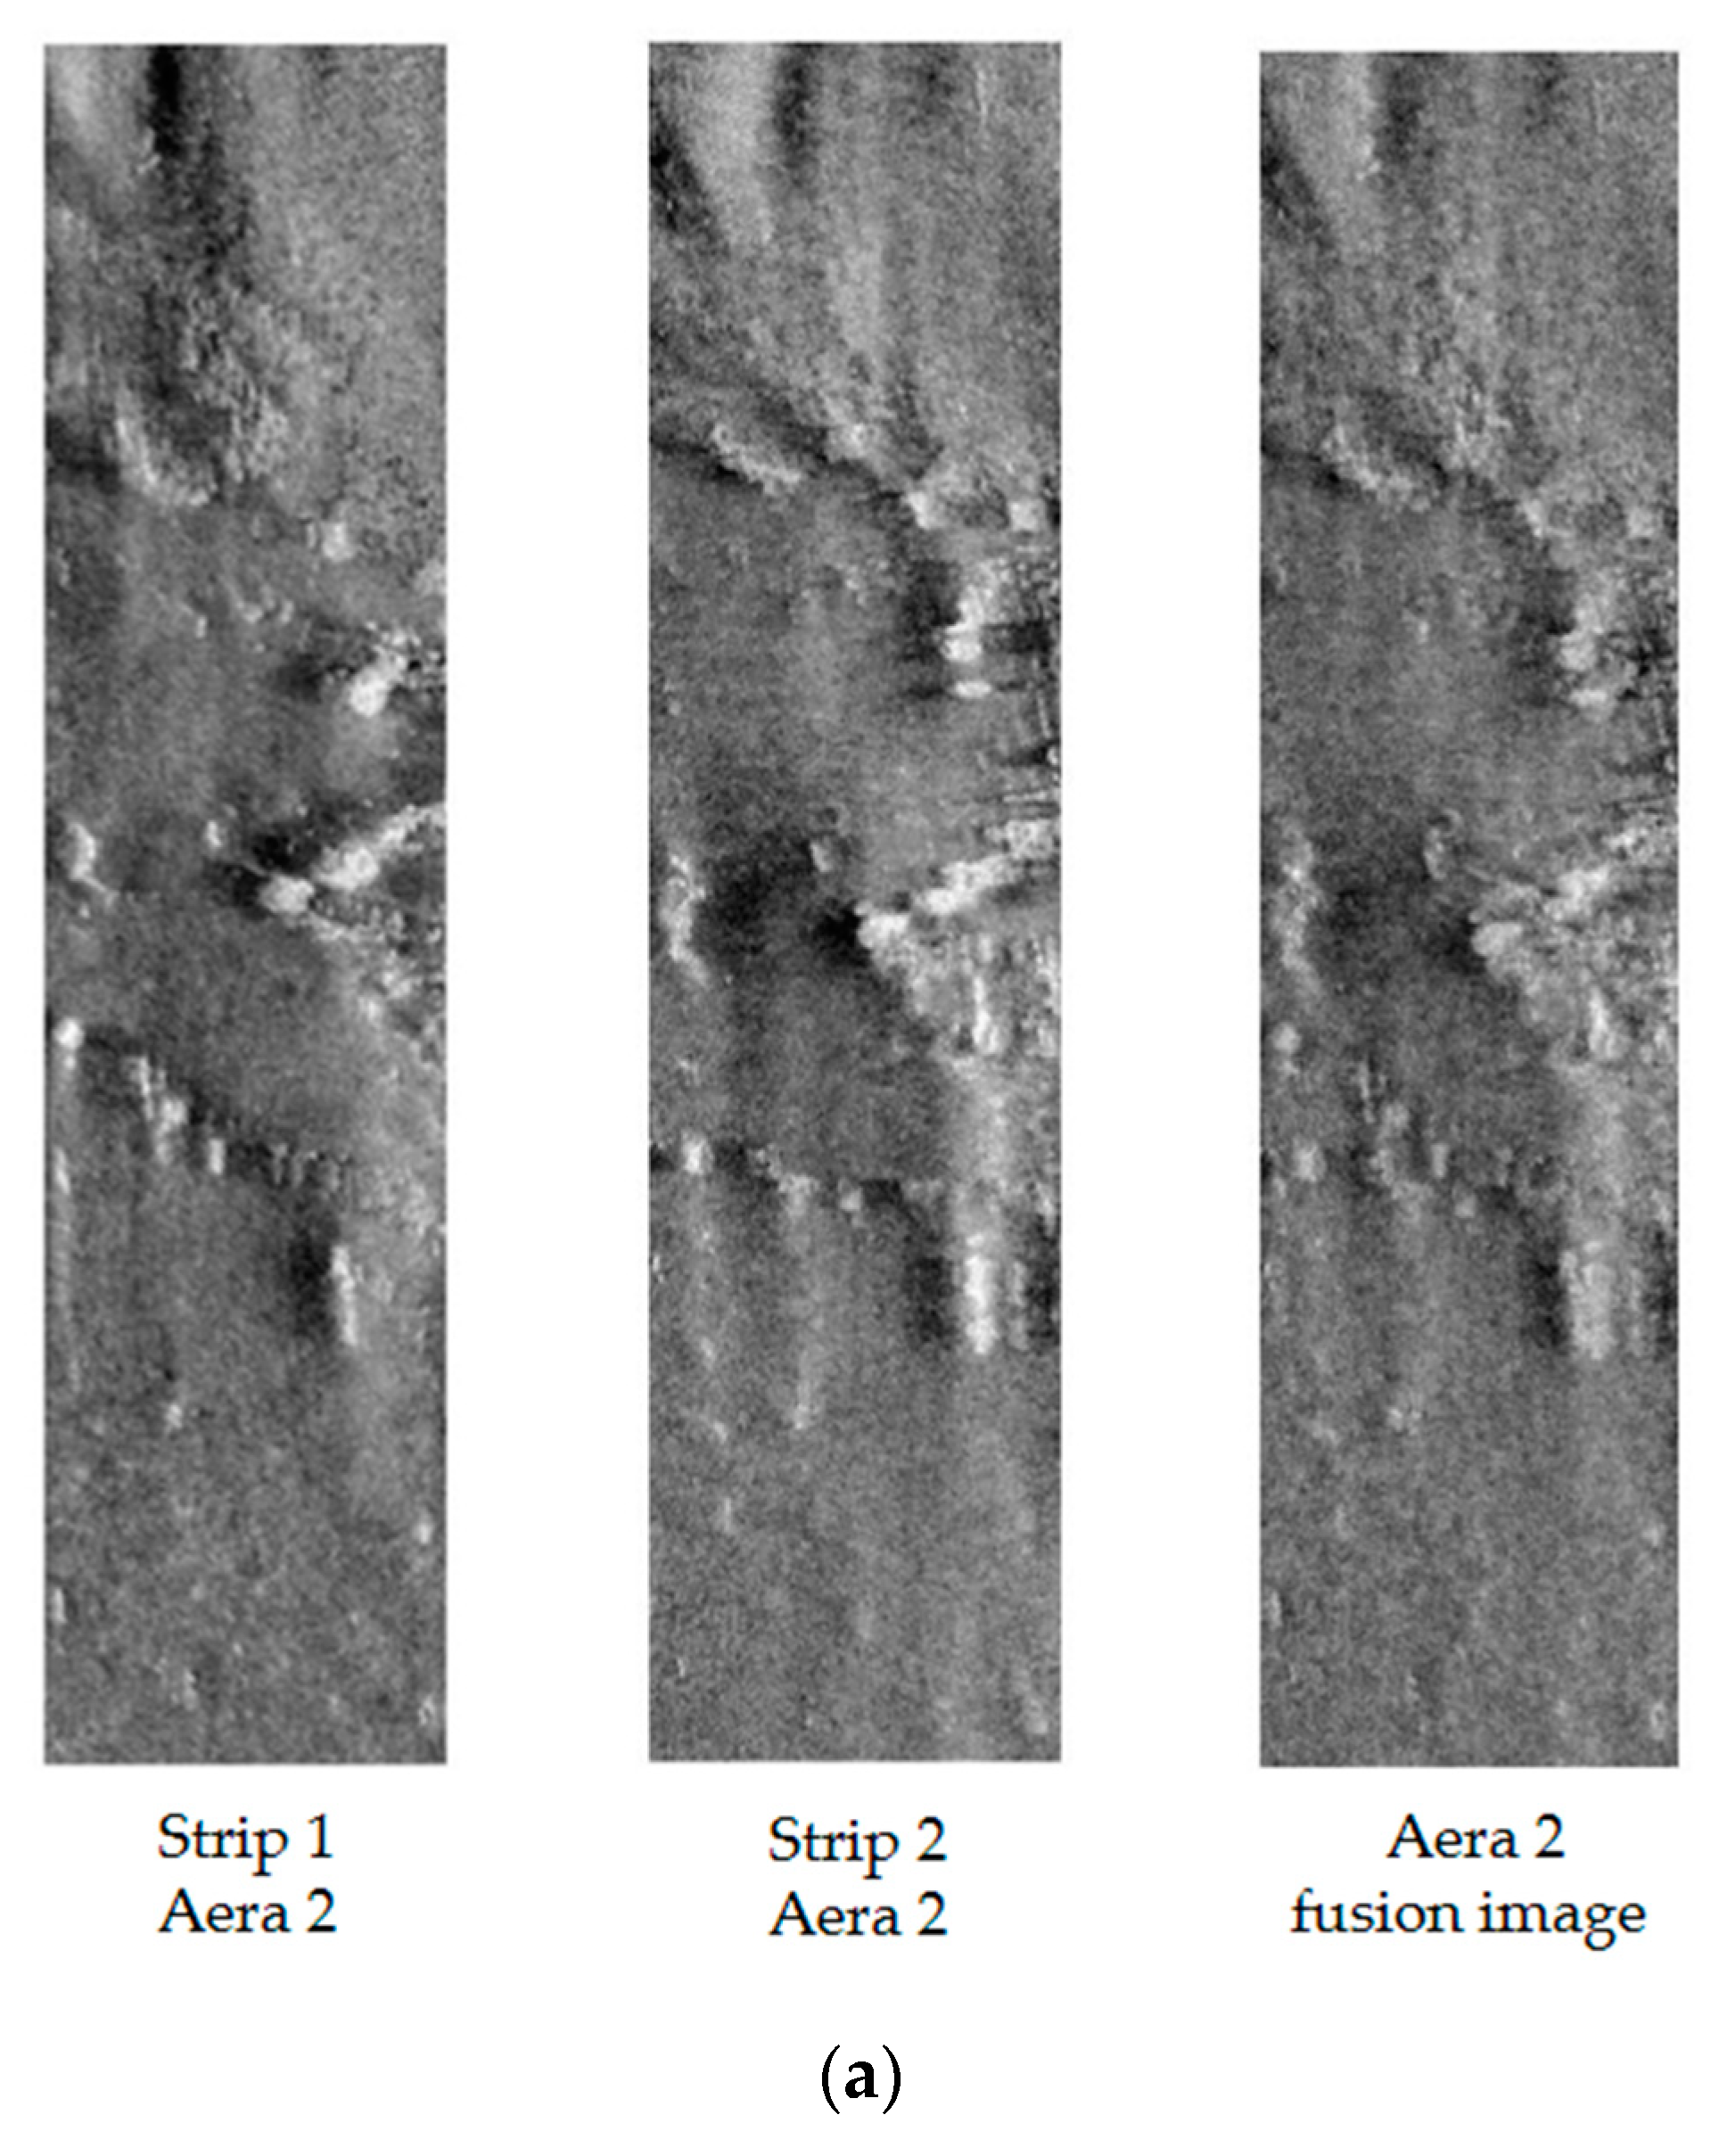
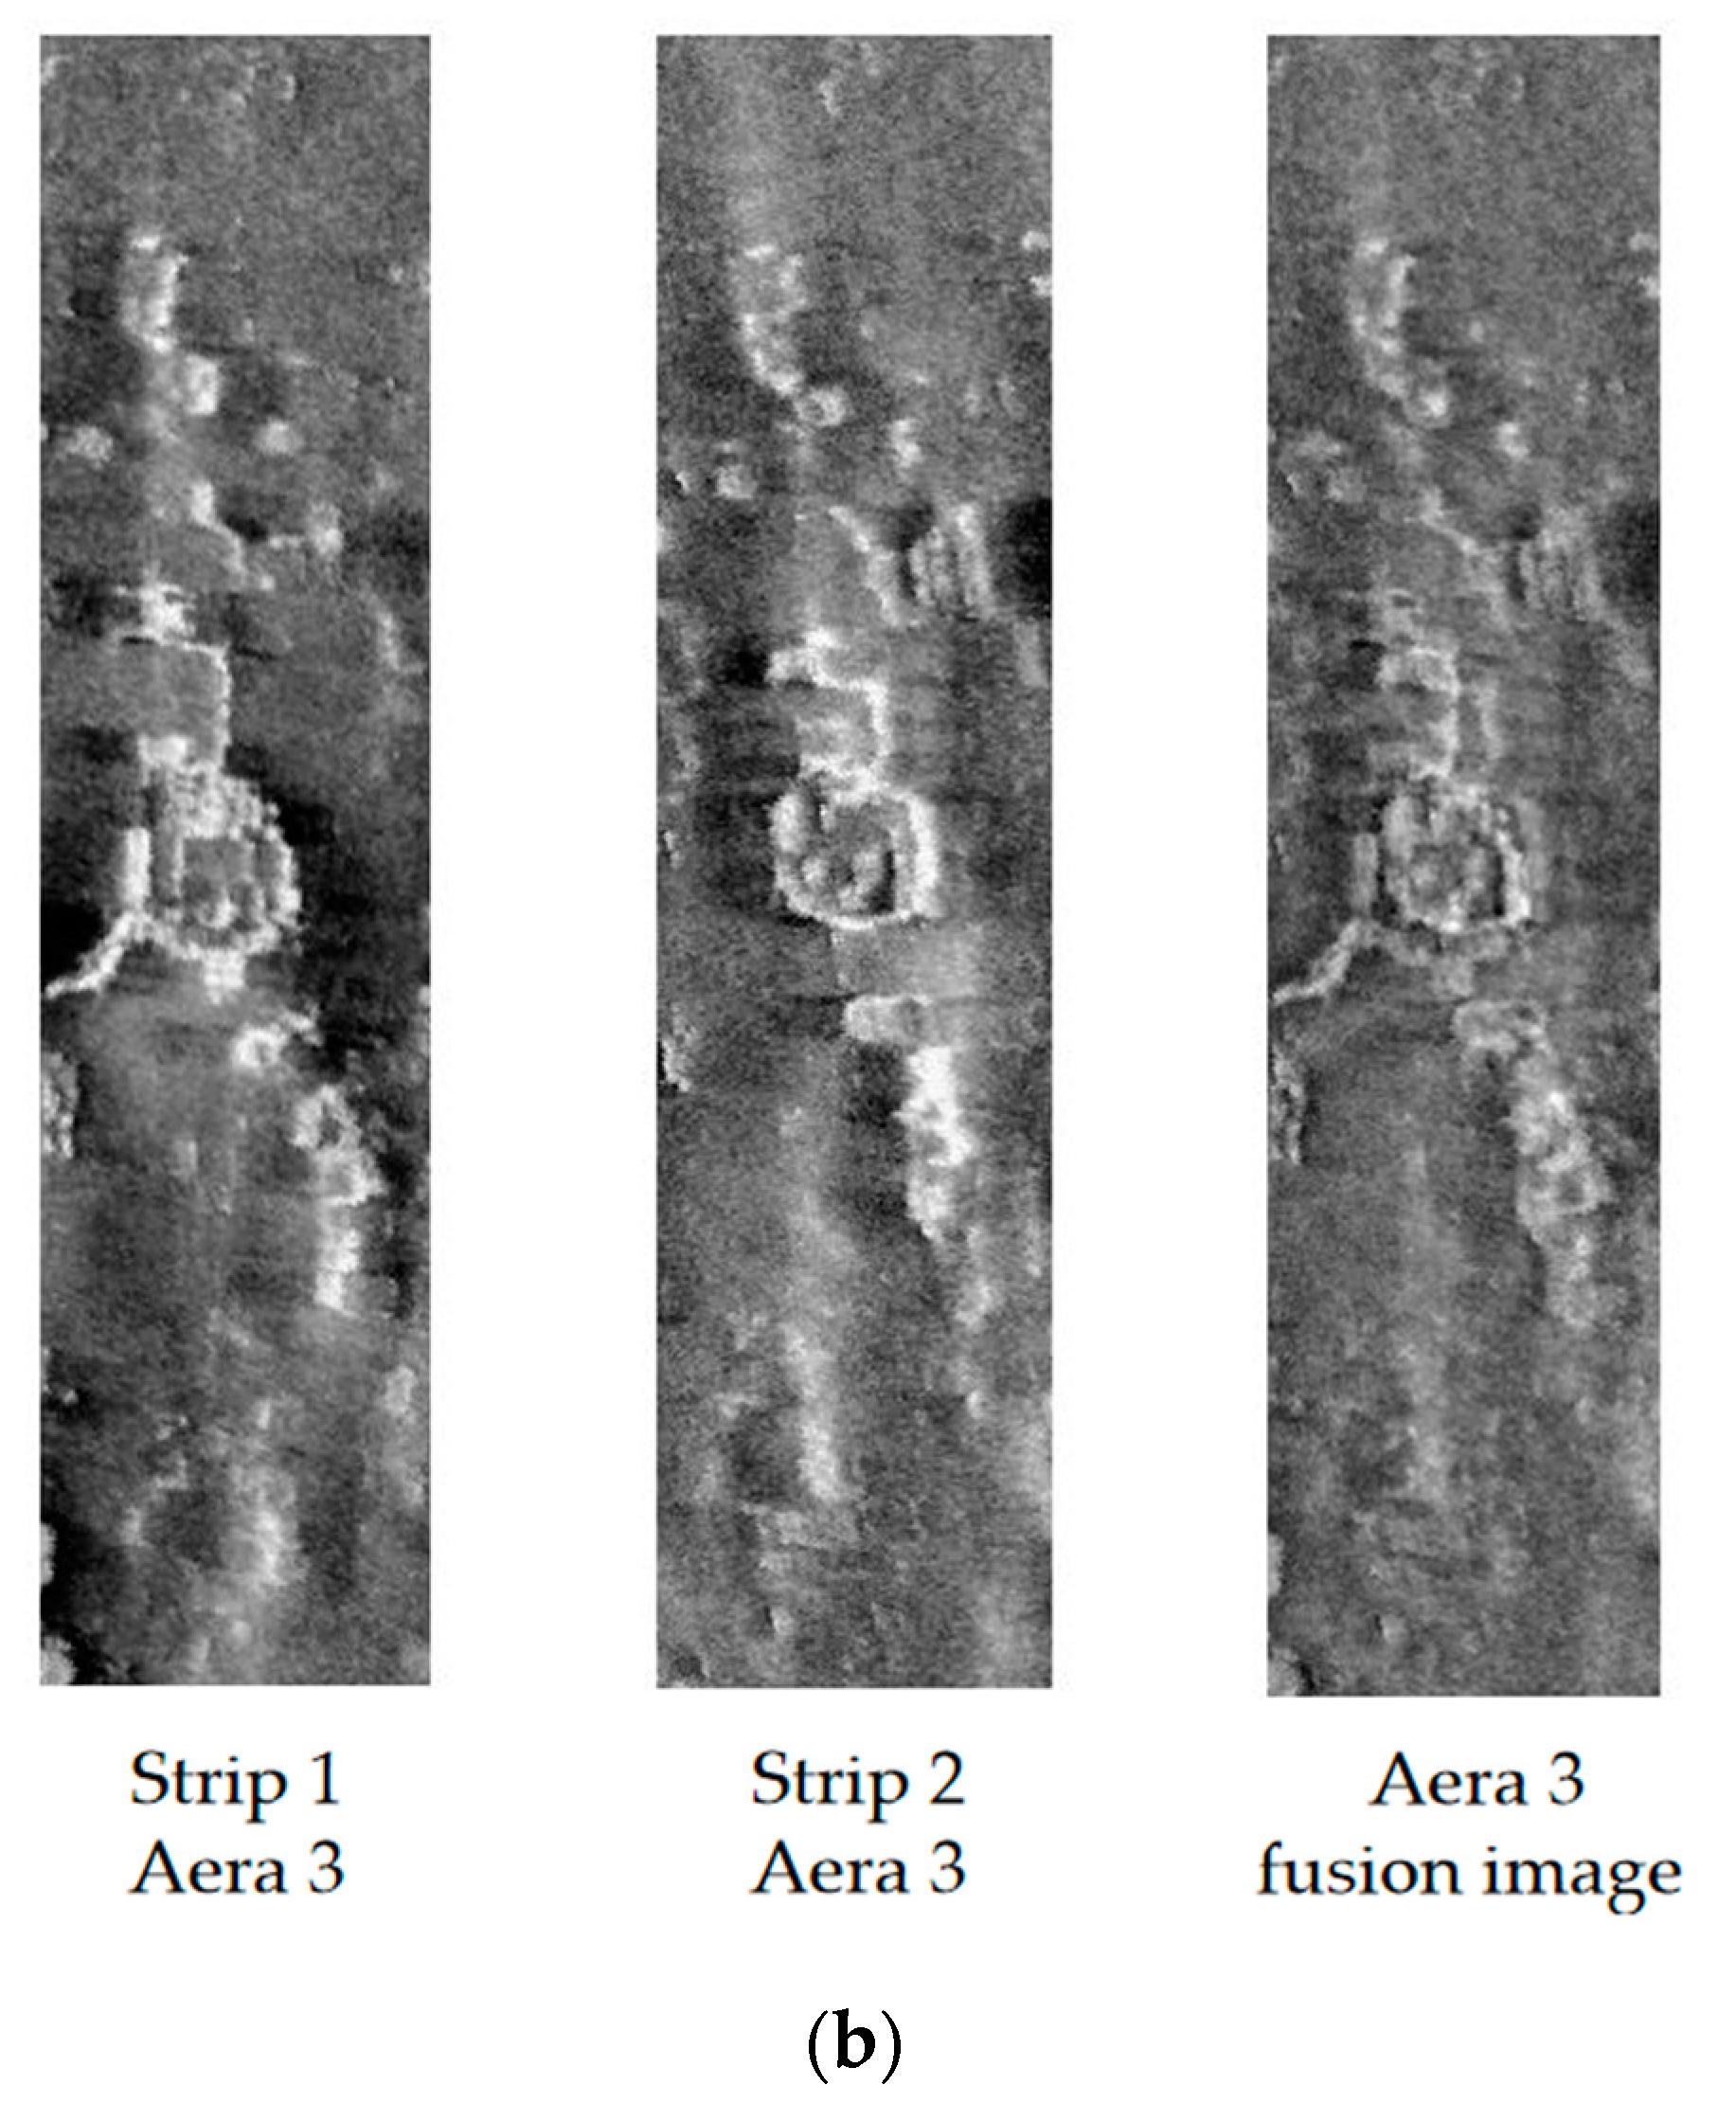
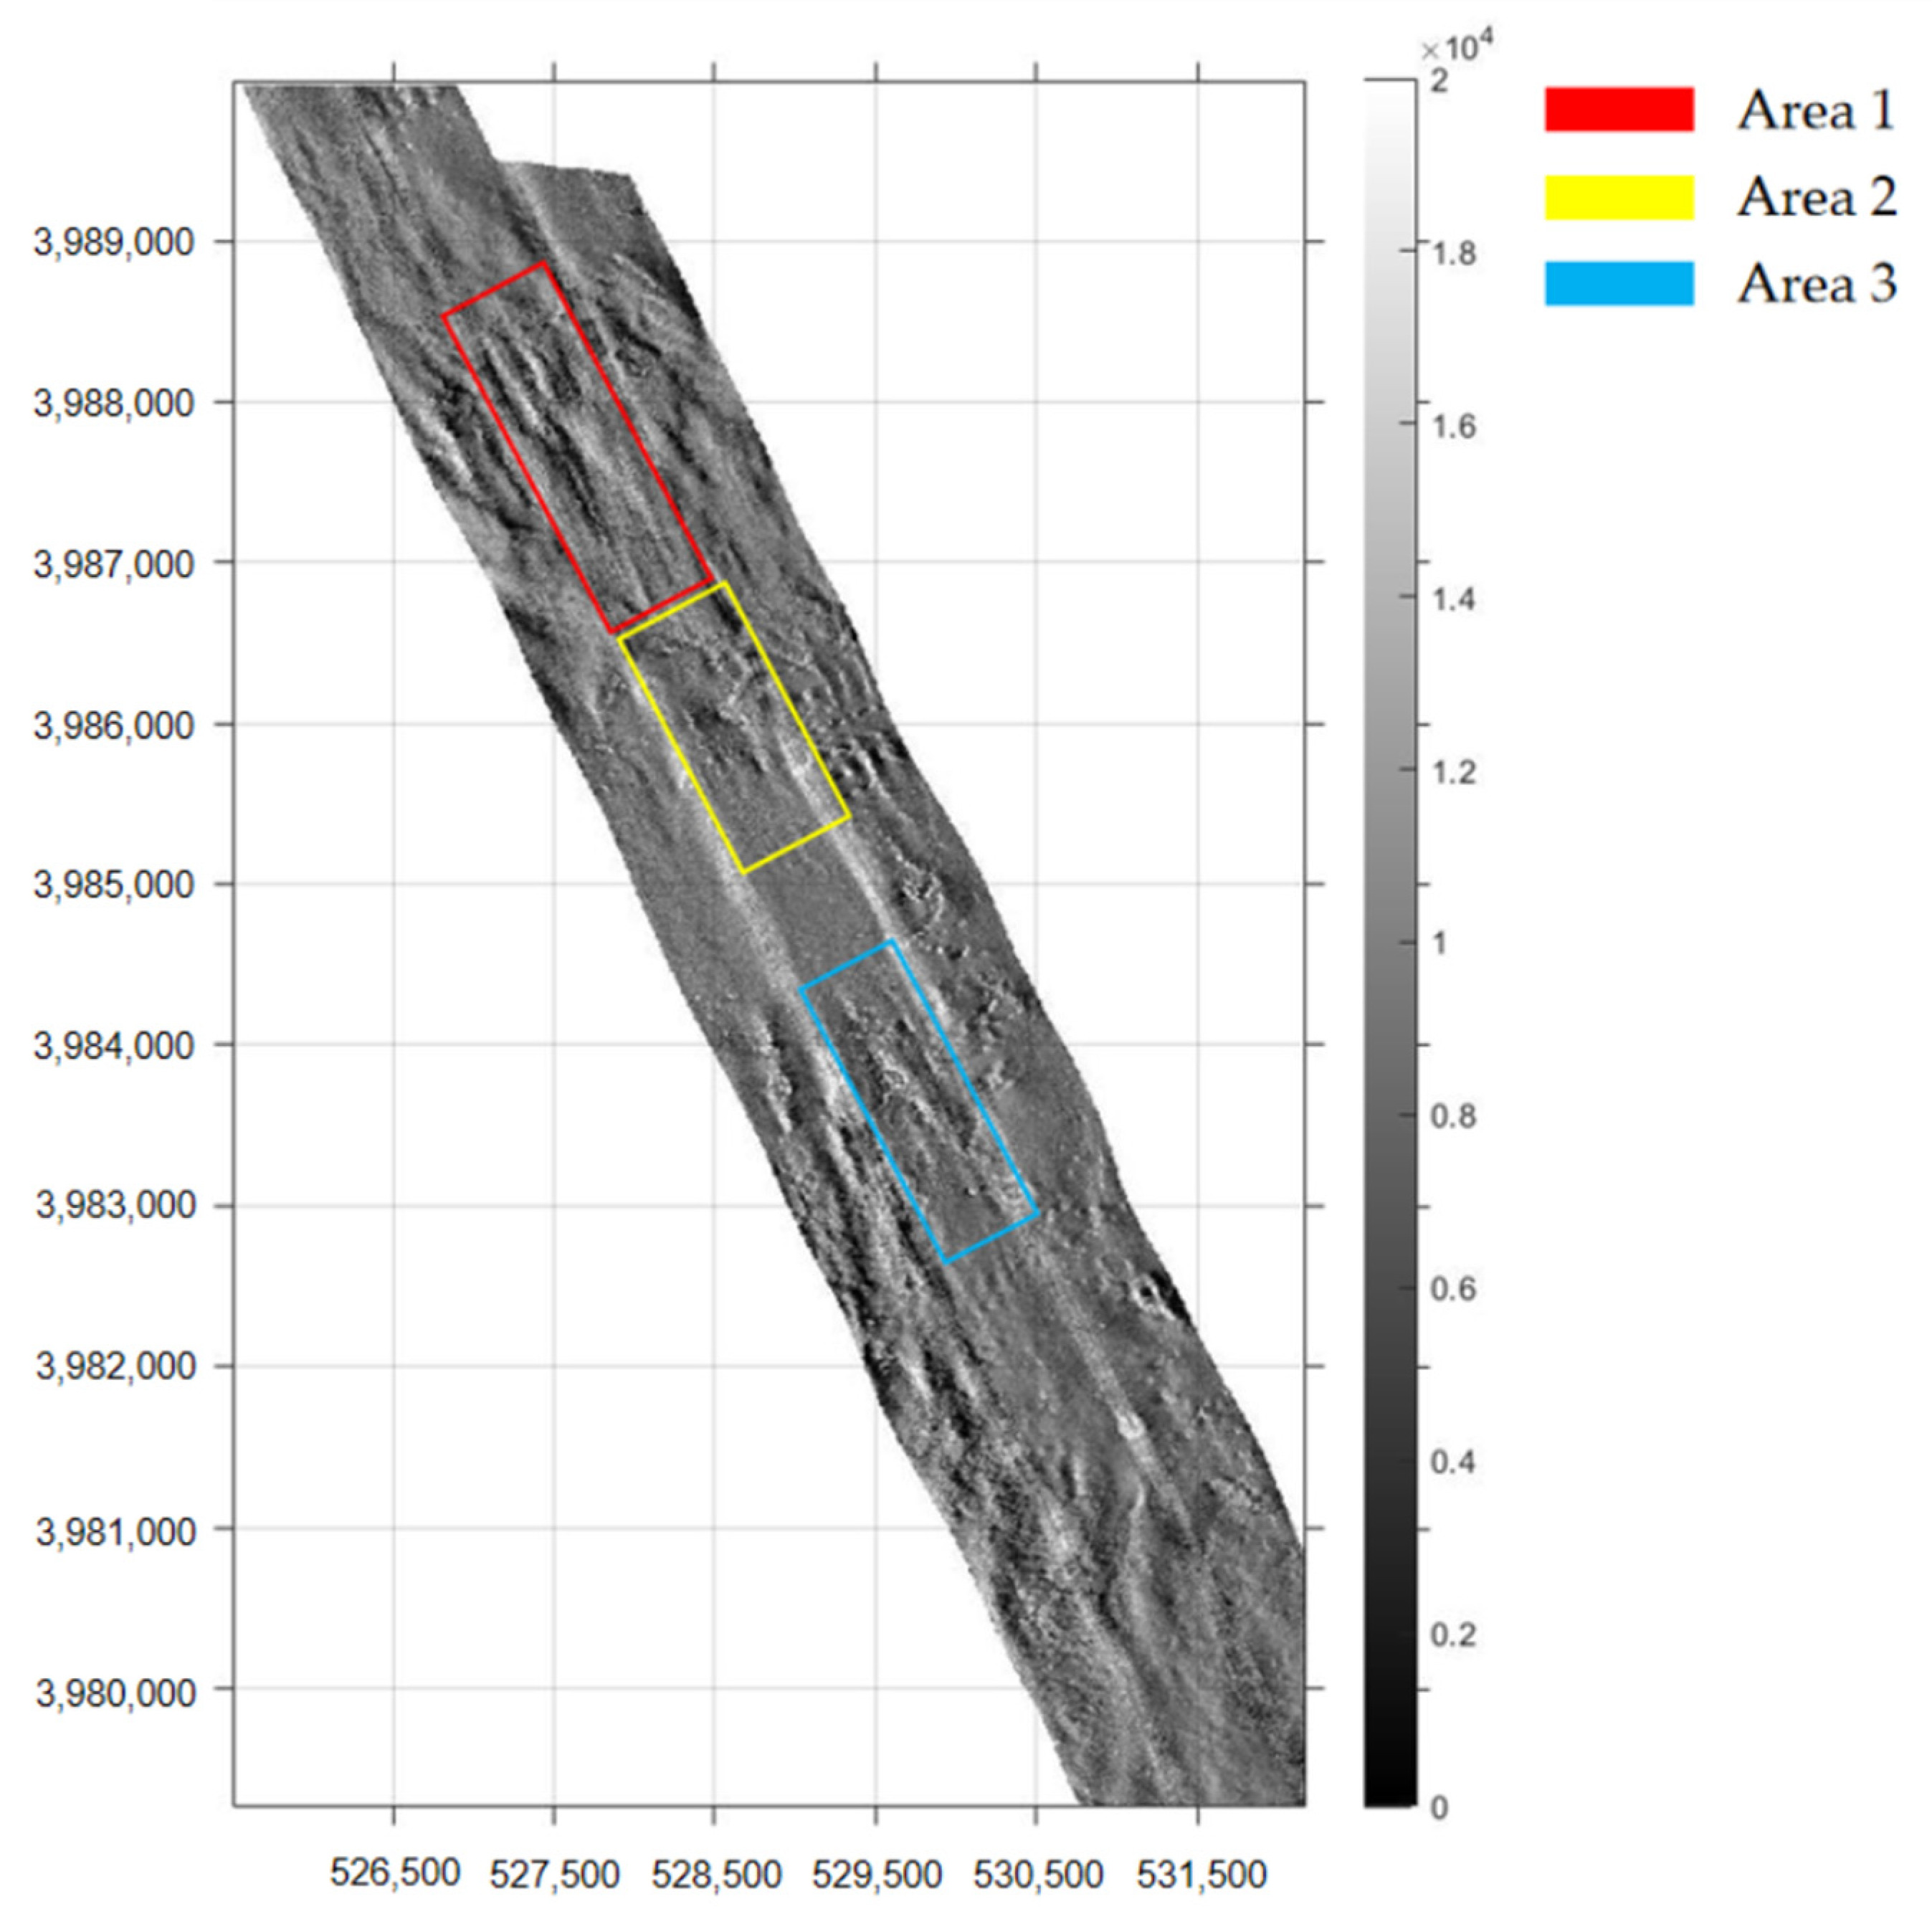
4. Experiment and Results
5. Conclusions
Author Contributions
Funding
Institutional Review Board Statement
Informed Consent Statement
Data Availability Statement
Conflicts of Interest
References
- Philippe, B. The Handbook of Sidescan Sonar; Springer: Berlin/Heidelberg, Germany; New York, NY, USA, 2009; ISBN 978-3-540-42641-7. [Google Scholar]
- Fakiris, E.; Papatheodorou, G.; Geraga, M.; Ferentinos, G. An Automatic Target Detection Algorithm for Swath Sonar Backscatter Imagery, Using Image Texture and Independent Component Analysis. Remote Sens. 2016, 8, 373. [Google Scholar] [CrossRef] [Green Version]
- Wang, X.; Zhao, J.; Zhu, B.; Jiang, T.; Qin, T. A Side Scan Sonar Image Target Detection Algorithm Based on a Neutrosophic Set and Diffusion Maps. Remote Sens. 2018, 10, 295. [Google Scholar] [CrossRef] [Green Version]
- Cervenka, P.; Moustier, C.D. Sidescan sonar image processing techniques. IEEE J. Ocean. Eng. 1993, 18, 108–122. [Google Scholar] [CrossRef] [Green Version]
- Chavez, P.S.C., Jr.; Isbrecht, J.A.; Galanis, P.; Gabel, G.L.; Sides, S.C.; Soltesz, D.L.; Ross, S.L.; Velasco, M.G. Processing, mosaicking and management of the monterey bay digital sidescan-sonar images. Mar. Geol. 2002, 181, 305–315. [Google Scholar] [CrossRef]
- Wang, A. Research on 3D Seafloor Terrian Recovery from the Side Scan Sonar Image; Wuhan University: Wuhan, China, 2014. [Google Scholar]
- Cervenka, P.; Moustier, C.; Lonsdale, P. Geometric corrections on sidescan sonar images based on bathymetry: Application with SeaMARC II and Sea Beam data. Mar. Geophys. Res. 1995, 17, 217–219. [Google Scholar] [CrossRef] [Green Version]
- Cervenka, P.; Moustier, C. Postprocessing and corrections of bathymetry derived from sidescan sonar systems: Application with SeaMARC II. IEEE J. Ocean. Eng. 1994, 19, 619–629. [Google Scholar] [CrossRef]
- Daniel, S.; FL, L.; Roux, C. Side-scan sonar image matching. IEEE J. Ocean. Eng. 1998, 23, 245–259. [Google Scholar] [CrossRef]
- Thisen, E.; Sorensen, H.B.; Stage, B. Sidescan Sonar Image Matching Using Cross Correlation; International Society for Optics and Photonics: Bellingham, WA, USA, 2003; Volume 5089. [Google Scholar]
- Vandrish, P.; Vardy, A.; Walker, D. Side-scan sonar image registration for AUV navigation. In Proceedings of the 2011 IEEE Symposium on Underwater Technology and Workshop on Scientific Use of Submarine Cables and Related Technologies, Tokyo, Japan, 5–8 April 2011; IEEE: Piscataway, NJ, USA, 2011. [Google Scholar]
- Chailloux, C.; Le Caillec, J.M.; Gueriot, D.; Zerr, B. Intensity-Based Block Matching Algorithm for Mosaicing Sonar Images. IEEE J. Ocean. Eng. 2011, 36, 627–645. [Google Scholar] [CrossRef]
- Wang, A.; Zhao, J.; Guo, J.; Wang, X. Elastic Mosaic Method in Block for Side-Scan Sonar Image Based on Speeded-Up Robust Features. J. Wuhan Univ. Inf. Sci. Ed. 2018, 43, 697–703. [Google Scholar]
- Cao, M.; Guo, J. Research on Side Scan Sonar Stripe Image Mosaic Method Based on Common Vision Target. Geomat. Spat. Inf. Technol. 2014, 46–49, 52. [Google Scholar]
- Zhao, J.; Wang, A.; Wang, X. Research on Segment Mosaic Method of Side Scan Sonar Stripe Image. Geomat. Inf. Sci. Wuhan Univ. 2013, 9, 29–33. [Google Scholar]
- Zhao, J.; Shang, X.; Zhang, H. Side-Scan Sonar Image Mosaic Using Couple Feature Points with Constraint of Track Line Positions. Remote Sens. 2018, 10, 953. [Google Scholar] [CrossRef] [Green Version]
- He, F.; Wu, M.; Long, R.; Chen, Z. Accurate Mosaic of side scan sonar image based on SURF feature. Chin. J. Ocean. Technol. 2020, 39, 35–41. [Google Scholar]
- Dharmishtha, P.; Jaliya, U.; Vasava, H. A review: No-reference/blind image quality assessment. Int. Res. J. Eng. Technol. 2017, 4, 339–343. [Google Scholar]
- Yang, X.; Li, F.; Liu, H. A survey of DNN methods for blind image quality assessment. IEEE Access 2019, 7, 123788–123806. [Google Scholar] [CrossRef]
- Wang, Z. Review of no-reference image quality assessment. Acta Autom. Sin. 2015, 41, 1062–1079. [Google Scholar]
- Chern, N.N.K.; Neow, P.A.; Ang, M.H. Practical issues in pixel-based autofocusing for machine vision. In Proceedings of the 2001 ICRA. IEEE International Conference on Robotics and Automation (Cat. No. 01CH37164), Seoul, Korea, 21–26 May 2001; IEEE: Piscataway, NJ, USA, 2001; pp. 2791–2796. [Google Scholar]
- Subbarao, M.; Tyan, J. Selecting the optimal focus measure for autofocusing and depth-from-focus. IEEE Trans. Pattern Anal. Mach. Intell. 1998, 20, 864–870. [Google Scholar] [CrossRef] [Green Version]
- Krotkov, E.P. Active Computer Vision by Cooperative Focus and Stereo; Springer: New York, NY, USA, 1989; pp. 1–17. ISBN 9781461396659. [Google Scholar]
- Chetouani, A.; Beghdadi, A.; Deriche, M. A new reference-free image quality index for blur estimation in the frequency domain. In Proceedings of the 2009 IEEE International Symposium on Signal Processing and Information Technology (ISSPIT), Ajman, United Arab Emirates, 14–17 December 2009; IEEE: Piscataway, NJ, USA, 2009; pp. 155–159. [Google Scholar]
- Vu, C.; Phan, T.; Chandler, D. S3: A spectral and spatial measure of local perceived sharpness in natural images. IEEE Trans. Image Process. 2012, 21, 934–945. [Google Scholar] [CrossRef]
- Lu, Y.; Zhang, T.; Zheng, J.; LI, M.; Zhang, C. No-reference blurring image quality assessment based on local standard deviation and saliency map. J. Jilin Univ. Eng. Technol. Ed. 2016, 46, 1337–1343. [Google Scholar]
- Li, Z. Study on Large-Scale Image Registration Algorithm in Fourier Transform Domain; Nanjing University of Information Science & Technology: Nanjing, China, 2013. [Google Scholar]
- Marichal, X.; Ma, W.; Zhang, H. Blur determination in the compressed domain using DCT information. In Proceedings of the 1999 International Conference on Image Processing (Cat. 99CH36348), Kobe, Japan, 24–28 October 1999; IEEE: Piscataway, NJ, USA, 1999; pp. 386–390. [Google Scholar]
- Caviedes, J.; Oberti, F. A new sharpness metric based on local kurtosis, edge and energy information. Signal Process. Image Commun. 2004, 19, 147–161. [Google Scholar] [CrossRef]
- Zhu, Z.; Li, S.; Chen, H. Research on Automatic Focusing Function Based on Image Entropy. Opt. Precis. Eng. 2004, 5, 537–542. [Google Scholar]
- Wang, C.; Cui, L.; Yan, B. Research on the evaluation algorithm of microscopic image sharpness based on Variance-Brenner function. Equip. Manuf. Technol. 2020, 10, 78–82. [Google Scholar]
- Xu, J. Research on Key Technologies of Side-Scan Sonar Image Mosaic and Segmentation; East China University of Technology: Fuzhou, China, 2017. [Google Scholar]
- Candes, E. Curvelets—A Surprisingly Effective Nonadaptive Representation for Objects with Edges. 2020. Available online: http://citeseerx.ist.psu.edu/viewdoc/summary;jsessionid=0B25E5104FB2CB688F212E84E4F2BD75?doi=10.1.1.161.9294 (accessed on 1 September 2021).
- Chen, Z. Curving Transform and Information Extraction Application of Potential Field Data; China University of Geosciences: Beijing, China, 2012. [Google Scholar]
- Vijayalakshmi, G.; Shanthakumar, M.; Muthukumar, K. A Contrast Adjusted Wavelet and Curvelet Transform Based Fusion of Breast Images. IOP Conf. Ser. Mater. Sci. Eng. 2020, 994, 012027. [Google Scholar] [CrossRef]
- Tian, Y.; Zhang, H.; Ma, X. An Image Fusion Method Based on Curvelet Transform and Guided Filter Enhancement. Math. Probl. Eng. 2020, 2020, 9821715. [Google Scholar] [CrossRef]
- Jia, X. Research on Face Recognition Algorithm Based on Curvwave Transform; Harbin Engineering University: Harbin, China, 2011. [Google Scholar]
- Li, Z.; Li, X.; Ma, L. Research on Definition Assessment based on No-reference Digital Image Quality. Remote. Sens. Technol. Appl. 2011, 26, 239–246. [Google Scholar]
- Xie, X.; Zhou, J.; Wu, Q. A Nonreference Quality Evaluation Index for Image Blur. Comput. Appl. 2010, 4, 921–924. [Google Scholar]
- Gao, F.; Wang, X.; Yang, J.; Zhang, B.; Zhou, H.; Chen, J. Research on Multi-strip Side Scan Sonar Image Fine Mosaic Method. Sci. Technol. Innov. Appl. 2021, 5, 1–4. [Google Scholar]


| Layer | Scale Coefficient | Number of Directions | Matrix Dimensions |
|---|---|---|---|
| Coarse | 1 | ||
| Detail | 16 | ||
| 32 | |||
| 32 | |||
| Fine | 1 |
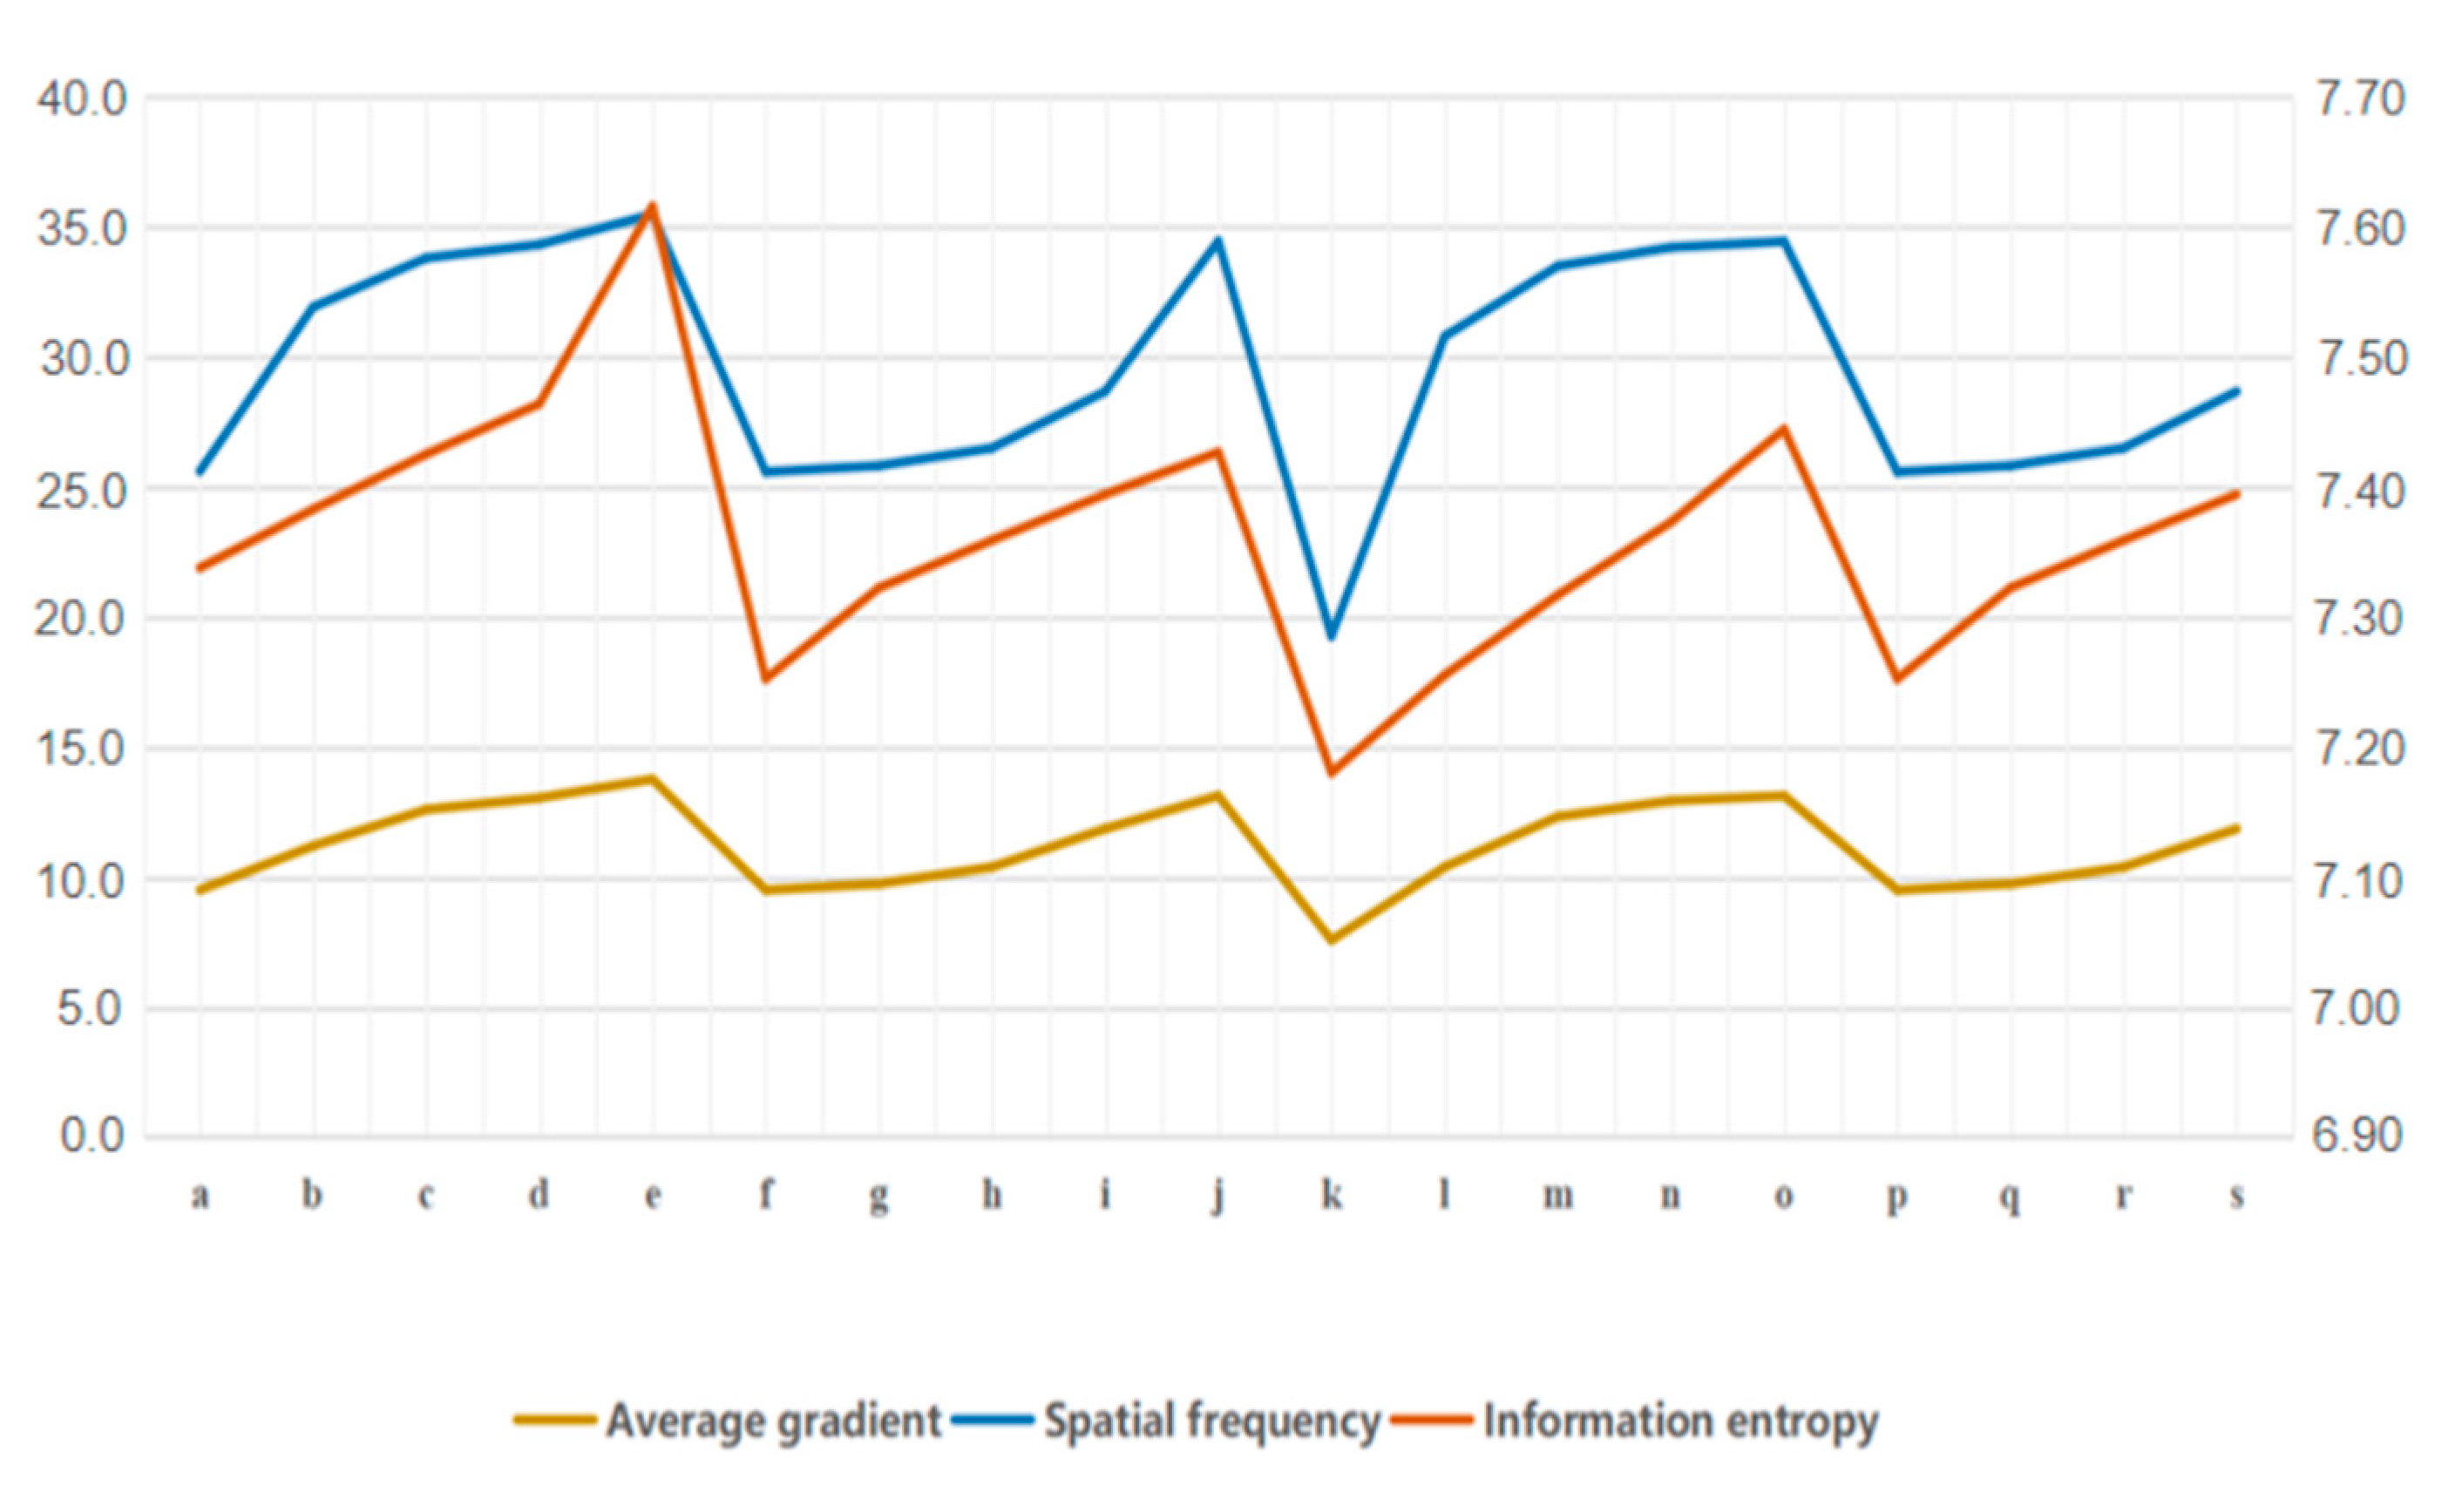
| Case | Information Entropy | Average Gradient | Spatial Frequency |
|---|---|---|---|
| a | 7.3376 | 9.4983 | 25.5944 |
| b | 7.3826 | 11.1938 | 31.9010 |
| c | 7.4250 | 12.5927 | 33.7882 |
| d | 7.4637 | 13.0406 | 34.3080 |
| e 1 | 7.6156 | 13.7586 | 35.4629 |
| f | 7.2523 | 9.4976 | 25.5687 |
| g | 7.3222 | 9.7393 | 25.8062 |
| h | 7.3588 | 10.3818 | 26.4863 |
| i | 7.3941 | 11.8541 | 28.6577 |
| j | 7.4265 | 13.1232 | 34.4313 |
| k | 7.1802 | 7.5718 | 19.2626 |
| l | 7.2552 | 10.3865 | 30.7766 |
| m | 7.3167 | 12.3194 | 33.4798 |
| n | 7.3728 | 12.9310 | 34.1983 |
| o | 7.4441 | 13.1217 | 34.4303 |
| p | 7.2523 | 9.4976 | 25.5687 |
| q | 7.3222 | 9.7393 | 25.8062 |
| r | 7.3588 | 10.3818 | 26.4863 |
| s | 7.3941 | 11.8541 | 28.6577 |
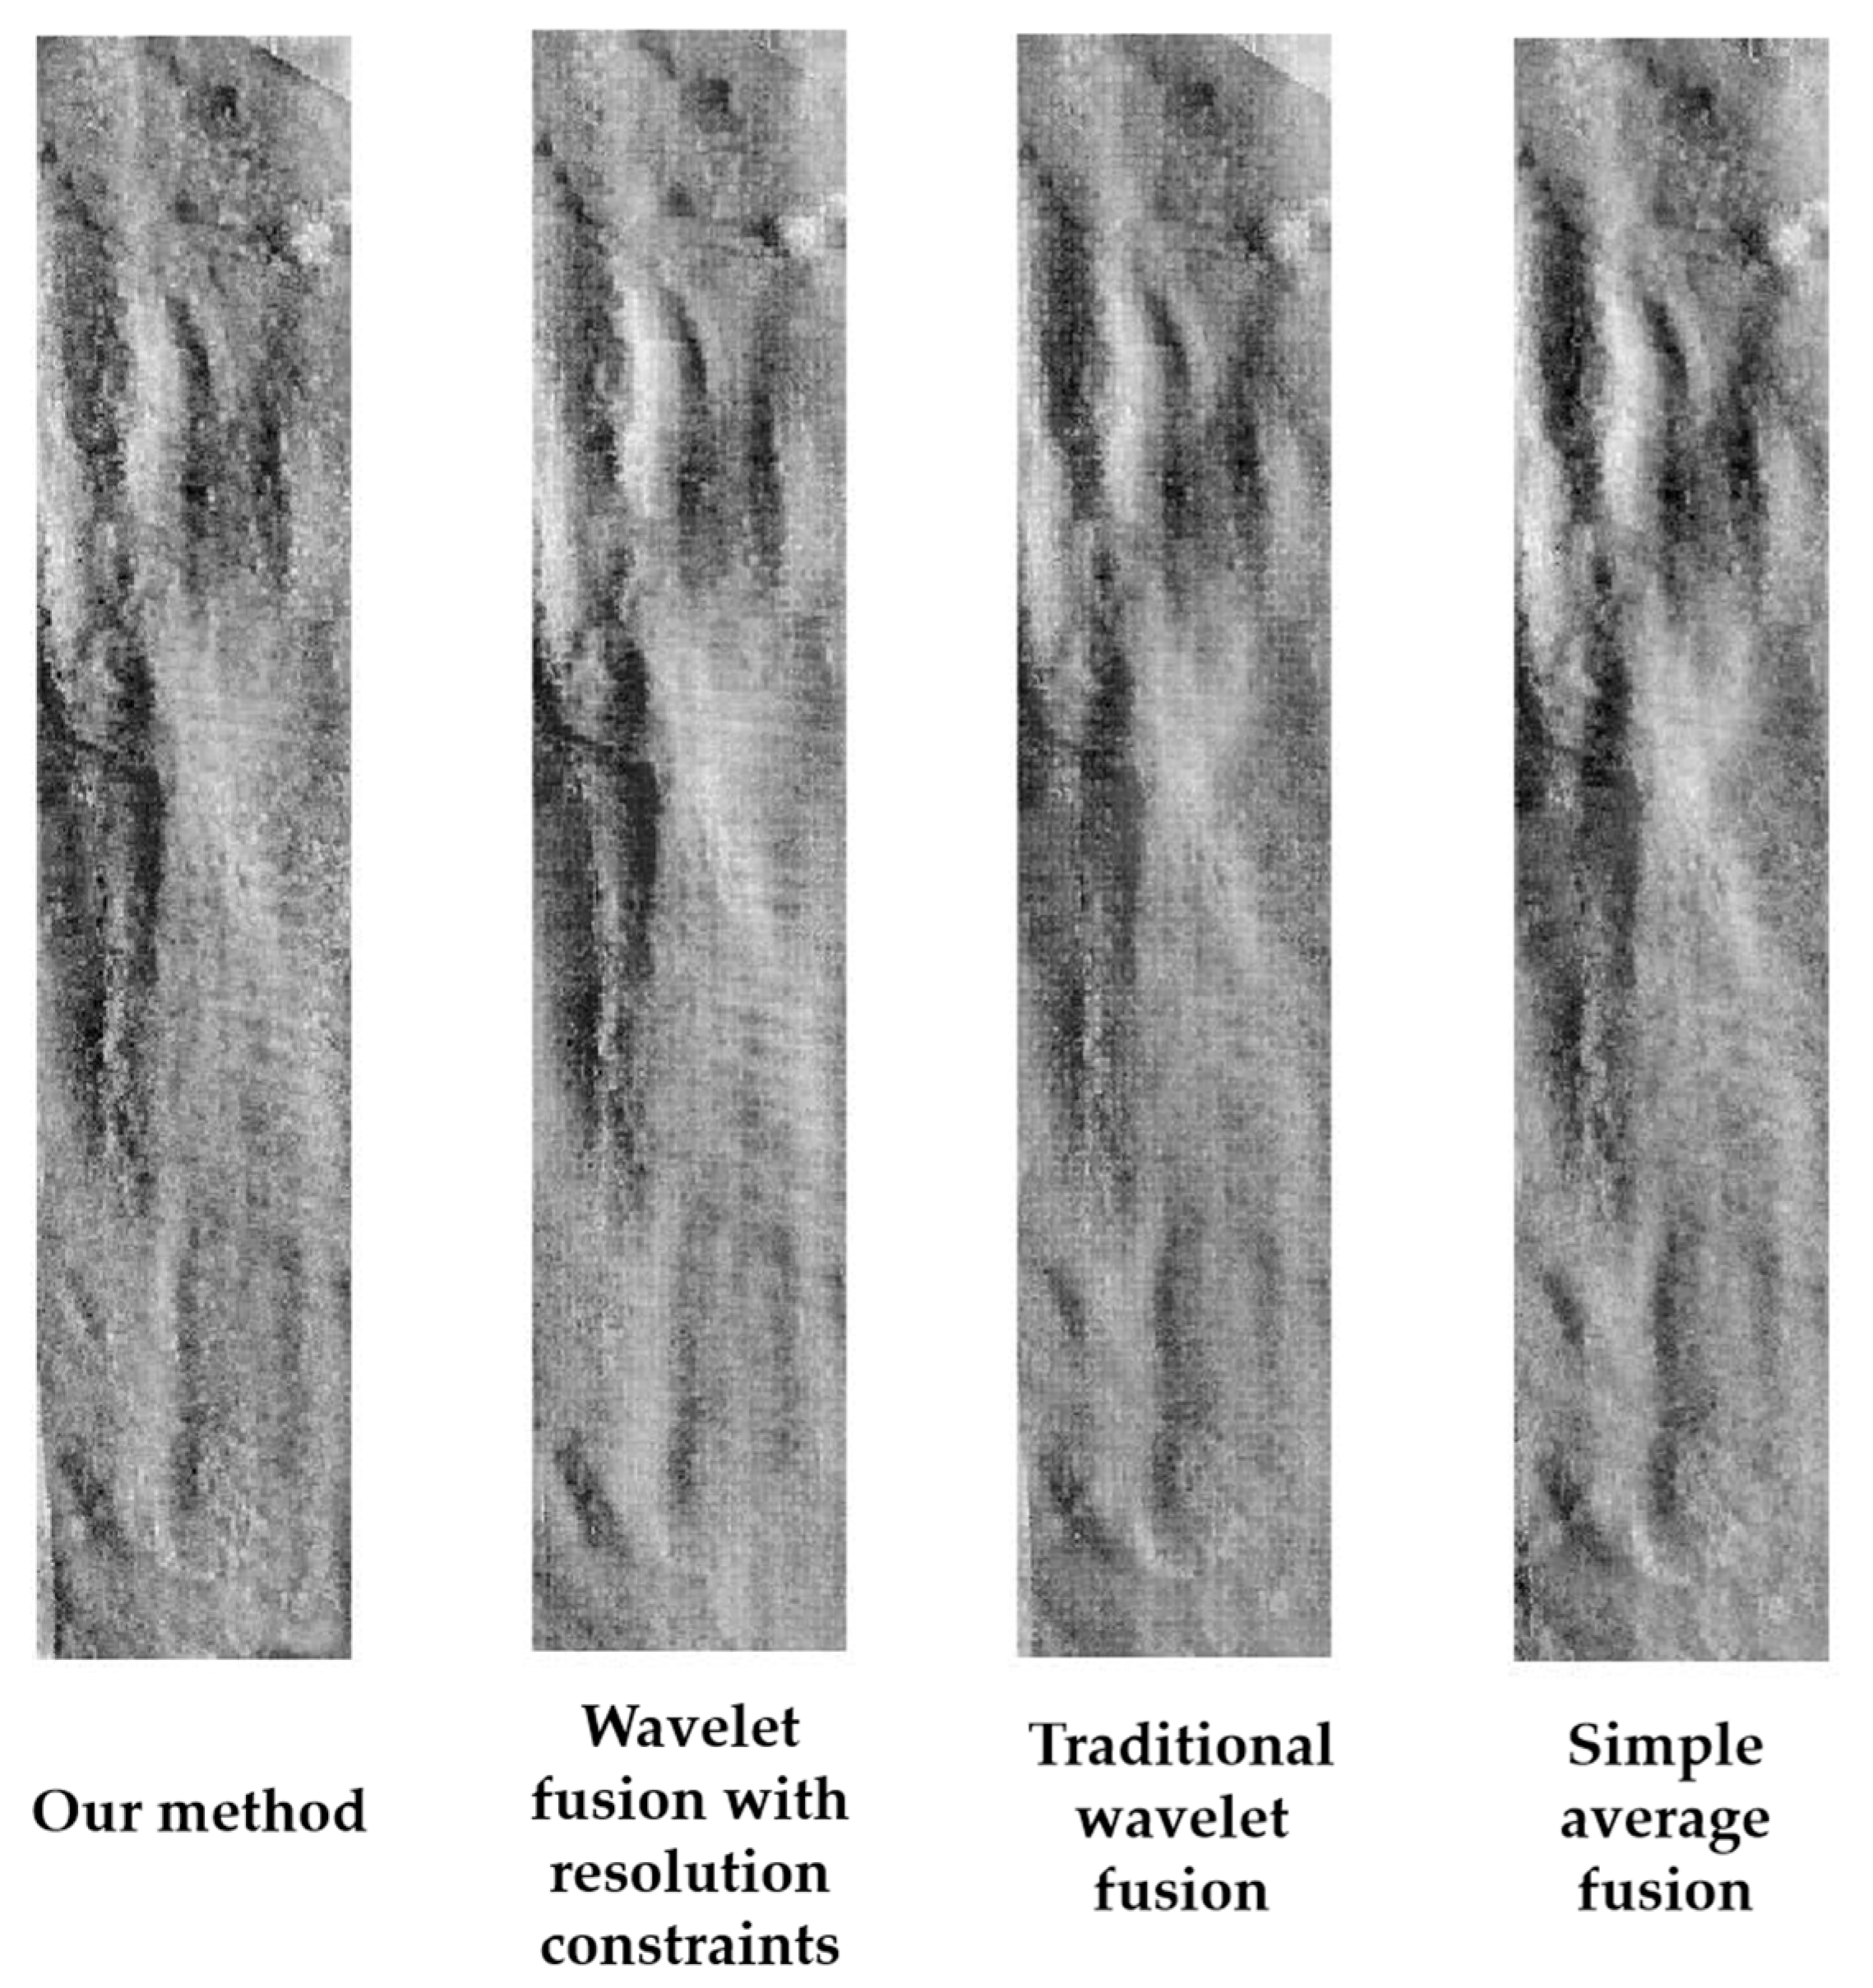
| Algorithms | Information Entropy | Average Gradient | Spatial Frequency |
|---|---|---|---|
| Our method | 7.6156 | 13.7586 | 35.4629 |
| Wavelet fusion with resolution constraints | 7.3569 | 9.0872 | 28.6397 |
| Traditional wavelet fusion | 7.2260 | 8.2050 | 26.8381 |
| Simple average | 7.1584 | 7.6452 | 19.5543 |
| Ratio | Fusion Algorithms | Information Entropy | Average Gradient | Spatial Frequency | |
|---|---|---|---|---|---|
| Area 2 | 0.1428 | Our method | 7.1318 | 11.7527 | 30.4386 |
| Wavelet fusion with resolution constraints | 6.9388 | 8.2569 | 25.4472 | ||
| Traditional wavelet fusion | 6.7614 | 7.3451 | 23.7968 | ||
| Simple average | 6.6962 | 6.7457 | 17.0373 | ||
| Area 3 | 0.2857 | Our method | 7.2367 | 11.8425 | 30.1219 |
| Wavelet fusion with resolution constraints | 6.9619 | 7.8150 | 24.4447 | ||
| Traditional wavelet fusion | 6.9174 | 7.4510 | 23.7001 | ||
| Simple average | 6.8657 | 6.8585 | 16.9889 |
Publisher’s Note: MDPI stays neutral with regard to jurisdictional claims in published maps and institutional affiliations. |
© 2021 by the authors. Licensee MDPI, Basel, Switzerland. This article is an open access article distributed under the terms and conditions of the Creative Commons Attribution (CC BY) license (https://creativecommons.org/licenses/by/4.0/).
Share and Cite
Zhang, N.; Jin, S.; Bian, G.; Cui, Y.; Chi, L. A Mosaic Method for Side-Scan Sonar Strip Images Based on Curvelet Transform and Resolution Constraints. Sensors 2021, 21, 6044. https://doi.org/10.3390/s21186044
Zhang N, Jin S, Bian G, Cui Y, Chi L. A Mosaic Method for Side-Scan Sonar Strip Images Based on Curvelet Transform and Resolution Constraints. Sensors. 2021; 21(18):6044. https://doi.org/10.3390/s21186044
Chicago/Turabian StyleZhang, Ning, Shaohua Jin, Gang Bian, Yang Cui, and Liang Chi. 2021. "A Mosaic Method for Side-Scan Sonar Strip Images Based on Curvelet Transform and Resolution Constraints" Sensors 21, no. 18: 6044. https://doi.org/10.3390/s21186044
APA StyleZhang, N., Jin, S., Bian, G., Cui, Y., & Chi, L. (2021). A Mosaic Method for Side-Scan Sonar Strip Images Based on Curvelet Transform and Resolution Constraints. Sensors, 21(18), 6044. https://doi.org/10.3390/s21186044