
Laboratory Validation of Instrumented Mouthguard for Use in Sport


Abstract
1. Introduction
2. Materials and Methods
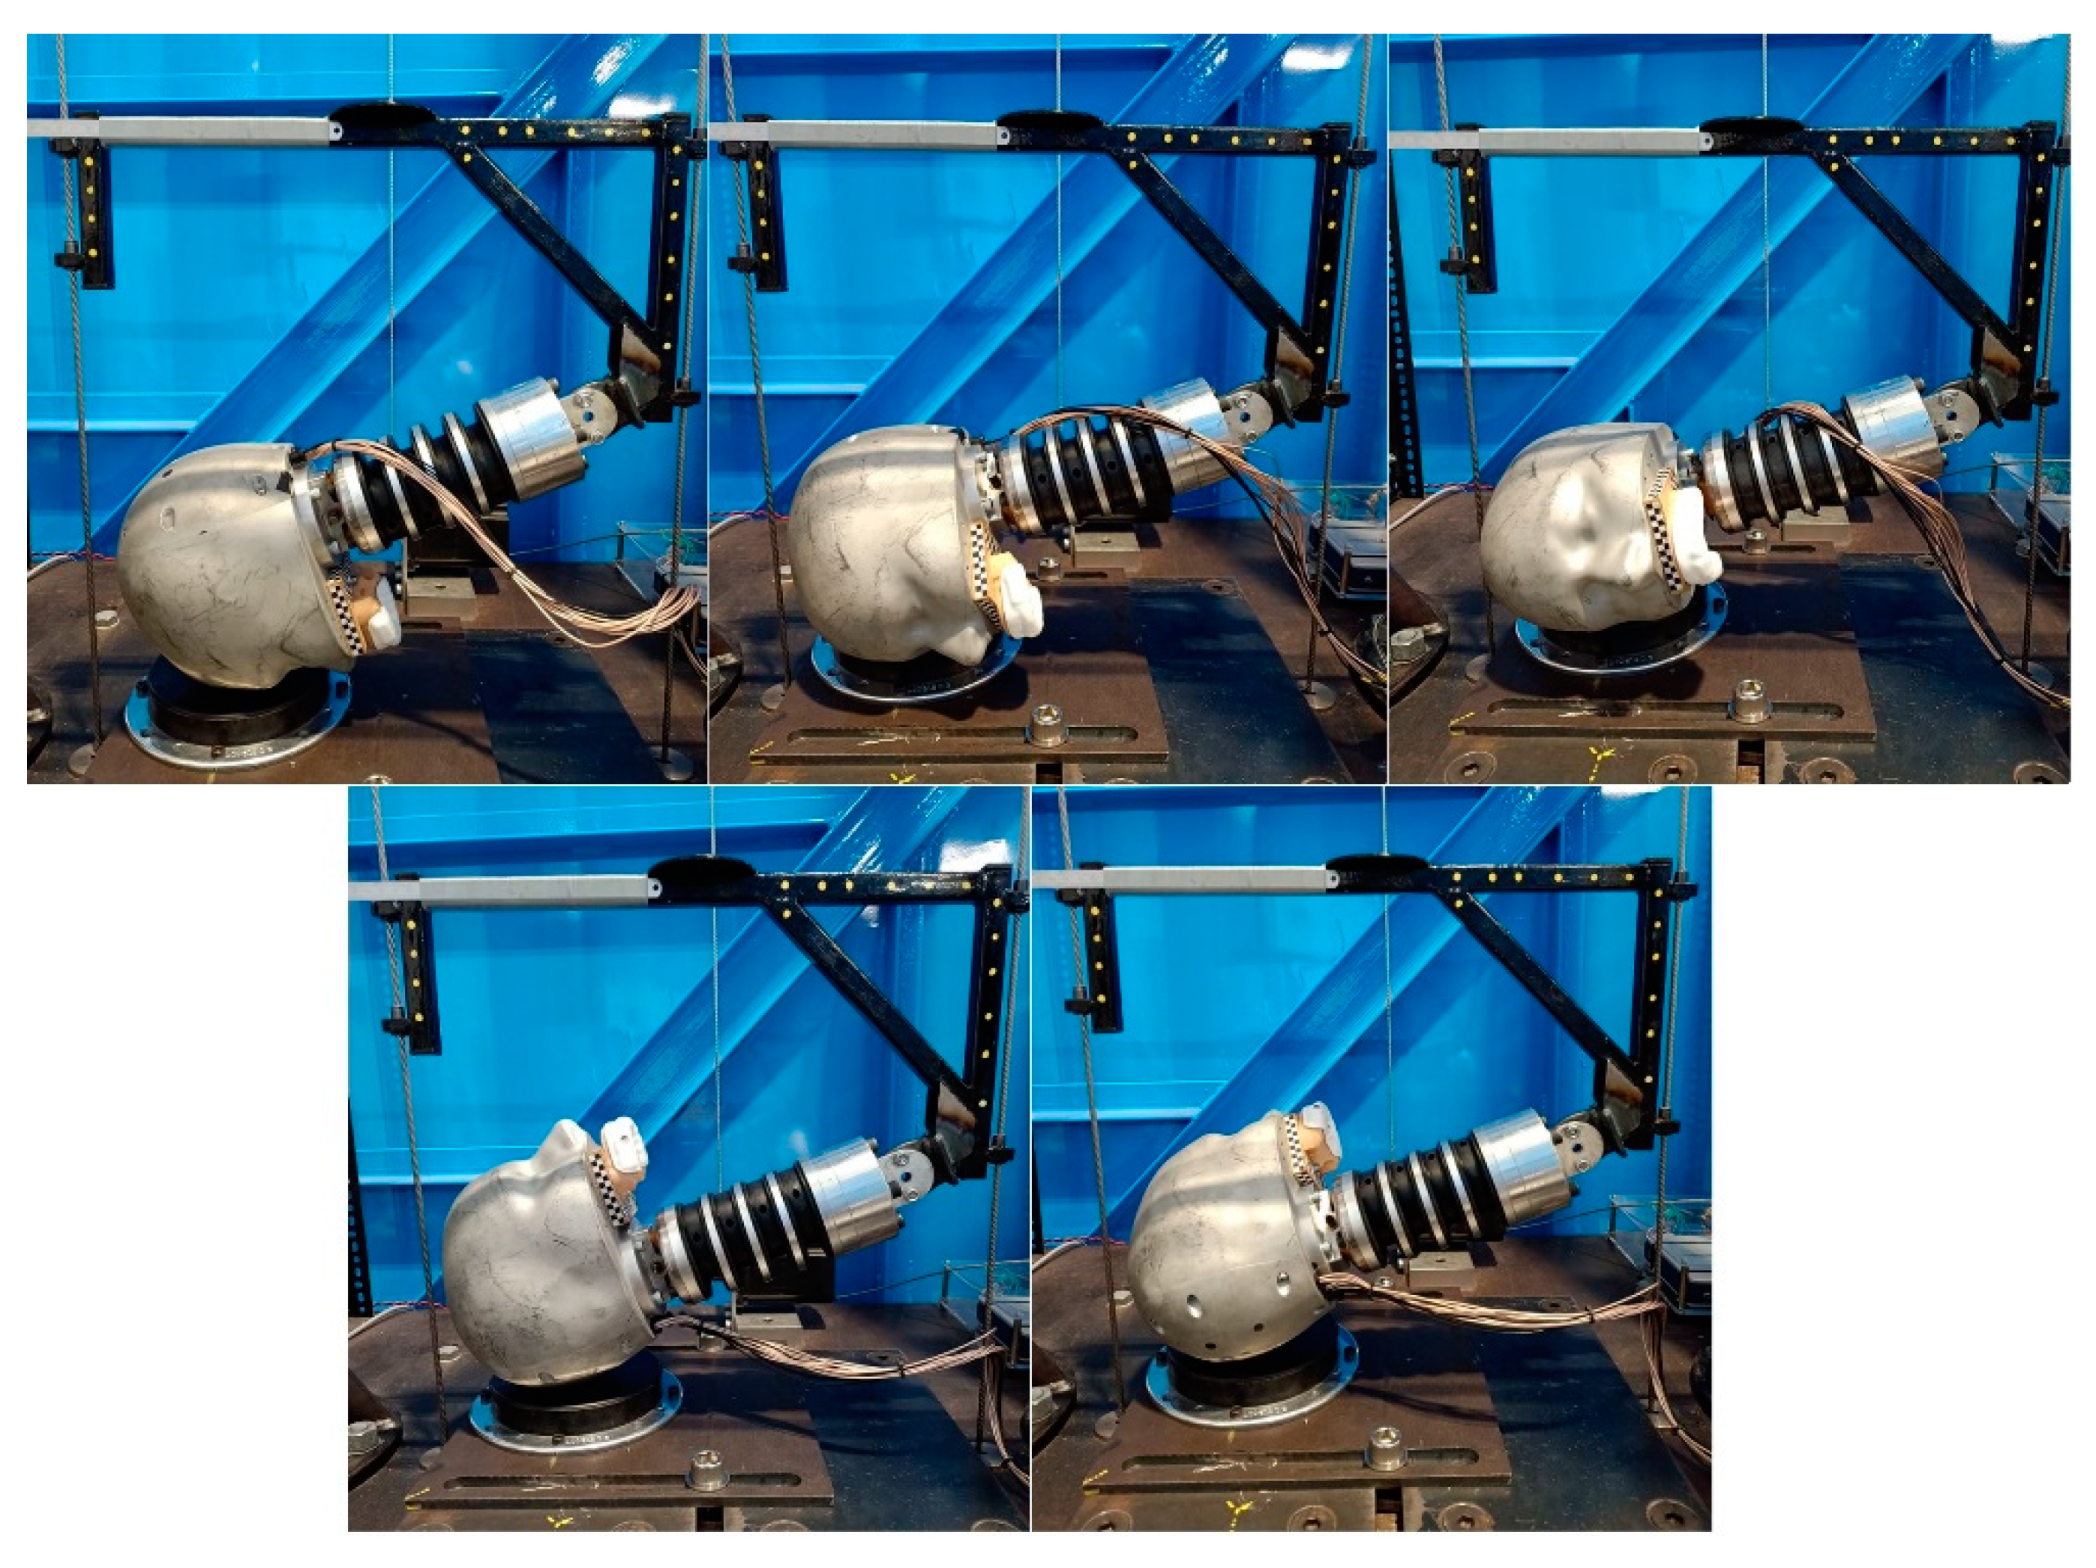
2.1. Experimental Procedure
2.2. Mouthguard
2.3. Data Acquisition
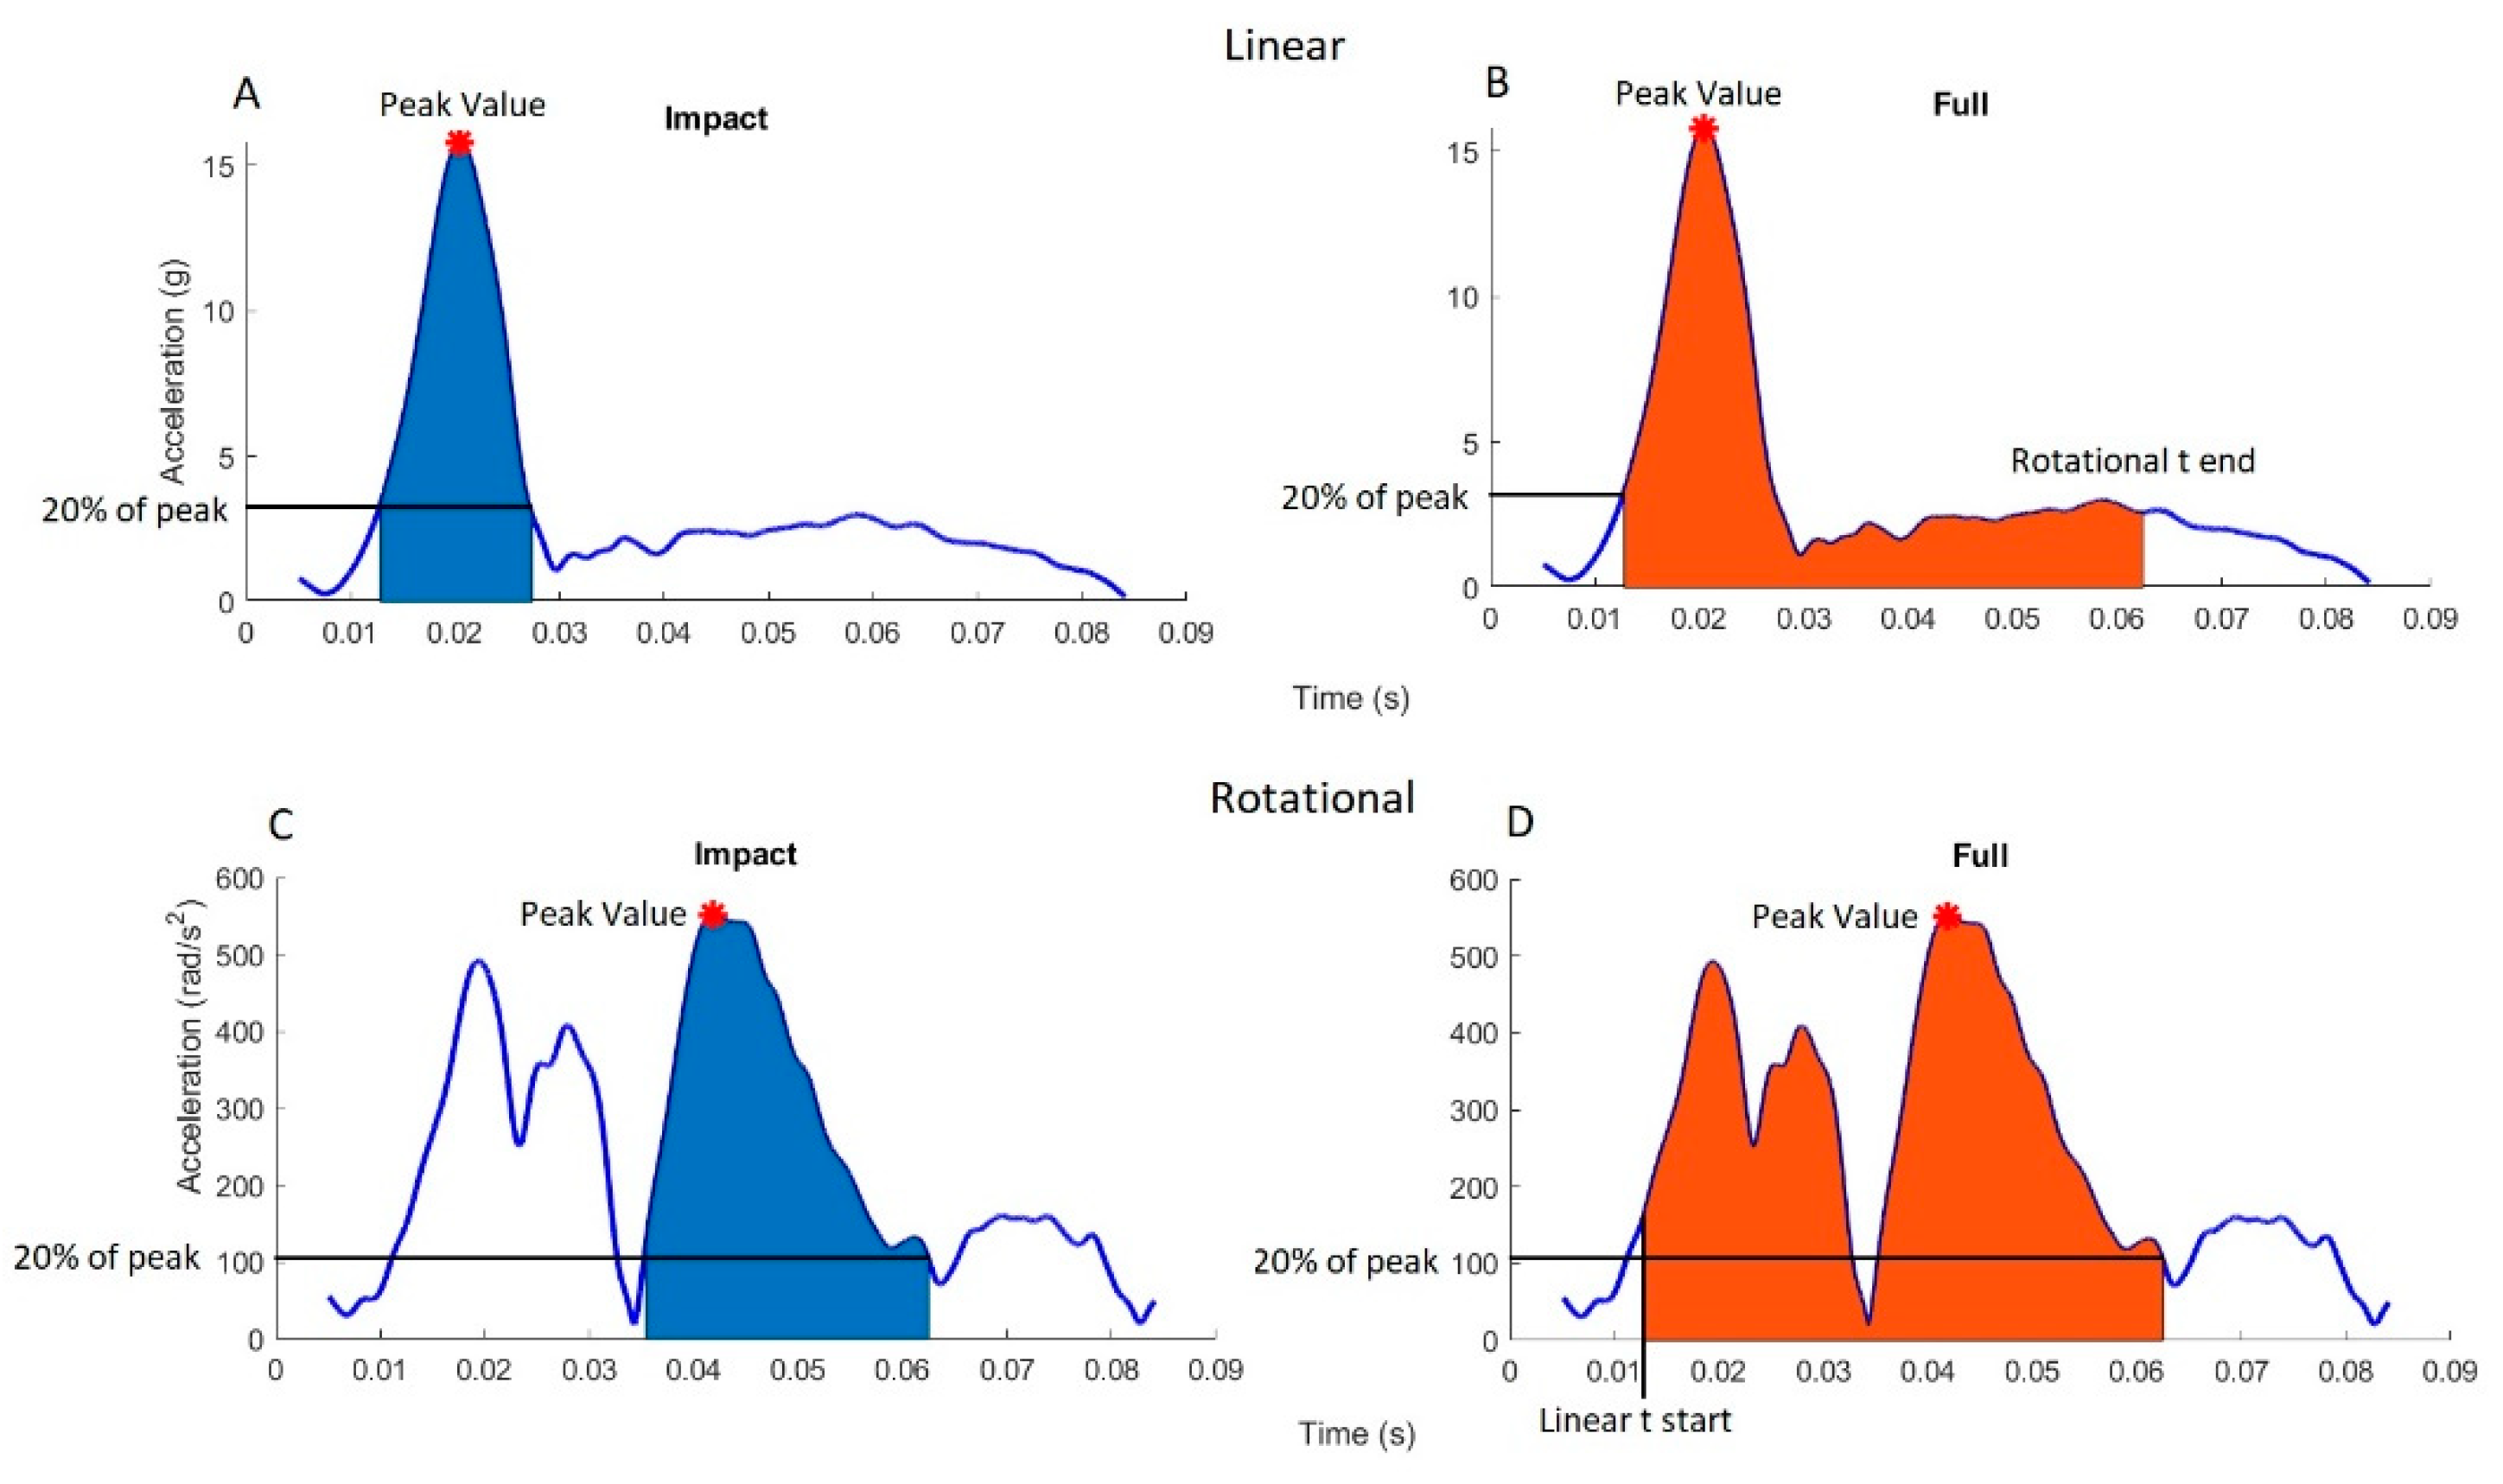
2.4. Post-Processing
2.5. Statistical Analysis
3. Results
4. Discussion
5. Conclusions
Author Contributions
Funding
Institutional Review Board Statement
Informed Consent Statement
Data Availability Statement
Acknowledgments
Conflicts of Interest
Appendix A

| Foam Name | Thickness (mm) | Manufacturer | Abbreviated Name |
|---|---|---|---|
| Confor Green | 13 | Trelleborg | CG |
| Sunmate | 12 | Dynamic Systems Inc. | SM |
| LD45 | 18 | Zotefoams | - |
| LD29 | 15 | Zotefoams | - |
| HD30 | 10 | Zotefoams | - |
| EV30 | 14 | Zotefoams | - |
| LD15 | 10 | Zotefoams | - |
| LD32 | 10 | Zotefoams | - |
| Zotefoam Blue | 10 | Zotefoams | ZFB |
| Perspex | 2 | - | P |
Appendix B
| A | CG |
| B | P, 3x SM |
| C | 3x SM, CG |
| D | CG, P, 5x SM, CG, P |
| E | EV30 |
| F | LD29 |
| G | EV30, ZFB, P, CG |
| H | 6x SM, 3x CG, EV30, ZFB, LD29 |
| I | LD32 |
| J | P, EV30, LD29, ZFB, LD45 |
| K | LD45, P, HD30 |
| L | P, HD30 |
References
- Rugby, W. Global Rugby Participation; World Rugby: Dublin, Ireland, 2017. [Google Scholar]
- Lock, S. Number of Participants in Boxing in the United States from 2006 to 2017; Statista: Hamburg, Germany, 2018. [Google Scholar]
- Lange, D. Number of People Participating in Boxing* in England from 2016 to 2019; Statista: Hamburg, Germany, 2019. [Google Scholar]
- Lock, S. Number of Participants in Tackle Football in the United States from 2006 to 2018; Statista: Hamburg, Germany, 2020. [Google Scholar]
- Gough, C. Countries by Number of Registered Ice Hockey Players in 2018/19; Statista: Hamburg, Germany, 2019. [Google Scholar]
- Sosin, D.M.; Sniezek, J.E.; Thurman, D.J. Incidence of mild and moderate brain injury in the United States. Brain Inj. 1996, 10, 47–54. [Google Scholar] [PubMed]
- Daneshvar, D.H.; Nowinski, C.J.; McKee, A.C.; Cantu, R.C. The Epidemiology of Sport-Related Concussion. Clin. Sports Med. 2011, 30, 1–17. [Google Scholar] [CrossRef]
- Lincoln, A.E.; Caswell, S.V.; Almquist, J.L.; Dunn, R.E.; Norris, J.B.; Hinton, R.Y. Trends in concussion incidence in high school sports: A prospective 11-year study. Am. J. Sports Med. 2011, 39, 958–963. [Google Scholar] [CrossRef]
- Fuller, C.W.; Taylor, A.; Raftery, M. 2016 Rio Olympics: An epidemiological study of the men’s and women’s Rugby-7s tournaments. Br. J. Sports Med. 2017, 51, 1272–1278. [Google Scholar] [CrossRef]
- King, D.; Hume, P.; Cummins, C.; Pearce, A.; Clark, T.; Foskett, A.; Barnes, M. Match and Training Injuries in Women’s Rugby Union: A Systematic Review of Published Studies. Sports Med. 2019, 49, 1559–1574. [Google Scholar] [CrossRef]
- Silver, D.; Brown, N.; Gissane, C. Reported concussion incidence in youth community Rugby Union and parental assessment of post head injury cognitive recovery using the King-Devick test. J. Neurol. Sci. 2018, 388, 40–46. [Google Scholar] [CrossRef]
- Agel, J.; Dompier, T.P.; Dick, R.; Marshall, S.W. Descriptive epidemiology of collegiate men’s ice hockey injuries: National Collegiate Athletic Association Injury Surveillance System, 1988–1989 through 2003–2004. J. Athl. Train. 2007, 42, 241. [Google Scholar]
- Agel, J.; Dick, R.; Nelson, B.; Marshall, S.W.; Dompier, T.P. Descriptive epidemiology of collegiate women’s ice hockey injuries: National Collegiate Athletic Association Injury Surveillance System, 2000–2001 through 2003–2004. J. Athl. Train. 2007, 42, 249. [Google Scholar] [PubMed]
- Rishiraj, N.; Lloyd-Smith, R.; Lorenz, T.; Niven, B.; Michel, M. University men’s ice hockey: Rates and risk of injuries over 6-years. J. Sports Med. Phys. Fit. 2009, 49, 159. [Google Scholar]
- Zazryn, T.R.; Finch, C.F.; McCrory, P. A 16 year study of injuries to professional kickboxers in the state of Victoria, Australia. Br. J. Sports Med. 2003, 37, 448–451. [Google Scholar] [CrossRef] [PubMed]
- Estwanik, J.J.; Boitano, M.; Ari, N. Amateur Boxing Injuries at the 1981 and 1982 USA/ABF National Championships. Physician Sportsmed. 1984, 12, 123–128. [Google Scholar] [CrossRef]
- Bledsoe, G.H.; Li, G.; Levy, F. Injury Risk in Professional Boxing. South. Med. J. 2005, 98, 994–998. [Google Scholar] [CrossRef]
- Graham, R.; Rivara, F.P.; Ford, M.A.; Spicer, C.M.; Committee on Sports-Related Concussions in Youth. Sports-Related Concussions in Youth: Improving the Science, Changing the Culture; National Academies Press: Washington, DC, USA, 2014. [Google Scholar]
- Bailes, J.E.; Petraglia, A.L.; Omalu, B.I.; Nauman, E.; Talavage, T. Role of subconcussion in repetitive mild traumatic brain injury. J. Neurosurg. 2013, 119, 1235–1245. [Google Scholar] [CrossRef]
- Gavett, B.E.; Stern, R.A.; McKee, A.C. Chronic Traumatic Encephalopathy: A Potential Late Effect of Sport-Related Concussive and Subconcussive Head Trauma. Clin. Sports Med. 2011, 30, 179–188. [Google Scholar] [CrossRef]
- Guskiewicz, K.M.; Marshall, S.W.; Bailes, J.; McCrea, M.; Cantu, R.C.; Randolph, C.; Jordan, B.D. Association between Recurrent Concussion and Late-Life Cognitive Impairment in Retired Professional Football Players. Neurosurgery 2005, 57, 719–726. [Google Scholar] [CrossRef]
- Guskiewicz, K.M.; Marshall, S.W.; Bailes, J.; Mccrea, M.; Harding, H.P.; Matthews, A.; Mihalik, J.R.; Cantu, R.C. Recurrent Concussion and Risk of Depression in Retired Professional Football Players. Med. Sci. Sports Exerc. 2007, 39, 903–909. [Google Scholar] [CrossRef] [PubMed]
- ACC. Sport Concussion in New Zealand; ACC National Guidelines; ACC: Wellington, NZ, USA, 2015. [Google Scholar]
- Duhaime, A.C.; Beckwith, J.G.; Maerlender, A.C.; McAllister, T.W.; Crisco, J.J.; Duma, S.M.; Brolinson, P.G.; Rowson, S.; Flashman, L.A.; Chu, J.J.; et al. Spectrum of acute clinical characteristics of diagnosed concussions in college athletes wearing instrumented helmets: Clinical article. J Neurosurg. 2012, 117, 1092–1099. [Google Scholar] [CrossRef] [PubMed]
- McCrory, P.; Meeuwisse, W.; Aubry, M.; Cantu, B.; Dvorak, J.; Echemendia, R.; Engebretsen, L.; Johnston, K.; Kutcher, J.; Raftery, M.; et al. Consensus statement on Concussion in Sport—The 4th International Conference on Concussion in Sport held in Zurich, November. J. Sci. Med. Sport 2013, 16, 178–189. [Google Scholar] [CrossRef] [PubMed]
- Gardner, A.; Iverson, G.; Levi, C.; Schofield, P.; Kay-Lambkin, F.; Kohler, R.M.N.; Stanwell, P. A systematic review of concussion in rugby league. Br. J. Sports Med. 2014, 49, 495–498. [Google Scholar] [CrossRef]
- Makdissi, M.; Darby, D.; Maruff, P.; Ugoni, A.; Brukner, P.; McCrory, P.R. Natural history of concussion in sport: Markers of severity and implications for management. Am. J. Sports Med. 2010, 38, 464–471. [Google Scholar] [CrossRef]
- McClincy, M.P.; Lovell, M.R.; Pardini, J.; Collins, M.W.; Spore, M.K. Recovery from sports concussion in high school and collegiate athletes. Brain Inj. 2006, 20, 33–39. [Google Scholar] [CrossRef]
- McCrea, M.; Guskiewicz, K.; Randolph, C.; Barr, W.B.; Hammeke, T.A.; Marshall, S.W.; Kelly, J.P. Effects of a symptom-free waiting period on clinical outcome and risk of reinjury after sport-related concussion. Neurosurgery 2009, 65, 876–883. [Google Scholar] [CrossRef]
- McCrea, M.; Guskiewicz, K.; Randolph, C.; Barr, W.; Hammeke, T.A.; Marshall, S.; Powell, M.R.; Ahn, K.W.; Wang, Y.; Kelly, J.P. Incidence, Clinical Course, and Predictors of Prolonged Recovery Time Following Sport-Related Concussion in High School and College Athletes. J. Int. Neuropsychol. Soc. 2013, 19, 22–33. [Google Scholar] [CrossRef] [PubMed]
- Eisenberg, M.A.; Andrea, J.; Meehan, W.; Mannix, R. Time Interval Between Concussions and Symptom Duration. Pediatry 2013, 132, 8–17. [Google Scholar] [CrossRef] [PubMed]
- Williams, R.; Puetz, T.W.; Giza, C.C.; Broglio, S.P. Concussion Recovery Time Among High School and Collegiate Athletes: A Systematic Review and Meta-Analysis. Sports Med. 2015, 45, 893–903. [Google Scholar] [CrossRef] [PubMed]
- Field, M.; Collins, M.W.; Lovell, M.R.; Maroon, J. Does age play a role in recovery from sports-related concussion? A comparison of high school and collegiate athletes. J. Pediatr. 2003, 142, 546–553. [Google Scholar] [CrossRef] [PubMed]
- Dziemianowicz, M.S.; Kirschen, M.P.; Pukenas, B.A.; Laudano, E.; Balcer, L.J.; Galetta, S.L. Sports-Related Concussion Testing. Curr. Neurol. Neurosci. Rep. 2012, 12, 547–559. [Google Scholar] [CrossRef]
- Anderson, B.L.; Gittelman, M.A.; Mann, J.K.; Cyriac, R.L.; Pomerantz, W.J. High School Football Players’ Knowledge and Attitudes About Concussions. Clin. J. Sport Med. 2016, 26, 206–209. [Google Scholar] [CrossRef]
- McCrea, M.; Hammeke, T.; Olsen, G.; Leo, P.; Guskiewicz, K. Unreported concussion in high school football players: Implications for prevention. Clin. J. Sport Med. 2004, 14, 13–17. [Google Scholar] [CrossRef]
- O’Connor, K.L.; Rowson, S.; Duma, S.M.; Broglio, S.P. Head-Impact–Measurement Devices: A Systematic Review. J. Athl. Train. 2017, 52, 206–227. [Google Scholar] [CrossRef] [PubMed]
- Jadischke, R.; Viano, D.C.; Dau, N.; King, A.I.; McCarthy, J. On the accuracy of the Head Impact Telemetry (HIT) System used in football helmets. J. Biomech. 2013, 46, 2310–2315. [Google Scholar] [CrossRef]
- McCuen, E.; Svaldi, D.; Breedlove, K.; Kraz, N.; Cummiskey, B.; Breedlove, E.L.; Traver, J.; Desmond, K.F.; Hannemann, R.E.; Zanath, E.; et al. Collegiate women’s soccer players suffer greater cumulative head impacts than their high school counterparts. J. Biomech. 2015, 43, 3720–3723. [Google Scholar] [CrossRef]
- Nevins, D.; Smith, L.; Kensrud, J. Laboratory Evaluation of Wireless Head Impact Sensor. Procedia Eng. 2015, 112, 175–179. [Google Scholar] [CrossRef][Green Version]
- Schussler, E.; Stark, D.; Bolte, J.H.; Kang, Y.S.; Onate, J.A. Comparison of a Head Mounted Impact Measurement Device to the Hybrid III Anthropomorphic Testing Device in a Controlled Laboratory Setting. Int. J. Sports Phys. Ther. 2017, 12, 592–600. [Google Scholar]
- Wu, L.C.; Nangia, V.; Bui, K.; Hammoor, B.; Kurt, M.; Hernandez, F.; Kuo, C.; Camarillo, D.B. In Vivo Evaluation of Wearable Head Impact Sensors. Ann. Biomed. Eng. 2016, 44, 1234–1245. [Google Scholar] [CrossRef]
- Camarillo, D.B.; Shull, P.B.; Mattson, J.; Shultz, R.; Garza, D. An Instrumented Mouthguard for Measuring Linear and Angular Head Impact Kinematics in American Football. Ann. Biomed. Eng. 2013, 41, 1939–1949. [Google Scholar] [CrossRef]
- Siegmund, G.P.; Guskiewicz, K.M.; Marshall, S.W.; DeMarco, A.; Bonin, S.J. Laboratory Validation of Two Wearable Sensor Systems for Measuring Head Impact Severity in Football Players. Ann. Biomed. Eng. 2016, 44, 1257–1274. [Google Scholar] [CrossRef] [PubMed]
- NOCSAE. Standard Performance Specification for Newly Manufactured Football Helmets. In Impact Attenuation Tests; NOCSAE: USA, 2017; Available online: https://nocsae.org/wp-content/uploads/2018/05/1501096770ND00217m17aMfrdFBHelmetsStandardPerformance.pdf (accessed on 8 September 2021).
- King, D.A.; Hume, P.; Gissane, C.; Clark, T. Measurement of Head Impacts in a Senior Amateur Rugby League Team with an Instrumented Patch: Exploratory Analysis. ARC J. Res. Sports Med. 2017, 2, 9–20. [Google Scholar]
- King, D.; Hume, P.; Gissane, C.; Clark, T. Head impacts in a junior rugby league team measured with a wireless head impact sensor: An exploratory analysis. J. Neurosurg. Pediatr. 2017, 19, 13–23. [Google Scholar] [CrossRef] [PubMed]
- King, D.; Hume, P.; Brughelli, M.; Gissane, C. Instrumented Mouthguard Acceleration Analyses for Head Impacts in Amateur Rugby Union Players Over a Season of Matches. Am. J. Sports Med. 2015, 43, 614–624. [Google Scholar] [CrossRef] [PubMed]
- King, D.; Hume, P.; Hardaker, N.; Cummins, C.; Clark, T.; Pearce, A.; Gissane, C. Female rugby union injuries in New Zealand: A review of five years (2013–2017) of Accident Compensation Corporation moderate to severe claims and costs. J. Sci. Med. Sport 2019, 22, 532–537. [Google Scholar] [CrossRef] [PubMed]
- King, D.A.; Hume, P.A.; Gissane, C.; Kieser, D.C.; Clark, T. Head impact exposure from match participation in women’s rugby league over one season of domestic competition. J. Sci. Med. Sport 2018, 21, 139–146. [Google Scholar] [CrossRef] [PubMed]
- Padgaonkar, A.J.; Krieger, K.W.; King, A.I. Measurement of Angular Acceleration of a Rigid Body Using Linear Accelerometers. J. Appl. Mech. 1975, 42, 552–556. [Google Scholar] [CrossRef]
- Greybe, D.G.; Jones, C.M.; Brown, M.R.; Williams, E.M.P. Comparison of head impact measurements via an instrumented mouthguard and an anthropometric testing device. Sports Eng. 2020, 23, 1–11. [Google Scholar] [CrossRef]
- Bartsch, A.; Samorezov, S.; Benzel, E.; Miele, V.; Brett, D. Validation of an “Intelligent Mouthguard” Single Event Head Impact Dosimeter. Stapp Car Crash J. 2014, 58, 1–27. [Google Scholar] [CrossRef]
- Bland, J.M.; Altman, D.G. Statistical methods for assessing agreement between two methods of clinical measurement. Lancet 1986, 1, 307–310. [Google Scholar] [CrossRef]
- Klein, R. Bland-Altman and Correlation Plot; MATLAB Central File Exchange. Available online: https://www.mathworks.com/matlabcentral/fileexchange/45049-bland-altman-and-correlation-plot (accessed on 21 January 2021).
- McBride, G.B. A Proposal for Strength of Agreement Criteria for Lin’s Concordance Correlation Coefficient; National Institute of Water and Atmospheric Research Ltd.: Auckland, New Zealand, 2005. [Google Scholar]
- Tyson, A.M.; Duma, S.M.; Rowson, S. Laboratory Evaluation of Low-Cost Wearable Sensors for Measuring Head Impacts in Sports. J. Appl. Biomech. 2018, 34, 320–326. [Google Scholar] [CrossRef]


| PLA (g) | Duration (ms) | Forehead | Front Boss | Side | Rear | Rear Boss |
|---|---|---|---|---|---|---|
| 20 g | 15 ms | 0.05 (E) | 0.11 (A) | 0.08 (E) | 0.06 (L) | 0.08 (I) |
| 30 ms | 0.39 (C) | 0.46 (C) | 0.60 (C) | 0.51 (C) | 0.53 (C) | |
| 60 ms | 1.16 (H) | 1.04 (H) | - | - | - | |
| 40 g | 15 ms | 0.14 (F) | 0.24 (B) | 0.20 (F) | 0.15 (L) | 0.17 (F) |
| 30 ms | 0.64 (J) | 1.60 (D) | - | - | - | |
| 80 g | 15 ms | 0.65 (G) | - | - | 0.63 (K) | - |
| Metric | Measurement | Linear | Rotational |
|---|---|---|---|
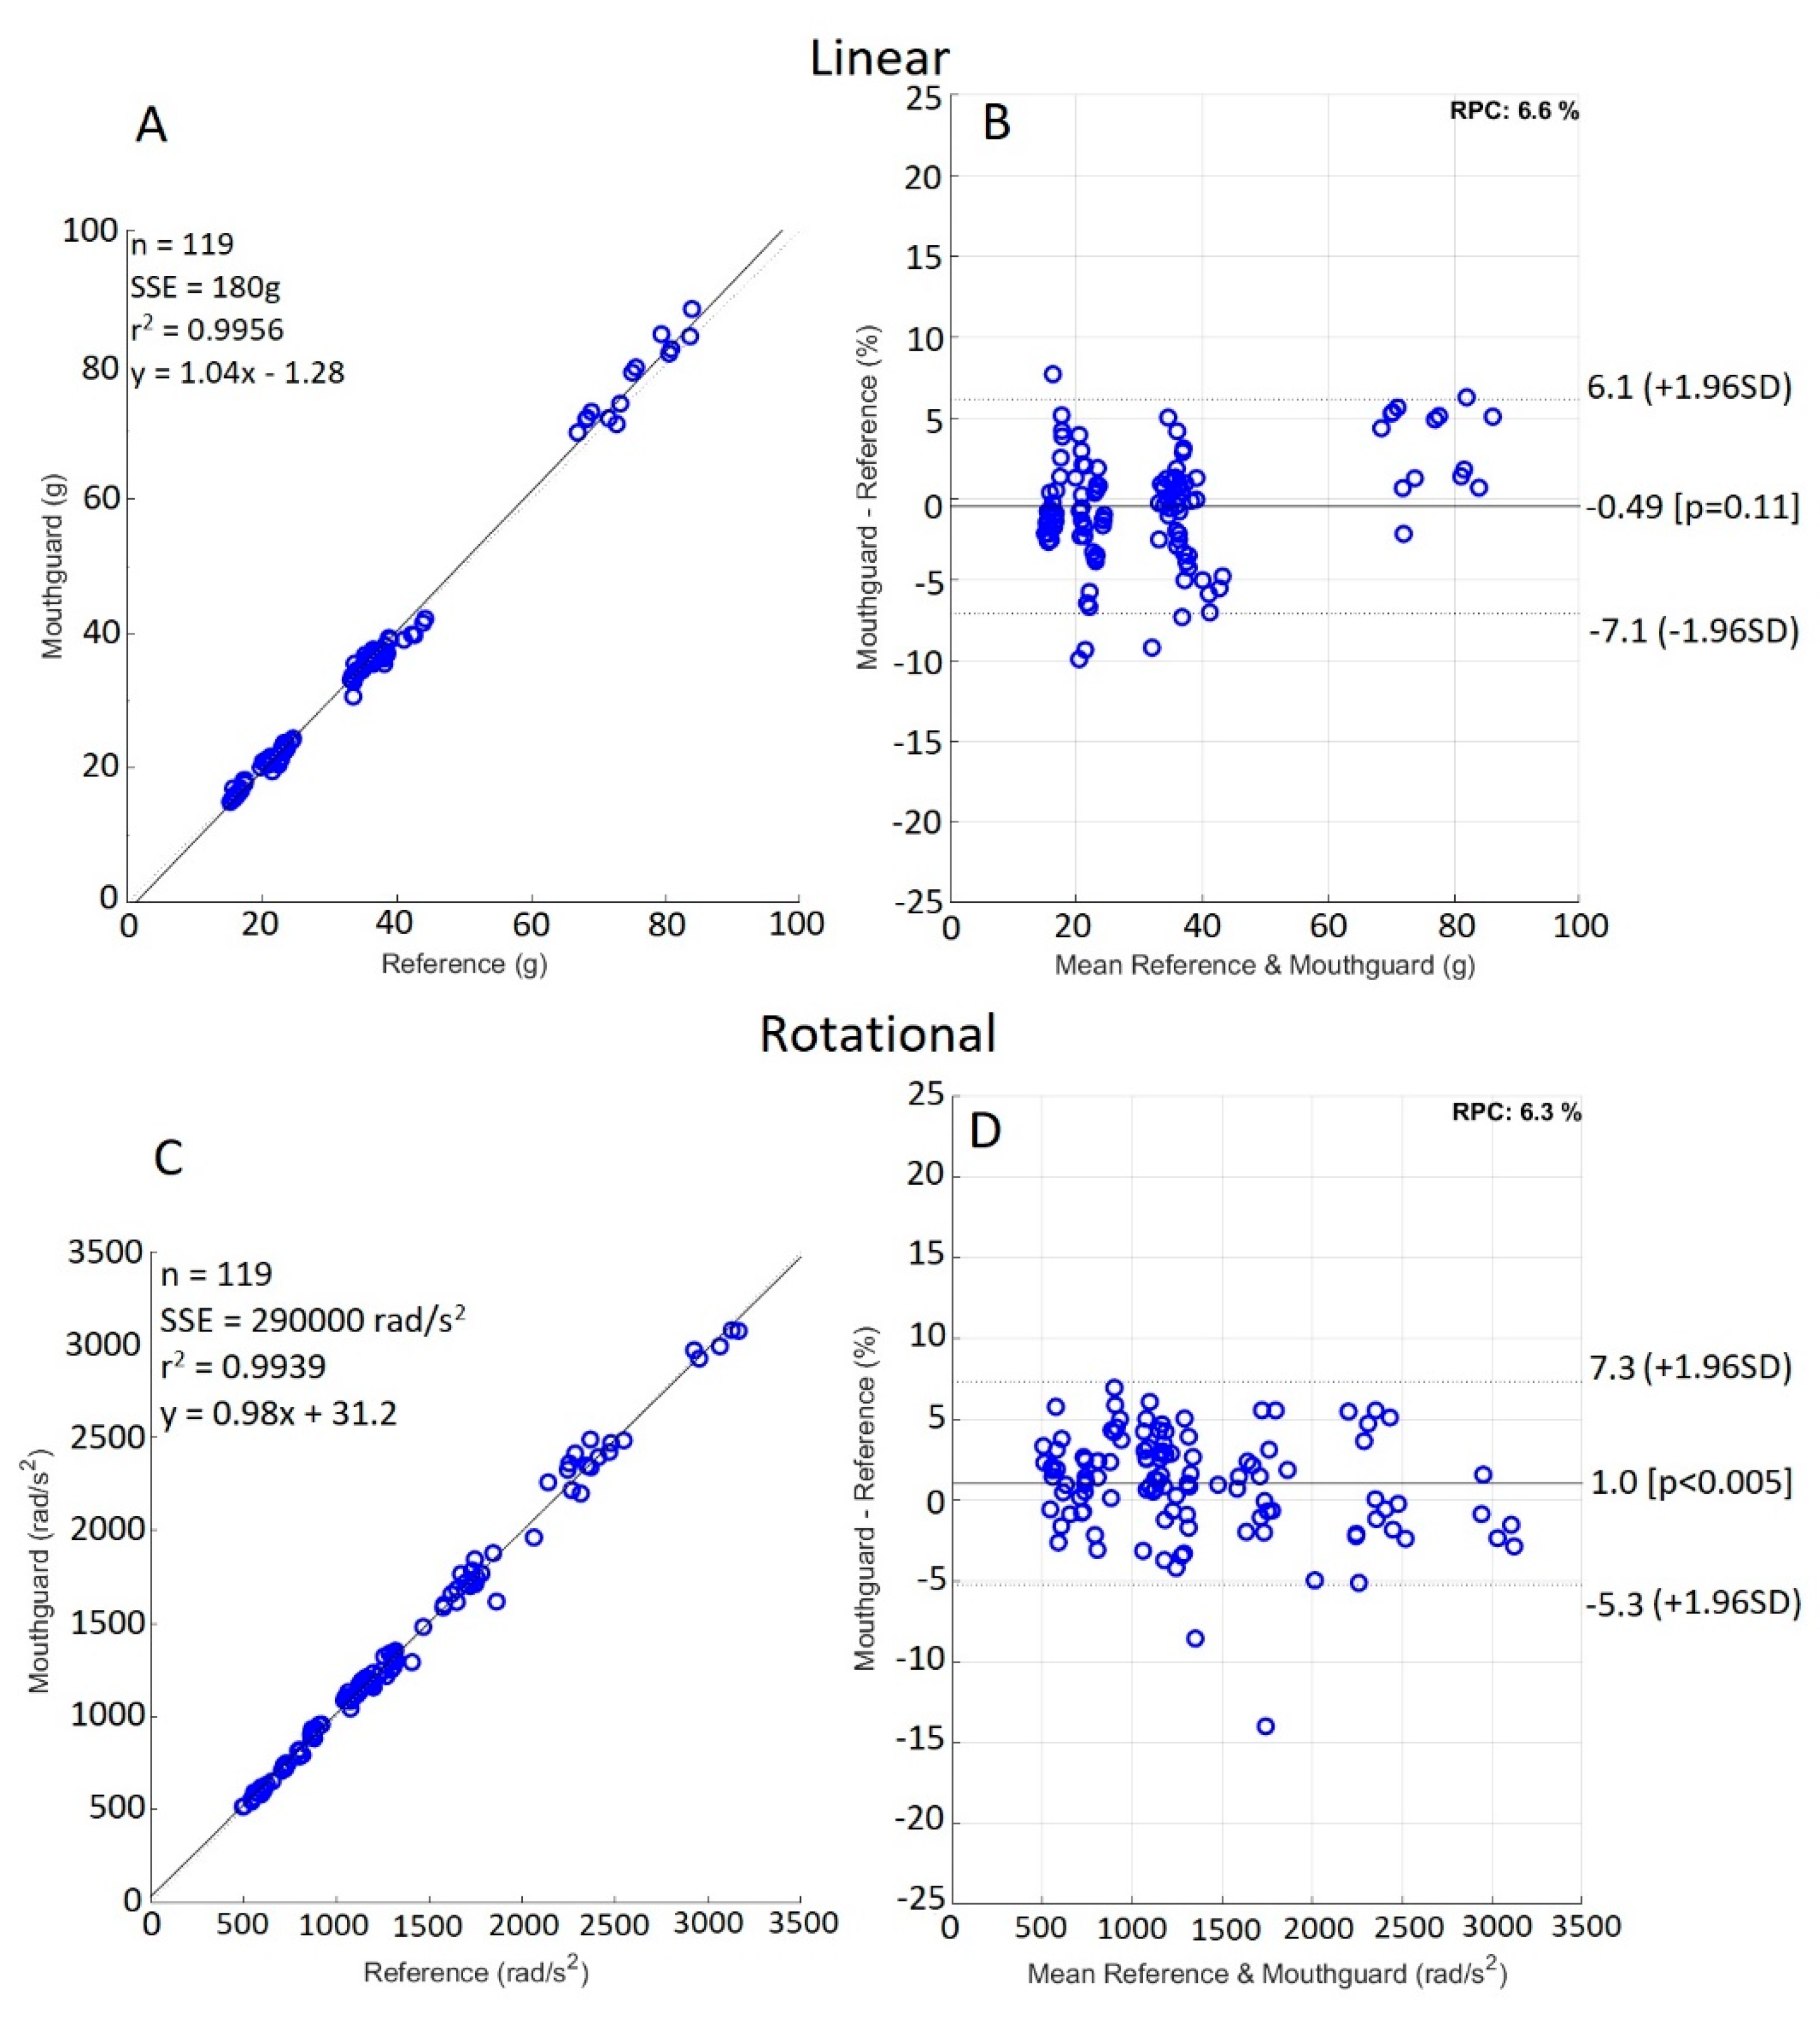
| Lin’s Concordance correlation coefficient | Peak acceleration | 0.997 | 0.997 |
| LCCC 95% confidence interval | Peak acceleration | (0.996, 0.998) | (0.995, 0.998) |
| R2 value | Peak acceleration | 0.996 | 0.994 |
| Linear regression equation | Peak acceleration | 1.04x − 1.28 | 0.98x + 31.2 |
| Mean (SD) | Impact RMS | 0.98 (0.64) | 47.41 (34.99) |
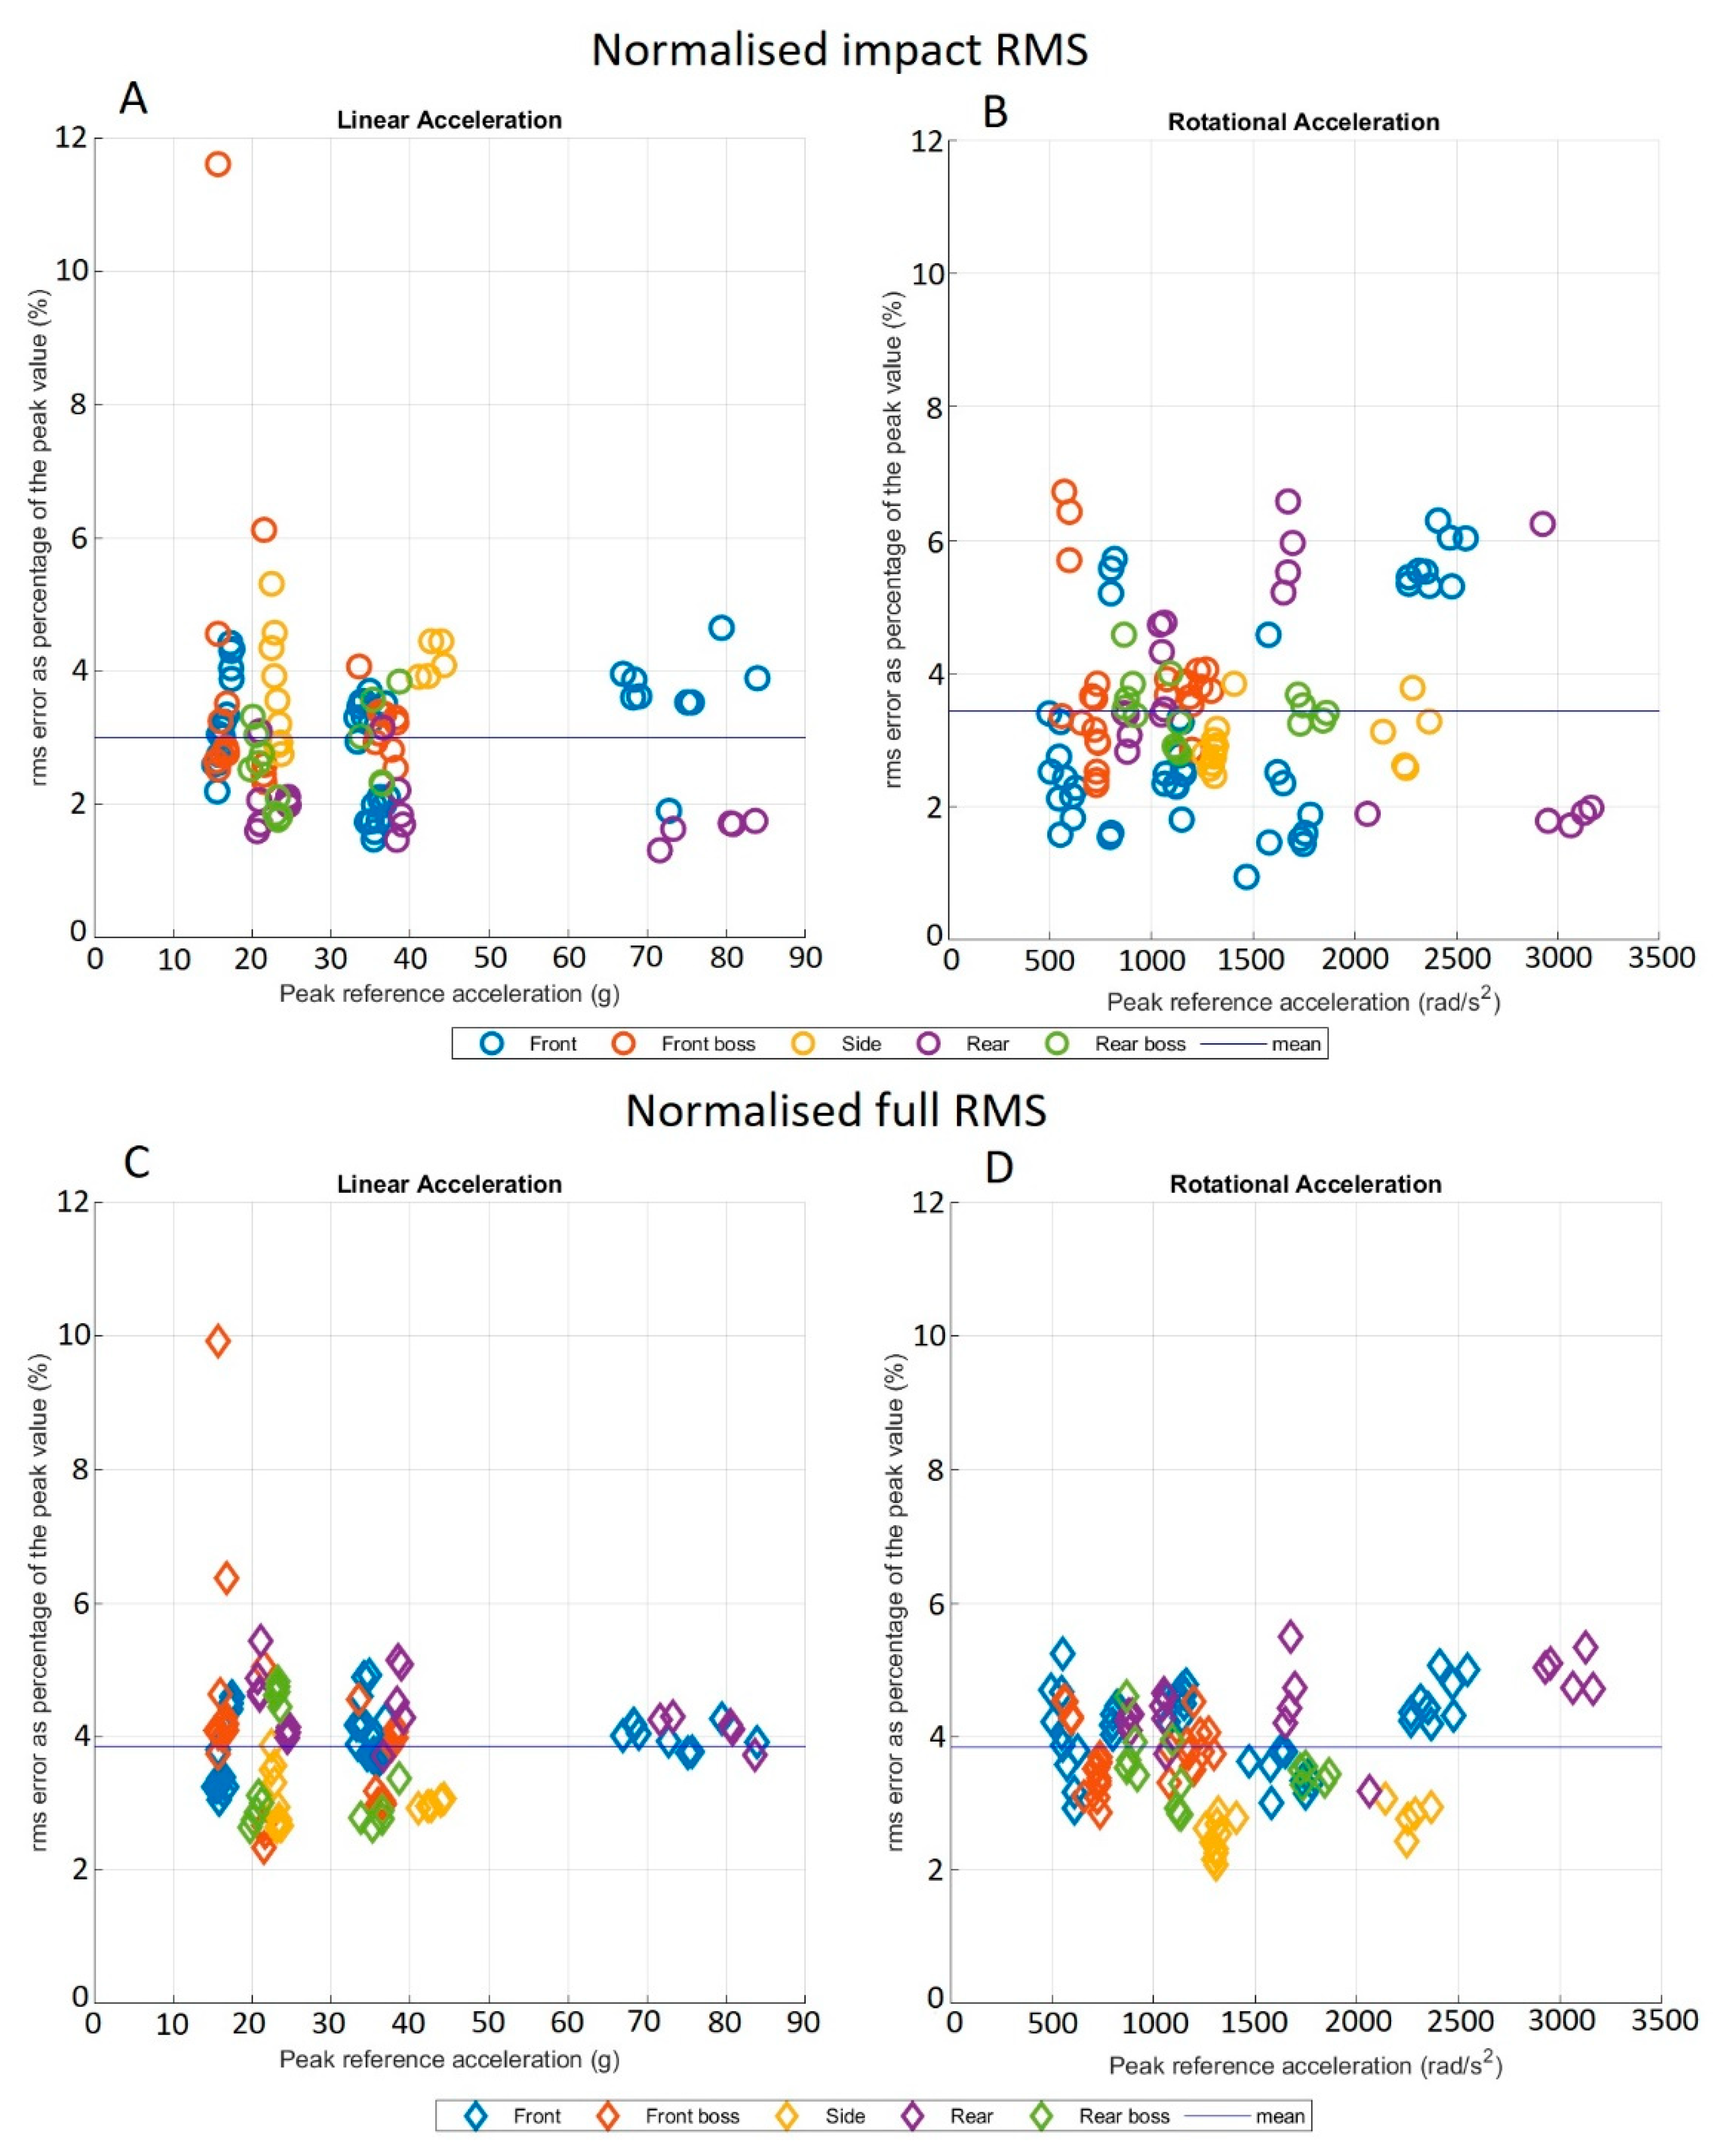
| Mean (SD) | Impact NRMS | 3.01 (1.22%) | 3.44 (1.33%) |
| Mean (SD) | Full RMS | 1.28 (0.75) | 52.20 (31.60) |
| Mean (SD) | Full NRMS | 3.85 (0.92%) | 3.85 (0.76%) |
| Mean (SD) relative peak value error | Peak acceleration | 2.56 (2.16%) | 2.82 (2.54%) |
Publisher’s Note: MDPI stays neutral with regard to jurisdictional claims in published maps and institutional affiliations. |
© 2021 by the authors. Licensee MDPI, Basel, Switzerland. This article is an open access article distributed under the terms and conditions of the Creative Commons Attribution (CC BY) license (https://creativecommons.org/licenses/by/4.0/).
Share and Cite
Stitt, D.; Draper, N.; Alexander, K.; Kabaliuk, N. Laboratory Validation of Instrumented Mouthguard for Use in Sport. Sensors 2021, 21, 6028. https://doi.org/10.3390/s21186028
Stitt D, Draper N, Alexander K, Kabaliuk N. Laboratory Validation of Instrumented Mouthguard for Use in Sport. Sensors. 2021; 21(18):6028. https://doi.org/10.3390/s21186028
Chicago/Turabian StyleStitt, Danyon, Nick Draper, Keith Alexander, and Natalia Kabaliuk. 2021. "Laboratory Validation of Instrumented Mouthguard for Use in Sport" Sensors 21, no. 18: 6028. https://doi.org/10.3390/s21186028
APA StyleStitt, D., Draper, N., Alexander, K., & Kabaliuk, N. (2021). Laboratory Validation of Instrumented Mouthguard for Use in Sport. Sensors, 21(18), 6028. https://doi.org/10.3390/s21186028