1. Introduction
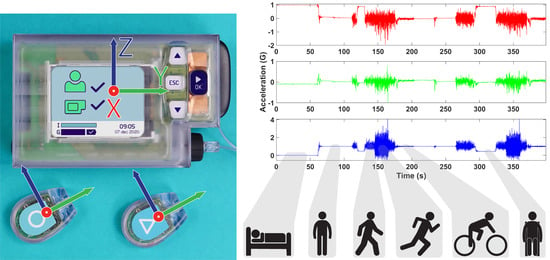
Closed loop bi-hormonal artificial pancreas systems, such as the artificial pancreas (AP™) developed by Inreda Diabetic B.V. (Goor, The Netherlands), fully regulate blood glucose levels of type 1 diabetes mellitus (T1DM) patients by administration of insulin and glucagon using a closed loop regulator as shown in
Figure 1 [
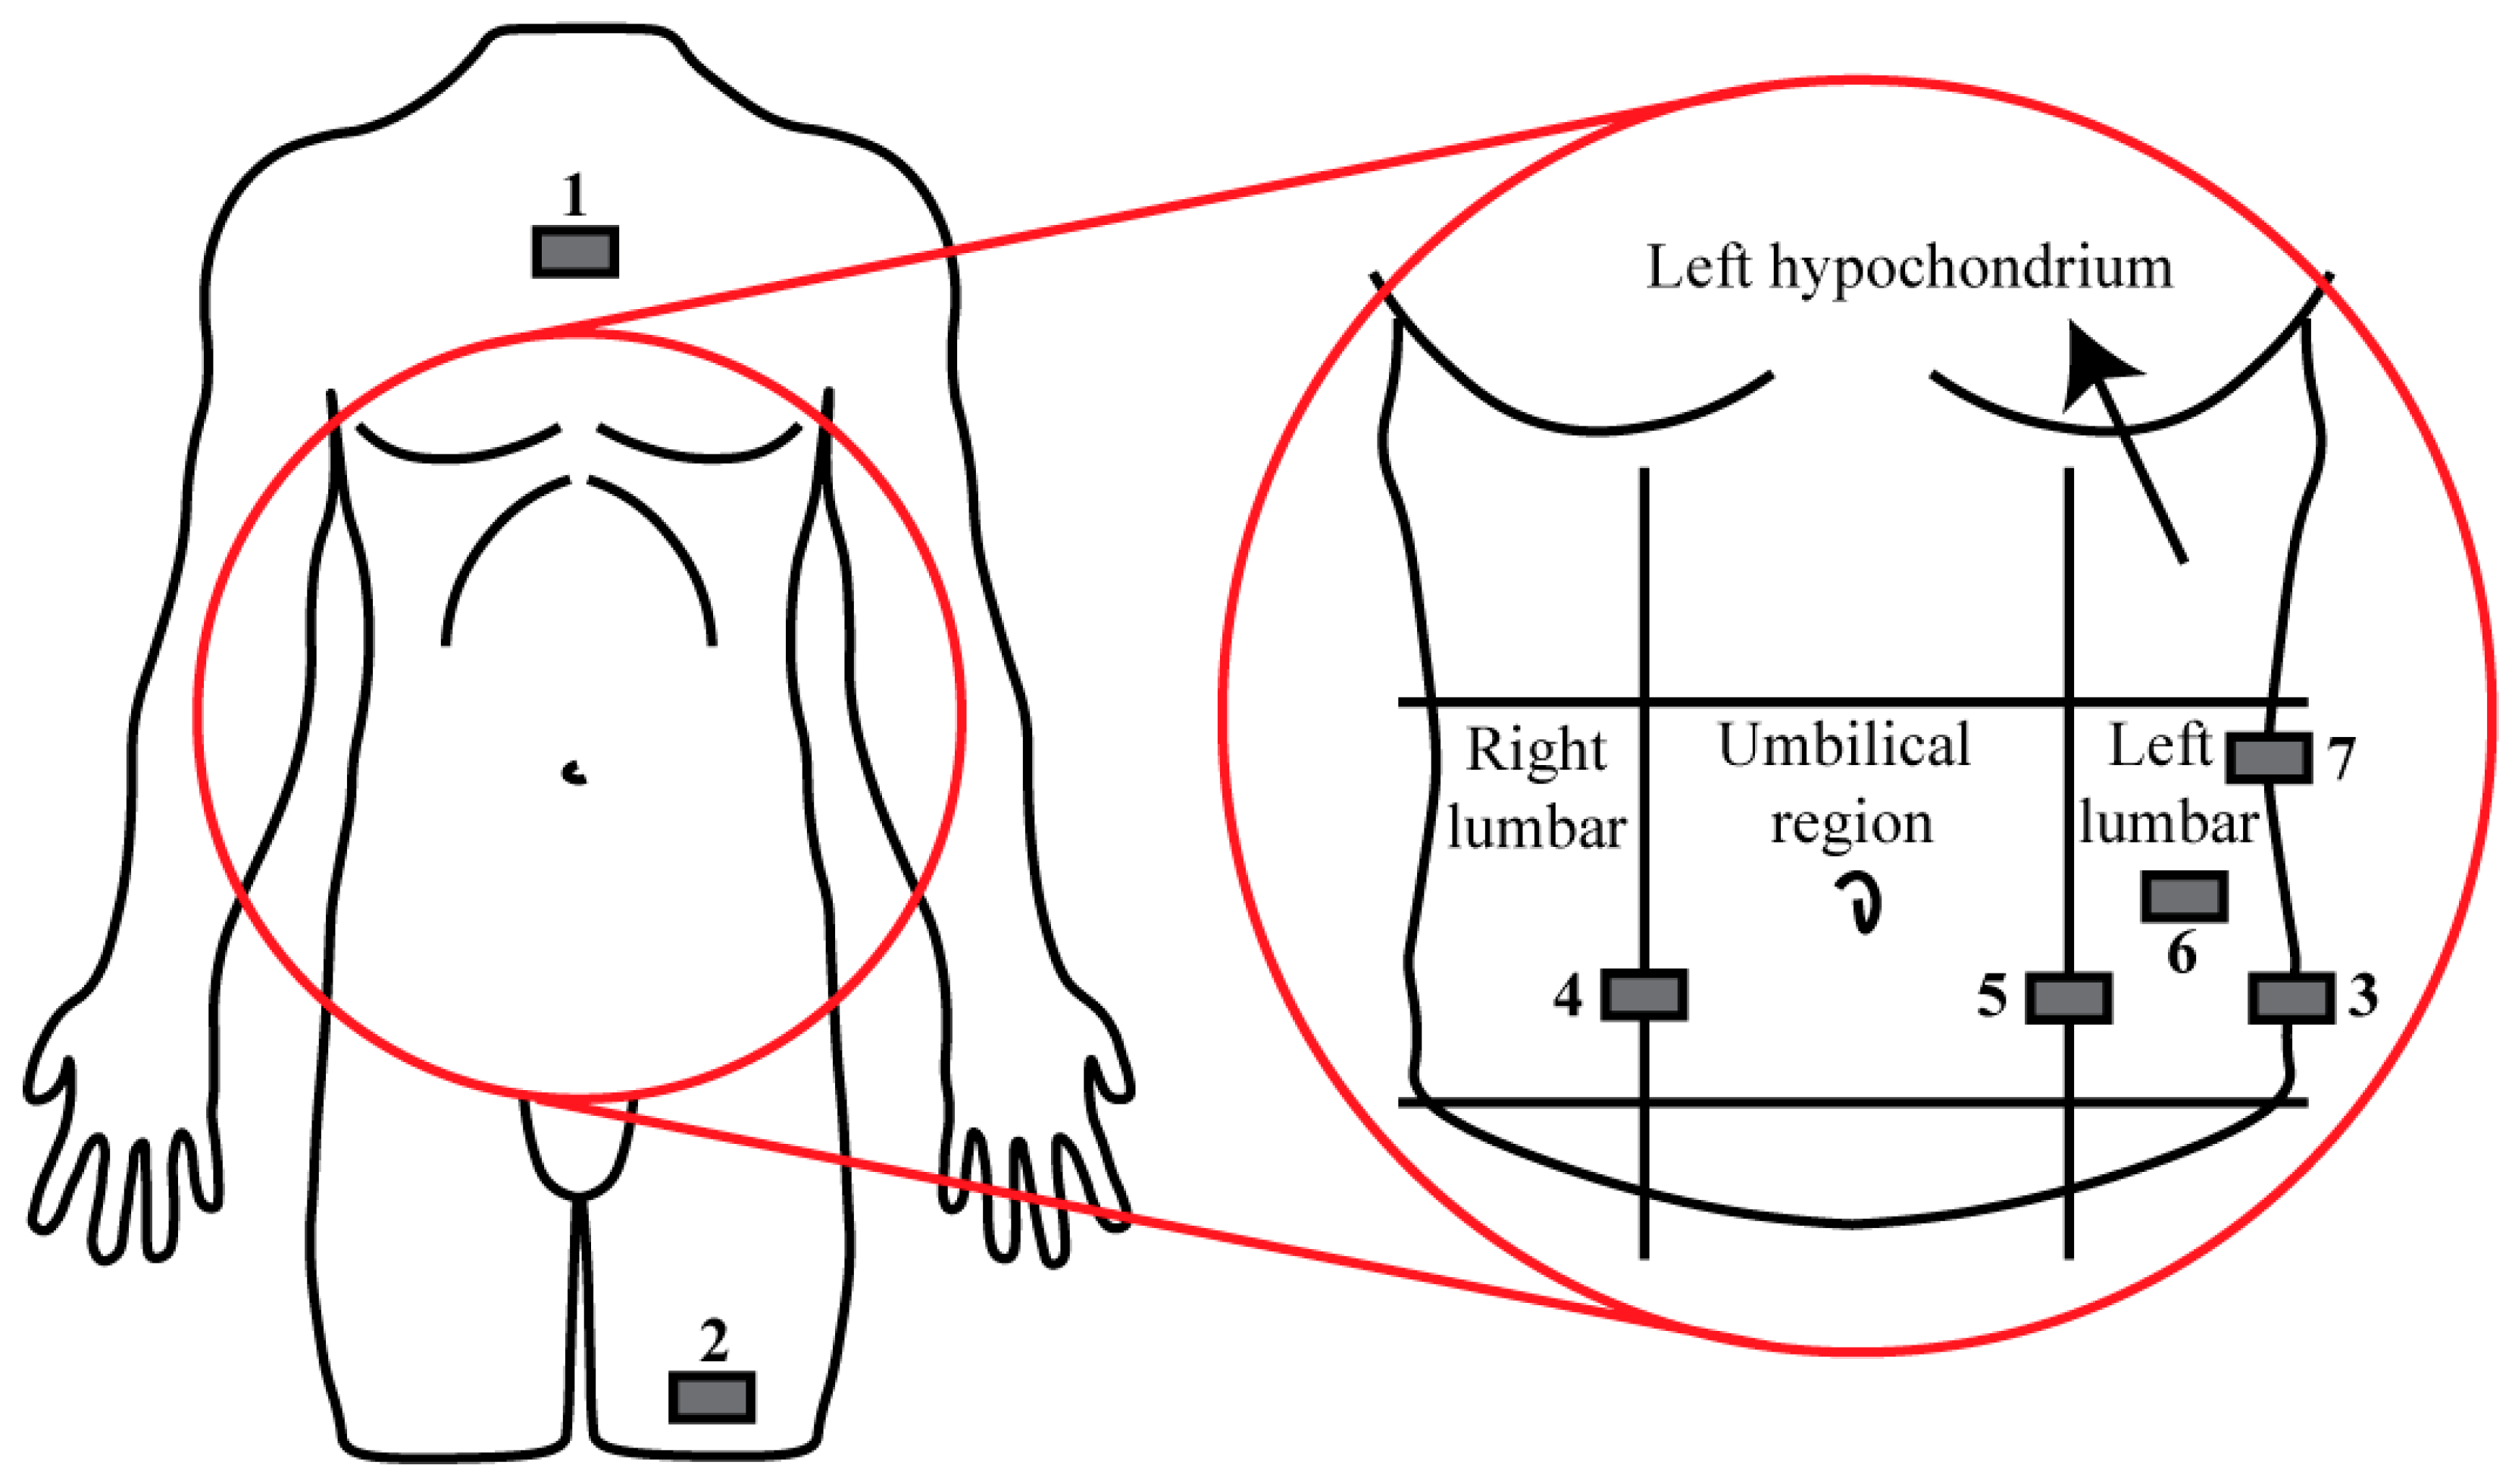
1]. The hardware consists of a mainframe, generally worn on the hip, two transmitters that measure blood glucose levels, worn in the abdomen region, and two cannulas through which insulin and glucagon are administered [
2]. Furthermore, the mainframe and transmitters contain tri-axial accelerometers that sense physical activity [
2] using a sampling frequency of 20 Hz as a measure of the metabolic consumption rate to adjust the hormone administration algorithm.
Because performing physical activity influences blood glucose levels based on the intensity of the activity [
3], the AP™ control system allows for changing insulin administration levels at different activity magnitudes [
2]. However, the current physical activity sensing method can be improved as the current implemented method of data processing entails heavily down-sampled 1D data, which will lead to a loss of information. Furthermore, other factors that are of influence on blood glucose dynamics, such as sleeping [
4], are not taken into account in the current system as it does not know when a specific patient actually is sleeping. Finally, using the AP™ system in daily life means that the mainframe and transmitters are not placed consistently on the same location, where the mainframe is moved throughout the day due to natural use and the skin underneath the transmitters needs to recover from the adhesives. All these factors suggest that more detailed identification of physical activity using this particular setup is not trivial. As the AP™ currently does not classify postures and movements to estimate metabolic energy consumption to correct hormone administration levels, considerable improvements to the system can be made. To change the hormone administration algorithm based on the metabolic consumption rate more accurately, as a first step, postures and movements need to be identified as these individual identified postures and movements are related to specific metabolic consumption rates [
5].
The concept of posture and movement identification using accelerometry has been researched before in a varying range of manners [
6,
7,
8,
9,
10]. This knowledge has been applied in the diabetic field, for example by Dasanayake et al. [
11]; by using an activity tracker worn on the wrist, they aimed to identify the onset and end of activities of a T1DM population before changes in blood glucose levels were induced. Jacobs et al. [
12] utilized an accelerometer and a heart rate sensor on the sternum to detect activity by estimation of the energy expenditure of T1DM patients and proposed a method to adjust hormone administration levels based on the identified activities.
However, these studies make use of sensor placements that do not coincide when using the AP™ system. It is unknown whether solely using a sensor combination placed on the hip and abdomen region still enables algorithms to identify postures and movements. Furthermore, it has not been analyzed before how the performance of an identification algorithm may be affected when accelerometers are placed on different locations of a specific body segment after model development. Finally, even though activity recognition has been applied in the diabetic field [
11,
12], postures were not taken into account, which are important to consider [
4].
Therefore, this research aims to investigate the possibility to use the current setup of the AP™ to identify several postures and movements using accelerometry as a first step in improving the hormone administration algorithm of the AP™ with respect to physical activity. During this research, we also investigated what the influence of varying locations of the sensors in the abdomen and hip regions was and the benefit of including additional sensors in the system was analyzed. The developed models for this identification algorithm should be as computationally sparing as possible due to the original system operating on batteries. Finally, for usability, the model should be as generalizable as possible, meaning a one-size-fits-all model structure was preferred if it was shown to perform better compared with tailor-made models.
4. Discussion
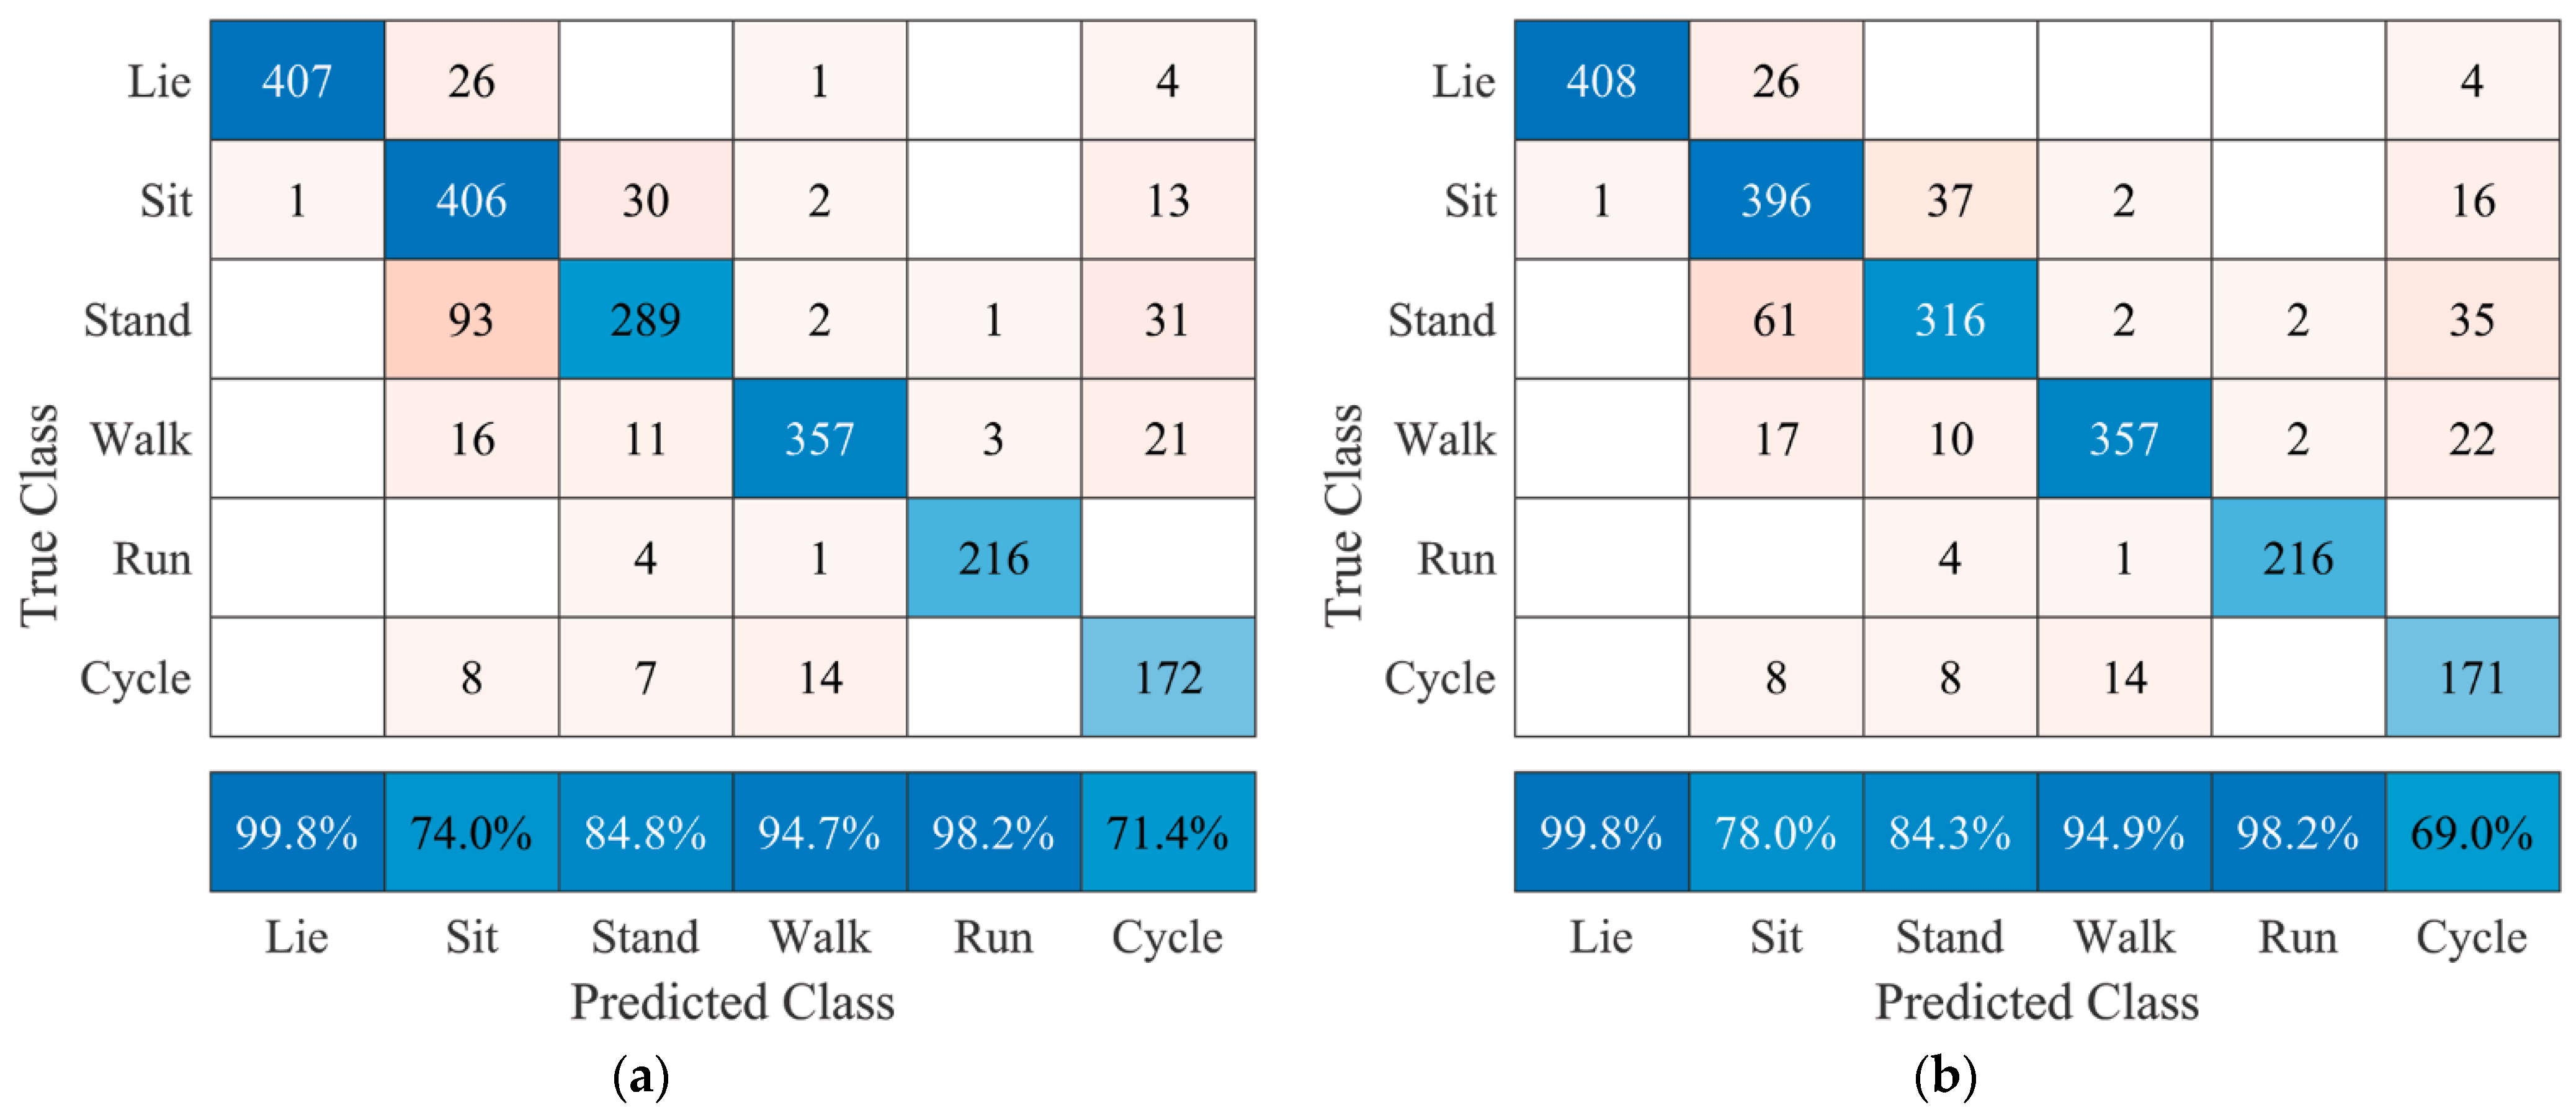
This research aimed to investigate the possibilities to identify postures and movements of human subjects using the current hardware design of the artificial pancreas (AP™) system. Using the standard AP™ and transmitter sensor placement whist sampling at 20 Hz, user-specific models achieved classification accuracies of 86.5% without transmitters and 87.3% with transmitters. Comparing these results with a sensor combination including additional sensors for identification, a nonsignificant result of 90.0% accuracy was achieved. Therefore, from these results it can be said that the current hardware configuration either with or without using transmitters poses no limitation to performing the proposed classification task and that including extra sensors in the system may be beneficial for classification accuracy in terms of improved posture recognition.
Even though this research cannot be exactly compared, generally speaking this identification algorithm performs in a manner comparable to or better than other studies. However, the reported studies were limited in the sense that not all mentioned postures and movements (i.e., lying, sitting, standing, walking, running, and cycling) were classified in cases that were most similar to this research. Overall, the research by Curone et al. [
9] reported an average accuracy of 96.2% using a sensor on the sternum and a simplified classification paradigm by assigning several postures and activities to one class. For example, standing upright and sitting down were assigned to the class “upright standing”. This means their model performance is expected to be diminished without this simplification, as was the case during our research. Furthermore, Fortune et al. [
10] reported being unable to distinguish sitting from lying using an accelerometer on the waist, which during our research was possible with a positive predictive value of 74% using a sensor on the hip. Their research reports positive predictive values for lying, standing, walking, and running of 97%, 71%, 76%, and 100%, which our algorithm outperforms with positive predictive values of 99.8%, 84.8%, 94.7%, and 98.2%, respectively, when using a sensor on the hip.
Specific placement of the AP™ sensor after training the models is critical. Training and testing user-specific models based on data of sensor location 3 resulted in a classification accuracy of 86.5%, whereas testing on data of sensor locations 4 or 5 resulted in significantly lower classification accuracies of 78.1% and 75.6%, respectively. On the other hand, varying transmitter locations have shown to be of no significance, where the highest and lowest classification accuracies of 87.3% and 85.3%, respectively, were observed. This result suggests that changing transmitter locations after training does not significantly alter the model’s performance. Furthermore, a significant decrease in classification accuracy due to varying the AP™ sensor placement was no longer observed when data of the transmitters were included, as can be seen in
Table 8. Thus, data from the transmitters, placed on the abdomen, will provide a stable factor for the identification algorithm when combined with data from the AP™ sensor.
For easier implementation, it is preferred to have a generalized model that is applicable to a broader user spectrum. Comparing results between user-specific and generalized models indicates that performance significantly decreases when adopting a generalized form in all cases. It should therefore be carefully considered whether the loss in classification accuracy is acceptable when the algorithm is implemented in the generalized form.
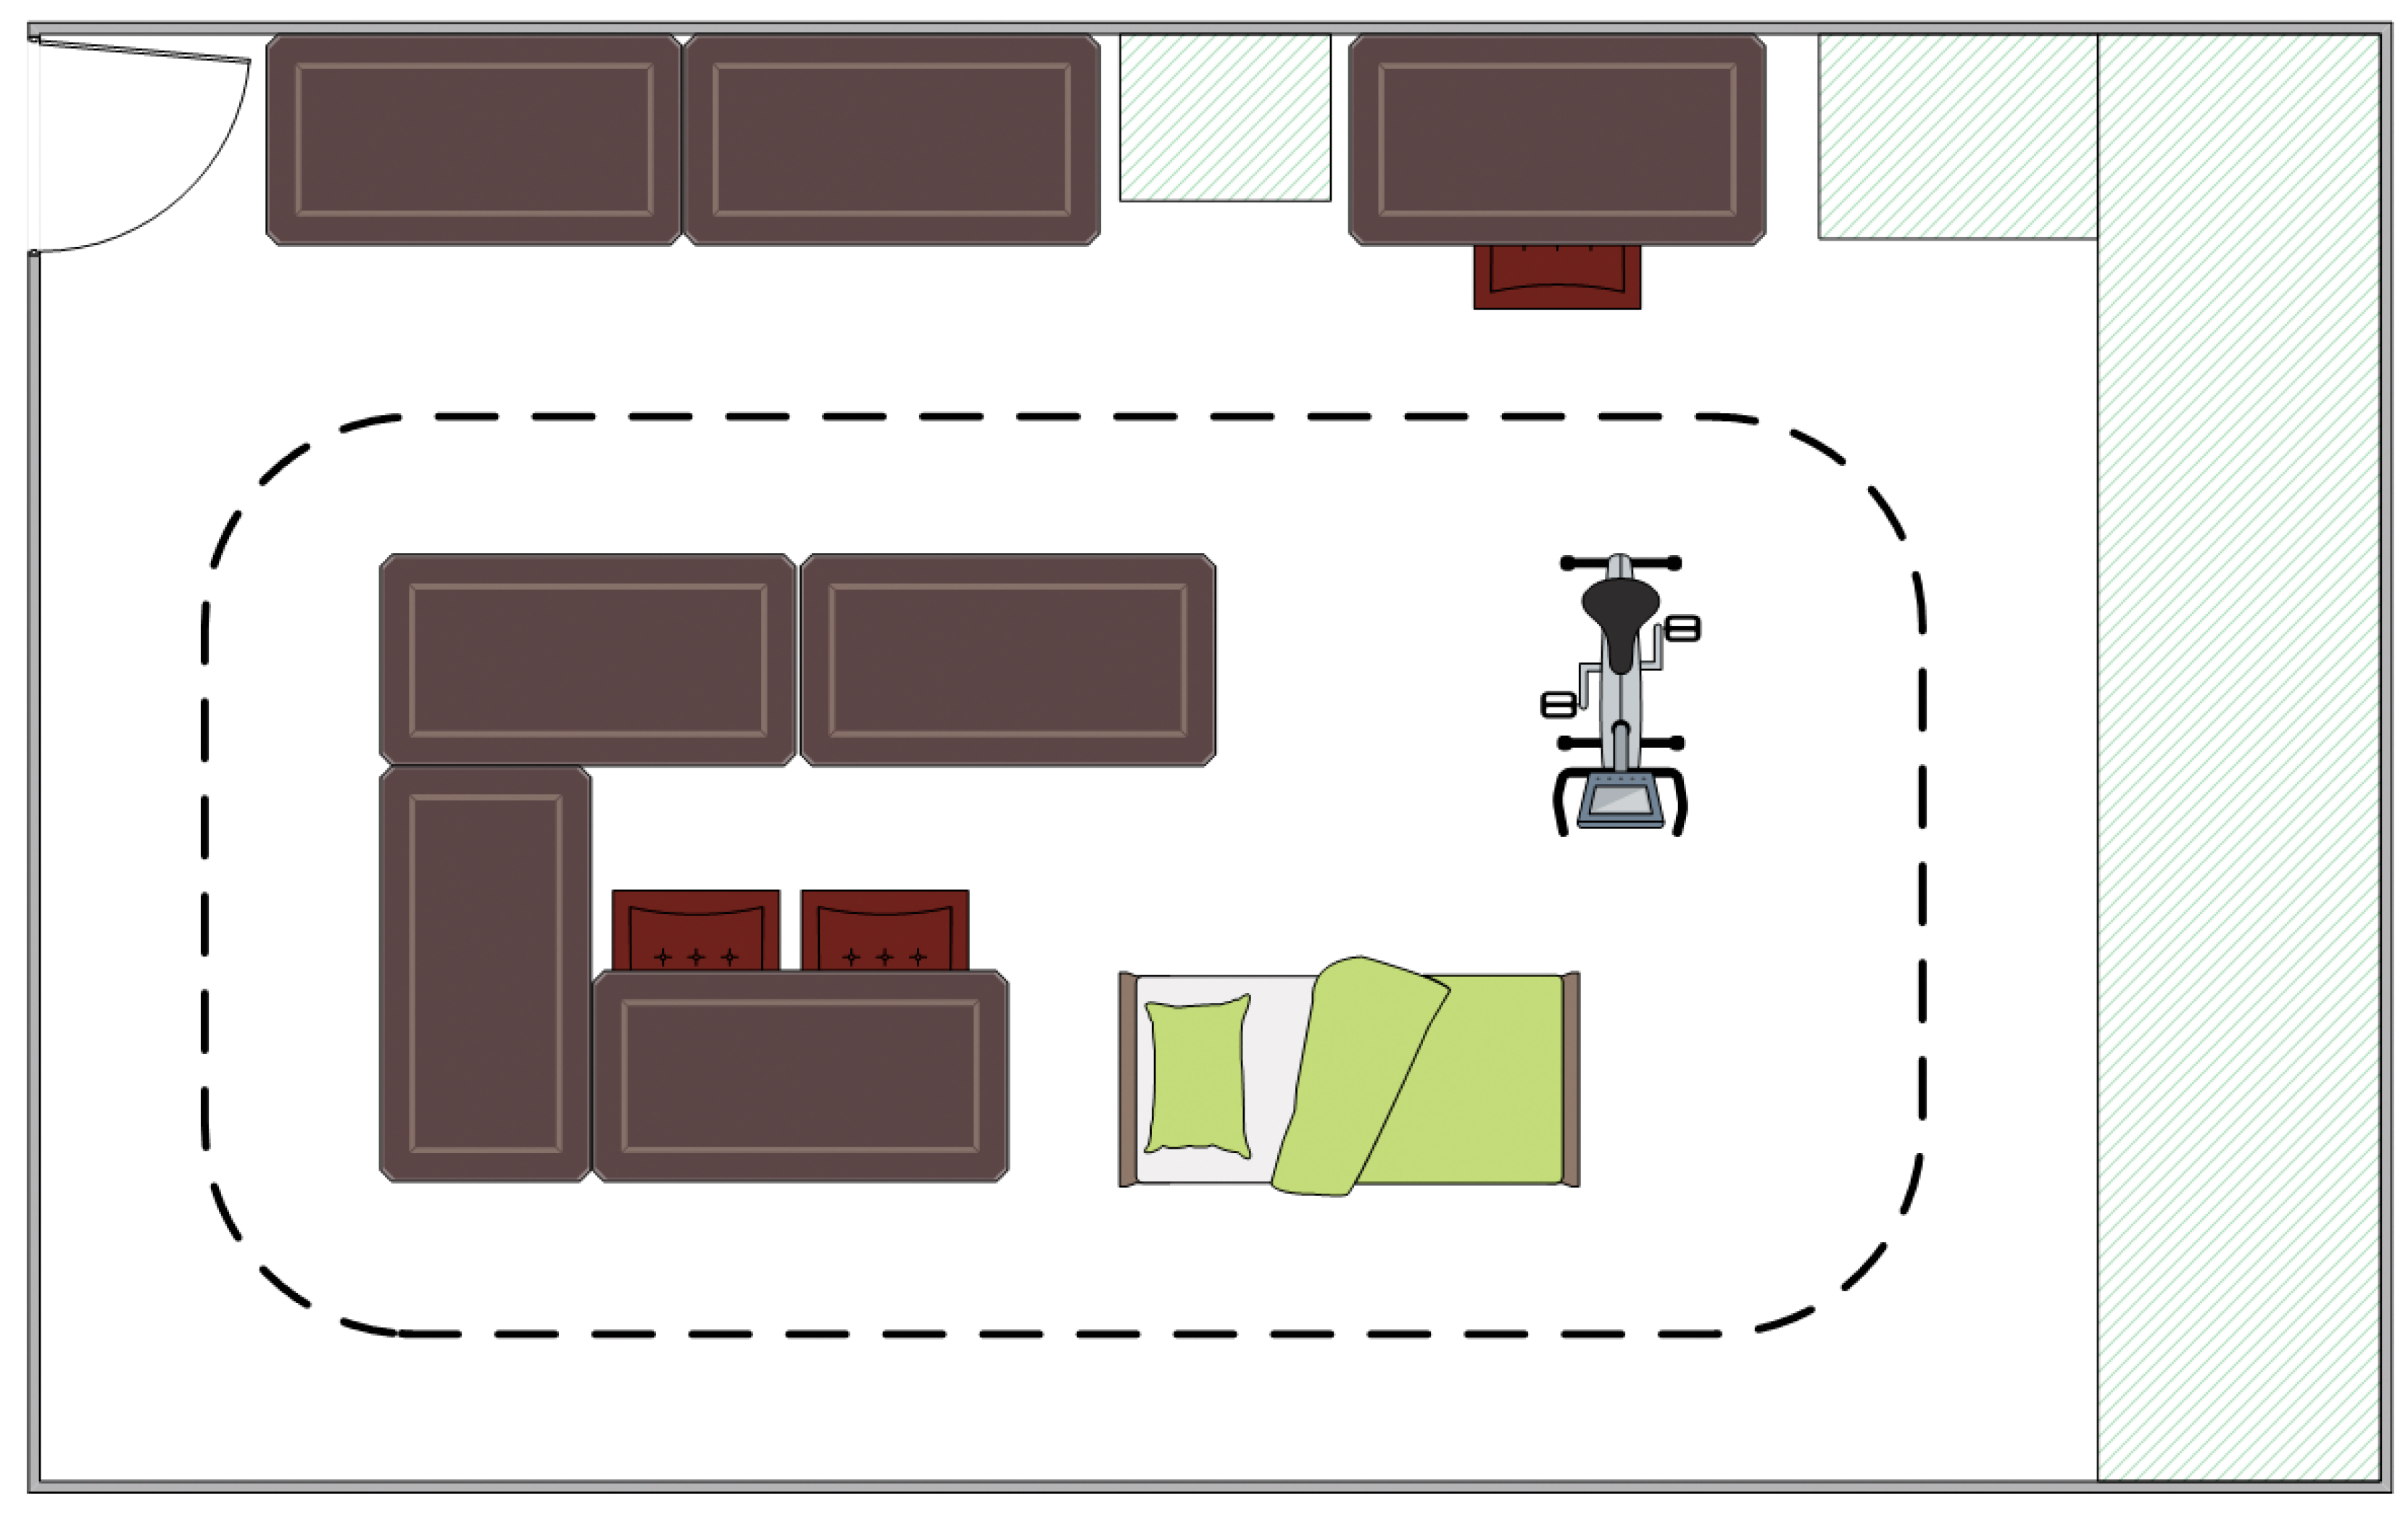
The experiment was performed in a controlled lab environment that does not naturally translate to recognition of postures and movements when performing actual daily life activities for a prolonged period. During the experiment, the least active movement measured was cycling, as it was performed on a statically placed home trainer. This affects the minimum threshold to distinguish postures from movements, which is expected to be lower compared with performing daily life activities. This means the reported classification accuracies might be higher when accounting for the minimum threshold during movements in daily life, which is expected to be higher compared with performing movements in an experimental setting. Furthermore, the experiment consisted of short posture and movement sequences, where the subject had to change from one to another in quick succession. These transitions pose a challenge for the algorithm as during a 10-s window, several postures and/or movements are performed and thus the chance of misclassification is higher compared with performing one posture or movement during this 10-s window. During daily life, these transitions are expected to occur less frequently than during the experiment, meaning the algorithm is expected to perform better during a daily life implementation.
Prior to the experiment, subjects were subjected to a calibration phase, which has to be performed to represent the sensor data in a coordinate system that relates to the segment it is attached to, regardless of orientation [
15]. Even though this is beneficial for model performance, an explicit calibration is unfeasible when the algorithm is implemented for daily life as the AP™ sensor may vary in location throughout the day and transmitter sensor locations after a few days. Performing a calibration after any sensor adjustment may be tiresome for the end-user. Therefore, it should be investigated whether an autocalibration algorithm without initial information regarding sensor placement is a solution to this issue. By performing a continuous implicit sensor-to-segment calibration, the end-user will not be burdened with this task each time the position of a sensor is changed.
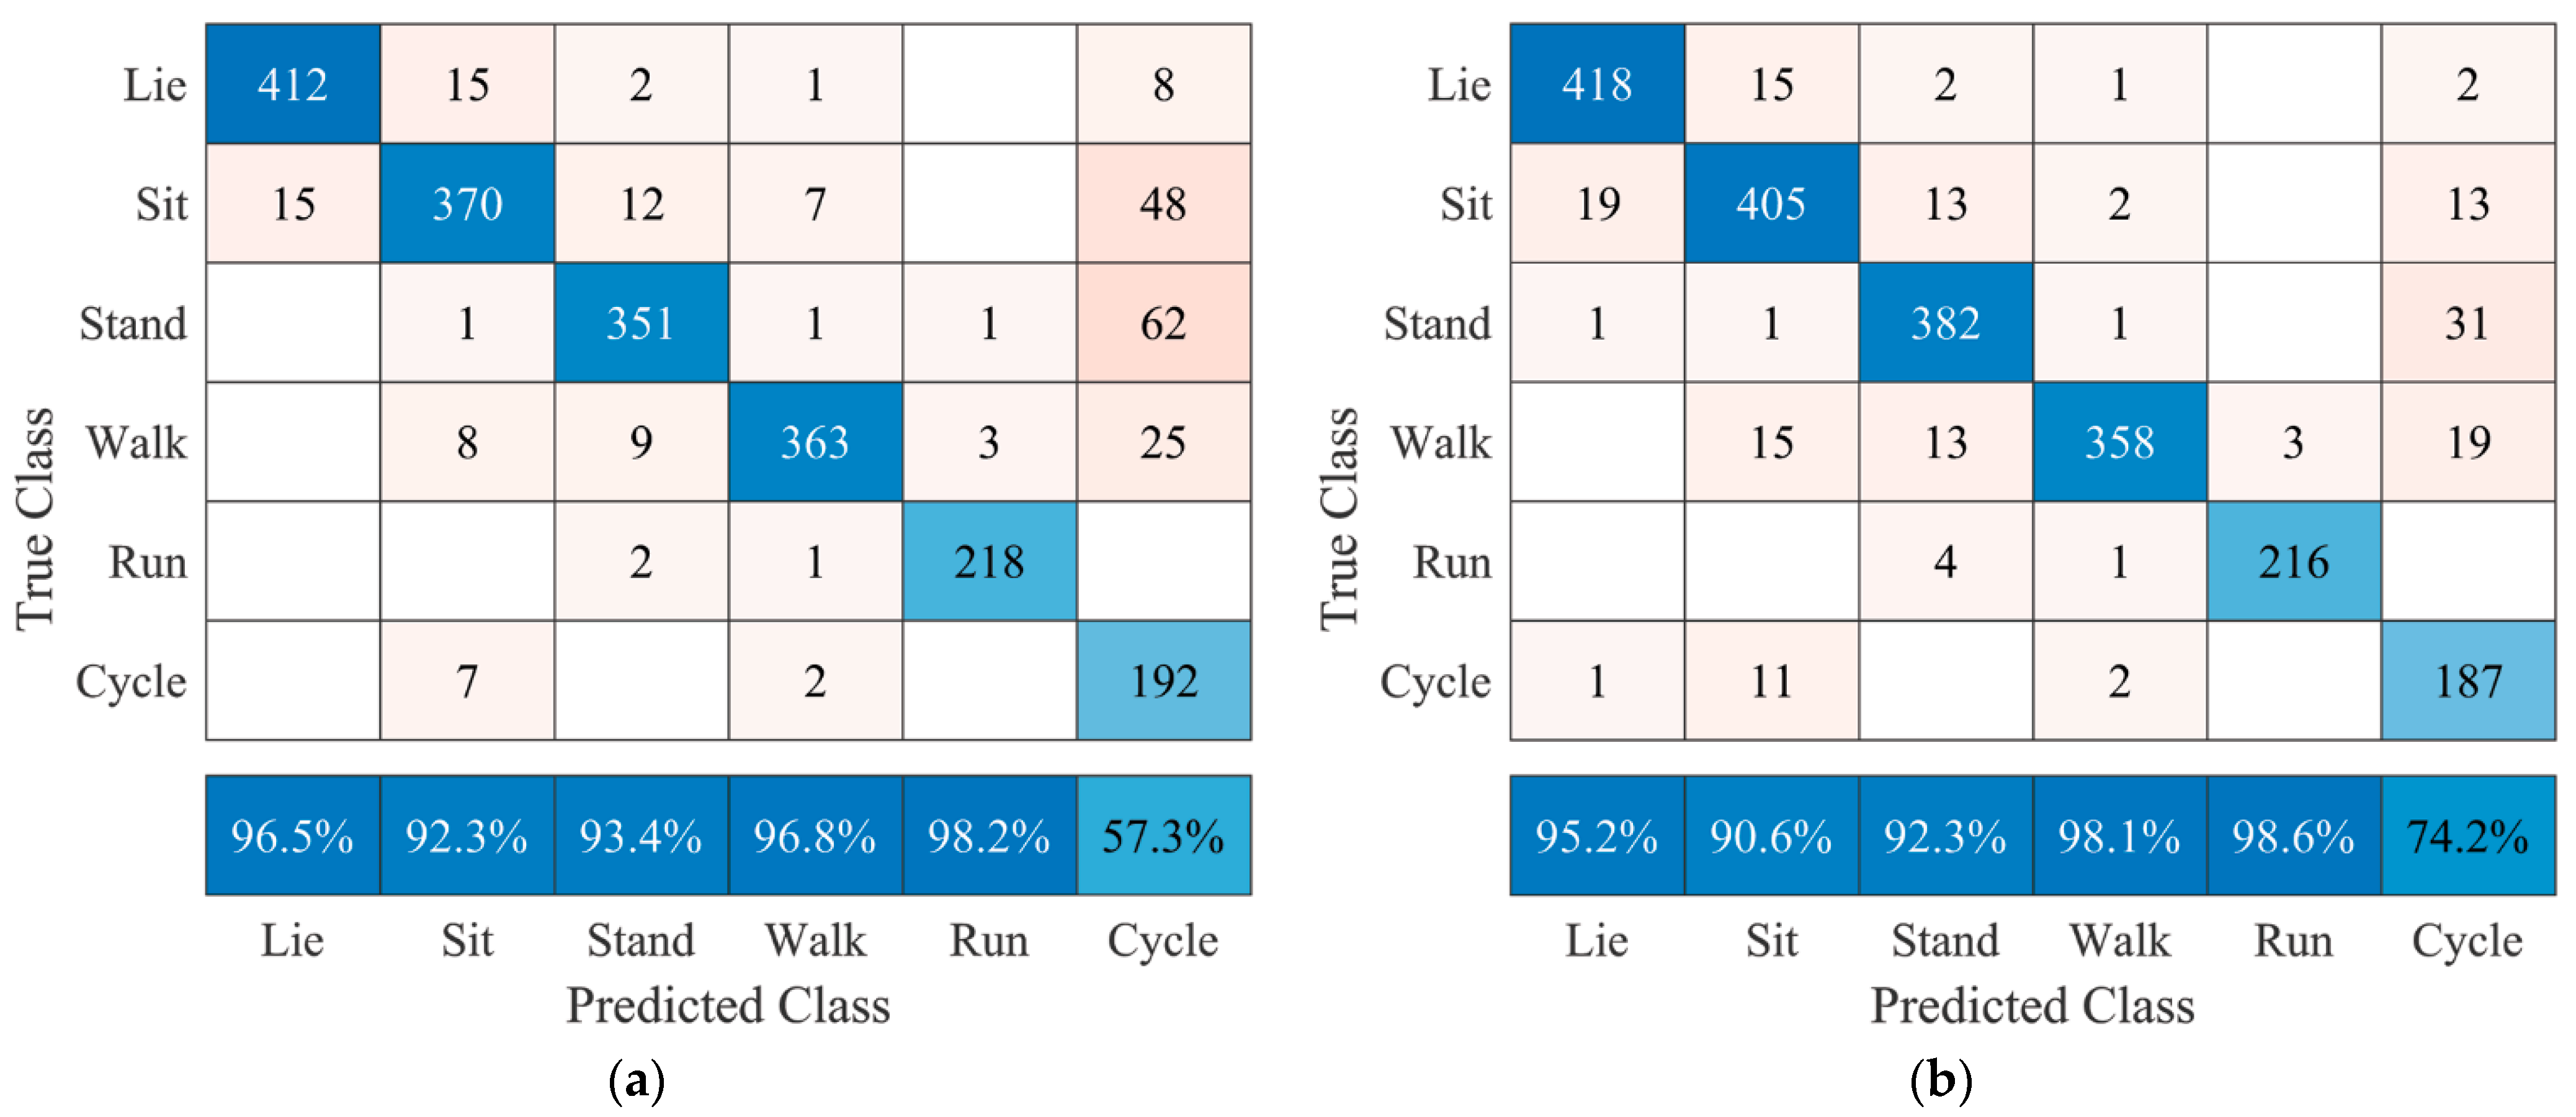
The final factor that should be considered when implementing this algorithm in the AP™ system is the fact that standing and sitting are difficult to distinguish without using additional sensors 1 and 2, as seen in
Figure 5 versus
Figure 6. Based on the interests of the end-user and manufacturer, these two postures could be regarded as one as they are expected to have no different influence on blood glucose levels. Lying is a key posture, as it is the general posture a human adopts when sleeping, which may influence blood glucose levels via the dawn phenomenon [
4] and should thus be regarded separately. This simplification of classification should also improve classification accuracies.
To validate these expected performance changes of the algorithm, longitudinal human activity data using a wearable sensor setup should be gathered, which in turn are to be used for the analysis of posture and movement recognition in a daily life setting. In addition to this activity classification, an estimation of the metabolic consumption rate is to be performed as different activity magnitudes are related to different changes in blood glucose levels [
3]. In the case of performing movements, the metabolic costs may relate to the standard deviation and frequency content of the accelerometer signals [
5,
16]. Therefore, additional (literature) research has to be performed to investigate how postures and movements relate to metabolic energy consumption and thus blood glucose levels, such that ultimately the blood glucose regulation in the AP™ can be changed according to this posture and movement identification algorithm.


