
Fingerprint Feature Extraction for Indoor Localization †


Abstract
:1. Introduction
2. Related Work
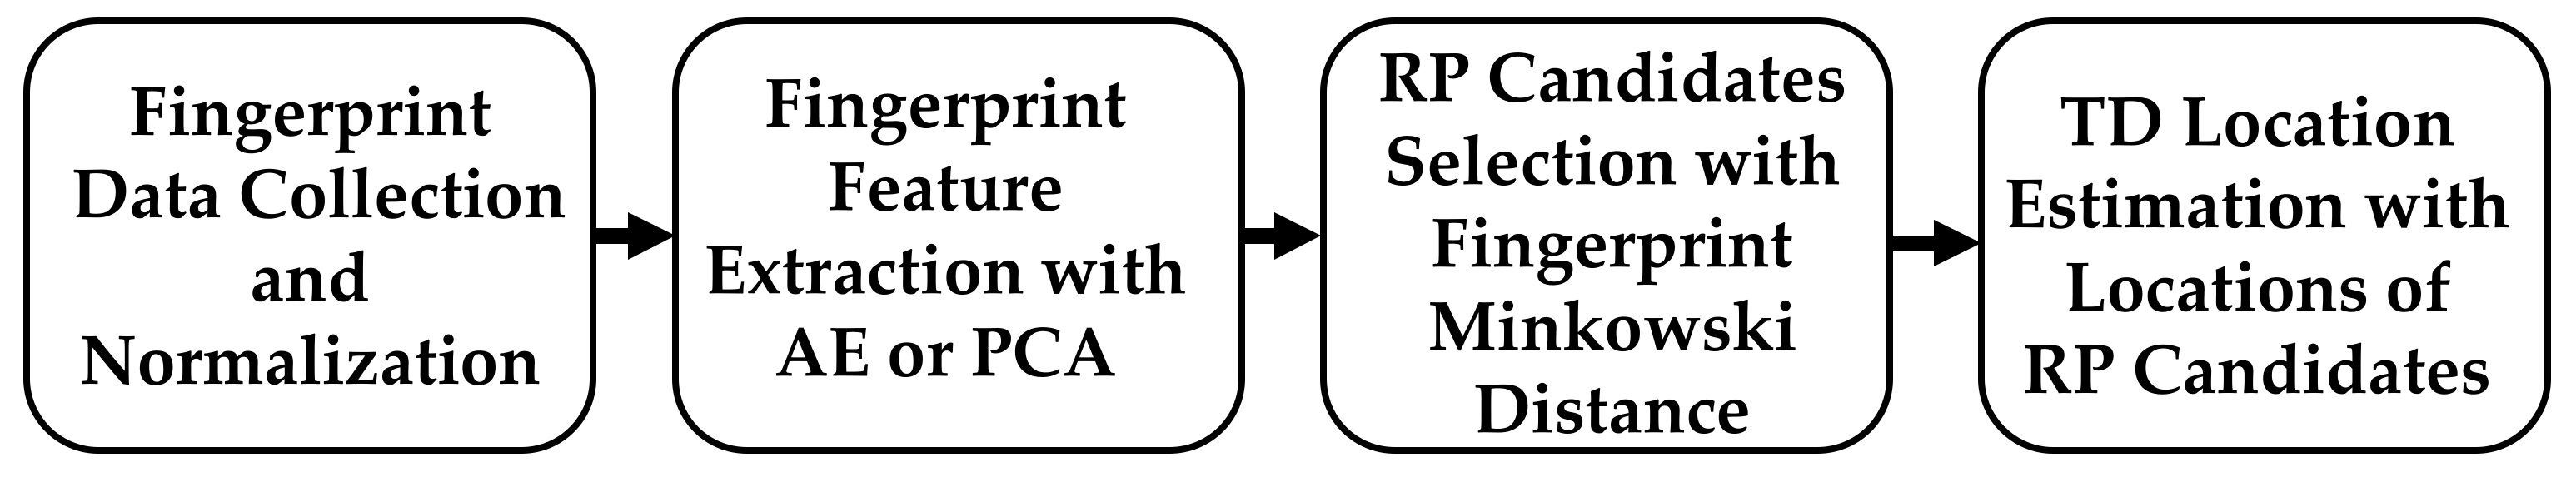
3. Proposed Method
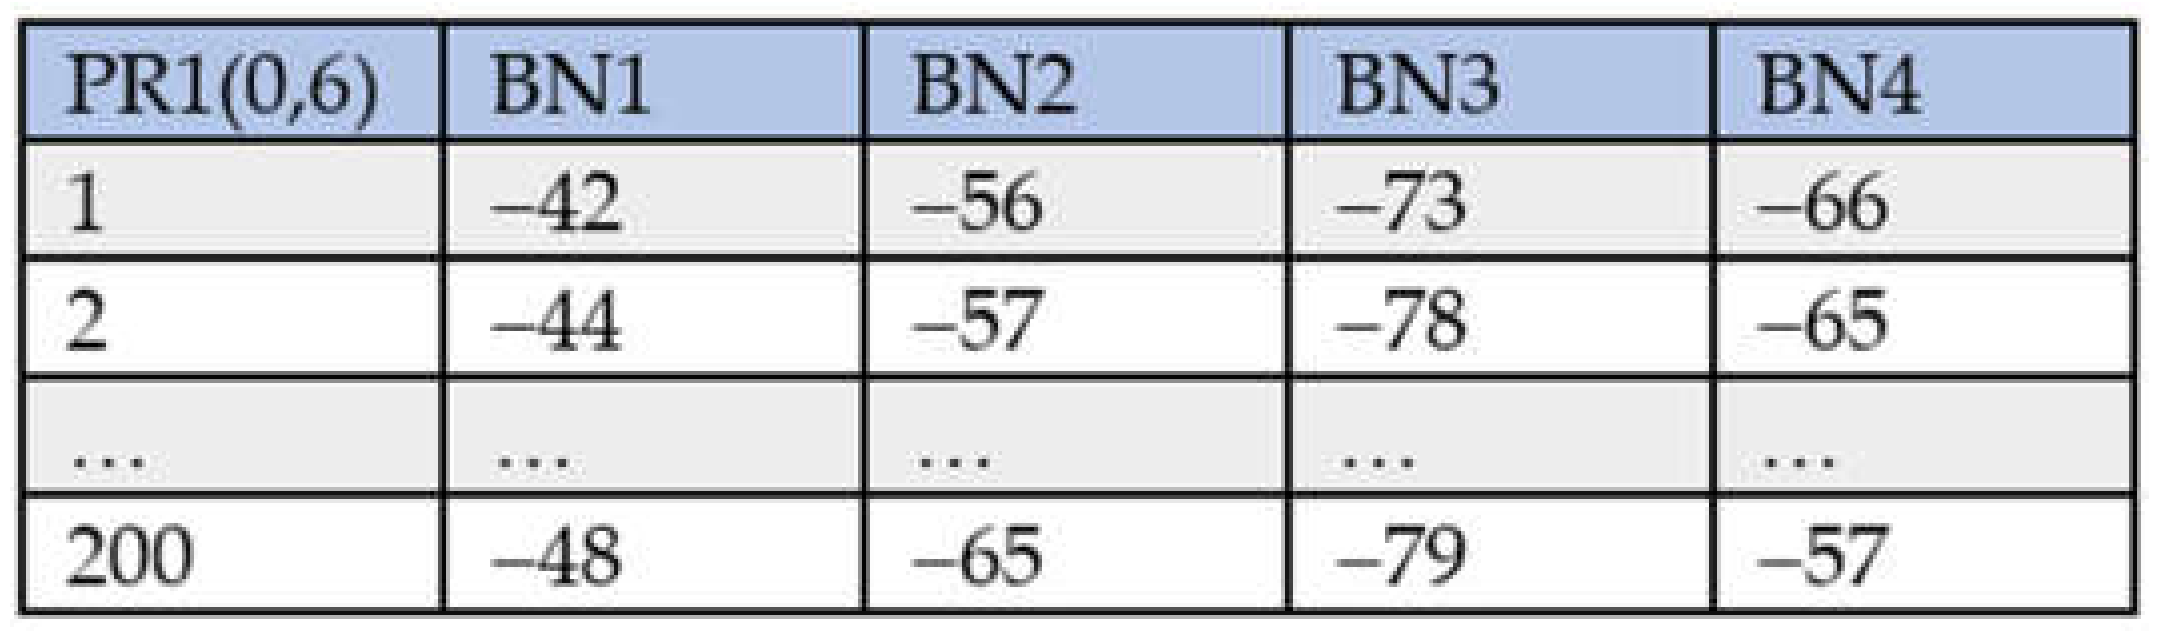
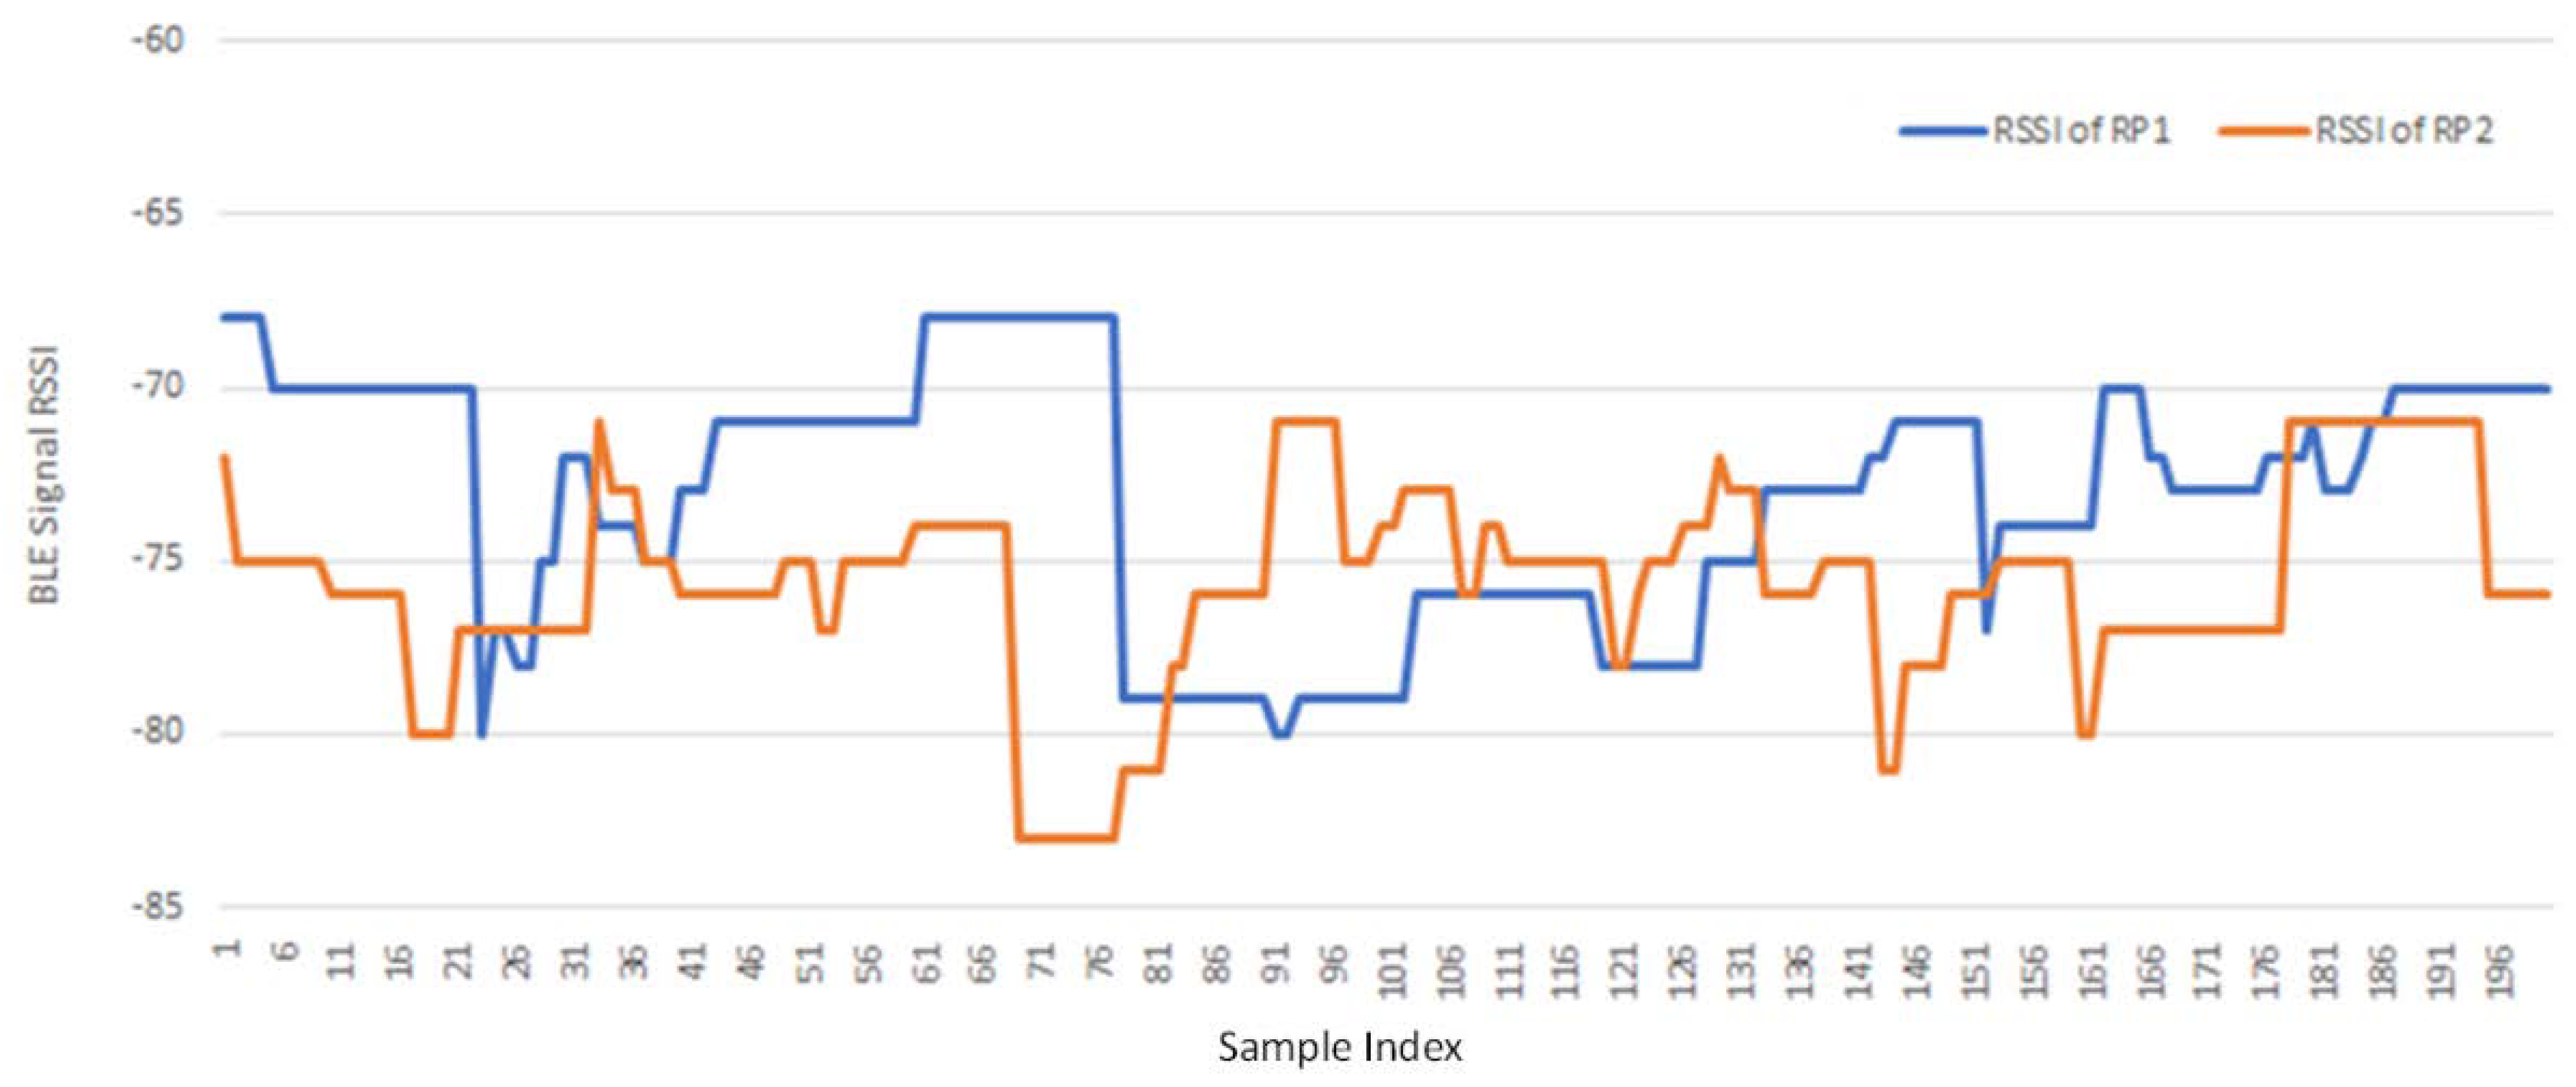
3.1. Fingerprint Data Collection and Normalization
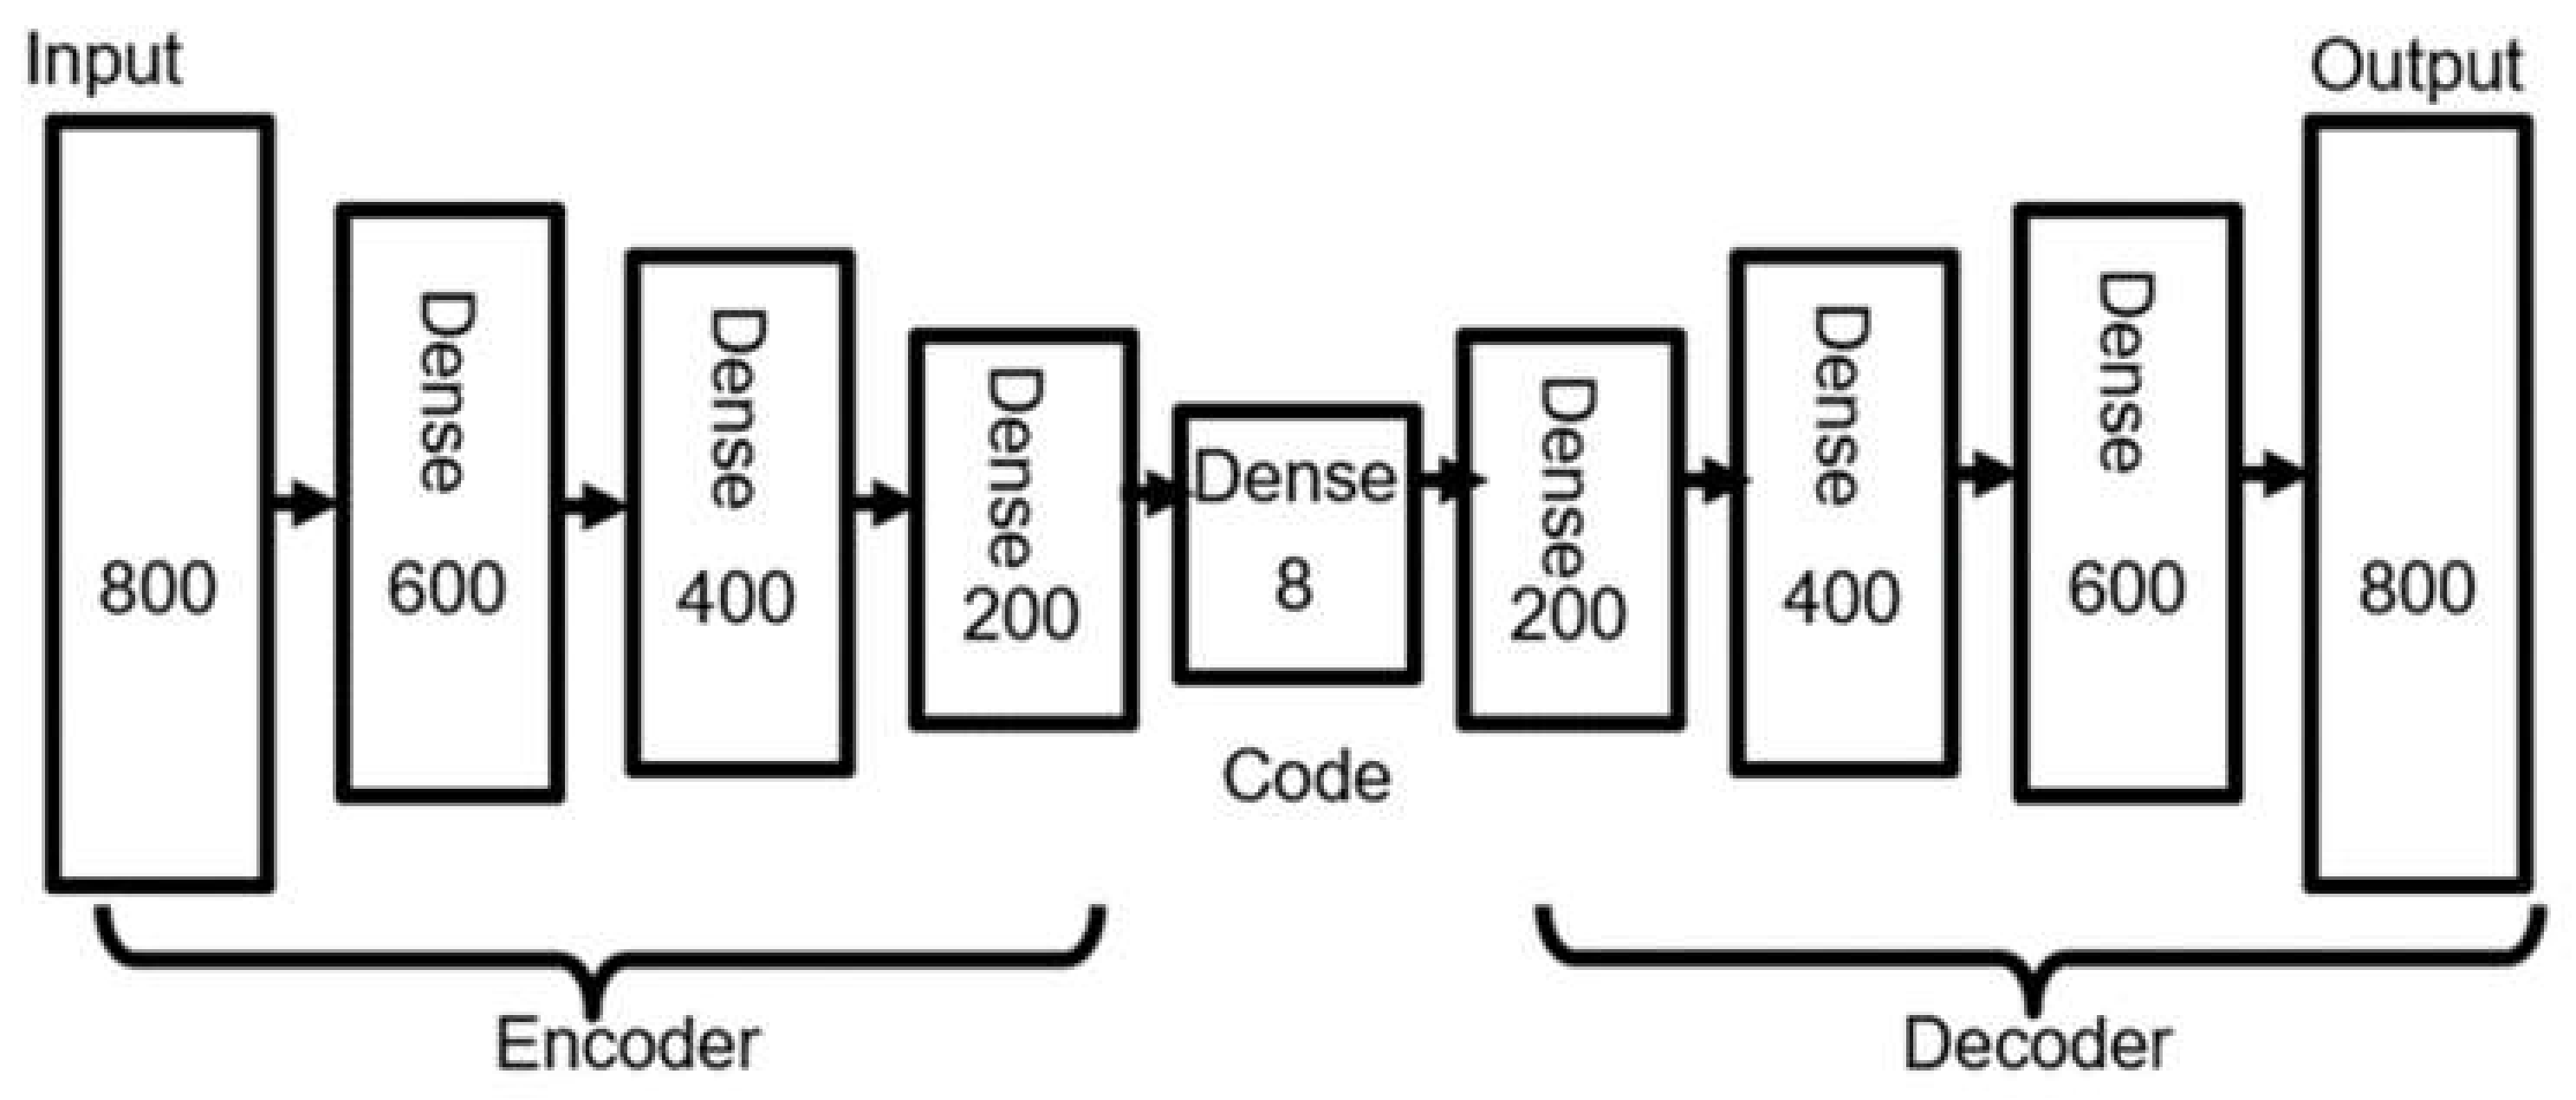
3.2. Fingerprint Feature Extraction with AE or PCA
3.2.1. AE Feature Extraction
3.2.2. PCA Feature Extraction
3.3. RP Candidates Selection with Fingerprint Minkowski Distance
3.4. TD Location Estimation with Locations of RP Candidates
4. Experiments, Performance Evaluation, and an Application
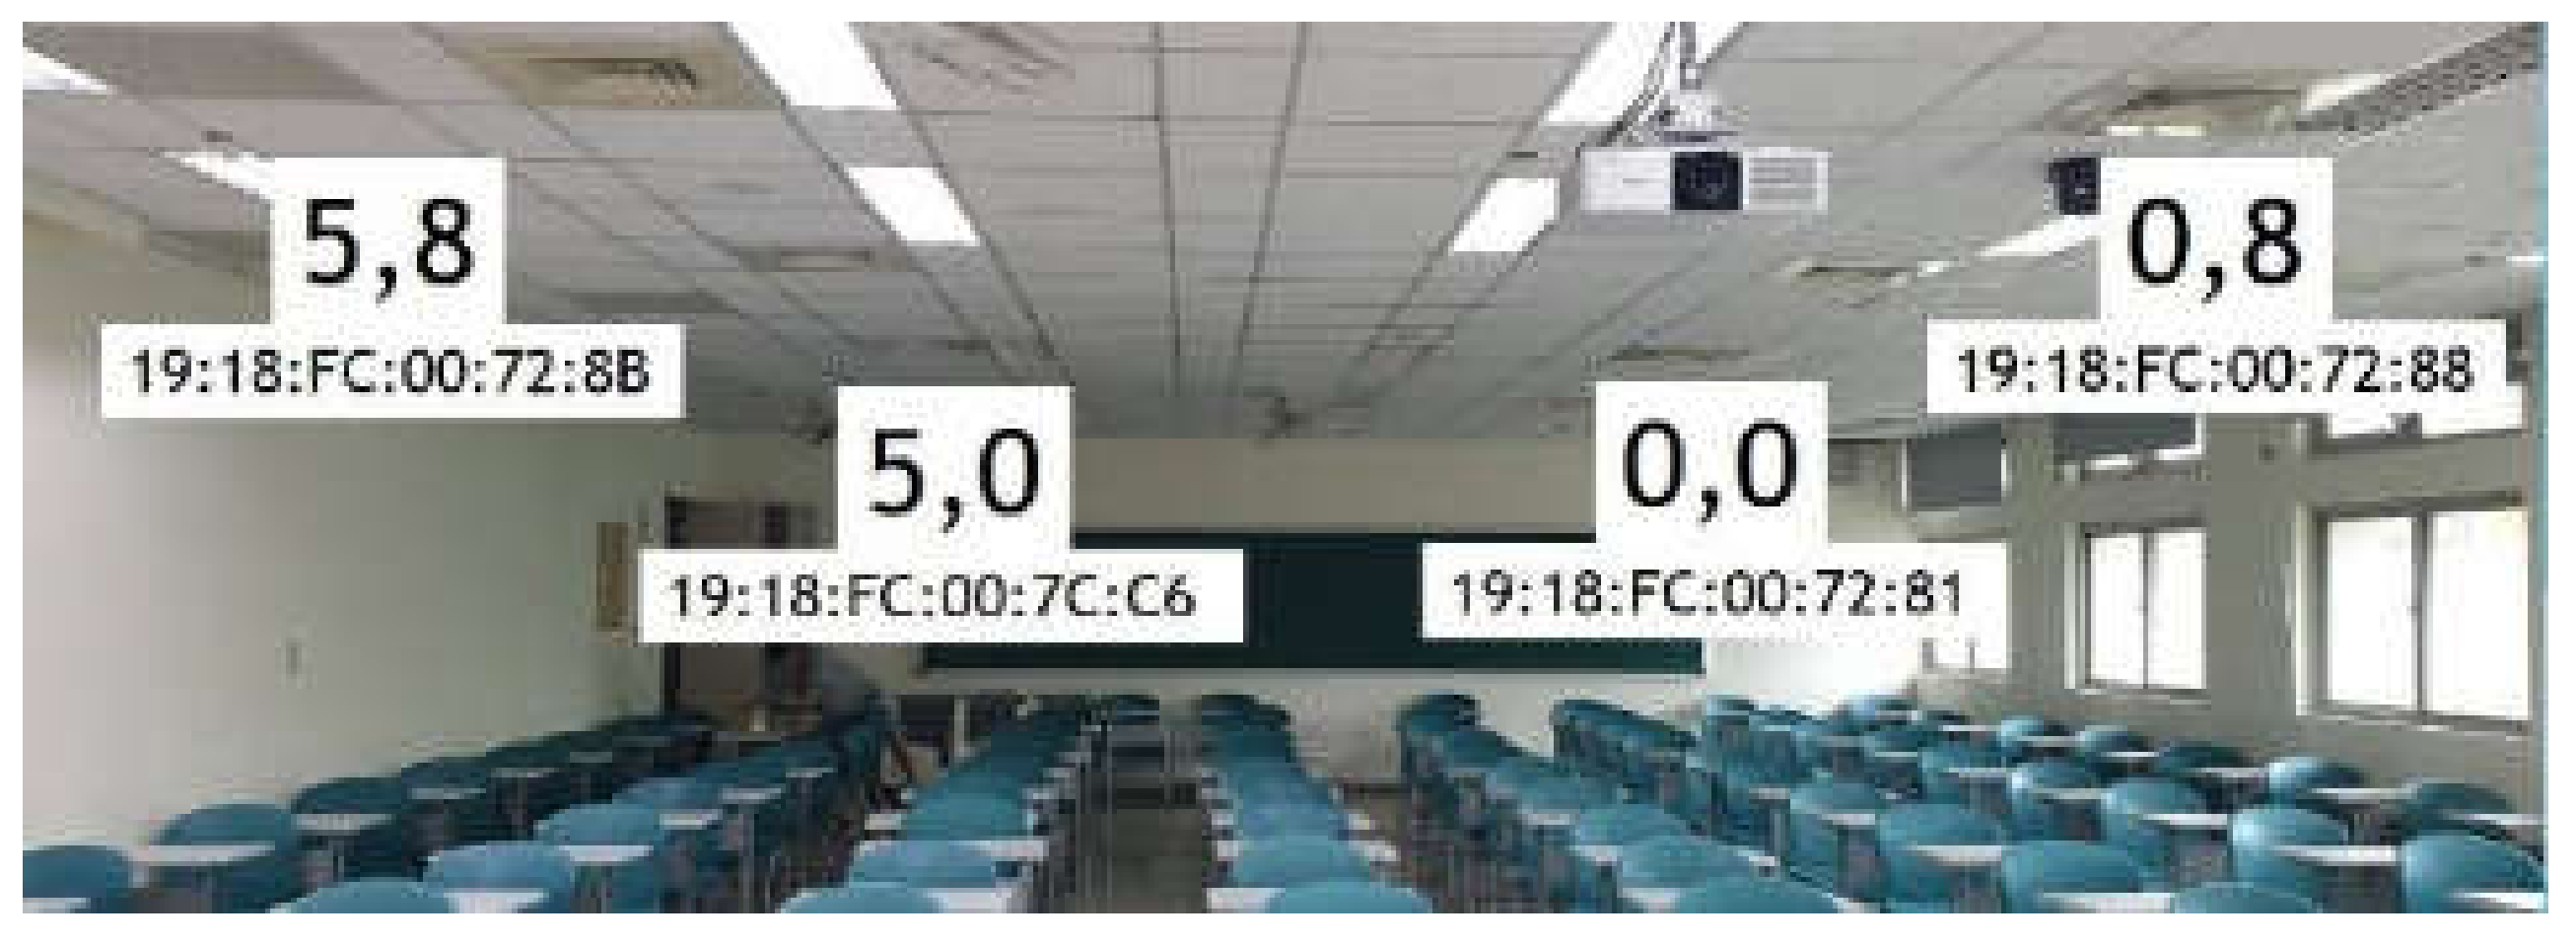
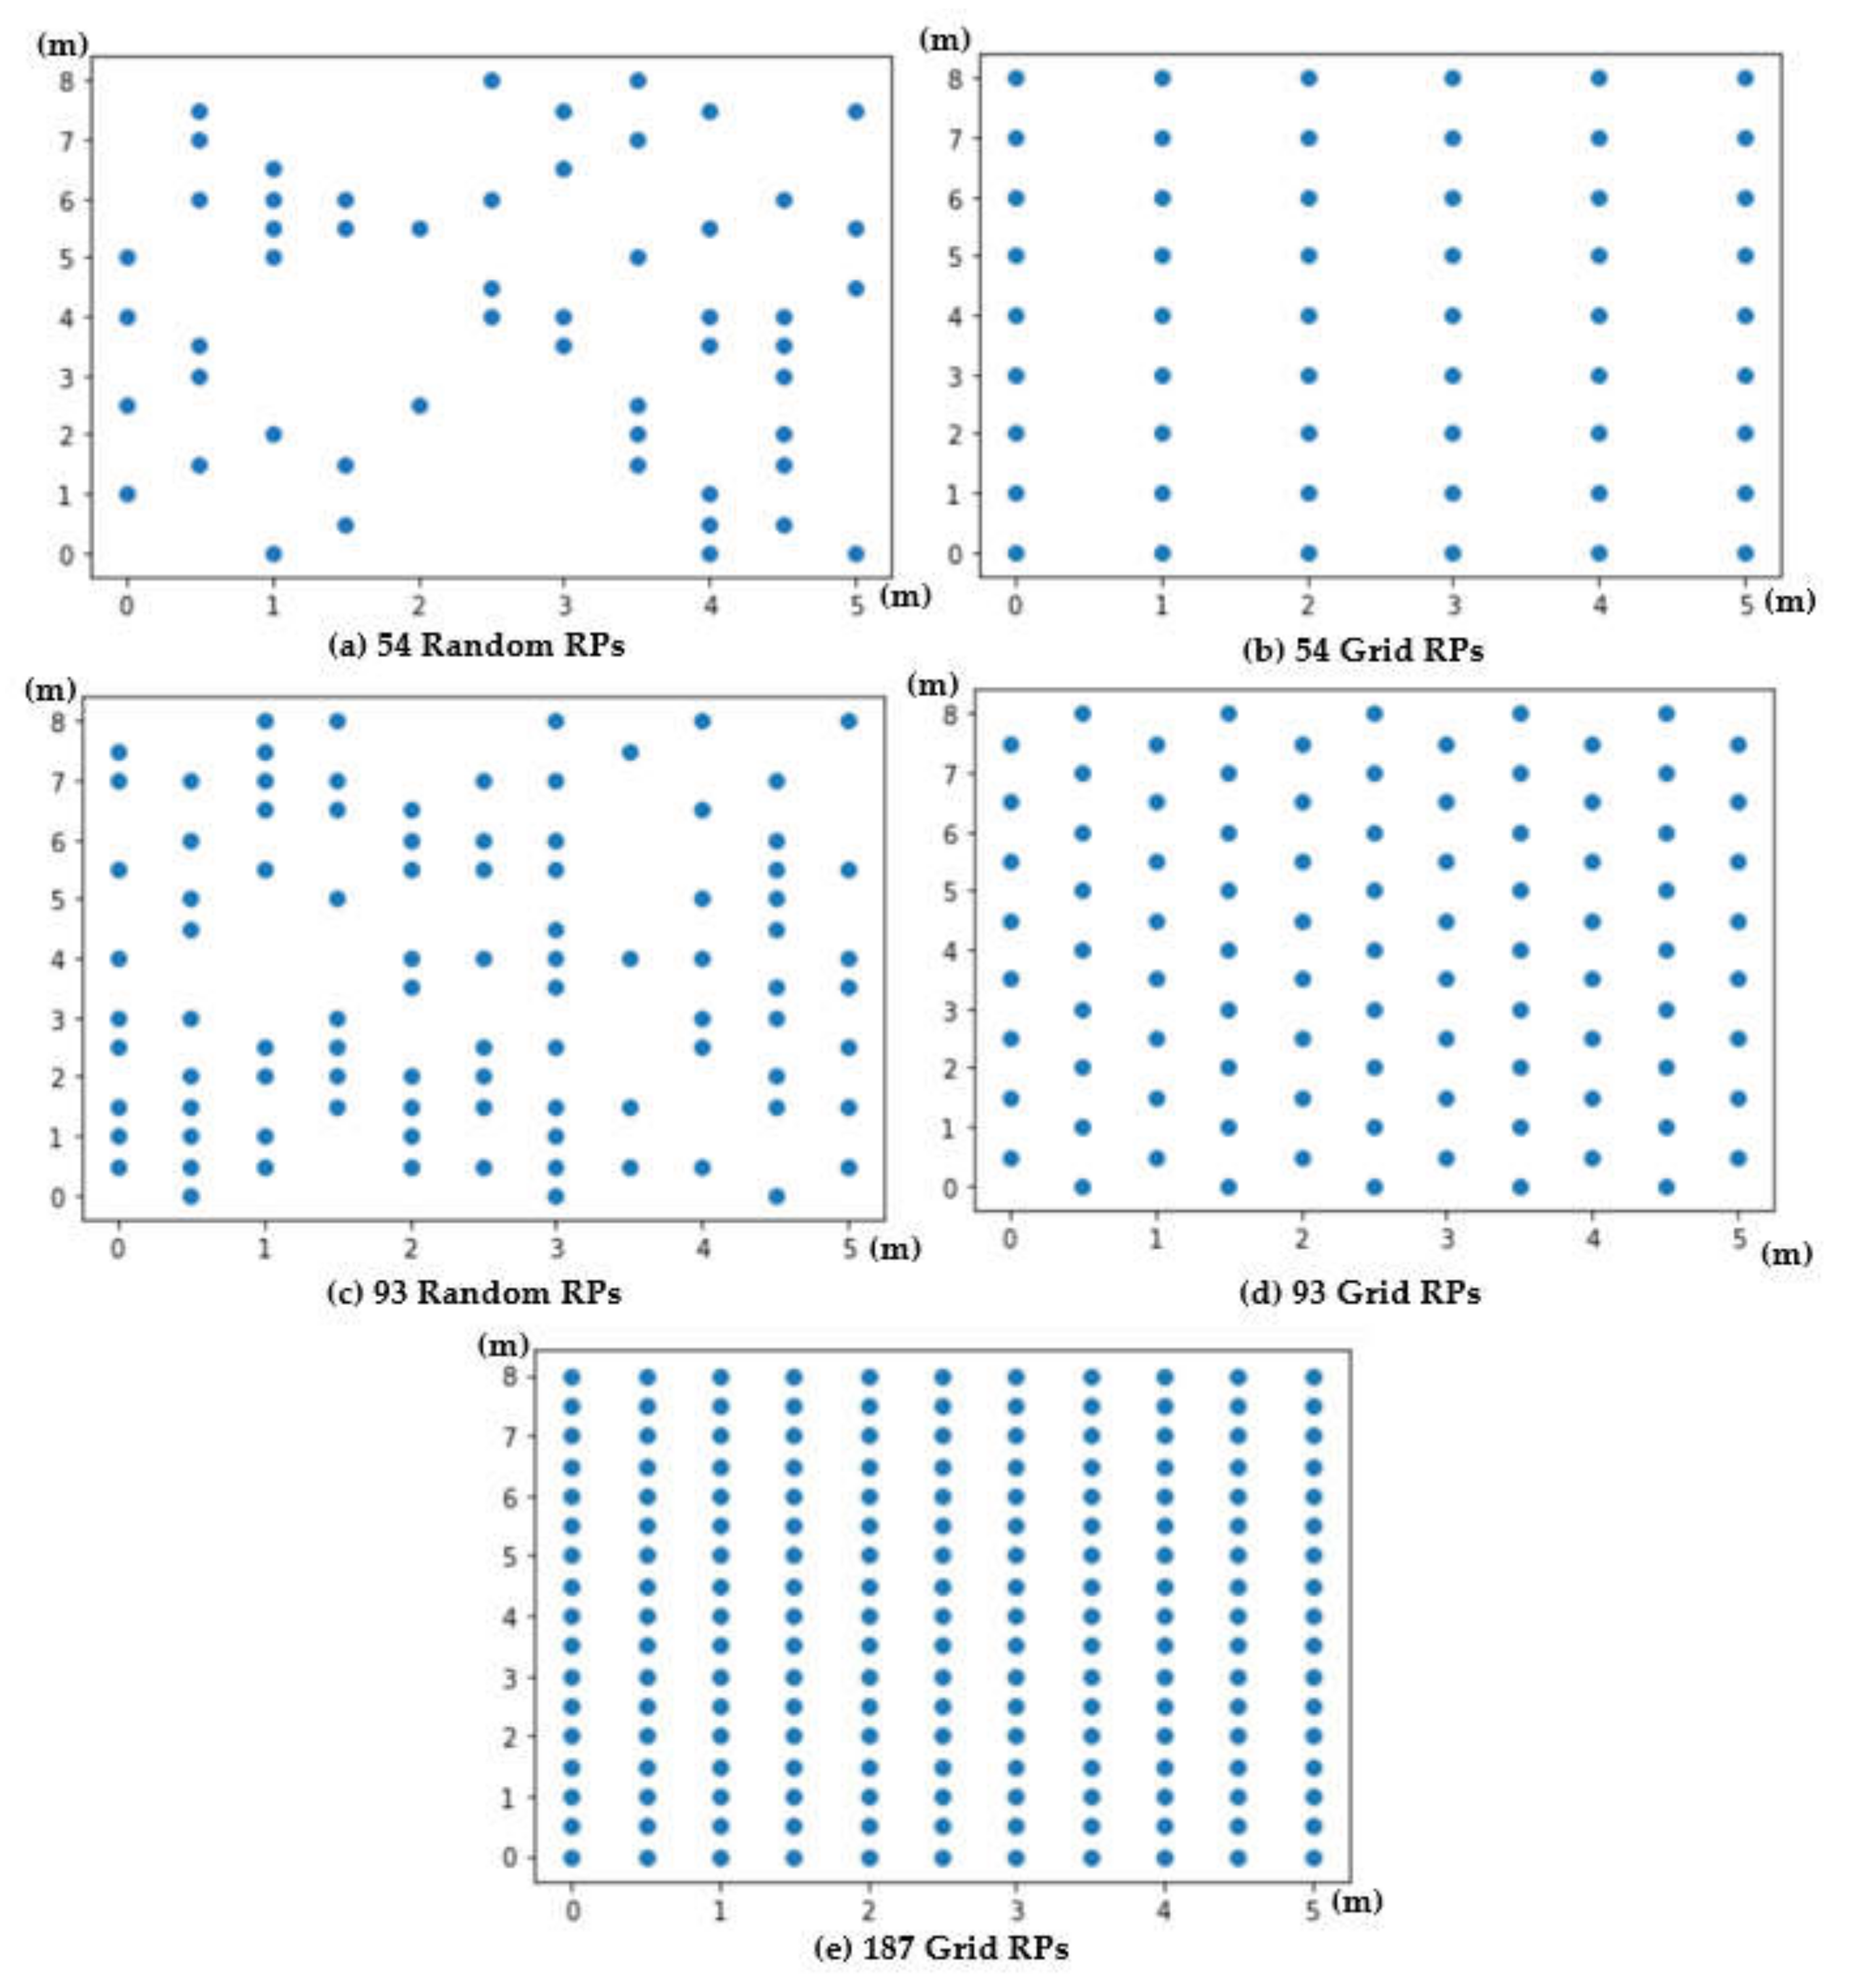
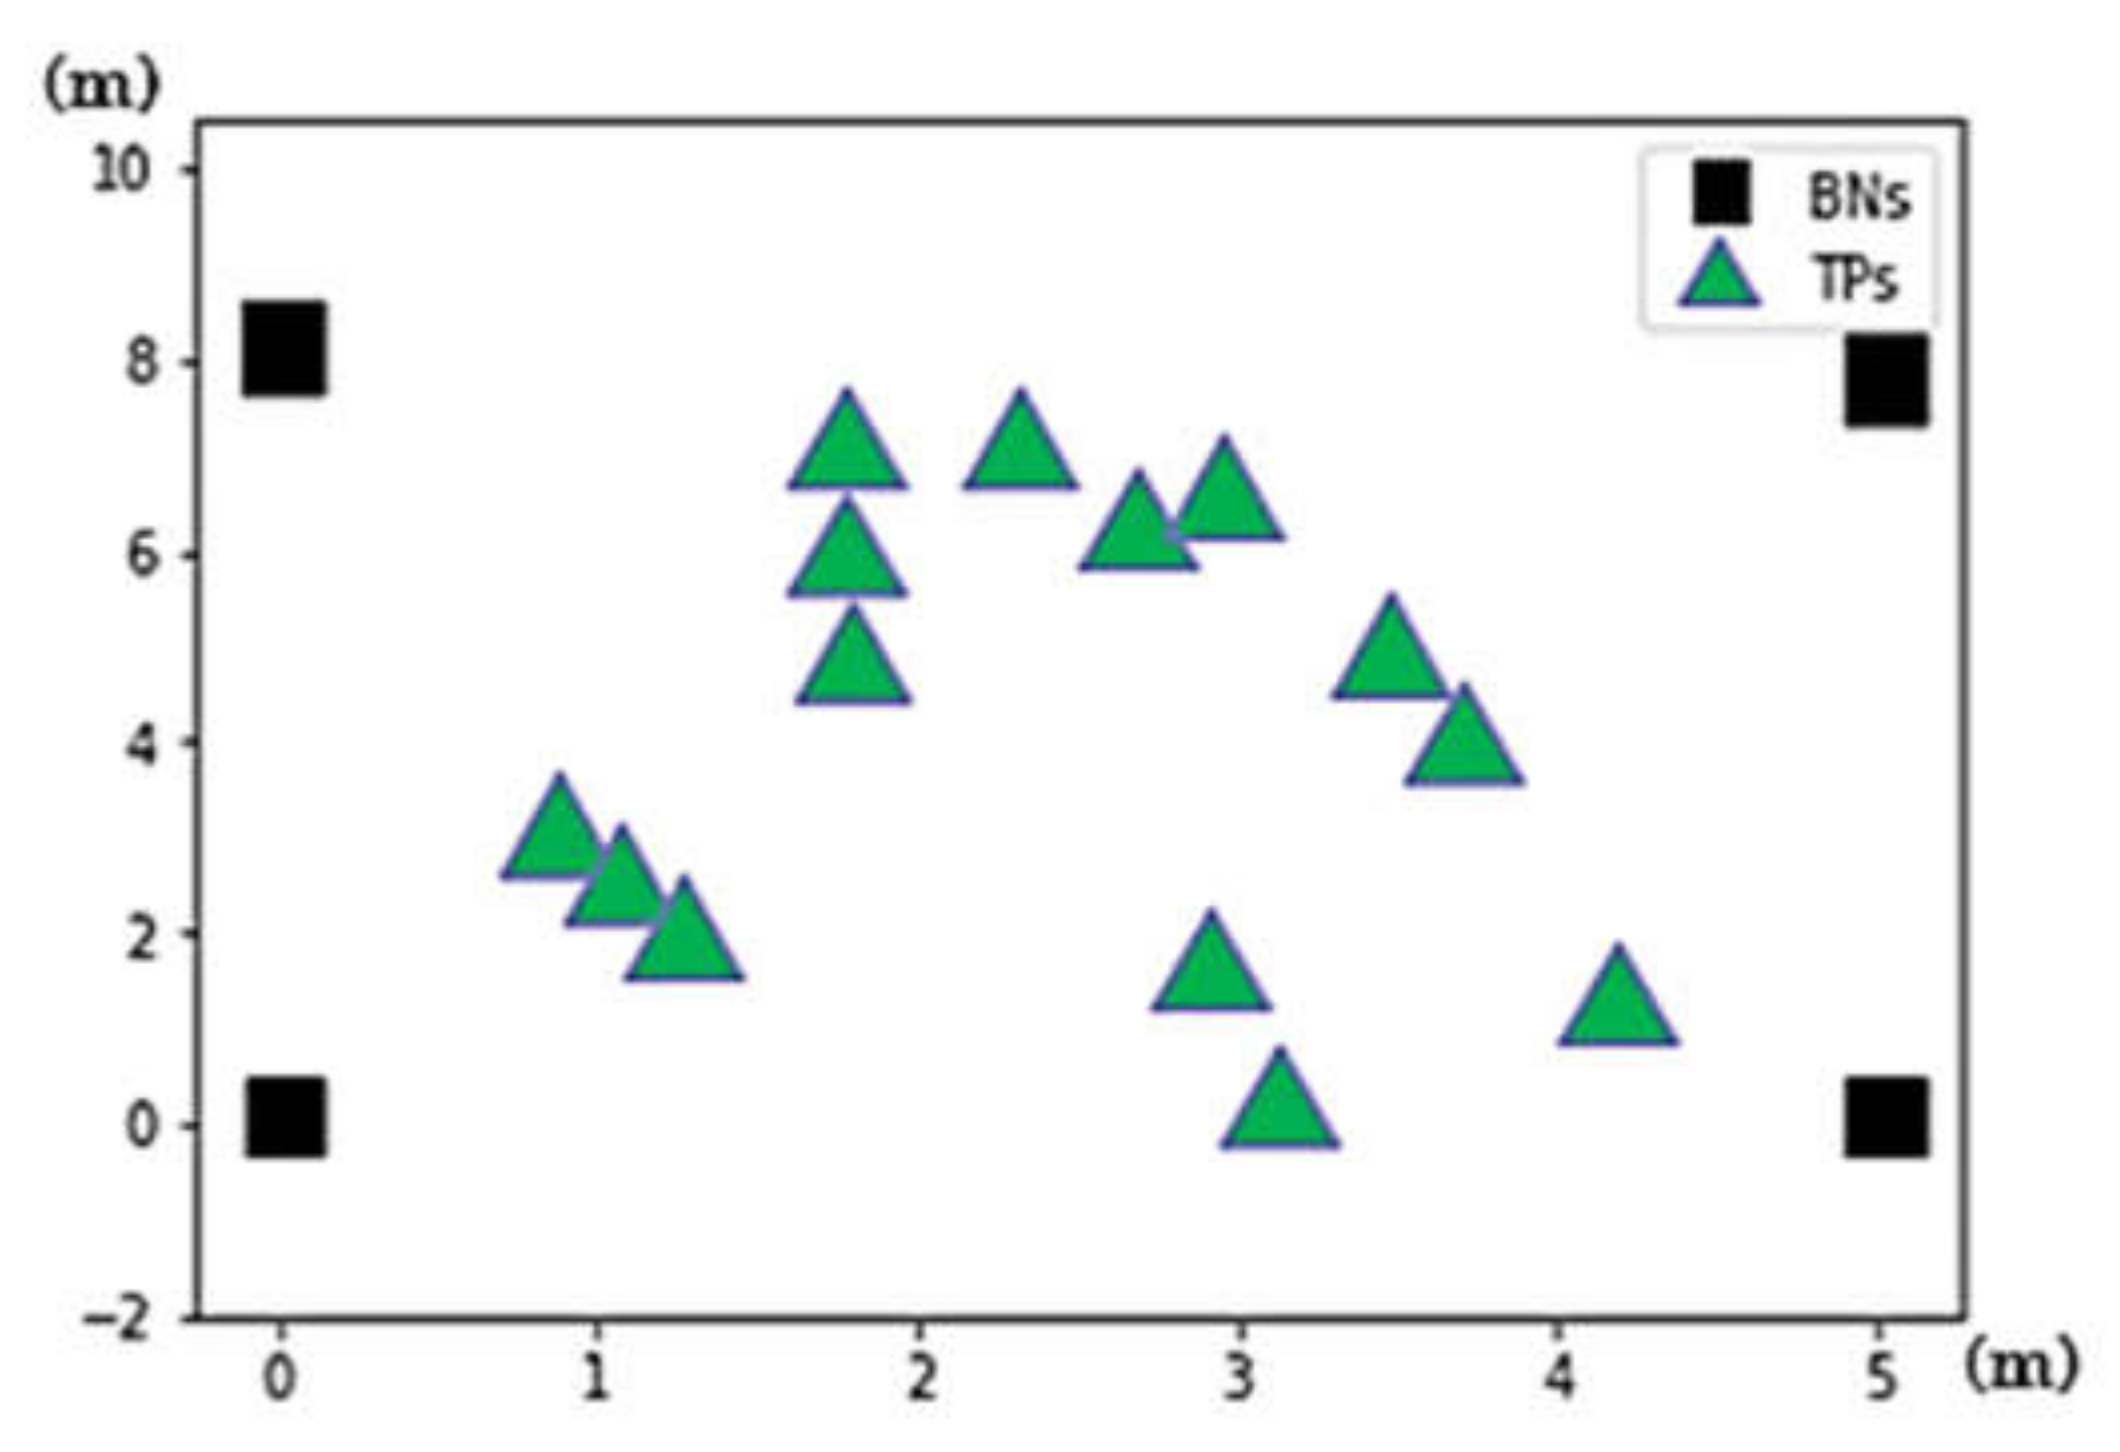
4.1. Experimental Settings
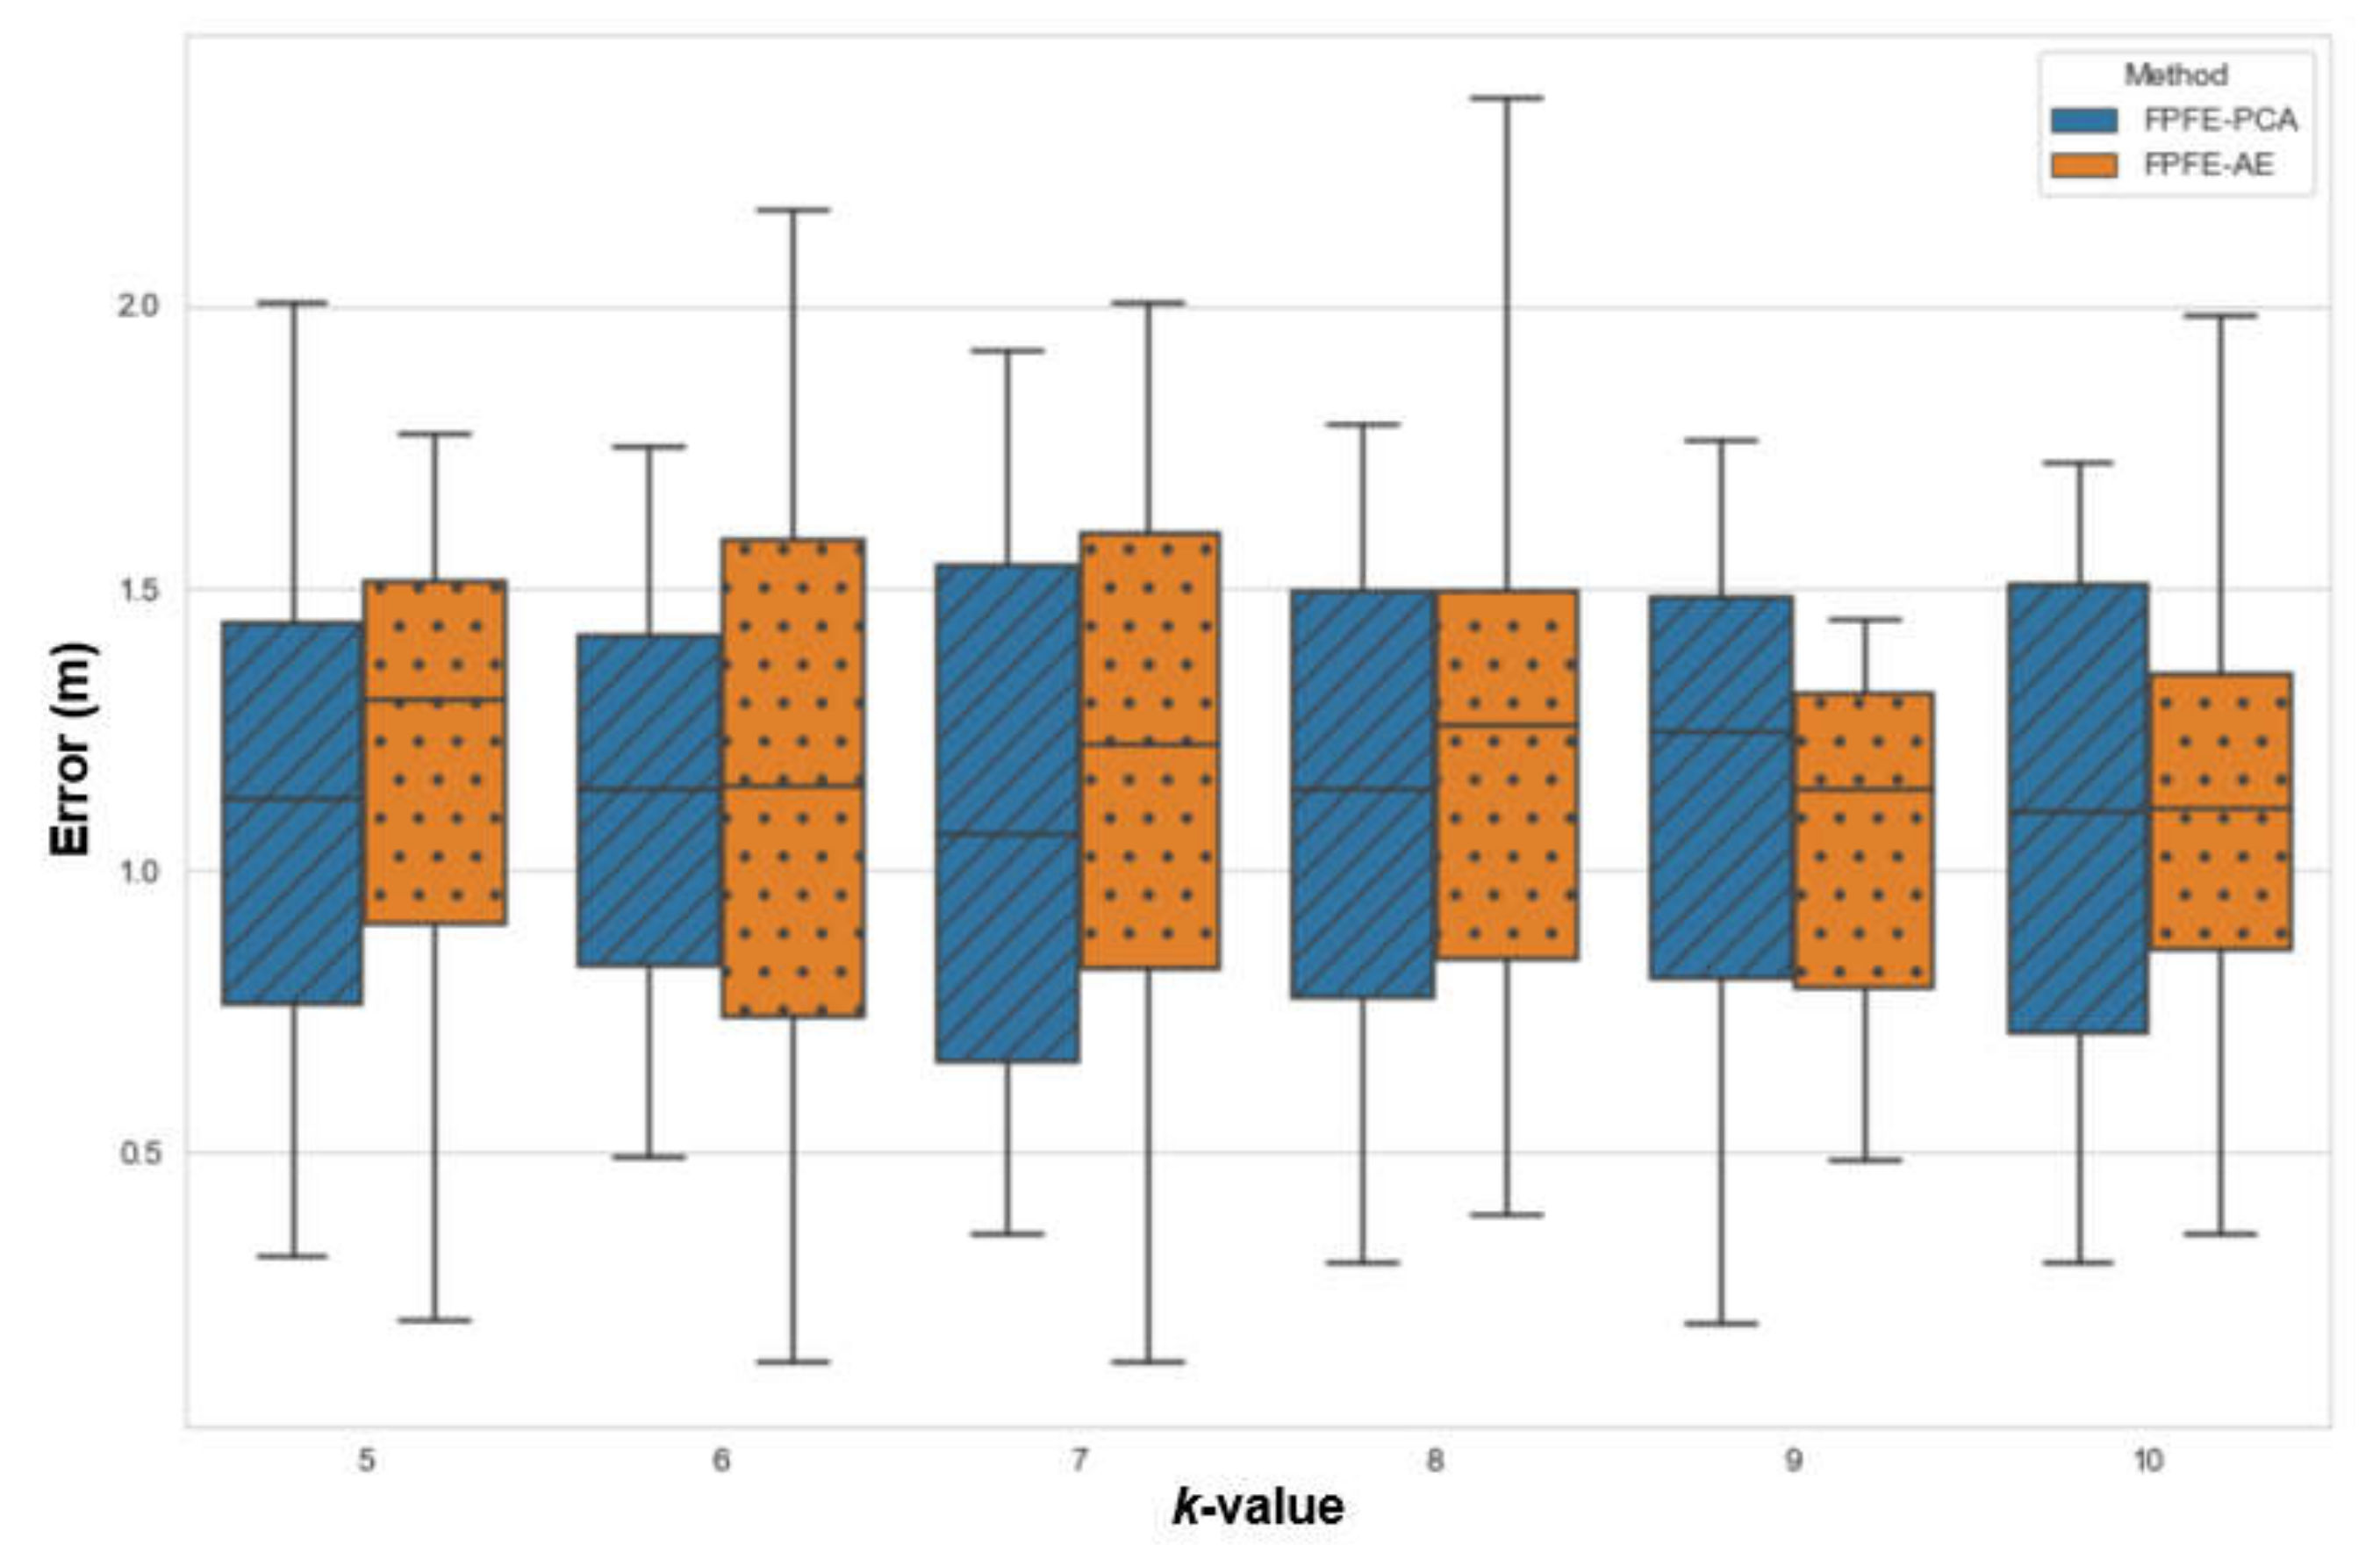
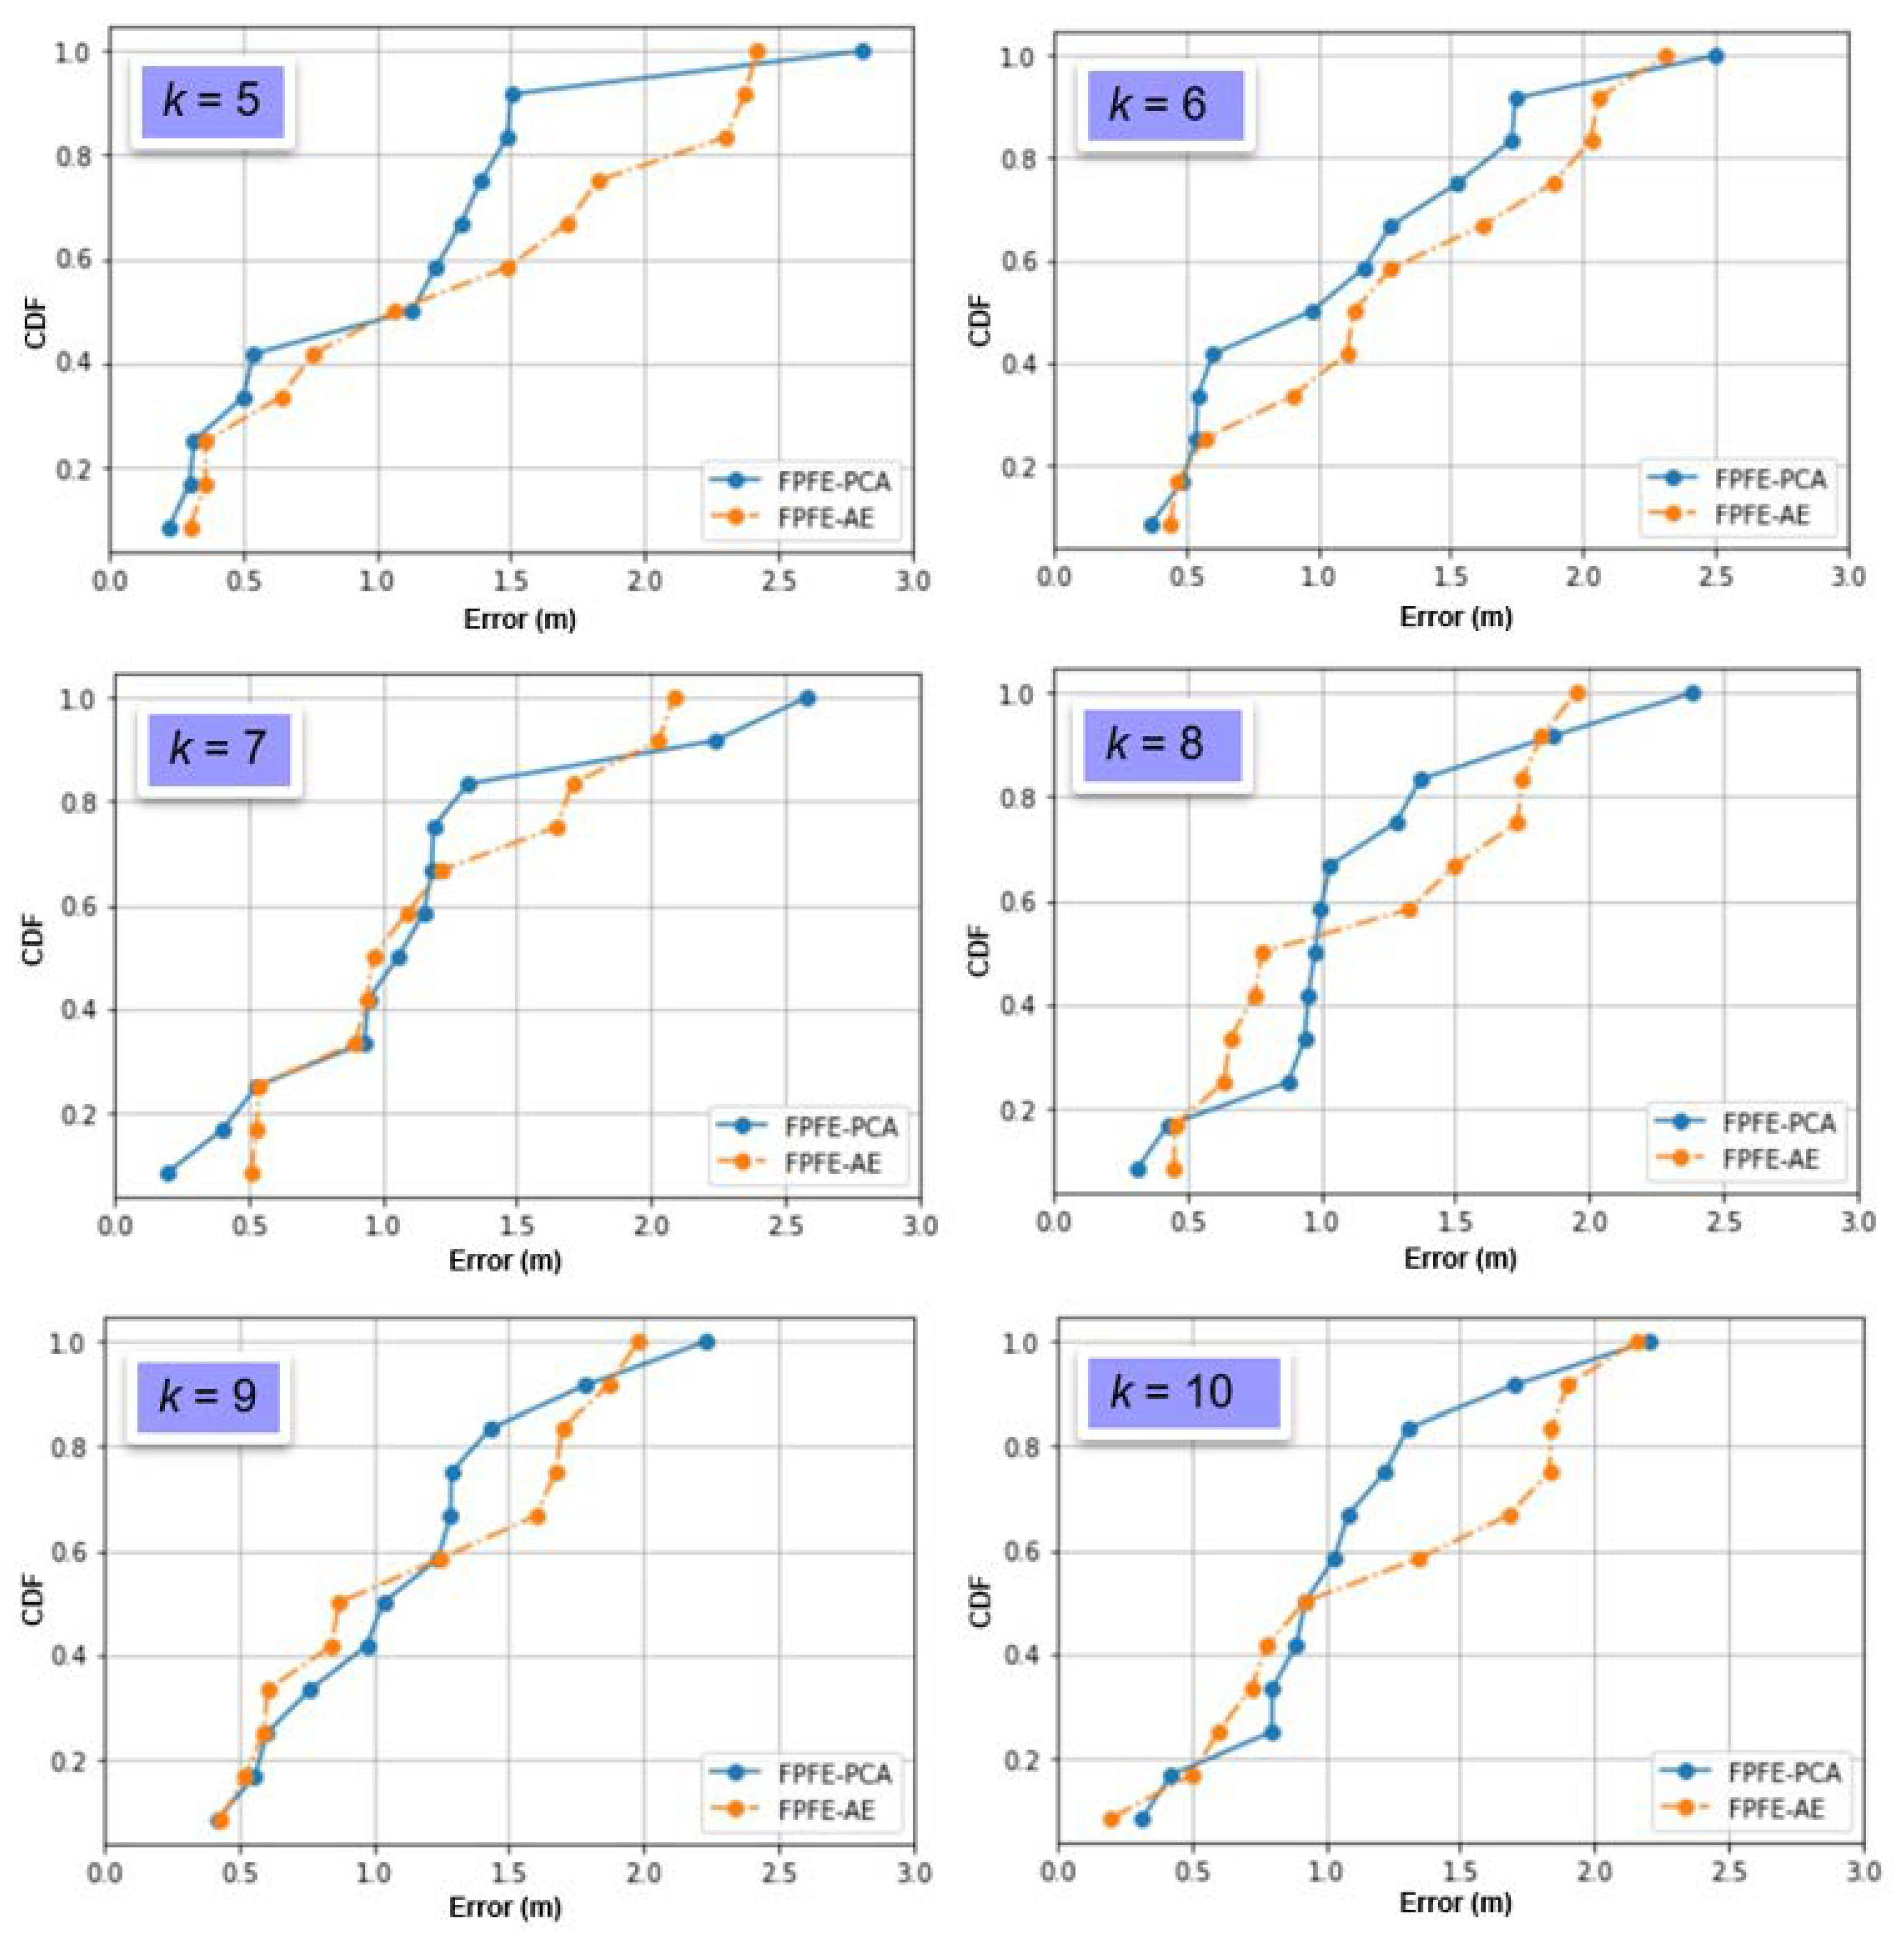
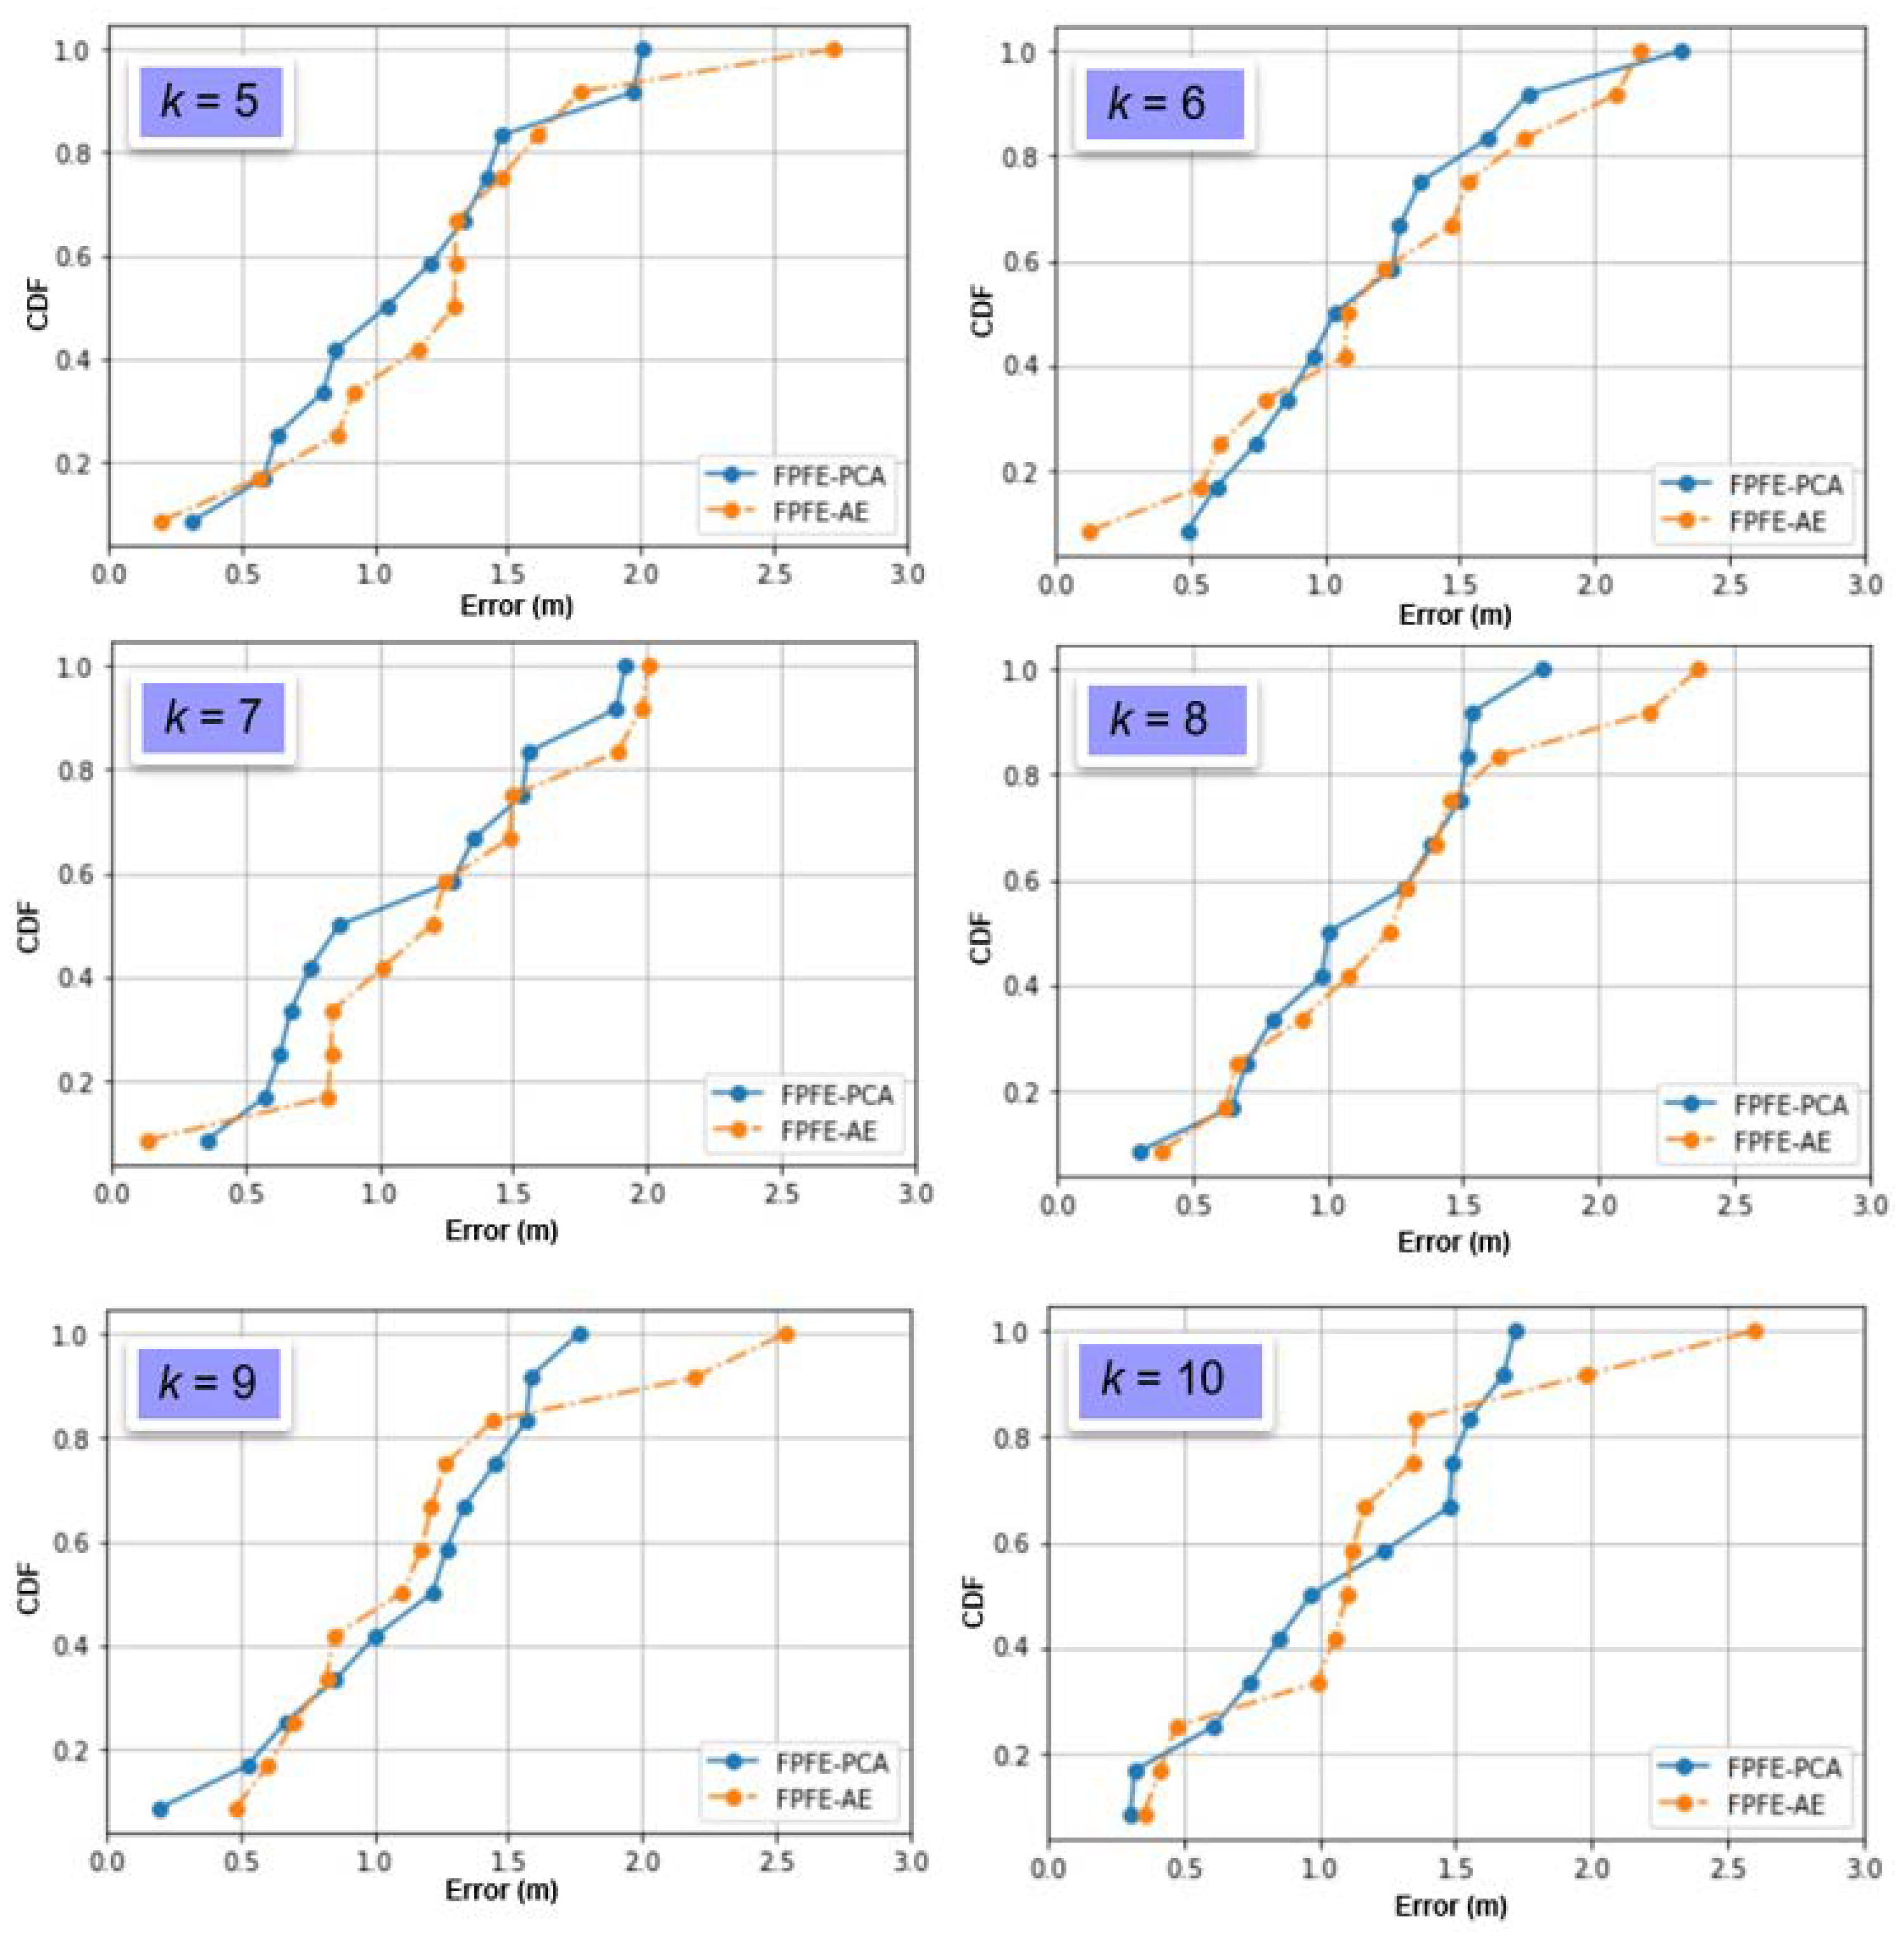
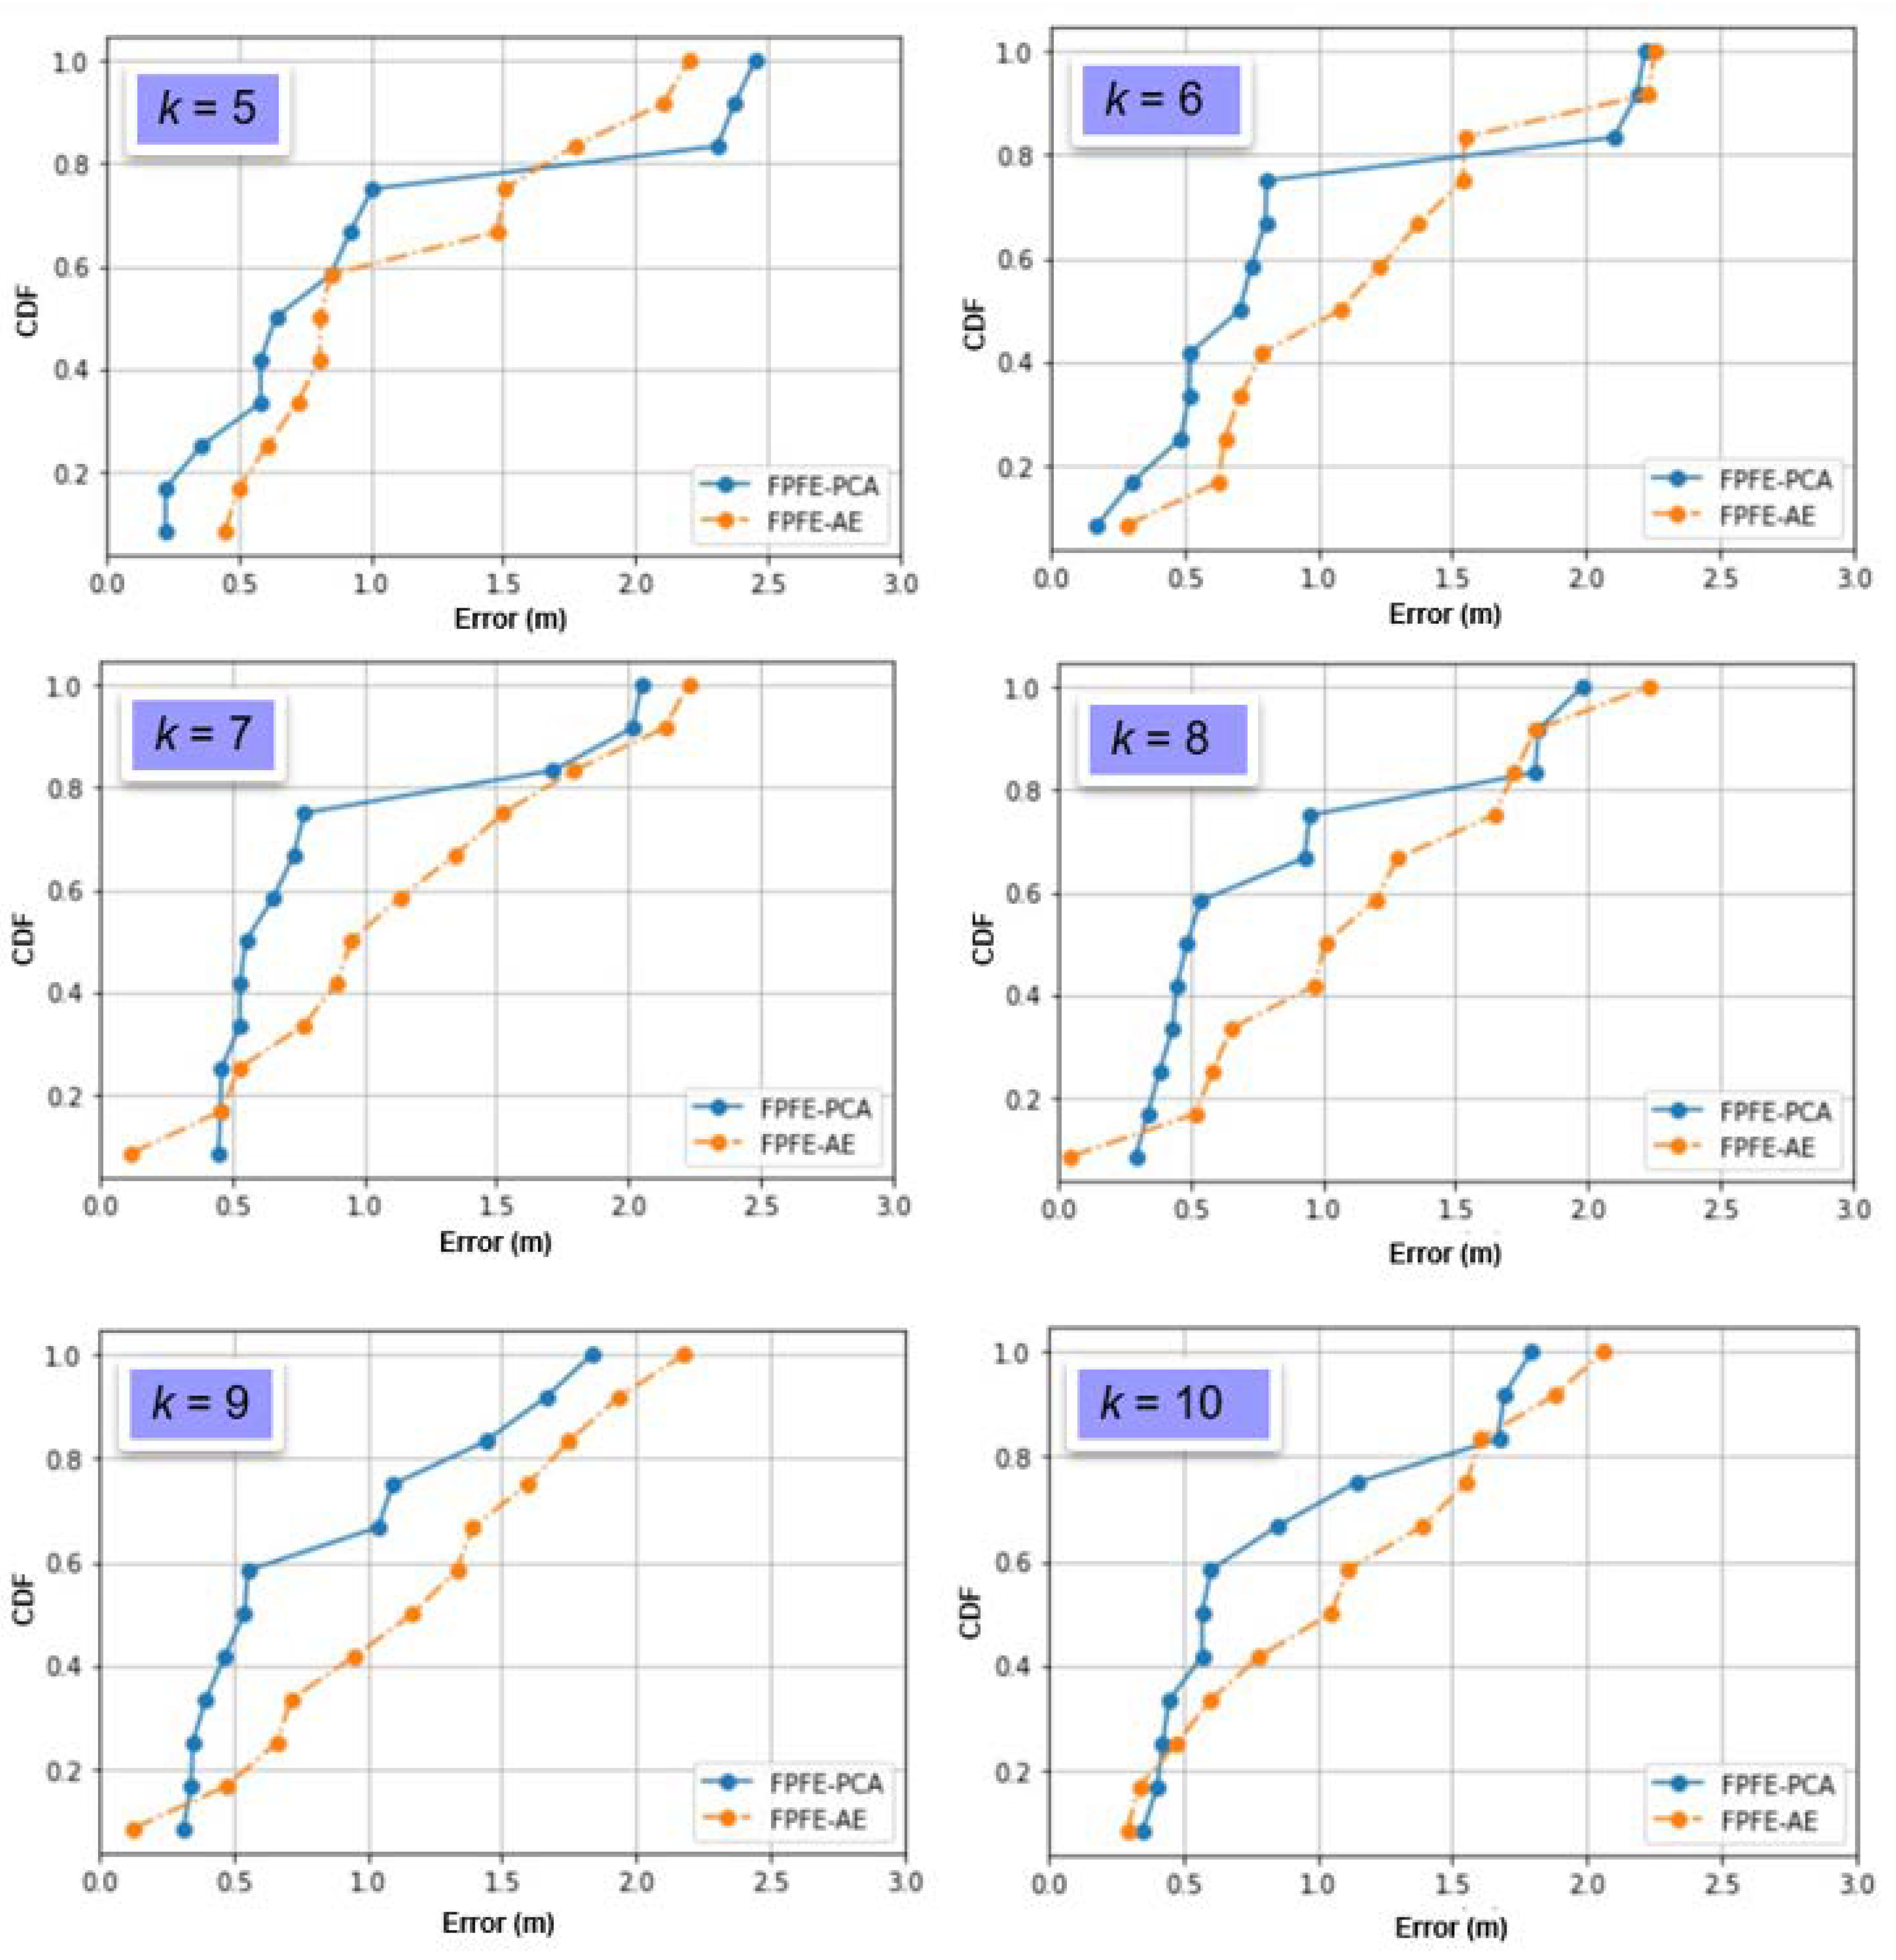
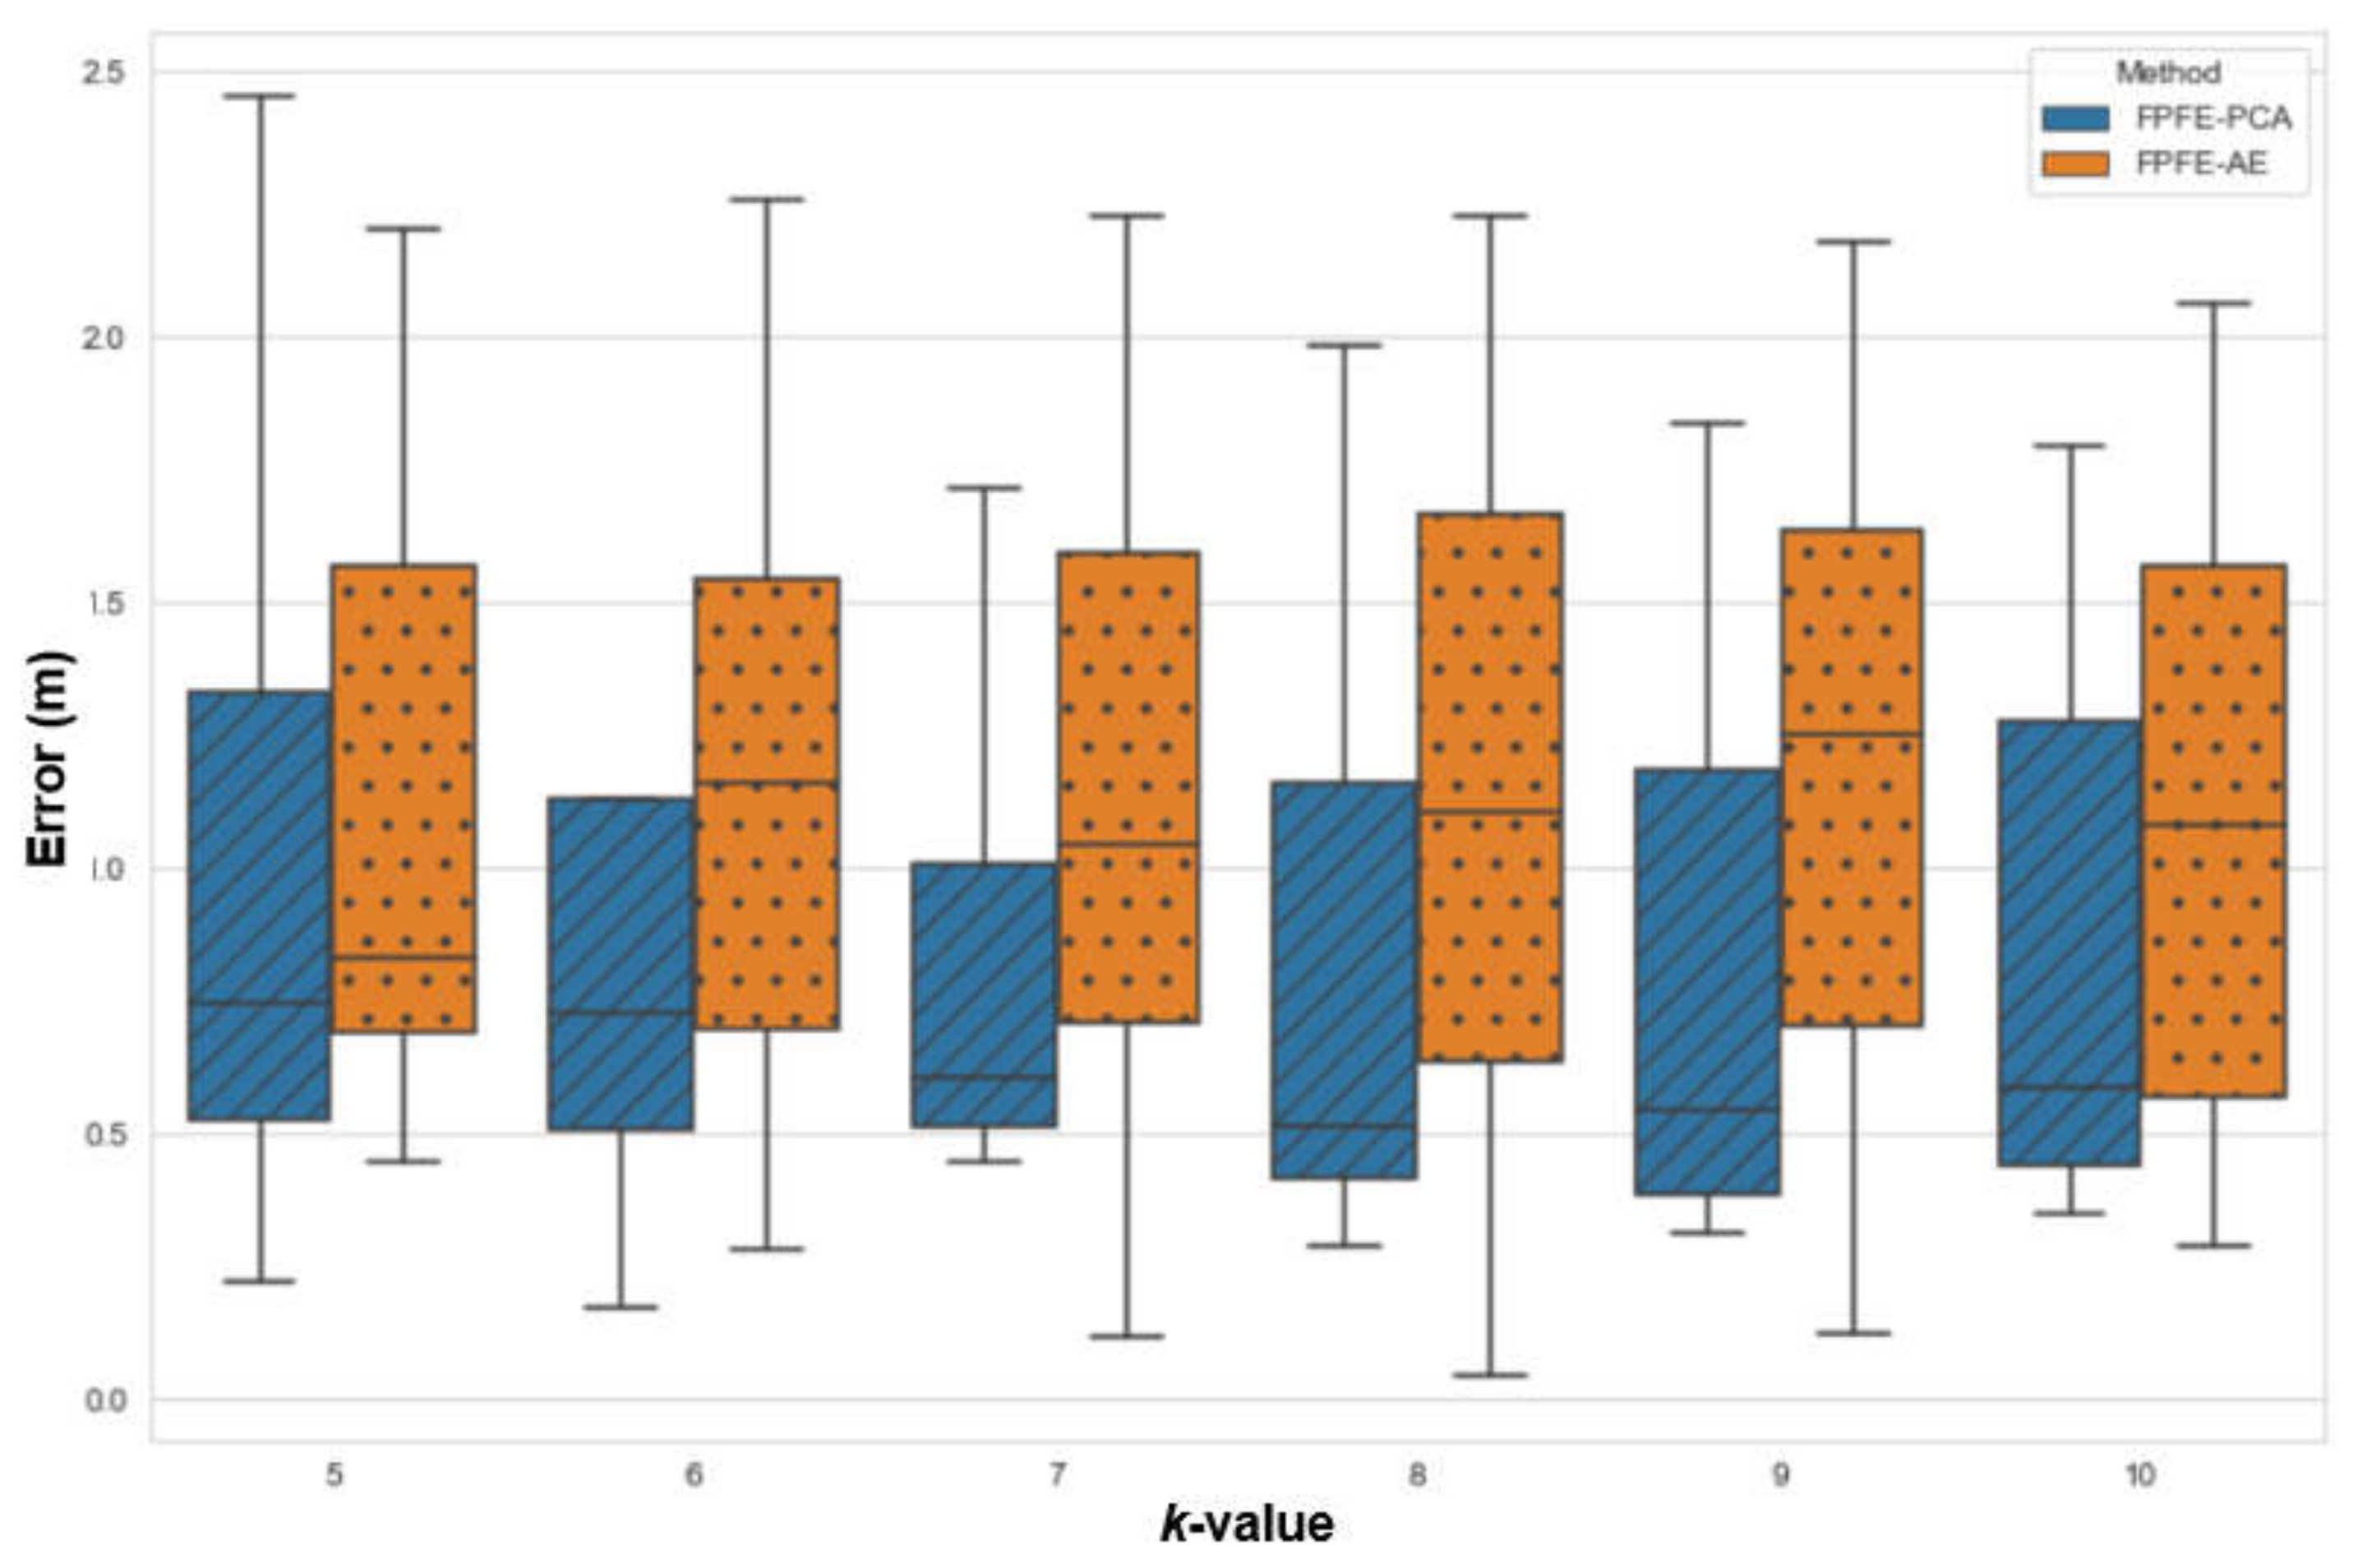
4.2. Performance Evaluation
4.3. Performance Comparison
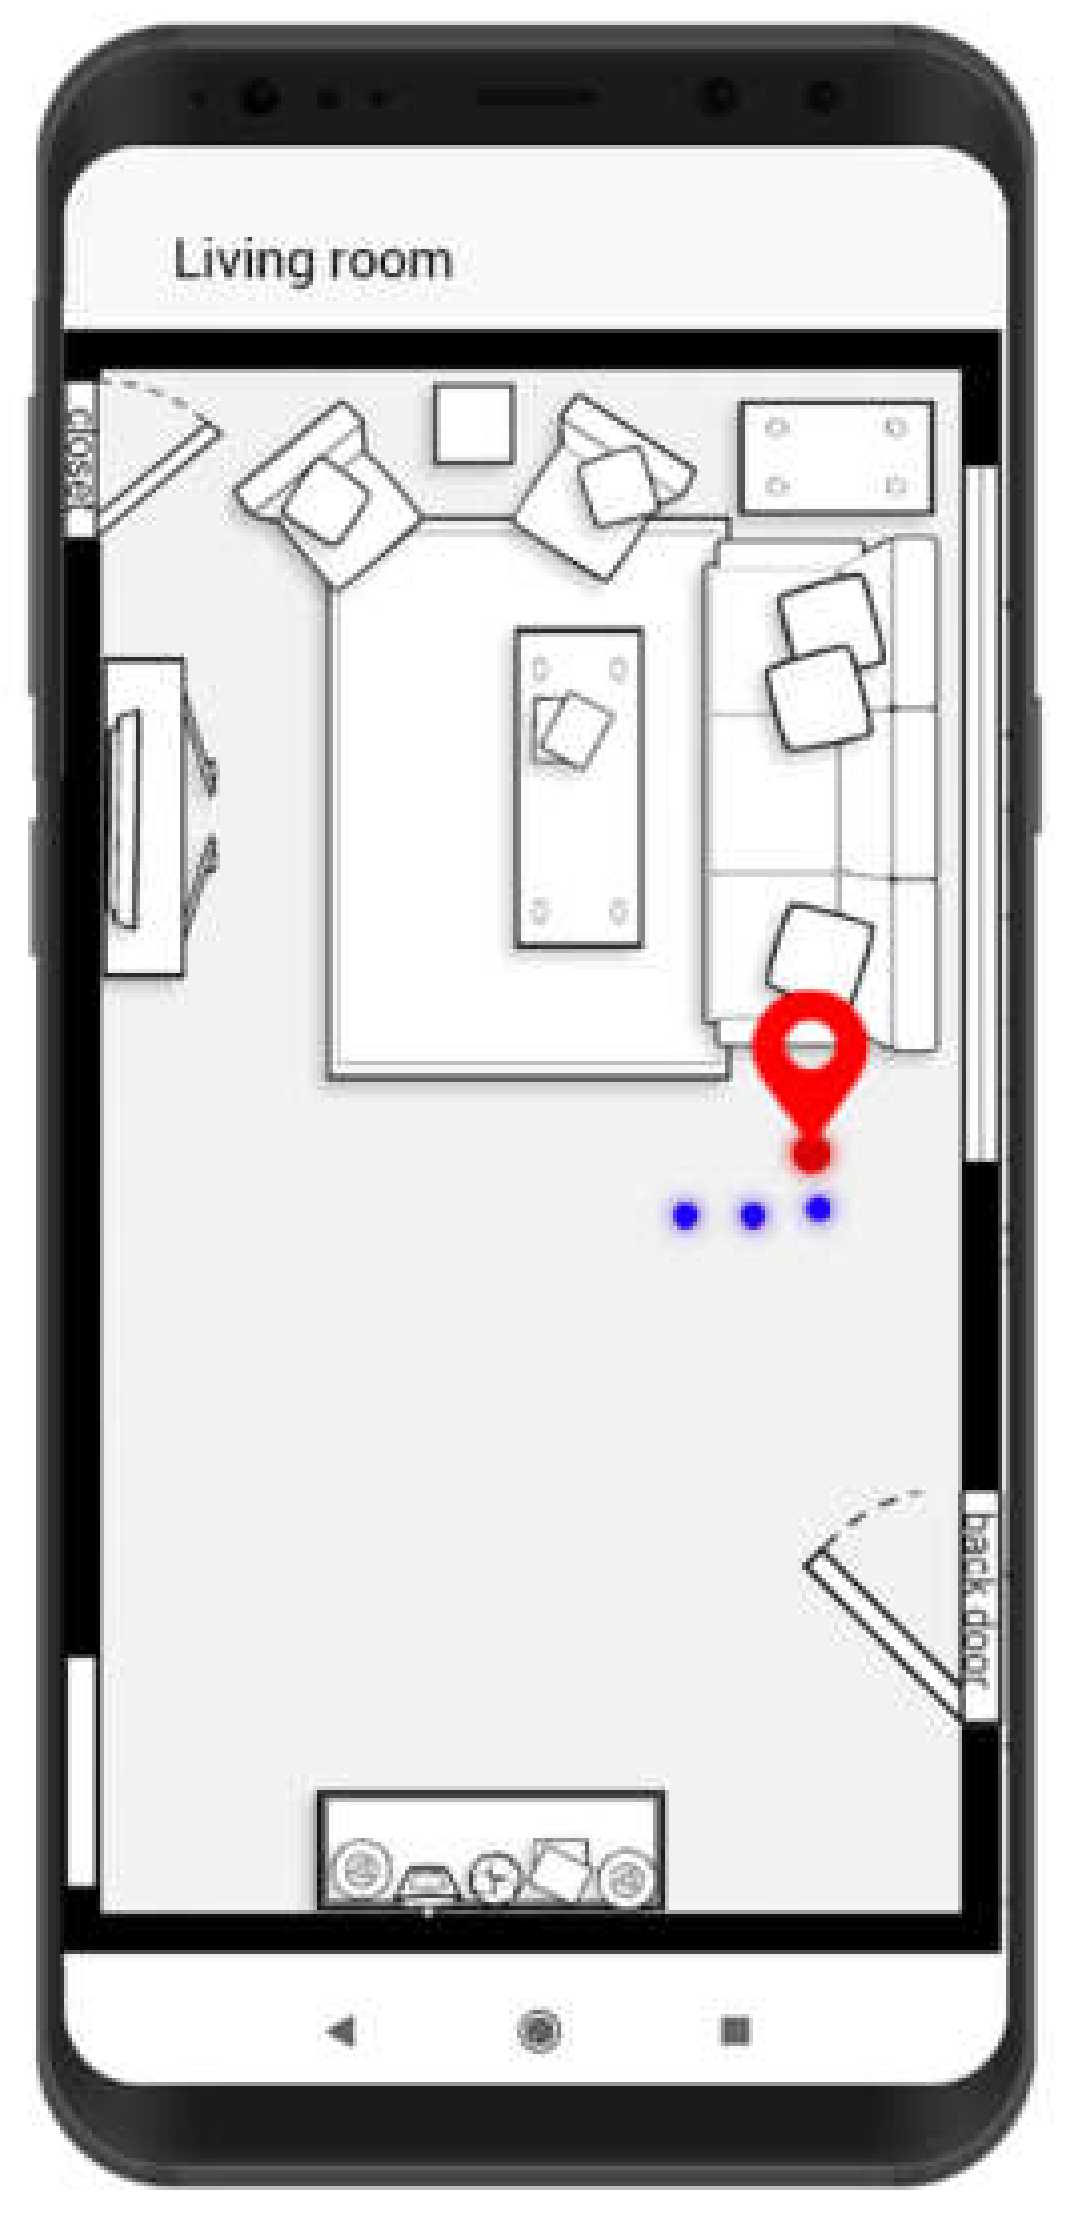
4.4. An FPFE Application
5. Conclusions
Author Contributions
Funding
Conflicts of Interest
References
- Zafari, F.; Gkelias, A.; Leung, K.K. A Survey of Indoor Localization Systems and Technologies. IEEE Commun. Surv. Tutor. 2019, 21, 2568–2599. [Google Scholar] [CrossRef] [Green Version]
- Bazo, R.; da Costa, C.A.; Seewald, L.A.; da Silveira, L.G.; Antunes, R.S.; Righi, R.D.R.; Rodrigues, V.F. A Survey About Real-Time Location Systems in Healthcare Environments. J. Med. Syst. 2021, 45, 1–13. [Google Scholar] [CrossRef]
- Witrisal, K.; Meissner, P.; Leitinger, E.; Shen, Y.; Gustafson, C.; Tufvesson, F.; Haneda, K.; Dardari, D.; Molisch, A.F.; Conti, A.; et al. High-Accuracy Localization for Assisted Living: 5G systems will turn multipath channels from foe to friend. IEEE Signal Process. Mag. 2016, 33, 59–70. [Google Scholar] [CrossRef]
- Rácz-Szabó, A.; Ruppert, T.; Bántay, L.; Löcklin, A.; Jakab, L.; Abonyi, J. Real-Time Locating System in Production Management. Sensors 2020, 20, 6766. [Google Scholar] [CrossRef]
- Sakpere, W.; Oshin, M.A.; Mlitwa, N.B. A State-of-the-Art Survey of Indoor Positioning and Navigation Systems and Technologies. S. Afr. Comput. J. 2017, 29, 145–197. [Google Scholar] [CrossRef] [Green Version]
- Geok, T.K.; Aung, K.Z.; Aung, M.S.; Soe, M.T.; Abdaziz, A.; Liew, C.P.; Hossain, F.; Tso, C.P.; Yong, W.H. Review of Indoor Positioning: Radio Wave Technology. Appl. Sci. 2020, 11, 279. [Google Scholar] [CrossRef]
- Want, R.; Hopper, A.; Falcão, V.; Gibbons, J. The active badge location system. ACM Trans. Inf. Syst. 1992, 10, 91–102. [Google Scholar] [CrossRef]
- Arbula, D.; Ljubic, S. Indoor Localization Based on Infrared Angle of Arrival Sensor Network. Sensors 2020, 20, 6278. [Google Scholar] [CrossRef] [PubMed]
- Subbu, K.P.; Gozick, B.; Dantu, R. Locate Me: Magnetic-fields-based indoor localization using smartphones. ACM Trans. Intell. Syst. Technol. 2013, 4, 1–27. [Google Scholar] [CrossRef]
- Carvalho, E.C.; Ferreira, B.V.; Filho, G.P.R.; Gomes, P.H.; Freitas, G.M.; Vargas, P.A.; Ueyama, J.; Pessin, G. Towards a Smart Fault Tolerant Indoor Localization System Through Recurrent Neural Networks. In Proceedings of the International Joint Conference on Neural Networks (IJCNN 2019), Budapest, Hungary, 14–19 July 2019; pp. 1–7. [Google Scholar]
- Dian, F.J.; Yousefi, A.; Lim, S. A practical study on Bluetooth Low Energy (BLE) throughput. In Proceedings of the IEEE 9th Annual Information Technology, Electronics and Mobile Communication Conference (IEMCON 2018), Vancouver, BC, Canada, 1–3 November 2018; pp. 768–771. [Google Scholar] [CrossRef]
- Tiemann, J.; Wietfeld, C. Scalability, Real-Time Capabilities, and Energy Efficiency in Ultra-Wideband Localization. IEEE Trans. Ind. Inform. 2019, 15, 6313–6321. [Google Scholar] [CrossRef]
- Ma, Y.; Zhou, G.; Wang, S. WiFi sensing with channel state information: A survey. ACM Comput. Surv. 2019, 52, 1–36. [Google Scholar] [CrossRef] [Green Version]
- Huang, S.; Zhao, K.; Zheng, Z.; Ji, W.; Li, T.; Liao, X. An Optimized Fingerprinting-Based Indoor Positioning with Kalman Filter and Universal Kriging for 5G Internet of Things. Wirel. Commun. Mob. Comput. 2021, 2021, 9936706. [Google Scholar] [CrossRef]
- Jiang, J.-R.; Subakti, H.; Chen, C.-C.; Sakai, K. PINUS: Indoor Weighted Centroid Localization with Crowdsourced Calibration. In Communications in Computer and Information Science; Springer Science and Business Media LLC: Berlin/Heidelberg, Germany, 2019; pp. 433–443. [Google Scholar]
- Zuo, Z.; Liu, L.; Zhang, L.; Fang, Y. Indoor Positioning Based on Bluetooth Low-Energy Beacons Adopting Graph Optimization. Sensors 2018, 18, 3736. [Google Scholar] [CrossRef] [Green Version]
- Li, G.; Geng, E.; Ye, Z.; Xu, Y.; Lin, J.; Pang, Y. Indoor Positioning Algorithm Based on the Improved RSSI Distance Model. Sensors 2018, 18, 2820. [Google Scholar] [CrossRef] [Green Version]
- Giovanelli, D.; Farella, E.; Fontanelli, D.; Macii, D. Bluetooth-Based Indoor Positioning Through ToF and RSSI Data Fusion. In Proceedings of the International Conference on Indoor Positioning and Indoor Navigation (IPIN 2018), Nantes, France, 24–27 October 2018; pp. 1–8. [Google Scholar]
- Tegou, T.; Kalamaras, I.; Votis, K.; Tzovaras, D. A low-cost room-level indoor localization system with easy setup for medical applications. In Proceedings of the 11th IFIP Wireless and Mobile Networking Conference (WMNC 2018), Prague, Czech Republic, 3–5 September 2018; pp. 1–7. [Google Scholar]
- Mussina, A.; Aubakirov, S. RSSI Based Bluetooth Low Energy Indoor Positioning. In Proceedings of the IEEE 12th International Conference on Application of Information and Communication Technologies (AICT 2018), Almaty, Kazakhstan, 17–19 October 2018; pp. 1–4. [Google Scholar]
- Mackey, A.; Spachos, P.; Plataniotis, K. Enhanced Indoor Navigation System with Beacons and Kalman Filters. In Proceedings of the IEEE Global Conference on Signal and Information Processing (GlobalSIP 2018), Anaheim, CA, USA, 26–29 November 2018; pp. 947–950. [Google Scholar]
- Martins, P.; Abbasi, M.; Sá, F.; Celiclio, J.; Morgado, F.; Caldeira, F. Intelligent beacon location and fingerprinting. Procedia Comput. Sci. 2019, 151, 9–16. [Google Scholar] [CrossRef]
- Subedi, S.; Gang, H.-S.; Ko, N.Y.; Hwang, S.-S.; Pyun, J.-Y. Improving Indoor Fingerprinting Positioning With Affinity Propagation Clustering and Weighted Centroid Fingerprint. IEEE Access 2019, 7, 31738–31750. [Google Scholar] [CrossRef]
- Li, M.; Zhao, L.; Tan, D.; Tong, X. BLE Fingerprint Indoor Localization Algorithm Based on Eight-Neighborhood Template Matching. Sensors 2019, 19, 4859. [Google Scholar] [CrossRef] [PubMed] [Green Version]
- Malekzadeh, P.; Mohammadi, A.; Barbulescu, M.; Plataniotis, K. STUPEFY: Set-Valued Box Particle Filtering for Bluetooth Low Energy-Based Indoor Localization. IEEE Signal Process. Lett. 2019, 26, 1773–1777. [Google Scholar] [CrossRef]
- Mouhammad, C.S.; Allam, A.; Abdel-Raouf, M.; Shenouda, E.; Elsabrouty, M. BLE Indoor Localization based on Improved RSSI and Trilateration. In Proceedings of the 7th International Japan-Africa Conference on Electronics, Communications, and Computations, (JAC-ECC 2019), Alexandria, Egypt, 15–16 December 2019; pp. 17–21. [Google Scholar]
- Dinh, T.-M.T.; Duong, N.-S.; Sandrasegaran, K. Smartphone-Based Indoor Positioning Using BLE iBeacon and Reliable Lightweight Fingerprint Map. IEEE Sens. J. 2020, 20, 10283–10294. [Google Scholar] [CrossRef]
- Kluge, T.; Groba, C.; Springer, T. Trilateration, Fingerprinting, and Centroid: Taking Indoor Positioning with Bluetooth LE to the Wild. In Proceedings of the IEEE 21st International Symposium on “A World of Wireless, Mobile and Multimedia Networks” (WoWMoM 2020), Cork, Ireland, 31 August–3 September 2020; pp. 264–272. [Google Scholar]
- Li, Z.; Cao, J.; Liu, X.; Zhang, J.; Hu, H.; Yao, D. A Self-Adaptive Bluetooth Indoor Localization System using LSTM-based Distance Estimator. In Proceedings of the 29th International Conference on Computer Communications and Networks (ICCCN 2020), Honolulu, HI, USA, 3–6 August 2020; pp. 1–9. [Google Scholar]
- Pakanon, N.; Chamchoy, M.; Supanakoon, P. Study on Accuracy of Trilateration Method for Indoor Positioning with BLE Beacons. In Proceedings of the 6th International Conference on Engineering, Applied Sciences and Technology (ICEAST 2020), Chiang Mai, Thailand, 1–4 July 2020; pp. 1–4. [Google Scholar]
- Kotrotsios, K.; Orphanoudakis, T. Accurate Gridless Indoor Localization Based on Multiple Bluetooth Beacons and Machine Learning. In Proceedings of the 7th International Conference on Automation, Robotics and Applications (ICARA 2021), Prague, Czech Republic, 4–6 February 2021; pp. 190–194. [Google Scholar]
- Zhu, Y.; Luo, X.; Guan, S.; Wang, Z. Indoor Positioning Method Based on WiFi/Bluetooth and PDR Fusion Positioning. In Proceedings of the 13th International Conference on Advanced Computational Intelligence (ICACI 2021), Chongqing, China, 14–16 May 2021; pp. 233–238. [Google Scholar]
- Hu, Q.; Wu, F.; Wong, R.K.; Millham, R.C.; Fiaidhi, J. A novel indoor localization system using machine learning based on bluetooth low energy with cloud computing. Computing 2021, 1–27. [Google Scholar] [CrossRef]
- Nessa, A.; Adhikari, B.; Hussain, F.; Fernando, X.N. A Survey of Machine Learning for Indoor Positioning. IEEE Access 2020, 8, 214945–214965. [Google Scholar] [CrossRef]
- Kunang, Y.N.; Nurmaini, S.; Stiawan, D.; Zarkasi, A.; Firdaus; Jasmir, F. Automatic Features Extraction Using Autoencoder in Intrusion Detection System. In Proceedings of the International Conference on Electrical Engineering and Computer Science (ICECOS 2018), Bangka, Indonesia, 2–4 October 2018; pp. 219–224. [Google Scholar]
- Wang, Z.; Zhang, X.; Wang, W.; Shi, L.; Huang, C.; Wang, J.; Zhang, Y. Deep Convolutional Auto-Encoder based Indoor Light Positioning Using RSS Temporal Image. In Proceedings of the IEEE International Symposium on Broadband Multimedia Systems and Broadcasting (BMSB 2019), Jeju, Korea, 5–7 June 2019; pp. 1–5. [Google Scholar] [CrossRef]
- Zhang, L.; Tan, T.; Gong, Y.; Yang, W. Fingerprint Database Reconstruction Based on Robust PCA for Indoor Localization. Sensors 2019, 19, 2537. [Google Scholar] [CrossRef] [Green Version]
- Khaldi, B.; Harrou, F.; Cherif, F.; Sun, Y. Improving robots swarm aggregation performance through the Minkowski distance function. In Proceedings of the 6th International Conference on Mechatronics and Robotics Engineering (ICMRE 2020), Munich, Germany, 10–12 February 2020; pp. 87–91. [Google Scholar]
- Subakti, H.; Liang, H.-S.; Jiang, J.-R. Indoor Localization with Fingerprint Feature Extraction. In Proceedings of the IEEE Eurasia Conference on IOT, Communication and Engineering (ECICE 2020), Yunlin, Taiwan, 23–25 October 2020; pp. 239–242. [Google Scholar]
- Tiglao, N.M.; Alipio, M.; Cruz, R.D.; Bokhari, F.; Rauf, S.; Khan, S.A. Smartphone-based indoor localization techniques: State-of-the-art and classification. Measurement 2021, 179, 109349. [Google Scholar] [CrossRef]
- Renaudin, O.; Zemen, T.; Burgess, T. Ray-Tracing Based Fingerprinting for Indoor Localization. In Proceedings of the IEEE 19th International Workshop on Signal Processing Advances in Wireless Communications (SPAWC 2018), Kalamata, Greece, 25–28 June 2018; pp. 1–5. [Google Scholar] [CrossRef]
- Agarwal, N.; Sondhi, A.; Chopra, K.; Singh, G. Transfer Learning: Survey and Classification. In Advances in Intelligent Systems and Computing; Springer Science and Business Media LLC: Berlin/Heidelberg, Germany, 2020; pp. 145–155. [Google Scholar]
- Nápoles, G.; Grau, I.; Jastrzebska, A.; Salgueiro, Y. Long Short-term Cognitive Networks. arXiv 2021, arXiv:2106.16233. [Google Scholar]
- del Hougne, M.; Gigan, S.; del Hougne, P. Deeply Subwavelength Localization with Reverberation-Coded Aperture. Phys. Rev. Lett. 2021, 127, 043903. [Google Scholar] [CrossRef] [PubMed]
- Chen, C.; Chen, Y.; Han, Y.; Lai, H.-Q.; Liu, K.J.R. Achieving Centimeter Accuracy Indoor Localization on WiFi Platforms: A Frequency Hopping Approach. IEEE Internet Things J. 2016, 4, 111–121. [Google Scholar] [CrossRef]
- Steiner, C.; Wittneben, A. Efficient Training Phase for Ultrawideband-Based Location Fingerprinting Systems. IEEE Trans. Signal Process. 2011, 59, 6021–6032. [Google Scholar] [CrossRef]
- Vari, M.; Cassioli, D. mmWaves RSSI indoor network localization. In Proceedings of the IEEE International Conference on Communications Workshops (ICC 2014), Sydney, Australia, 10–14 June 2014; pp. 127–132. [Google Scholar]
- Savic, V.; Larsson, E.G. Fingerprinting-Based Positioning in Distributed Massive MIMO Systems. In Proceedings of the IEEE 82nd Vehicular Technology Conference (VTC2015-Fall), Boston, MA, USA, 6–9 September 2015; pp. 1–5. [Google Scholar]
- Vieira, J.; Leitinger, E.; Sarajlic, M.; Li, X.; Tufvesson, F. Deep convolutional neural networks for massive MIMO fingerprint-based positioning. In Proceedings of the IEEE 28th Annual International Symposium on Personal, Indoor, and Mobile Radio Communications (PIMRC 2017), Montreal, QB, Canada, 10–13 October 2017; pp. 1–6. [Google Scholar]
- Jin, Y.; O’Donoughue, N.; Moura, J.M.F. Position location by time reversal in communication networks. In Proceedings of the 2008 IEEE International Conference on Acoustics, Speech and Signal Processing, Las Vegas, NV, USA, 30 March–4 April 2008; pp. 3001–3004. [Google Scholar]
- Sen, S.; Radunovic, B.; Choudhury, R.R.; Minka, T. You are facing the Mona Lisa: Spot localization using PHY layer information. In Proceedings of the 10th International Conference on Mobile Systems, Applications, and Services, Lake District, UK, 25–29 June 2012; pp. 183–196. [Google Scholar]
- Wu, Z.-H.; Han, Y.; Chen, Y.; Liu, K.J.R. A Time-Reversal Paradigm for Indoor Positioning System. IEEE Trans. Veh. Technol. 2015, 64, 1331–1339. [Google Scholar] [CrossRef]
- Del Corte-Valiente, A.; Gómez-Pulido, J.M.; Gutiérrez-Blanco, O.; Castillo-Sequera, J.L. Localization Approach Based on Ray-Tracing Simulations and Fingerprinting Techniques for Indoor–Outdoor Scenarios. Energies 2019, 12, 2943. [Google Scholar] [CrossRef] [Green Version]
- Alexandropoulos, G.C.; Shlezinger, N.; del Hougne, P. Reconfigurable Intelligent Surfaces for Rich Scattering Wireless Communications: Recent Experiments, Challenges, and Opportunities. IEEE Commun. Mag. 2021, 59, 28–34. [Google Scholar] [CrossRef]
- Abu-Shaban, Z.; Keykhosravi, K.; Keskin, M.F.; Alexandropoulos, G.C.; Seco-Granados, G.; Wymeersch, H. Near-field localization with a reconfigurable intelligent surface acting as lens. arXiv 2020, arXiv:2010.05617. [Google Scholar]
- Del Hougne, P. Robust position sensing with wave fingerprints in dynamic complex propagation environments. Phys. Rev. Res. 2020, 2, 043224. [Google Scholar] [CrossRef]


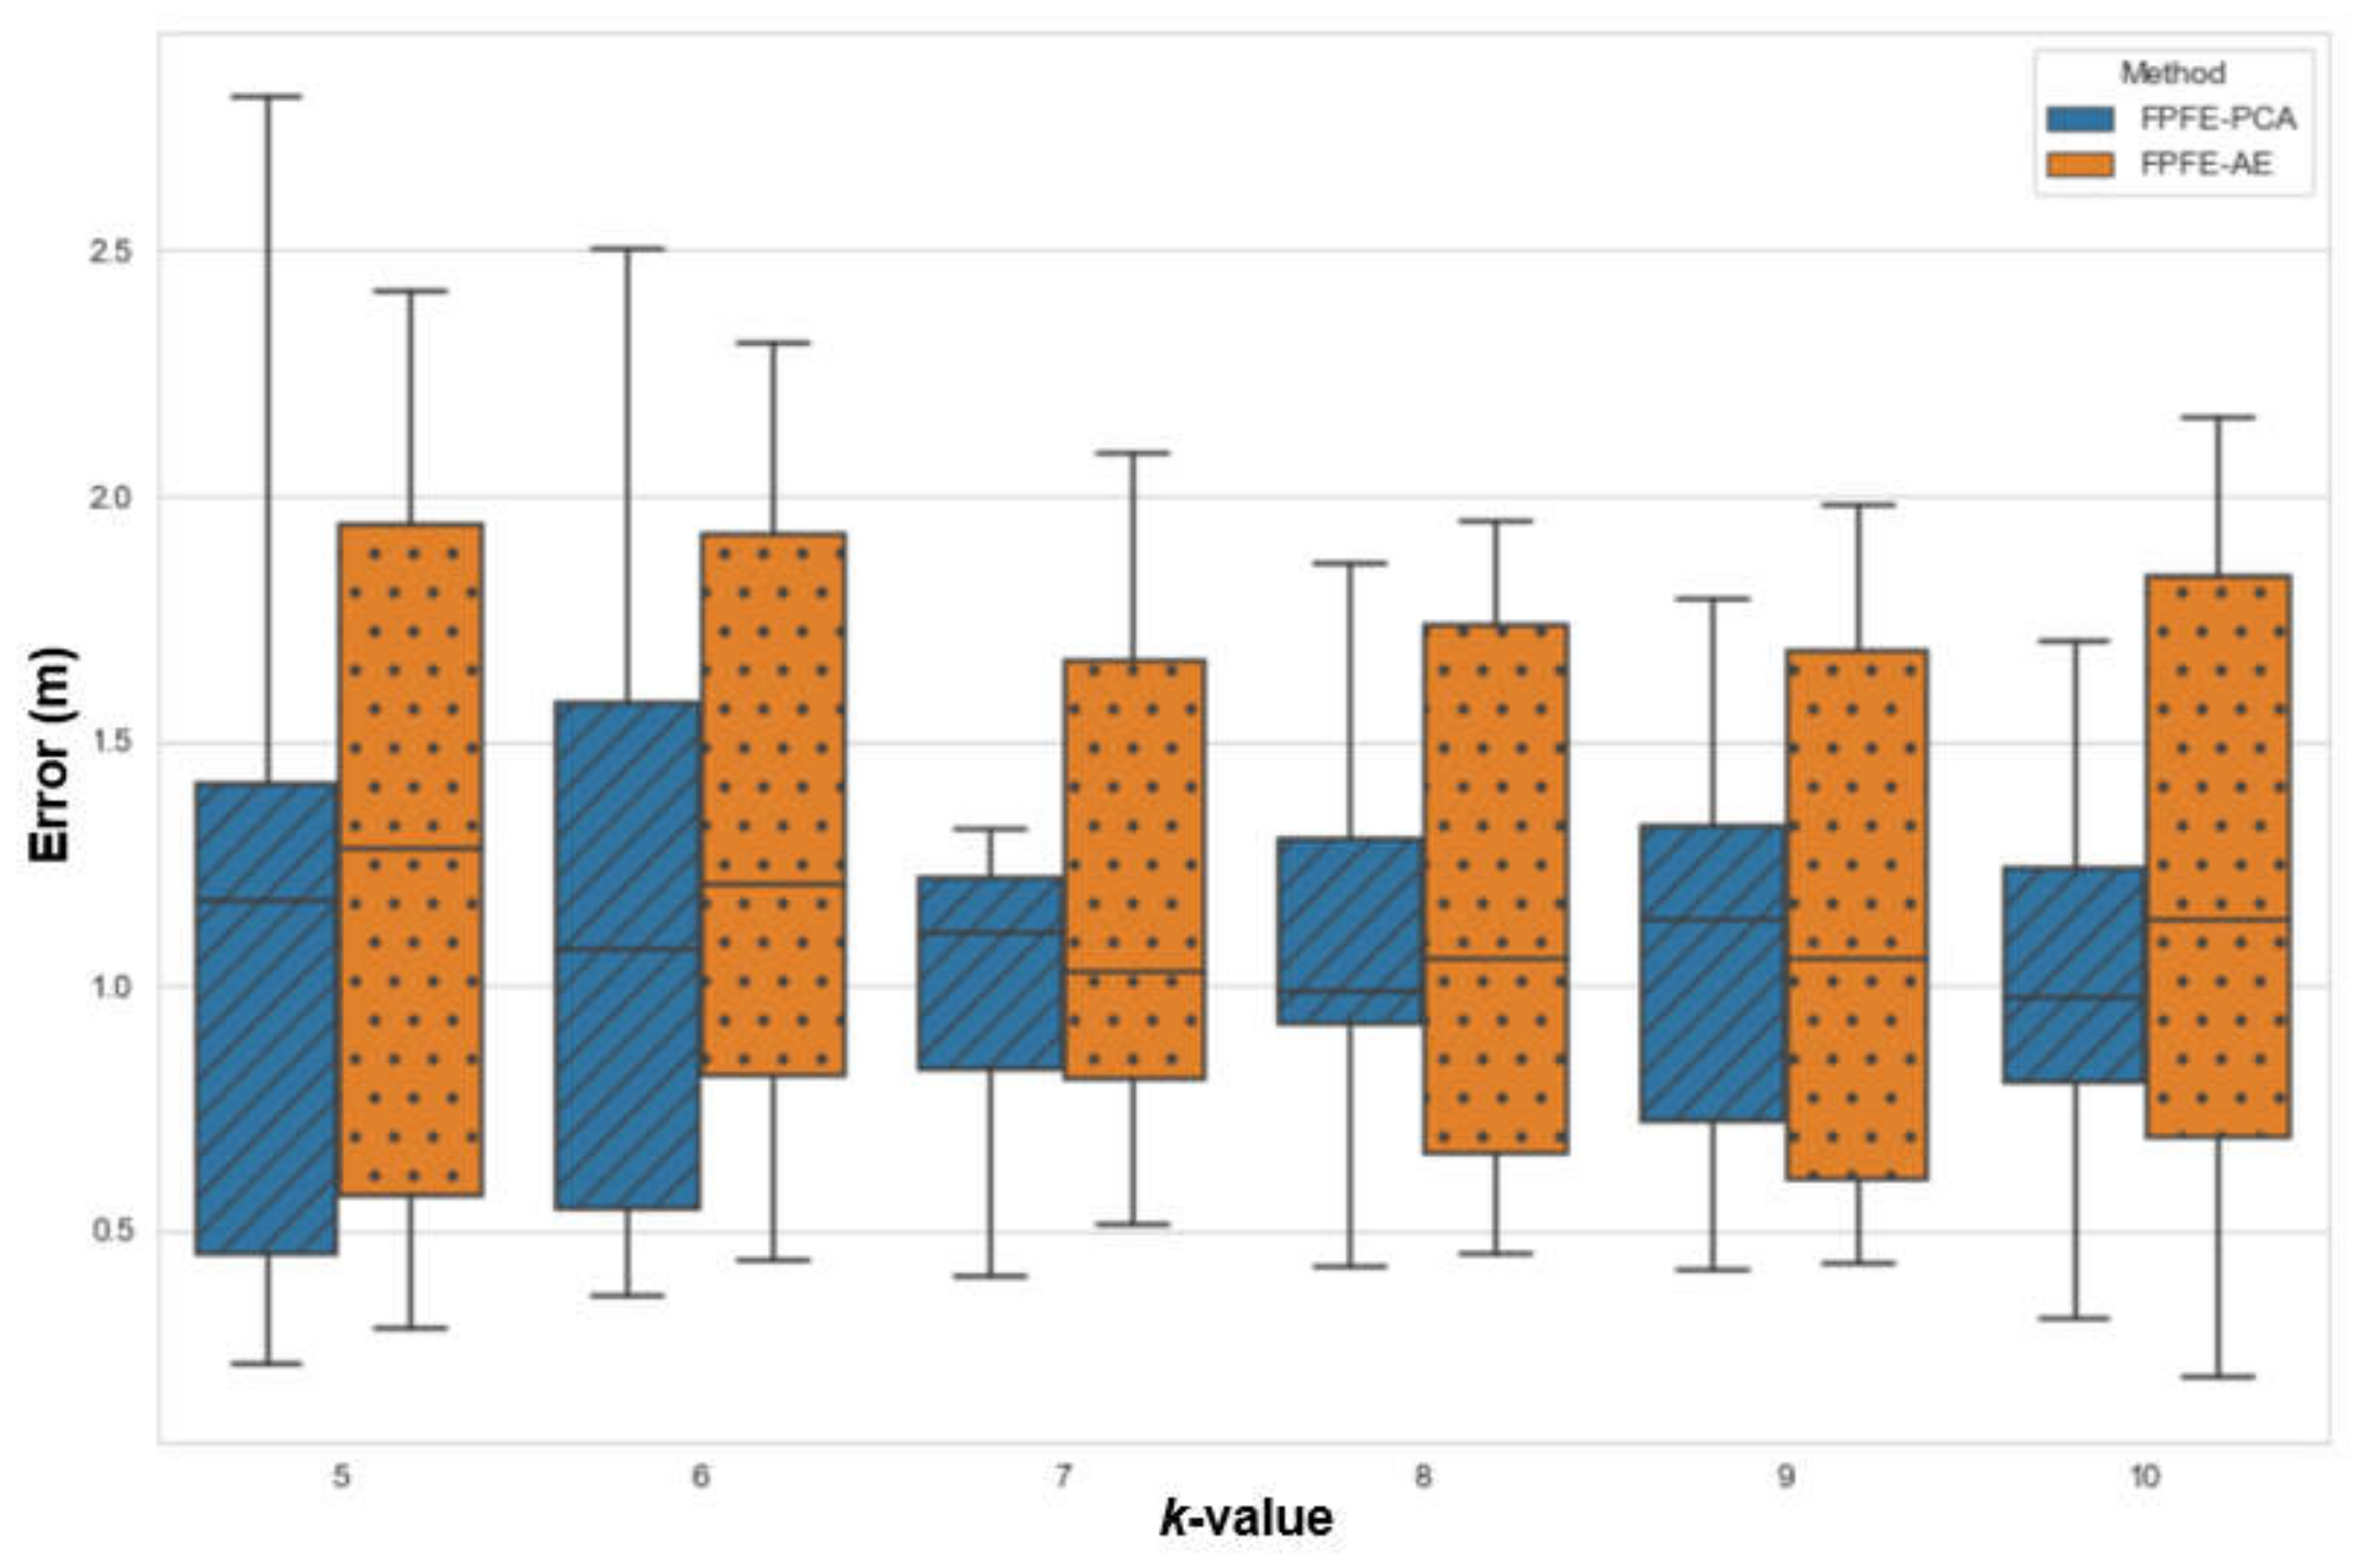
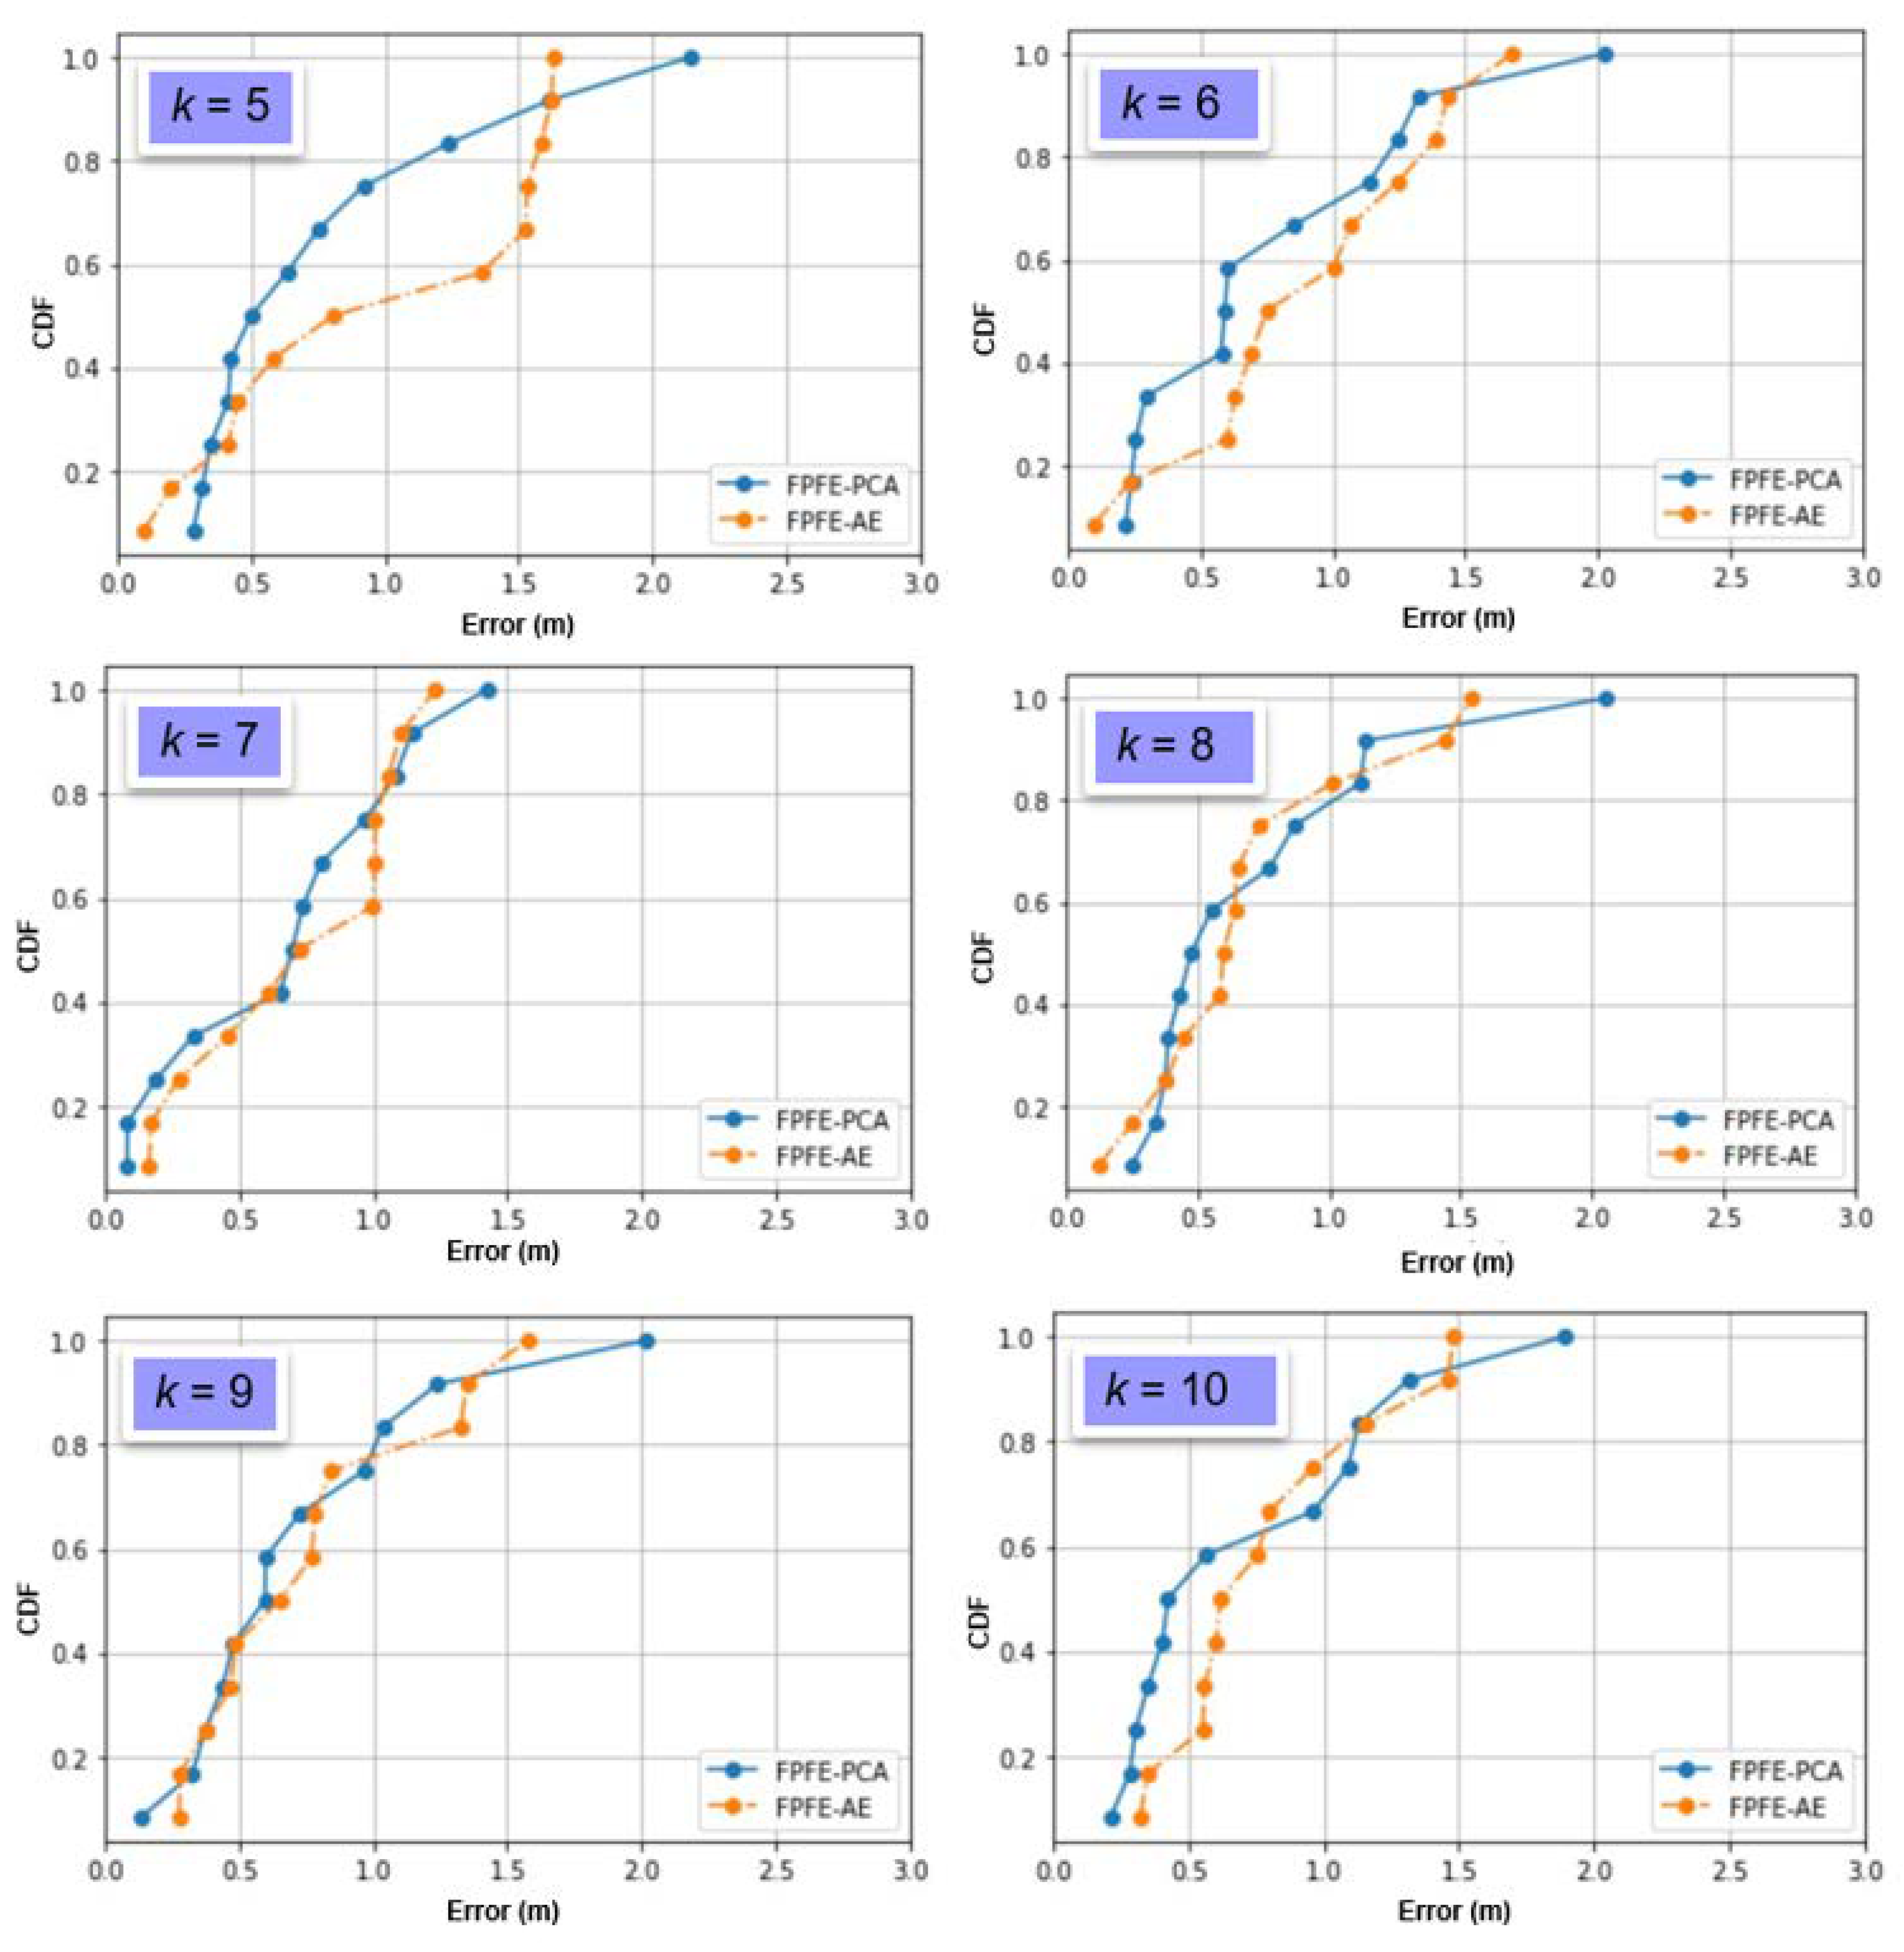
| Methods | Stats. | k = 5 | k = 6 | k = 7 | k = 8 | k = 9 | k = 10 |
|---|---|---|---|---|---|---|---|
| FPFE-AE | Max | 1.62 | 1.67 | 1.23 | 1.54 | 1.57 | 1.48 |
| Median | 1.08 | 0.87 | 0.85 | 0.61 | 0.71 | 0.68 | |
| Mean | 0.98 | 0.90 | 0.73 | 0.70 | 0.76 | 0.80 | |
| Min | 0.13 | 0.09 | 0.16 | 0.12 | 0.27 | 0.32 | |
| Std | 0.58 | 0.46 | 0.37 | 0.41 | 0.42 | 0.37 | |
| Var | 0.34 | 0.21 | 0.14 | 0.17 | 0.18 | 0.14 | |
| FPFE-PCA | Max | 2.13 | 2.02 | 1.43 | 2.05 | 2.01 | 1.8 |
| Median | 0.56 | 0.59 | 0.71 | 0.51 | 0.59 | 0.49 | |
| Mean | 0.79 | 0.77 | 0.68 | 0.73 | 0.74 | 0.74 | |
| Min | 0.28 | 0.21 | 0.08 | 0.25 | 0.13 | 0.21 | |
| Std | 0.56 | 0.53 | 0.41 | 0.49 | 0.49 | 0.50 | |
| Var | 0.31 | 0.28 | 0.17 | 0.24 | 0.24 | 0.25 |
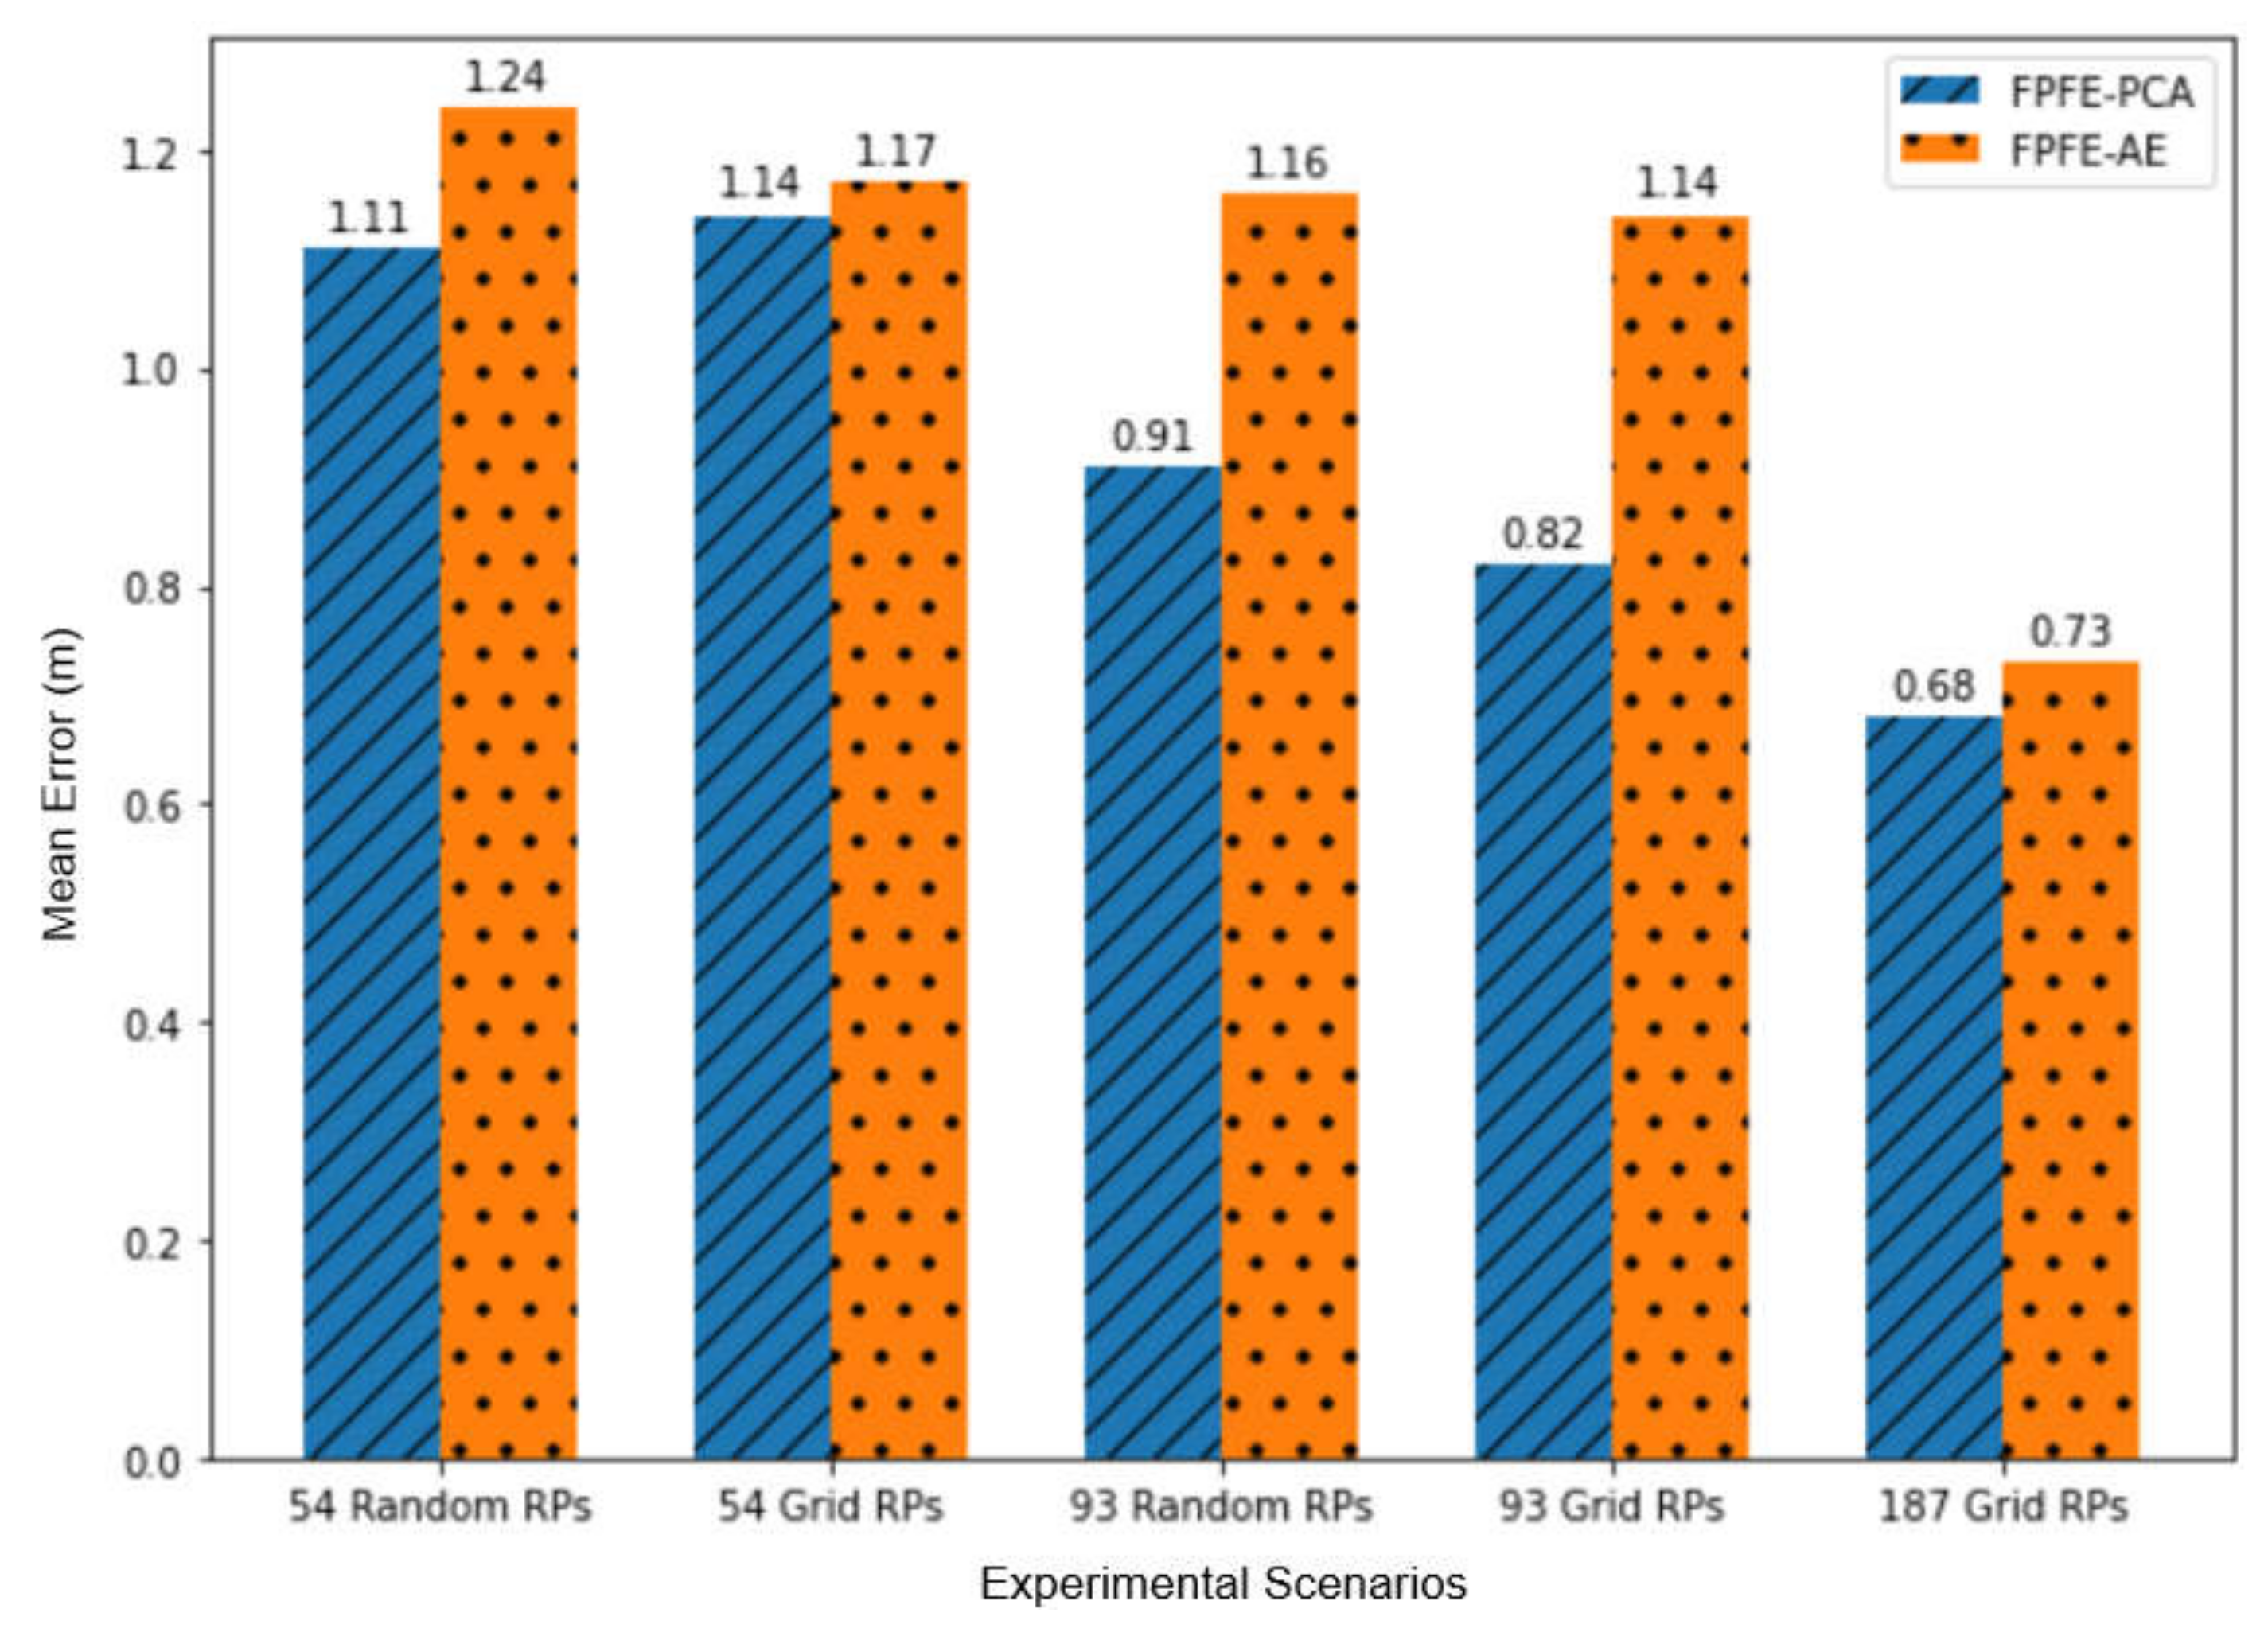
| Methods | Manhattan Distance (m) | Euclidean Distance (m) | Minkowski Distance (m) |
|---|---|---|---|
| FPFE-AE | 0.97 | 0.91 | 0.73 |
| FPFE-PCA | 0.91 | 0.80 | 0.68 |
| Research | Method | Area Size (m) | Number of BNs | Minimum Error (m) | Average Error (m) | Maximum Error (m) |
|---|---|---|---|---|---|---|
| Zuo et al. [16] | Fingerprint-based and range-based graph optimization | 90 × 37 | 24 | 1.27 | 3.07 | |
| Martins et al. [22] | Fingerprint-based Gaussian kernel | 200 × 40 | 45 | - | 1.5 | - |
| Subedi et al. [23] | Fingerprint-based weighted centroid | 93.3 × 2.67 | 28 | - | 1.05 | - |
| Li et al. [24] | Fingerprint-based eight-neighborhood template matching | 8 × 8 | 4 | - | 1.0 | - |
| Dinh et al. [27] | Fingerprint-based PDR | 15 × 25 | 8 | - | 0.81 | 2.114 |
| This Research | FPFE-AE | 5 × 8 | 4 | 0.16 | 0.73 | 1.23 |
| This Research | FPFE-PCA | 5 × 8 | 4 | 0.08 | 0.68 | 1.43 |
| Devices | Cost | Coverage | Public Infrastructure |
|---|---|---|---|
| Optical | Medium | Low | No |
| Infrared | Medium | Low | No |
| Mechanical sensor | Low | Medium | No |
| BLE | Low | Low | No |
| Wi-Fi | Medium | Medium | No |
| UWB | High | Low | No |
| Cellular | High | High | Yes |
Publisher’s Note: MDPI stays neutral with regard to jurisdictional claims in published maps and institutional affiliations. |
© 2021 by the authors. Licensee MDPI, Basel, Switzerland. This article is an open access article distributed under the terms and conditions of the Creative Commons Attribution (CC BY) license (https://creativecommons.org/licenses/by/4.0/).
Share and Cite
Jiang, J.-R.; Subakti, H.; Liang, H.-S. Fingerprint Feature Extraction for Indoor Localization. Sensors 2021, 21, 5434. https://doi.org/10.3390/s21165434
Jiang J-R, Subakti H, Liang H-S. Fingerprint Feature Extraction for Indoor Localization. Sensors. 2021; 21(16):5434. https://doi.org/10.3390/s21165434
Chicago/Turabian StyleJiang, Jehn-Ruey, Hanas Subakti, and Hui-Sung Liang. 2021. "Fingerprint Feature Extraction for Indoor Localization" Sensors 21, no. 16: 5434. https://doi.org/10.3390/s21165434
APA StyleJiang, J.-R., Subakti, H., & Liang, H.-S. (2021). Fingerprint Feature Extraction for Indoor Localization. Sensors, 21(16), 5434. https://doi.org/10.3390/s21165434