
Convolutional Neural Networks Cascade for Automatic Pupil and Iris Detection in Ocular Proton Therapy †

 , ,
, , 
Abstract
:1. Introduction
2. Materials and Methods
2.1. Patient Dataset
2.2. Framework Design and Training Details
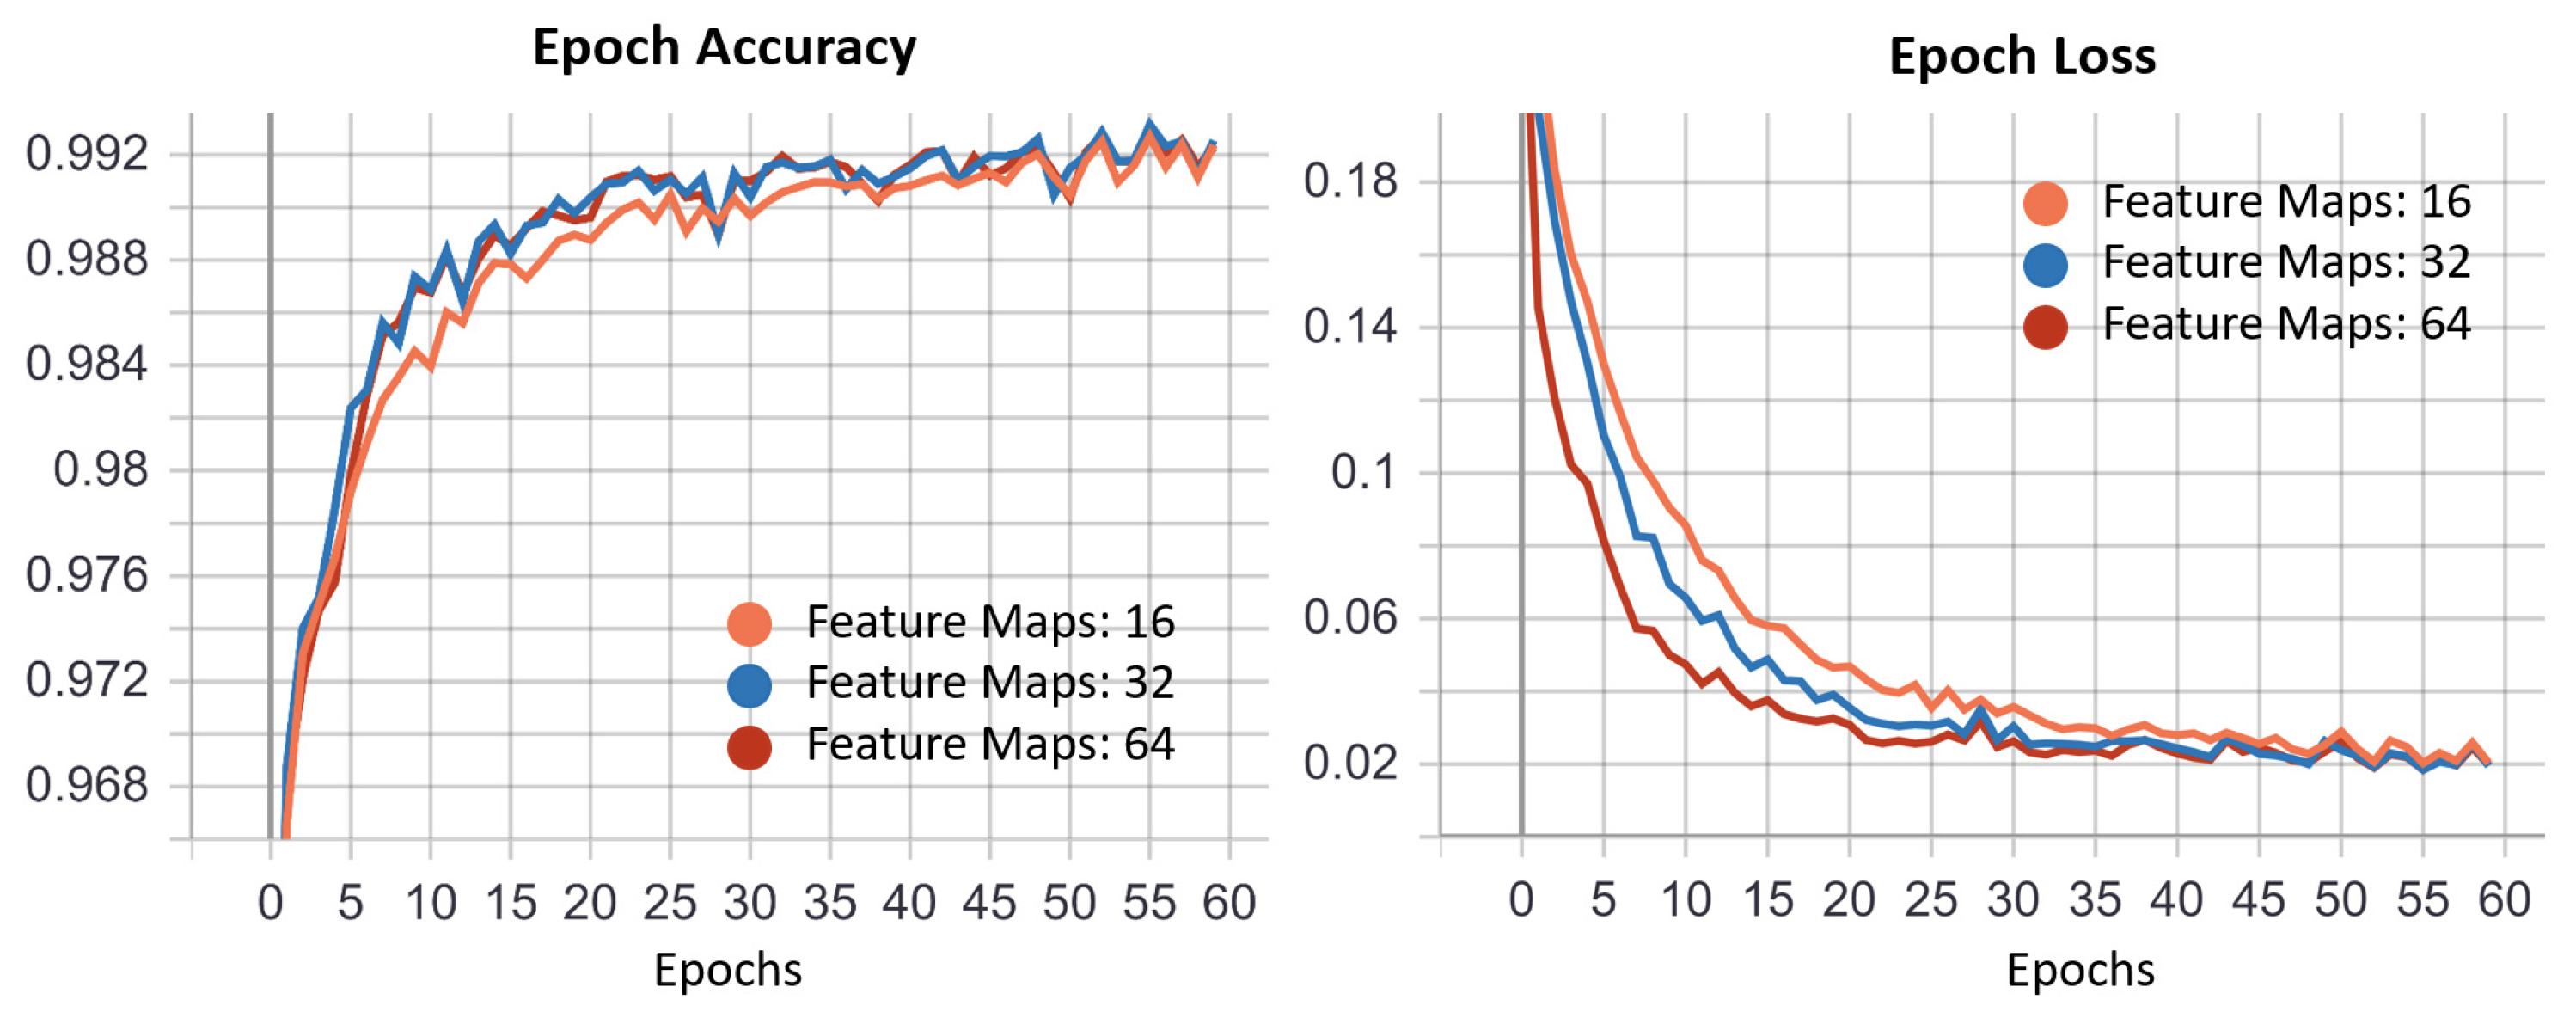
2.3. U-Net Details
- Reflection about the vertical and horizontal axis
- Random clockwise rotation from 0° to 360° degrees
- Image translation in both axis of 0–70 pixels
- Image zoom by a factor ±0.2
2.4. U-Nets Cascade
2.5. Evaluation Metrics
3. Results
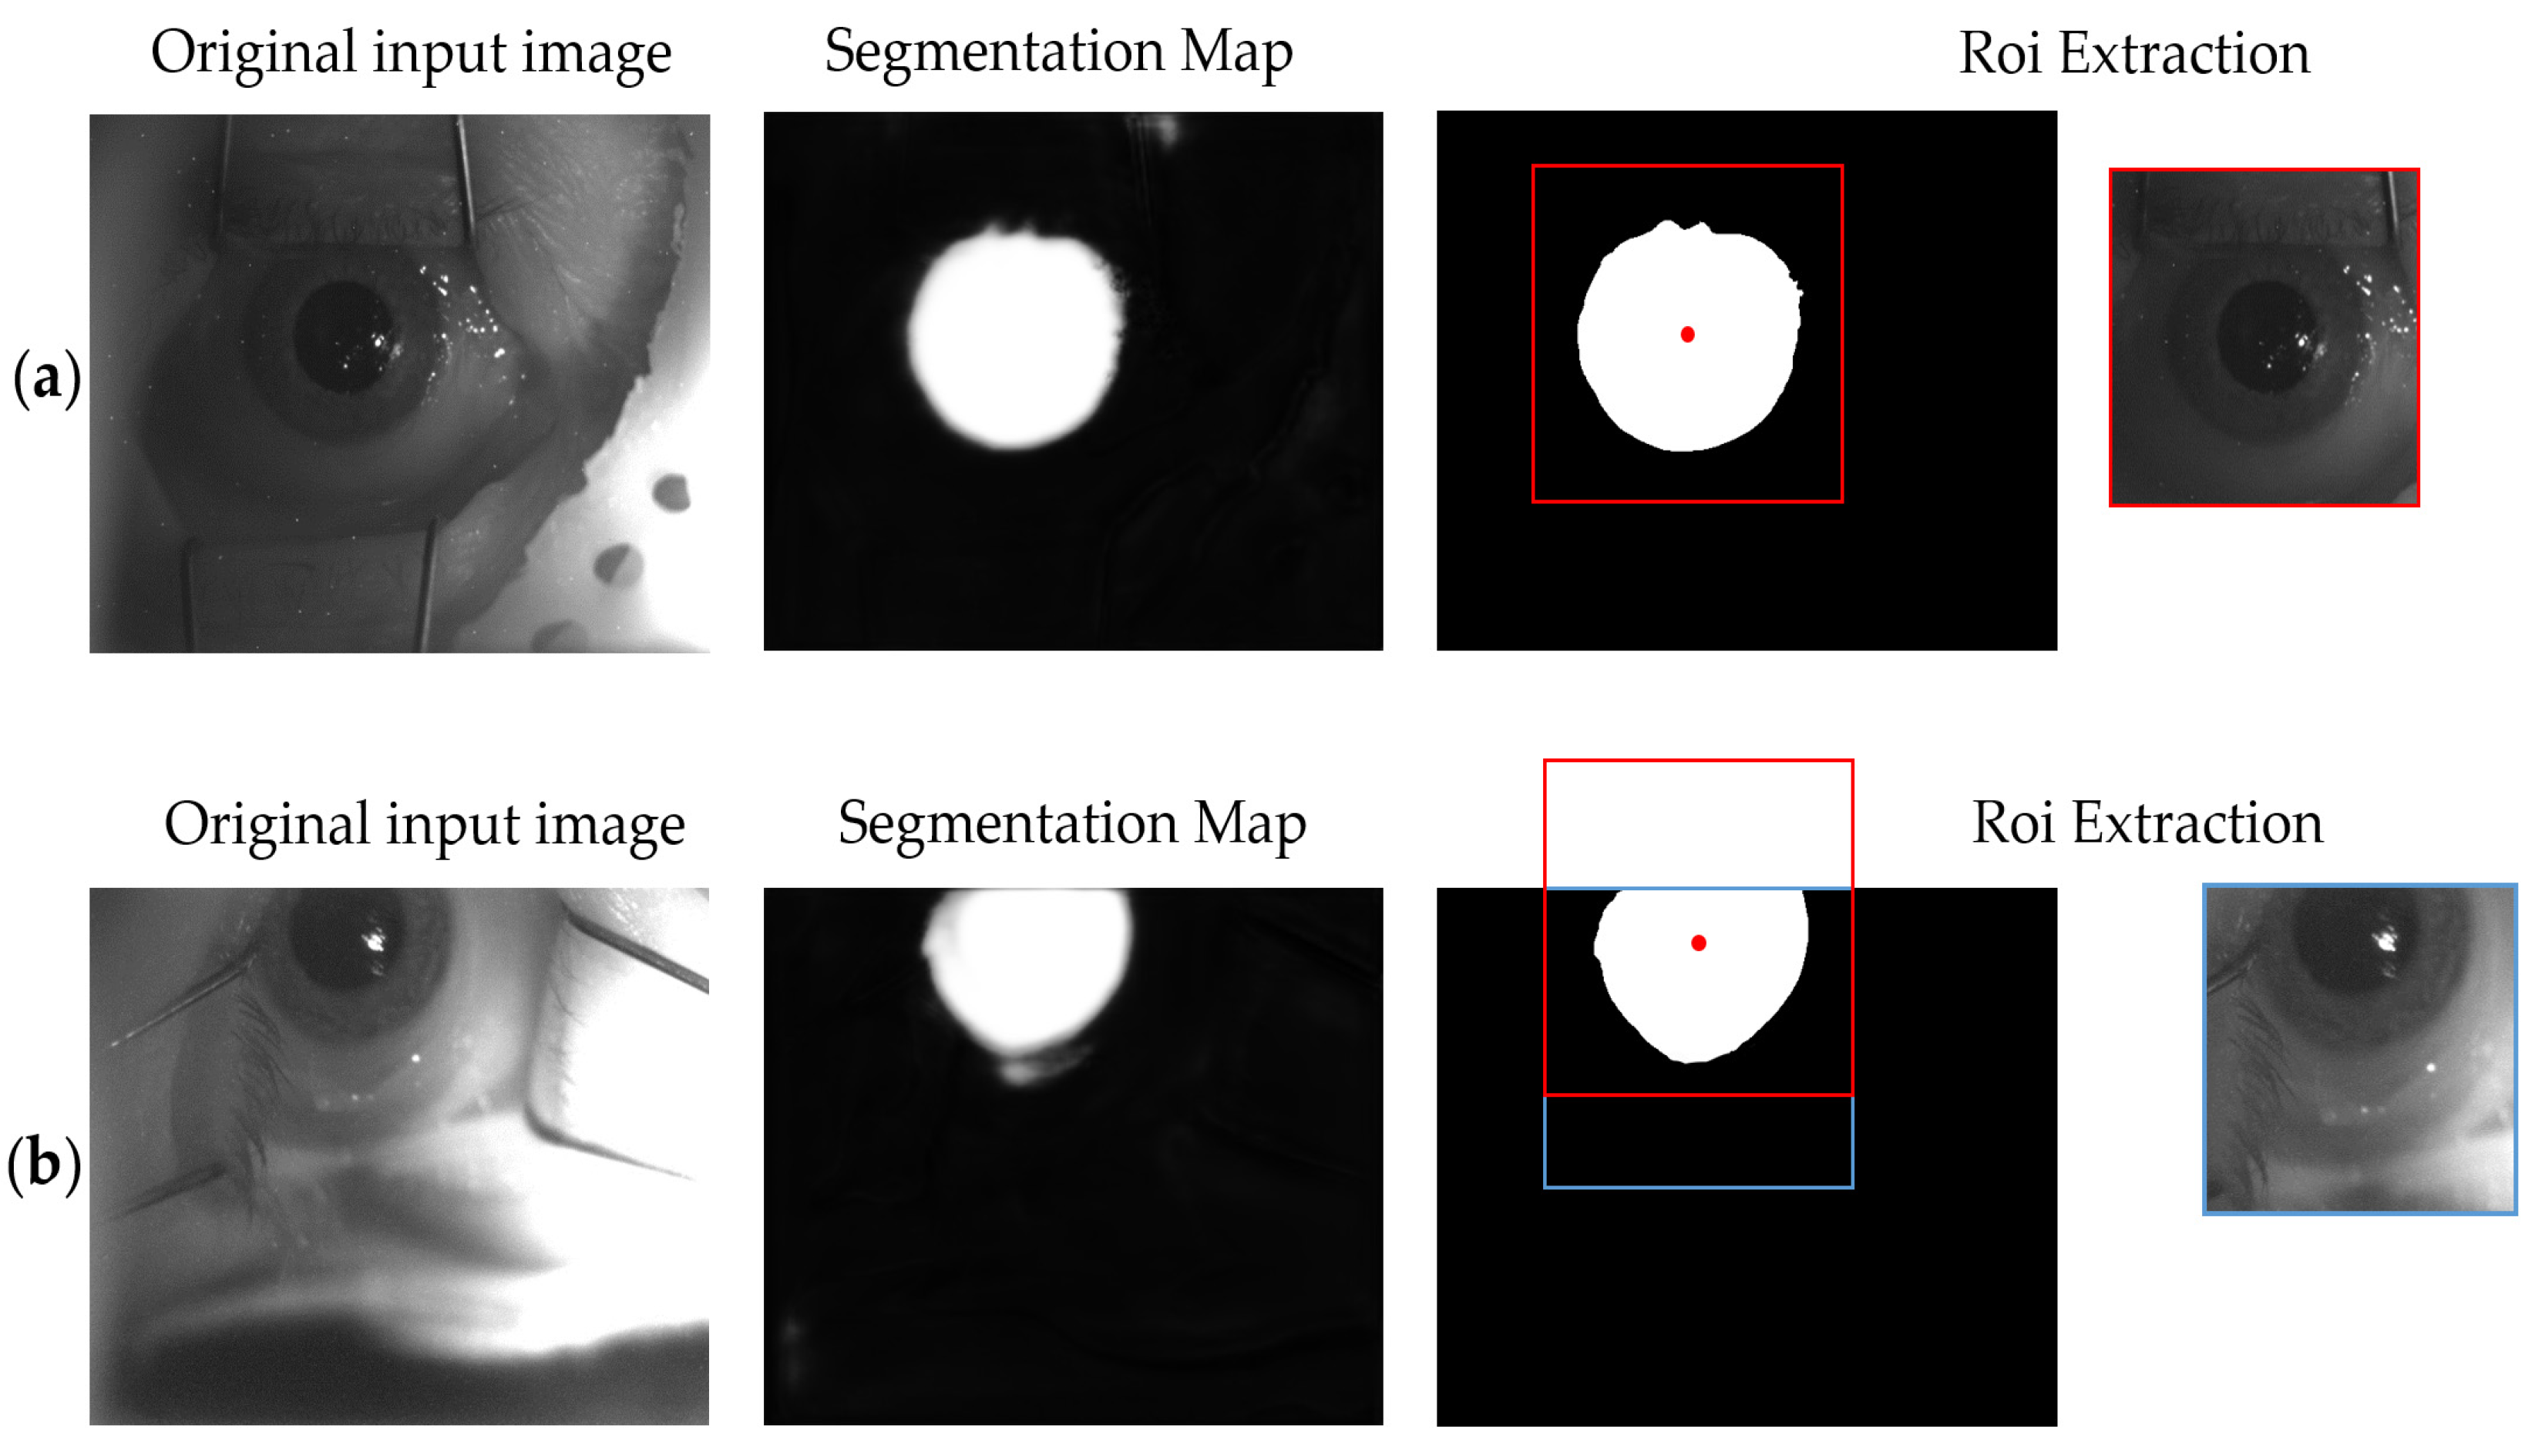
3.1. ROI U-Net
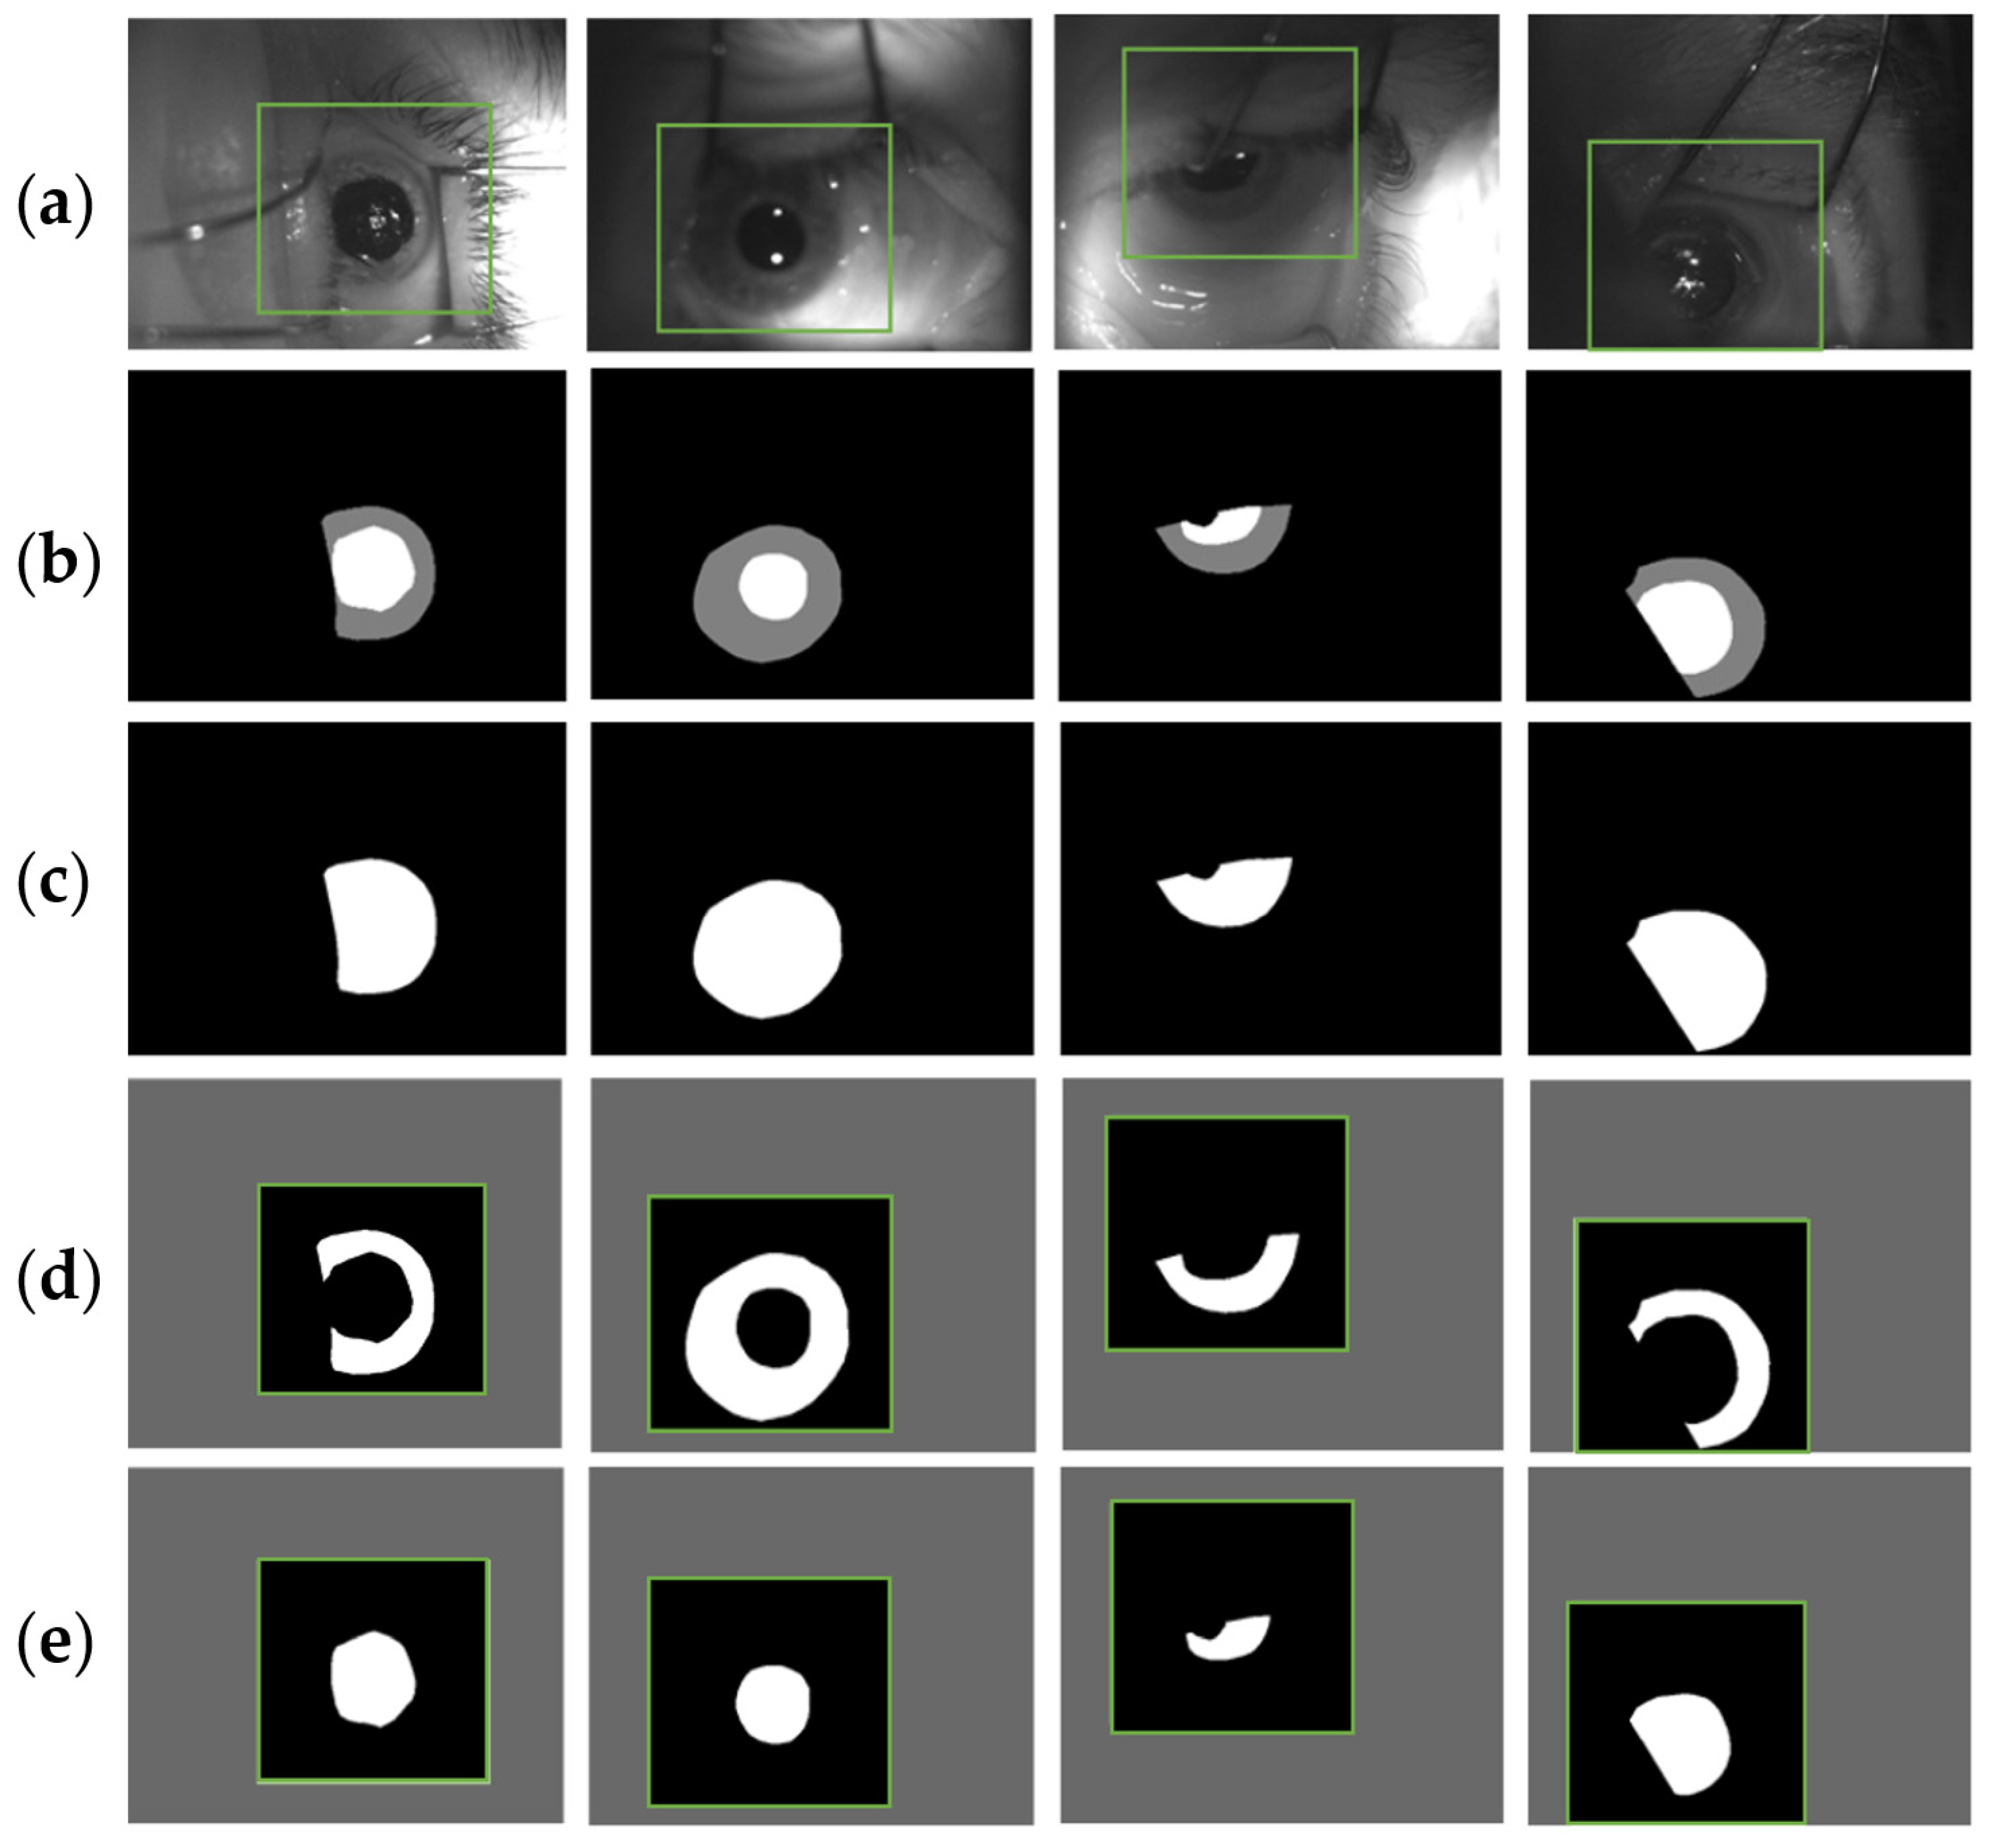
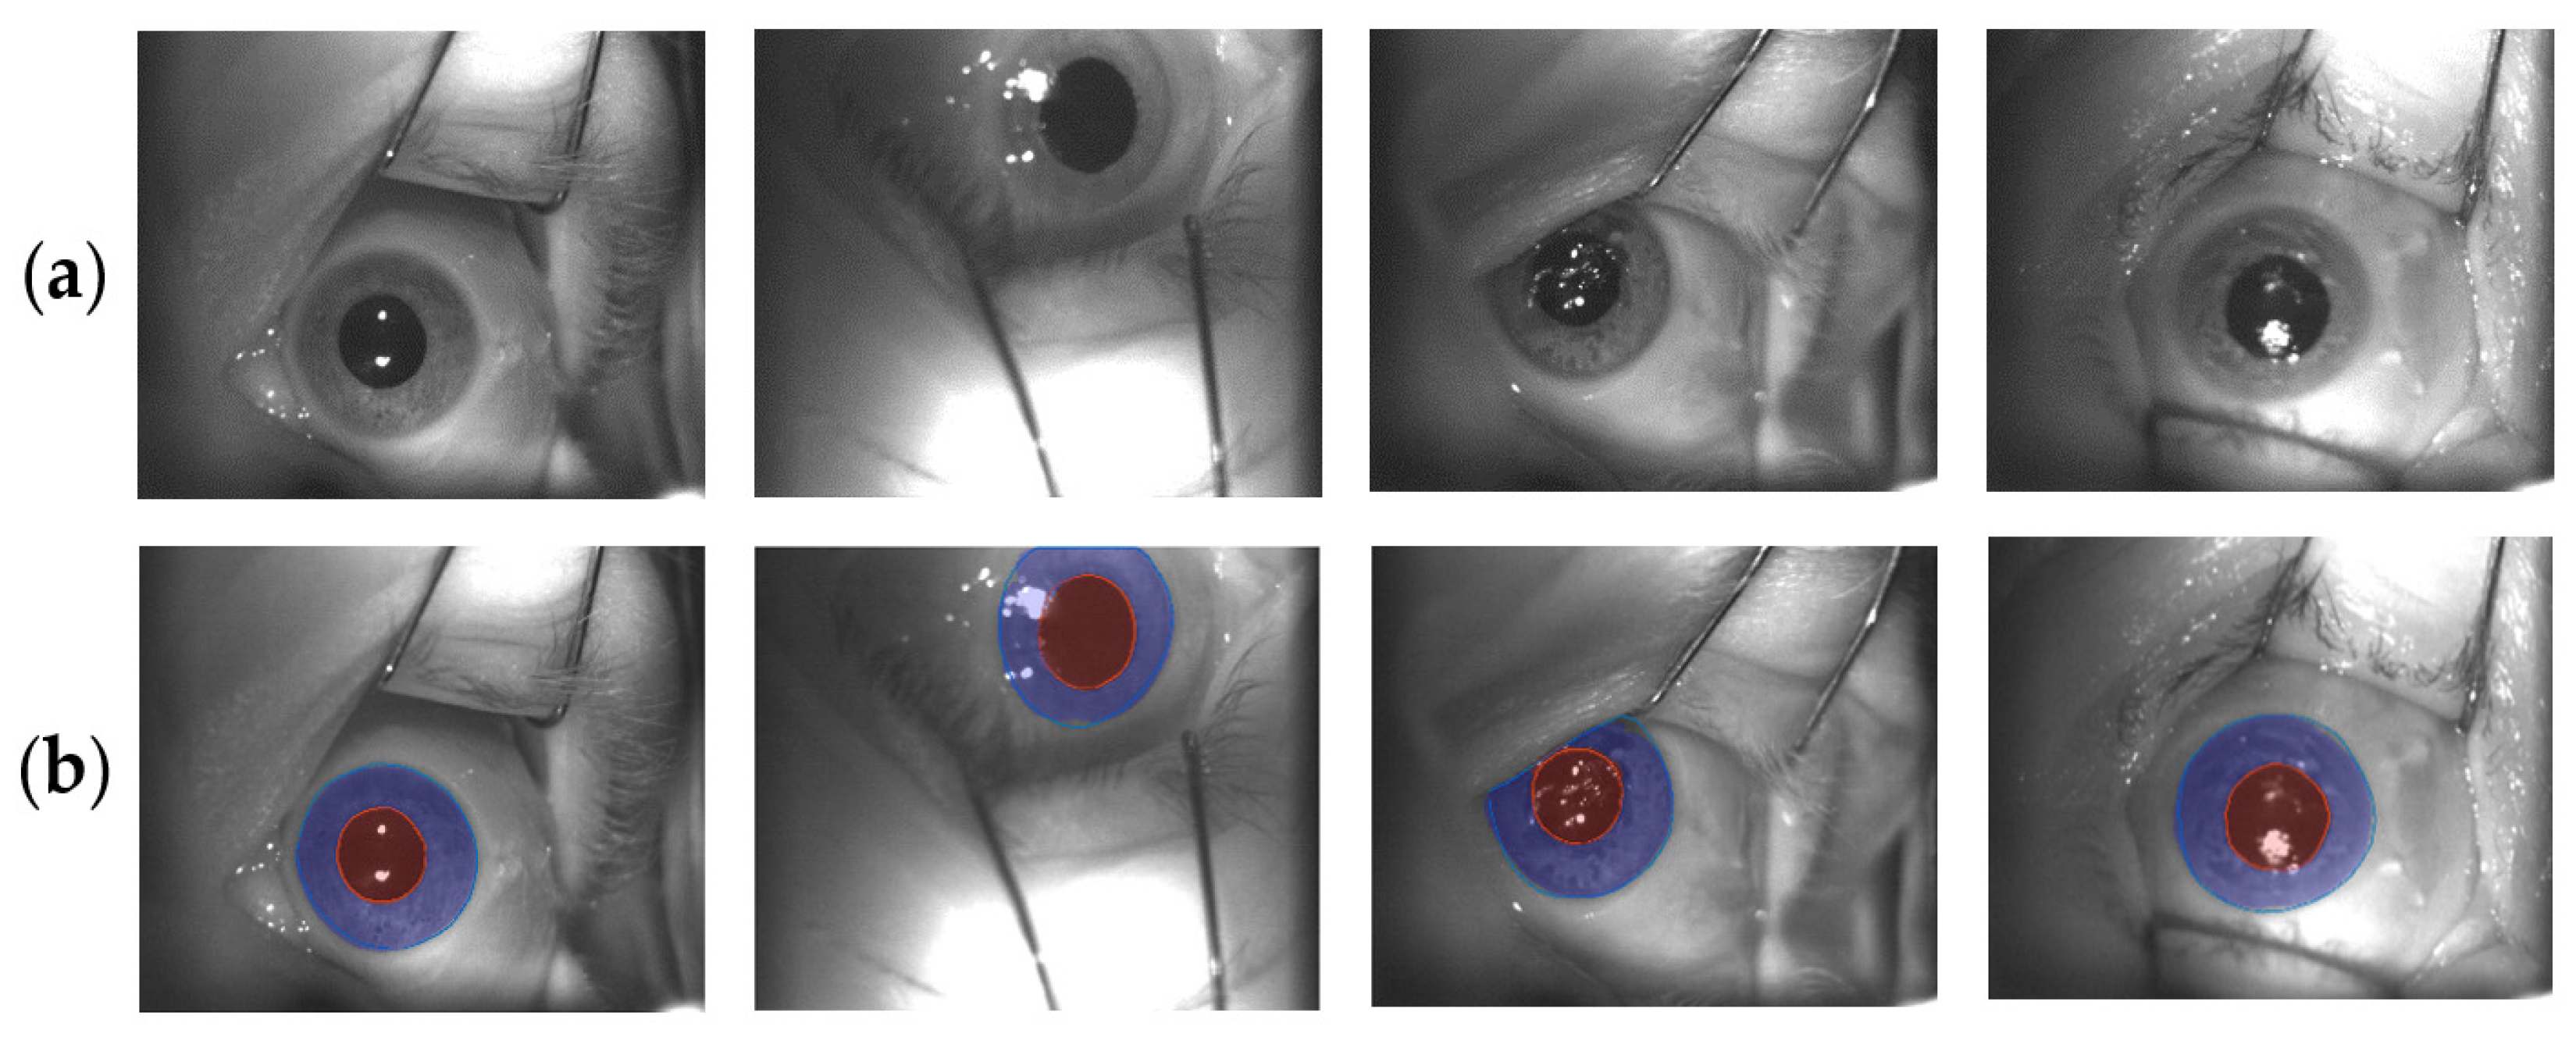
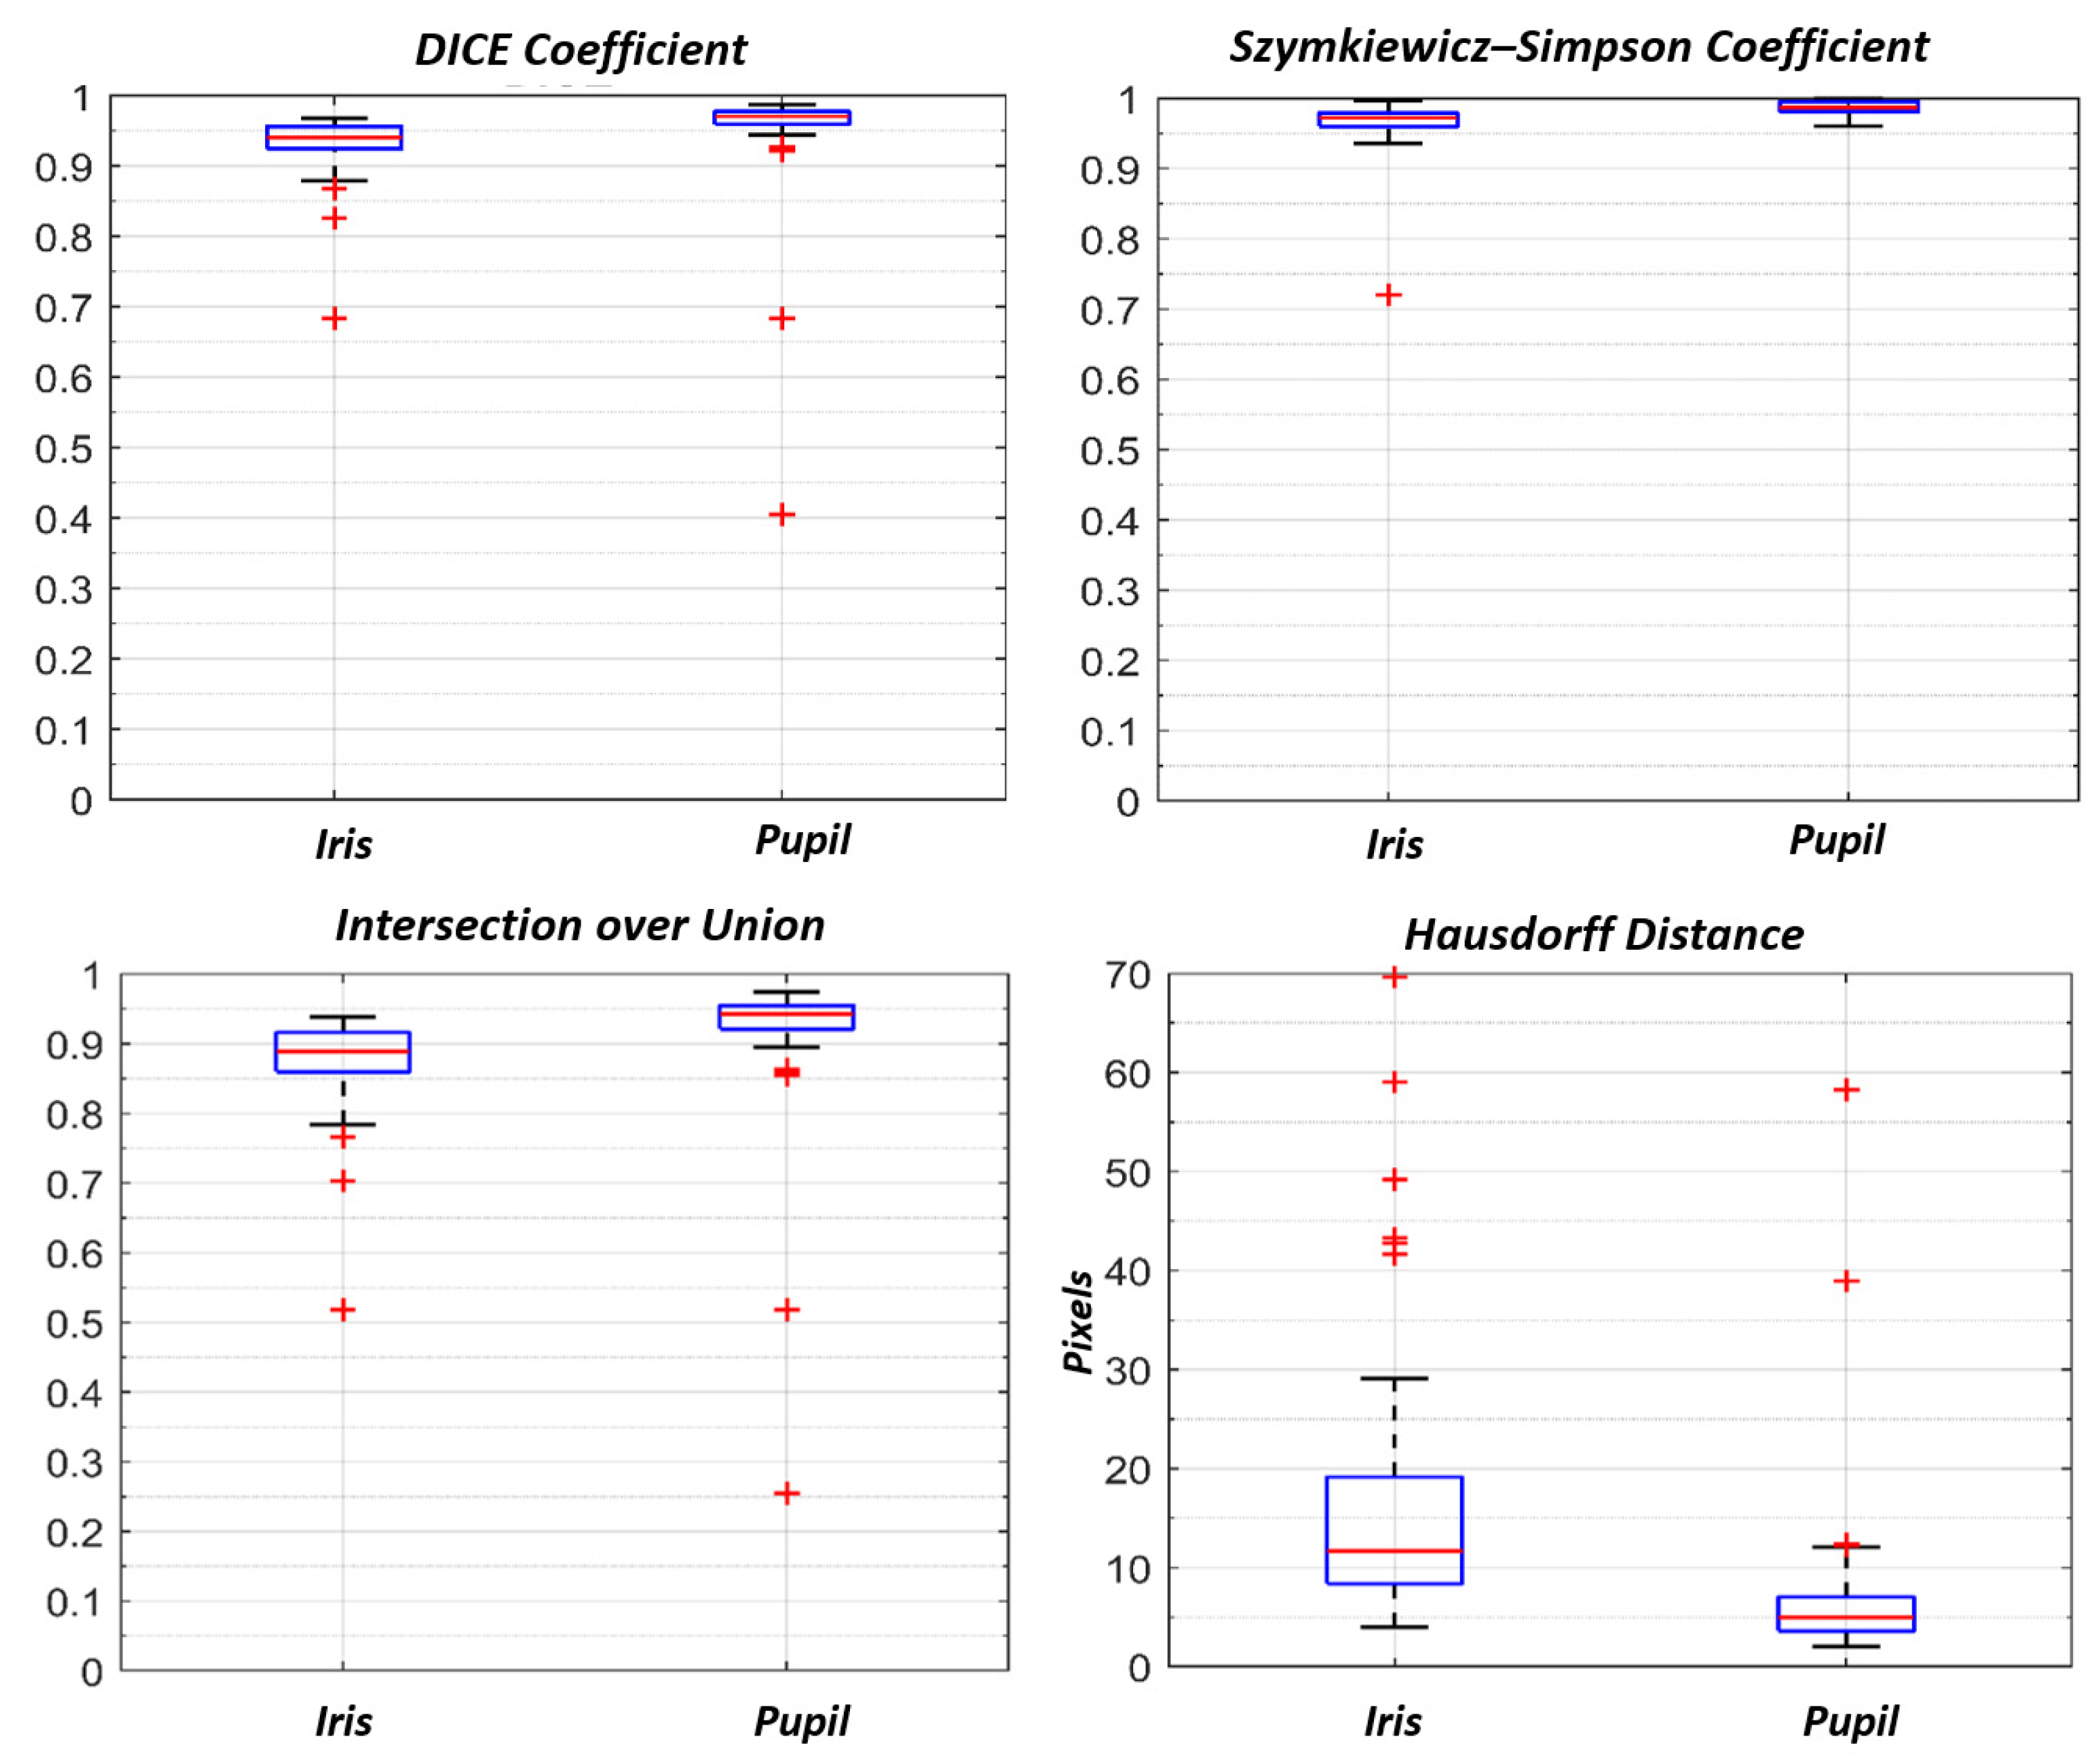
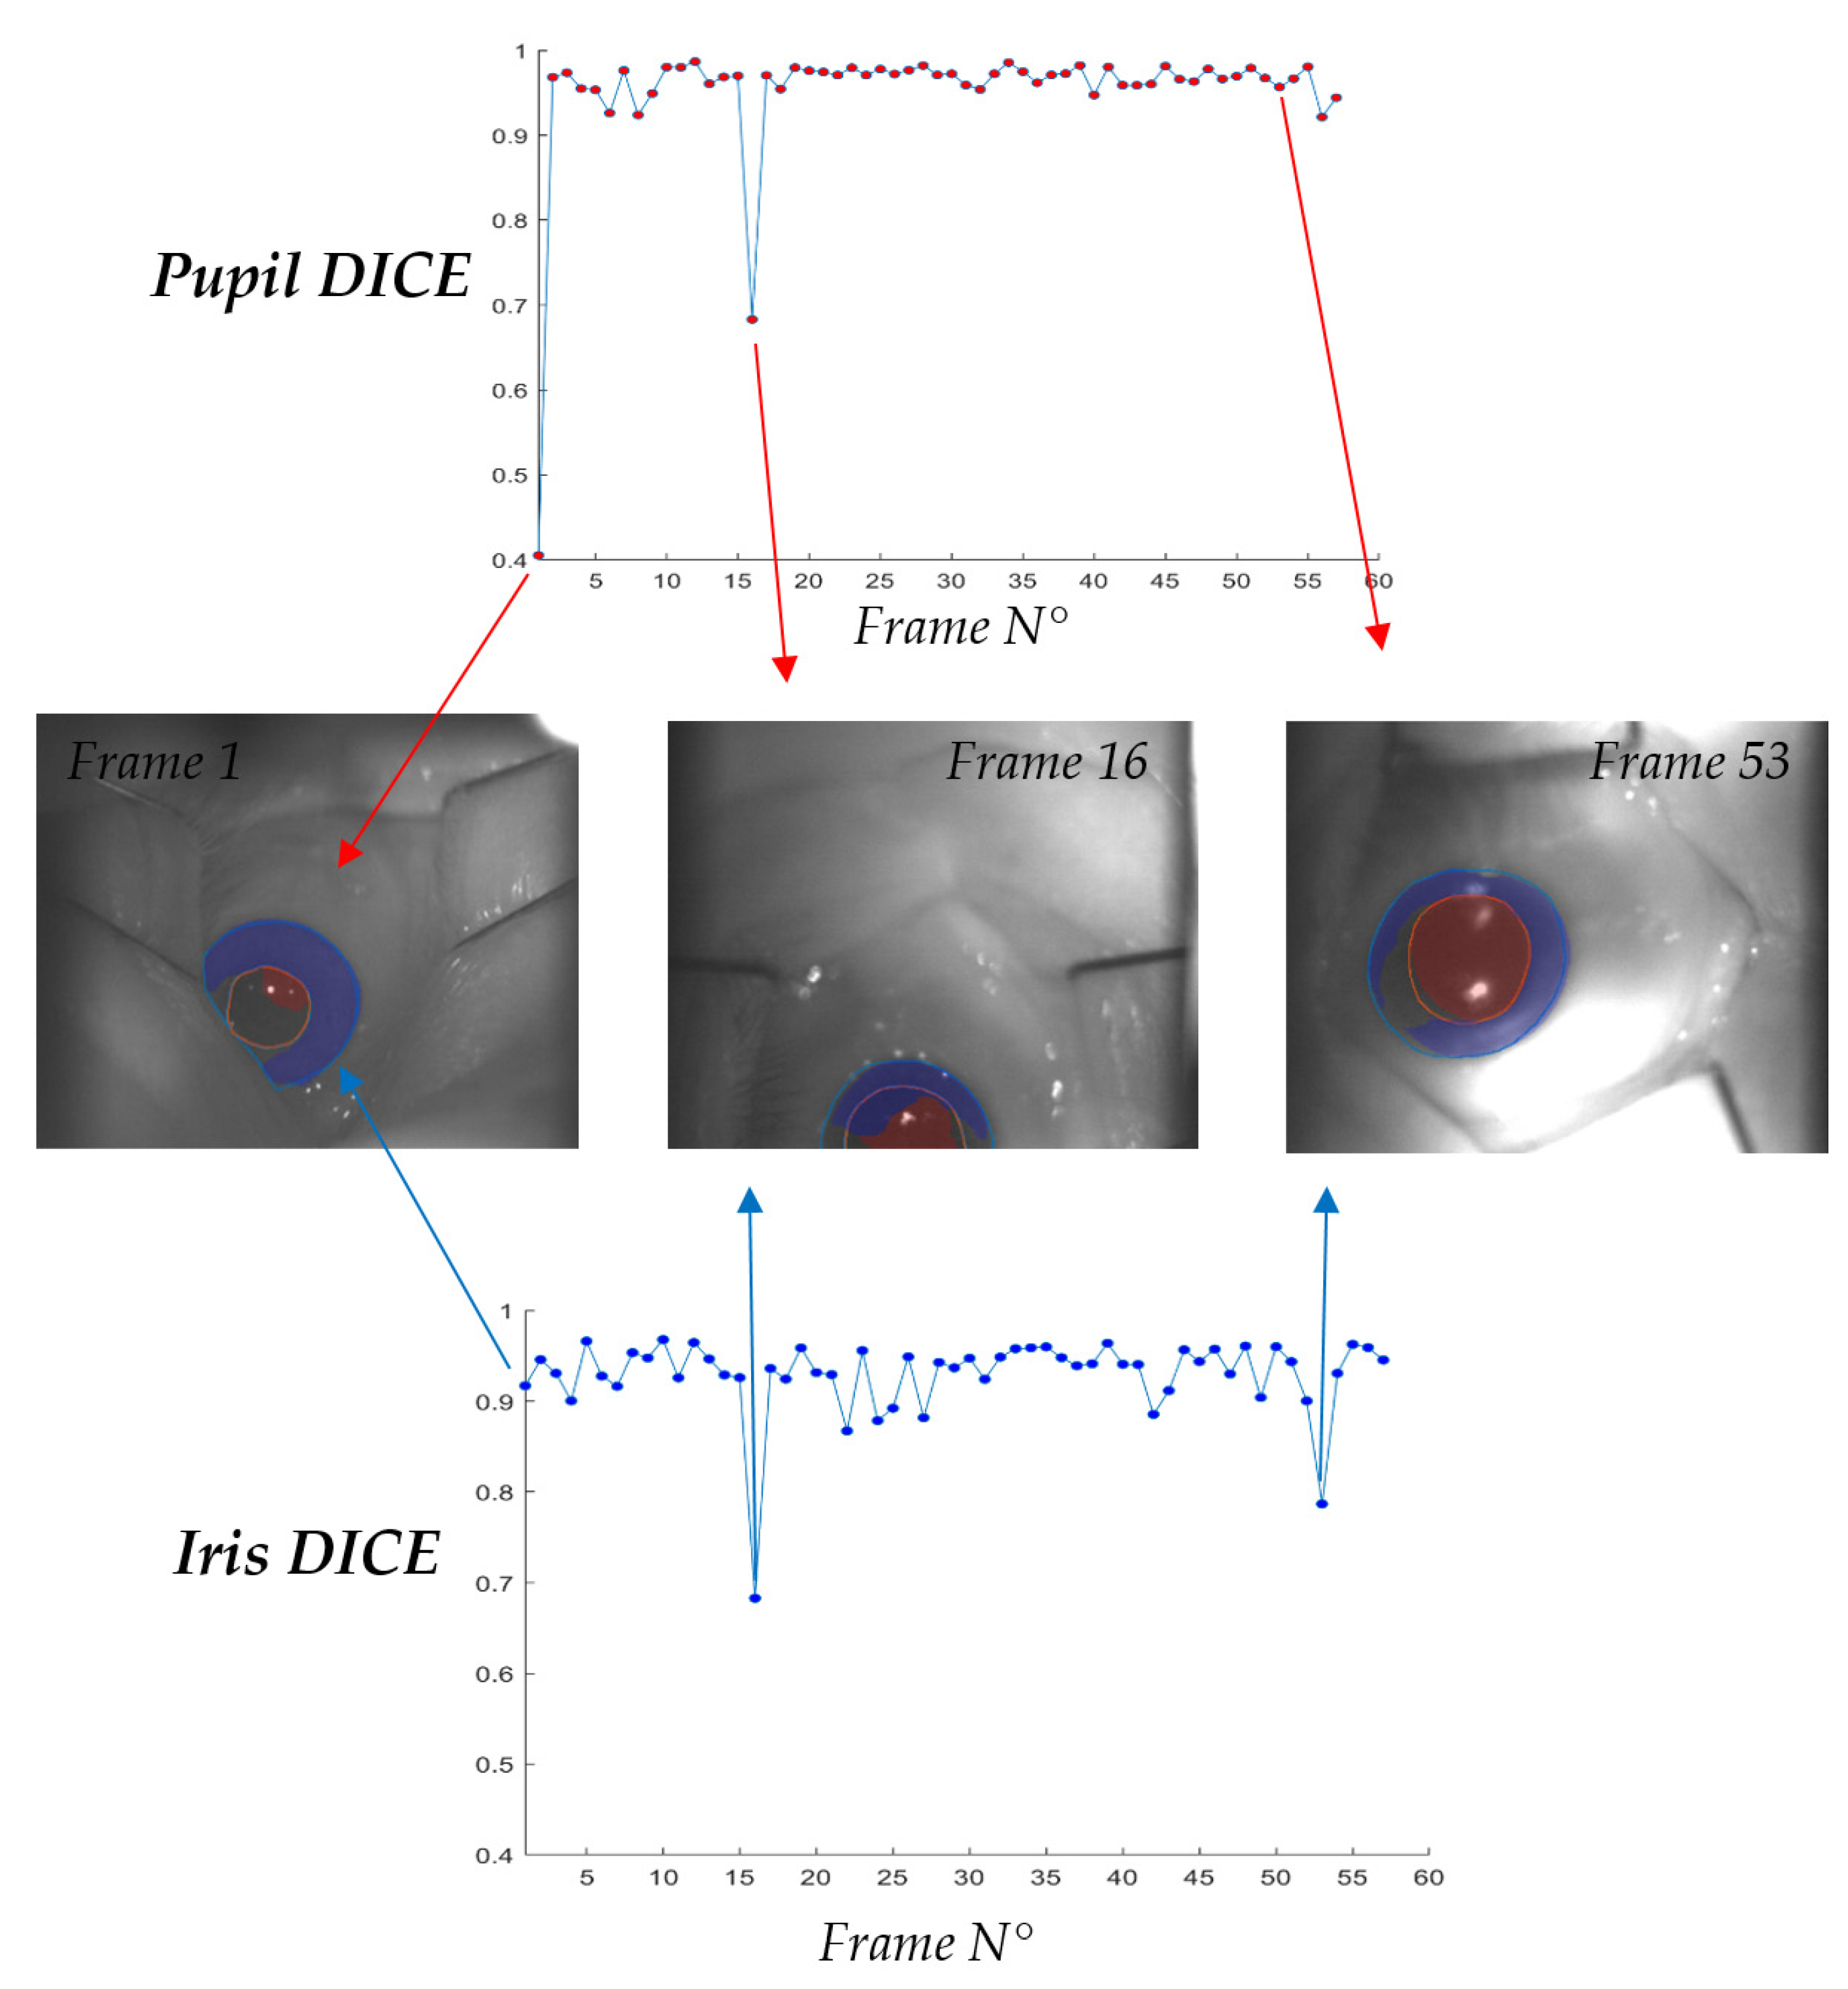
3.2. Iris U-Net and Pupil U-Net
3.3. Inference Time
4. Discussion
- Patient is immobilized on a treatment chair by using a personal thermoplastic mask;
- Eye retractors are placed to prevent eyelid movements and to maintain the eye wide open;
- Room illumination may be not homogenously diffused (this is a patient specific variable, since some of them are facilitated by low light conditions. ETS features two IR LEDs, resulting in insensitivity in those cases)
- Camera FOV is intrinsically not constant, depending by the desired gaze direction and the displacement of ETS in refer to the patient.
Author Contributions
Funding
Institutional Review Board Statement
Informed Consent Statement
Data Availability Statement
Conflicts of Interest
References
- Dieckmann, K.; Dunavoelgyi, R.; Langmann, G.; Ma, R.; Poetter, R.; Schmutzer, M.; Wackernagel, W.; Zehetmayer, M. Stereotactic Radiotherapy of Uveal Melanoma. In Clinical Ophthalmic Oncology; Springer: Berlin/Heidelberg, Germany, 2014. [Google Scholar]
- Wang, Z.; Nabhan, M.; Schild, S.E.; Stafford, S.L.; Petersen, I.A.; Foote, R.L.; Murad, M.H. Charged particle radiation therapy for uveal melanoma: A systematic review and meta-analysis. Int. J. Radiat. Oncol. Biol. Phys. 2013, 86, 18–26. [Google Scholar] [CrossRef]
- Maschi, C.; Thariat, J.; Herault, J.; Caujolle, J. Tumor response in uveal melanomas treated with proton beam therapy. Clin. Oncol. 2015, 28, 198–203. [Google Scholar] [CrossRef]
- Carnicer, A.; Angellier, G.; Thariat, J.; Sauerwein, W.; Caujolle, J.P.; Herault, J. Quantification of dose perturbations induced by external and internal accessories in ocular proton therapy and evaluation of their dosimetric impact. Med. Phys. 2013, 40, 061708. [Google Scholar] [CrossRef]
- Hrbacek, J.; Mishra, K.K.; Kacperek, A.; Dendale, R.; Nauraye, C.; Auger, M.; Herault, J.; Daftari, I.K.; Trofimov, A.V.; Shih, H.A.; et al. Practice Patterns Analysis of Ocular Proton Therapy Centers: The International OPTIC Survey. Int. J. Radiat. Oncol. Biol. Phys. 2016, 95, 336–343. [Google Scholar] [CrossRef]
- Via, R.; Pella, A.; Romanò, F.; Fassi, A.; Ricotti, R.; Tagaste, B.; Vai, A.; Mastella, E.; Fiore, M.R.; Valvo, F.; et al. A platform for patient positioning and motion monitoring in ocular proton therapy with a non-dedicated beamline. Phys. Med. 2019, 59, 55–63. [Google Scholar] [CrossRef]
- Ciocca, M.; Magro, G.; Mastella, E.; Mairani, A.; Mirandola, A.; Molinelli, S.; Russo, S.; Vai, A.; Fiore, M.R.; Mosci, C.; et al. Design and commissioning of the non-dedicated scanning proton beamline for ocular treatment at the synchrotron-based CNAO facility. Med. Phys. 2019, 46, 1852–1862. [Google Scholar] [CrossRef]
- Shin, D.; Yoo, S.H.; Moon, S.H.; Yoon, M.; Lee, S.B.; Park, S.Y. Eye tracking and gating system for proton therapy of orbital tumors. Med. Phys. 2012, 39, 4265–4273. [Google Scholar] [CrossRef] [PubMed]
- Petersch, B.; Bogner, J.; Dieckmann, K.; Pötter, R.; Georg, D. Automatic real-time surveillance of eye position and gating for stereotactic radiotherapy of uveal melanoma. Med. Phys. 2004, 31, 3521–3527. [Google Scholar] [CrossRef]
- Bogner, J.; Petersch, B.; Georg, D.; Dieckmann, K.; Zehetmayer, M.; Pötter, R. A noninvasive eye fixation and computer-aided eye monitoring system for linear accelerator-based stereotactic radiotherapy of uveal melanoma. Int. J. Radiat. Oncol. Biol. Phys. 2003, 56, 1128–1136. [Google Scholar] [CrossRef]
- Jaywant, S.M.; Osei, E.K.; Ladak, S. Stereotactic radiotherapy in the treatment of ocular melanoma: A noninvasive eye fixation aid and tracking system. J. Appl. Clin. Med. Phys. 2003, 4, 156–161. [Google Scholar] [CrossRef] [PubMed]
- Punde, P.A.; Jadhav, M.E.; Manza, R.R. A study of eye tracking technology and its applications. In Proceedings of the 2017 1st International Conference on Intelligent Systems and Information Management (ICISIM), Aurangabad, India, 5–6 October 2017; pp. 86–90. [Google Scholar] [CrossRef]
- Kim, J.; Stengel, M.; Majercik, A.; de Mello, S.; Dunn, D.; Laine, S.; McGuire, M.; Luebke, D. NVGaze: An anatomically-informed dataset for low-latency, near-eye gaze estimation. In Proceedings of the Conference on Human Factors in Computing Systems—Proceedings, Glasgow, UK, 4 May 2019; Volume 12, pp. 1–12. [Google Scholar]
- Sug, H. The effect of training set size for the performance of neural networks of classification. W. Trans. Comp. 2010, 9, 1297–1306. [Google Scholar]
- Cho, J.; Lee, K.; Shin, E.; Choy, G.; Do, S. How much data is needed to train a medical image deep learning system to achieve necessary high accuracy. arXiv 2015, arXiv:1511.06348. [Google Scholar]
- Yiu, Y.H.; Aboulatta, M.; Raiser, T.; Ophey, L.; Flanagin, V.L.; Zu Eulenburg, P.; Ahmadi, S.A. DeepVOG: Open-source pupil segmentation and gaze estimation in neuroscience using deep learning. J. Neurosci. Methods 2019, 324, 108307. [Google Scholar] [CrossRef] [PubMed]
- Chaudhary, A.K.; Kothari, R.; Acharya, M.; Dangi, S.; Nair, N.; Bailey, R.; Kanan, C.; Diaz, G.; Pelz, J.B. RITnet: Real-time Semantic Segmentation of the Eye for Gaze Tracking. In Proceedings of the 2019 IEEE/CVF International Conference on Computer Vision Workshop (ICCVW), Seoul, Korea, 27–28 October 2019. [Google Scholar] [CrossRef] [Green Version]
- Lee, Y.W.; Kim, K.W.; Hoang, T.M.; Arsalan, M.; Park, K.R. Deep Residual CNN-Based Ocular Recognition Based on Rough Pupil Detection in the Images by NIR Camera Sensor. Sensors 2019, 19, 842. [Google Scholar] [CrossRef] [PubMed] [Green Version]
- Fuhl, W.; Santini, T.; Kasneci, G.; Kasneci, E. PupilNet: Convolutional neural networks for robust pupil detection. arXiv 2016, arXiv:1601.04902. Available online: http://arxiv.org/abs/1601.04902 (accessed on 1 May 2021).
- Chinsatit, W.; Saitoh, T. CNN-based pupil center detection for wearable gaze estimation system. Appl. Comput. Intell. Soft Comput. 2017, 2017, 1–10. [Google Scholar] [CrossRef] [Green Version]
- Kondo, N.; Chinsatit, W.; Saitoh, T. Pupil center detection for infrared irradiation eye image using CNN. In Proceedings of the 2017 56th Annual Conference of the Society of Instrument and Control Engineers of Japan (SICE), Kanazawa, Japan, 19–22 September 2017; pp. 100–105. [Google Scholar]
- Zhao, Z.; Zhou, N.; Zhang, L.; Yan, H.; Xu, Y.; Zhang, Z. Driver Fatigue Detection Based on Convolutional Neural Networks Using EM-CNN. Comput. Intell. Neurosci. 2020, 2020, 7251280. [Google Scholar] [CrossRef]
- Arsalan, M.; Naqvi, R.A.; Kim, D.S.; Nguyen, P.H.; Owais, M.; Park, K.R. IrisDenseNet: Robust Iris Segmentation Using Densely Connected Fully Convolutional Networks in the Images by Visible Light and Near-Infrared Light Camera Sensors. Sensors 2018, 18, 1501. [Google Scholar] [CrossRef] [PubMed] [Green Version]
- Han, S.Y.; Kwon, H.J.; Kim, Y.; Cho, N.I. Noise-Robust Pupil Center Detection Through CNN-Based Segmentation with Shape-Prior Loss. IEEE Access 2020, 8, 64739–64749. [Google Scholar] [CrossRef]
- Kayalibay, B.; Jensen, G.; Smagt, P. CNN-Based Segmentation of Medical Imaging Data. 2017. Available online: https://arxiv.org/abs/1701.03056 (accessed on 21 March 2021).
- Ronneberger, O.; Fischer, P.; Brox, T. U-Net: Convolutional Networks for Biomedical Image Segmentation. In Proceedings of the Medical Image Computing and Computer-Assisted Intervention—MICCAI 2015, Munich, Germany, 5–9 October 2015. [Google Scholar]
- Ricotti, R.; Pella, A.; Elisei, G.; Tagaste, B.; Bello, F.; Fontana, G.; Fiore, M.R.; Ciocca, M.; Mastella, E.; Orlandi, E.; et al. Gaze Stability During Ocular Proton Therapy: Quantitative Evaluation Based on Eye Surface Surveillance Videos. In Pattern Recognition. ICPR International Workshops and Challenges; Springer: Berlin/Heidelberg, Germany, 2021. [Google Scholar] [CrossRef]
- Chollet, F. Kera. Available online: https://github.com/fchollet/keras (accessed on 1 May 2021).
- Aziz, T.A.; Hanbury, A. Metrics for evaluating 3D medical image segmentation: Analysis, selection, and tool. BMC Med. Imaging 2015, 15, 29. [Google Scholar] [CrossRef] [Green Version]
- Wang, C.; MacGillivray, T.; Macnaught, G.; Yang, G.; Newby, D.E. A two-stage 3D U-net framework for multi-class segmentation on full resolution image. arXiv 2018. Available online: https://arxiv.org/abs/1804.04341 (accessed on 16 March 2021).
- Galea, R.-R.; Diosan, L.; Andreica, A.; Popa, L.; Manole, S.; Bálint, Z. Region-of-Interest-Based Cardiac Image Segmentation with Deep Learning. Appl. Sci. 2021, 11, 1965. [Google Scholar] [CrossRef]


| Fixation Eye | N. of Patients | Left Eye | Right Eye |
|---|---|---|---|
| Diseased | 110 | 61 | 49 |
| Contralateral | 30 | 14 | 16 |
| DICE Coefficient | Szymkiewicz–Simpson Coefficient | IoU Area | Hausdorff Distance (Pixel) | |
|---|---|---|---|---|
| Iris | 0.94 (0.96–0.92) | 0.97(0.98–0.96) | 0.88 (0.92–0.86) | 11.7 (19.1–8.4) |
| Pupil | 0.97 (0.98–0.96) | 0.99 (0.99–0.98) | 0.94 (0.96–0.92) | 5.0 (7.0–3.6) |
| Tesla K80 CC: 3.7 | Tesla T4 CC: 7.5 | No GPU | |
|---|---|---|---|
| ROI Prediction | 105 (110–103) ms | 105 (110–103) ms | 121 (124–117) ms |
| ROI Post-Processing | 44 (45–43) ms | 37 (38–37) ms | 29 (30–29) ms |
| IRIS Prediction | 67 (69–61) ms | 45 (45–43) ms | 93 (95–90) ms |
| Pupil Prediction | 73 (74–71) ms | 47 (48–45) ms | 93 (95–90) ms |
| Final Post-processing | 50 (51–49) ms | 43 (45–42) ms | 30 (31–29) ms |
| Total Inference Time | 338 (340–335) ms | 249 (251–245) ms | 366 (371–359) ms |
Publisher’s Note: MDPI stays neutral with regard to jurisdictional claims in published maps and institutional affiliations. |
© 2021 by the authors. Licensee MDPI, Basel, Switzerland. This article is an open access article distributed under the terms and conditions of the Creative Commons Attribution (CC BY) license (https://creativecommons.org/licenses/by/4.0/).
Share and Cite
Antonioli, L.; Pella, A.; Ricotti, R.; Rossi, M.; Fiore, M.R.; Belotti, G.; Magro, G.; Paganelli, C.; Orlandi, E.; Ciocca, M.; et al. Convolutional Neural Networks Cascade for Automatic Pupil and Iris Detection in Ocular Proton Therapy. Sensors 2021, 21, 4400. https://doi.org/10.3390/s21134400
Antonioli L, Pella A, Ricotti R, Rossi M, Fiore MR, Belotti G, Magro G, Paganelli C, Orlandi E, Ciocca M, et al. Convolutional Neural Networks Cascade for Automatic Pupil and Iris Detection in Ocular Proton Therapy. Sensors. 2021; 21(13):4400. https://doi.org/10.3390/s21134400
Chicago/Turabian StyleAntonioli, Luca, Andrea Pella, Rosalinda Ricotti, Matteo Rossi, Maria Rosaria Fiore, Gabriele Belotti, Giuseppe Magro, Chiara Paganelli, Ester Orlandi, Mario Ciocca, and et al. 2021. "Convolutional Neural Networks Cascade for Automatic Pupil and Iris Detection in Ocular Proton Therapy" Sensors 21, no. 13: 4400. https://doi.org/10.3390/s21134400
APA StyleAntonioli, L., Pella, A., Ricotti, R., Rossi, M., Fiore, M. R., Belotti, G., Magro, G., Paganelli, C., Orlandi, E., Ciocca, M., & Baroni, G. (2021). Convolutional Neural Networks Cascade for Automatic Pupil and Iris Detection in Ocular Proton Therapy. Sensors, 21(13), 4400. https://doi.org/10.3390/s21134400