
Influence of Features on Accuracy of Anomaly Detection for an Energy Trading System


Abstract
:1. Introduction
2. Related Works
2.1. Anomaly Detection
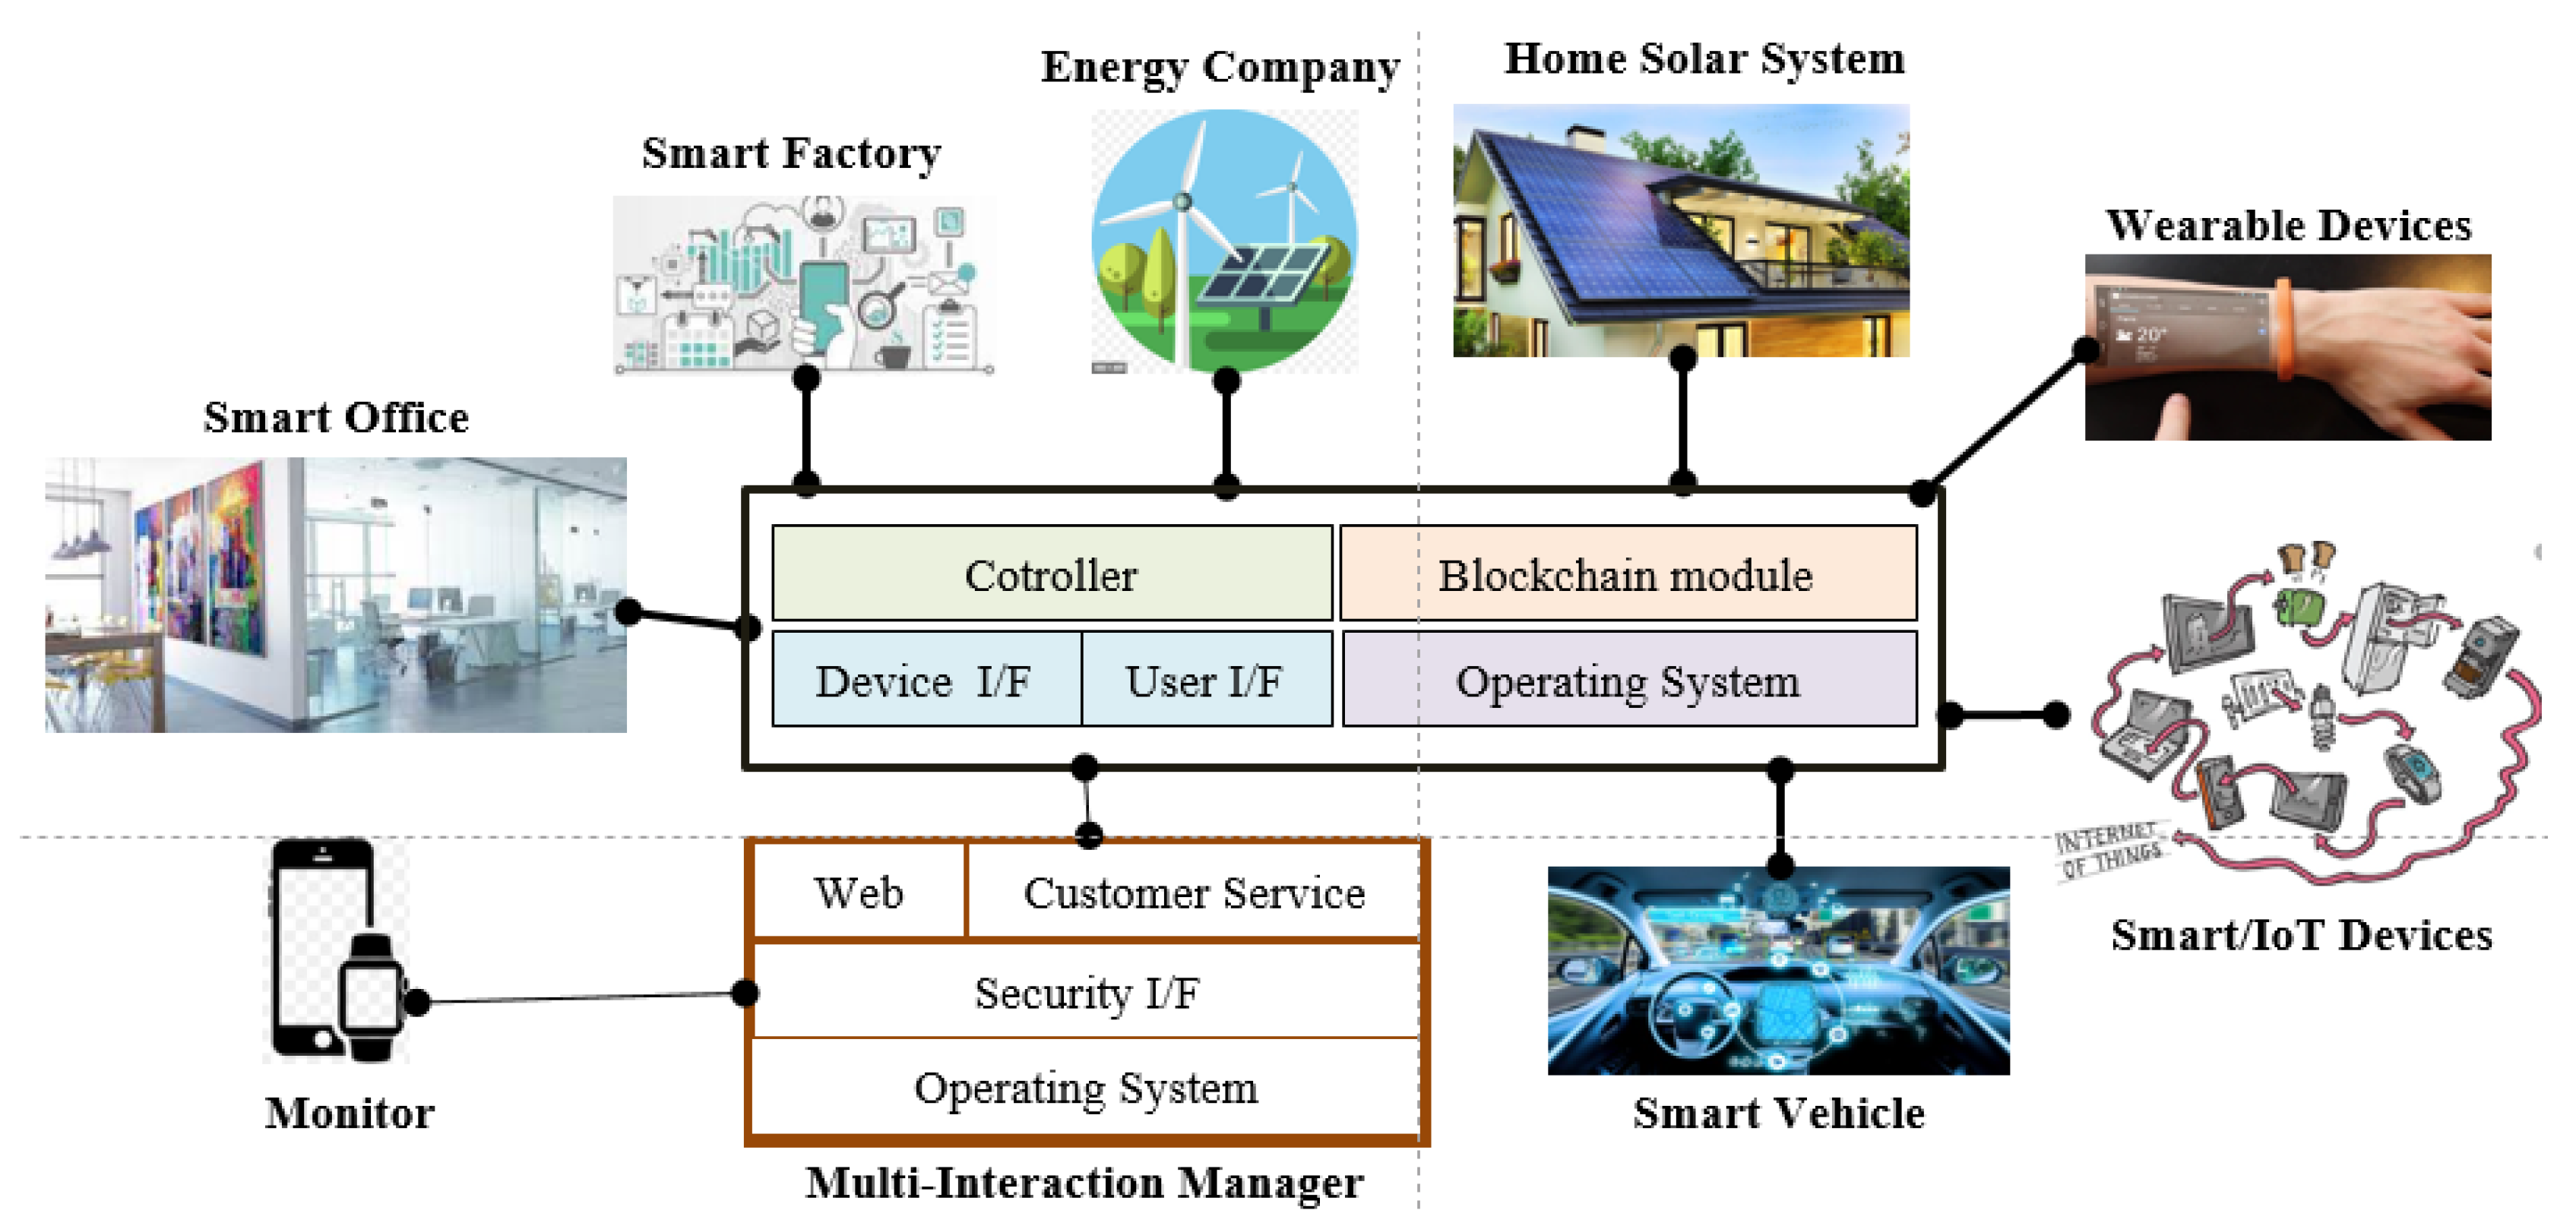
2.2. Energy Network for an Energy Trade Market
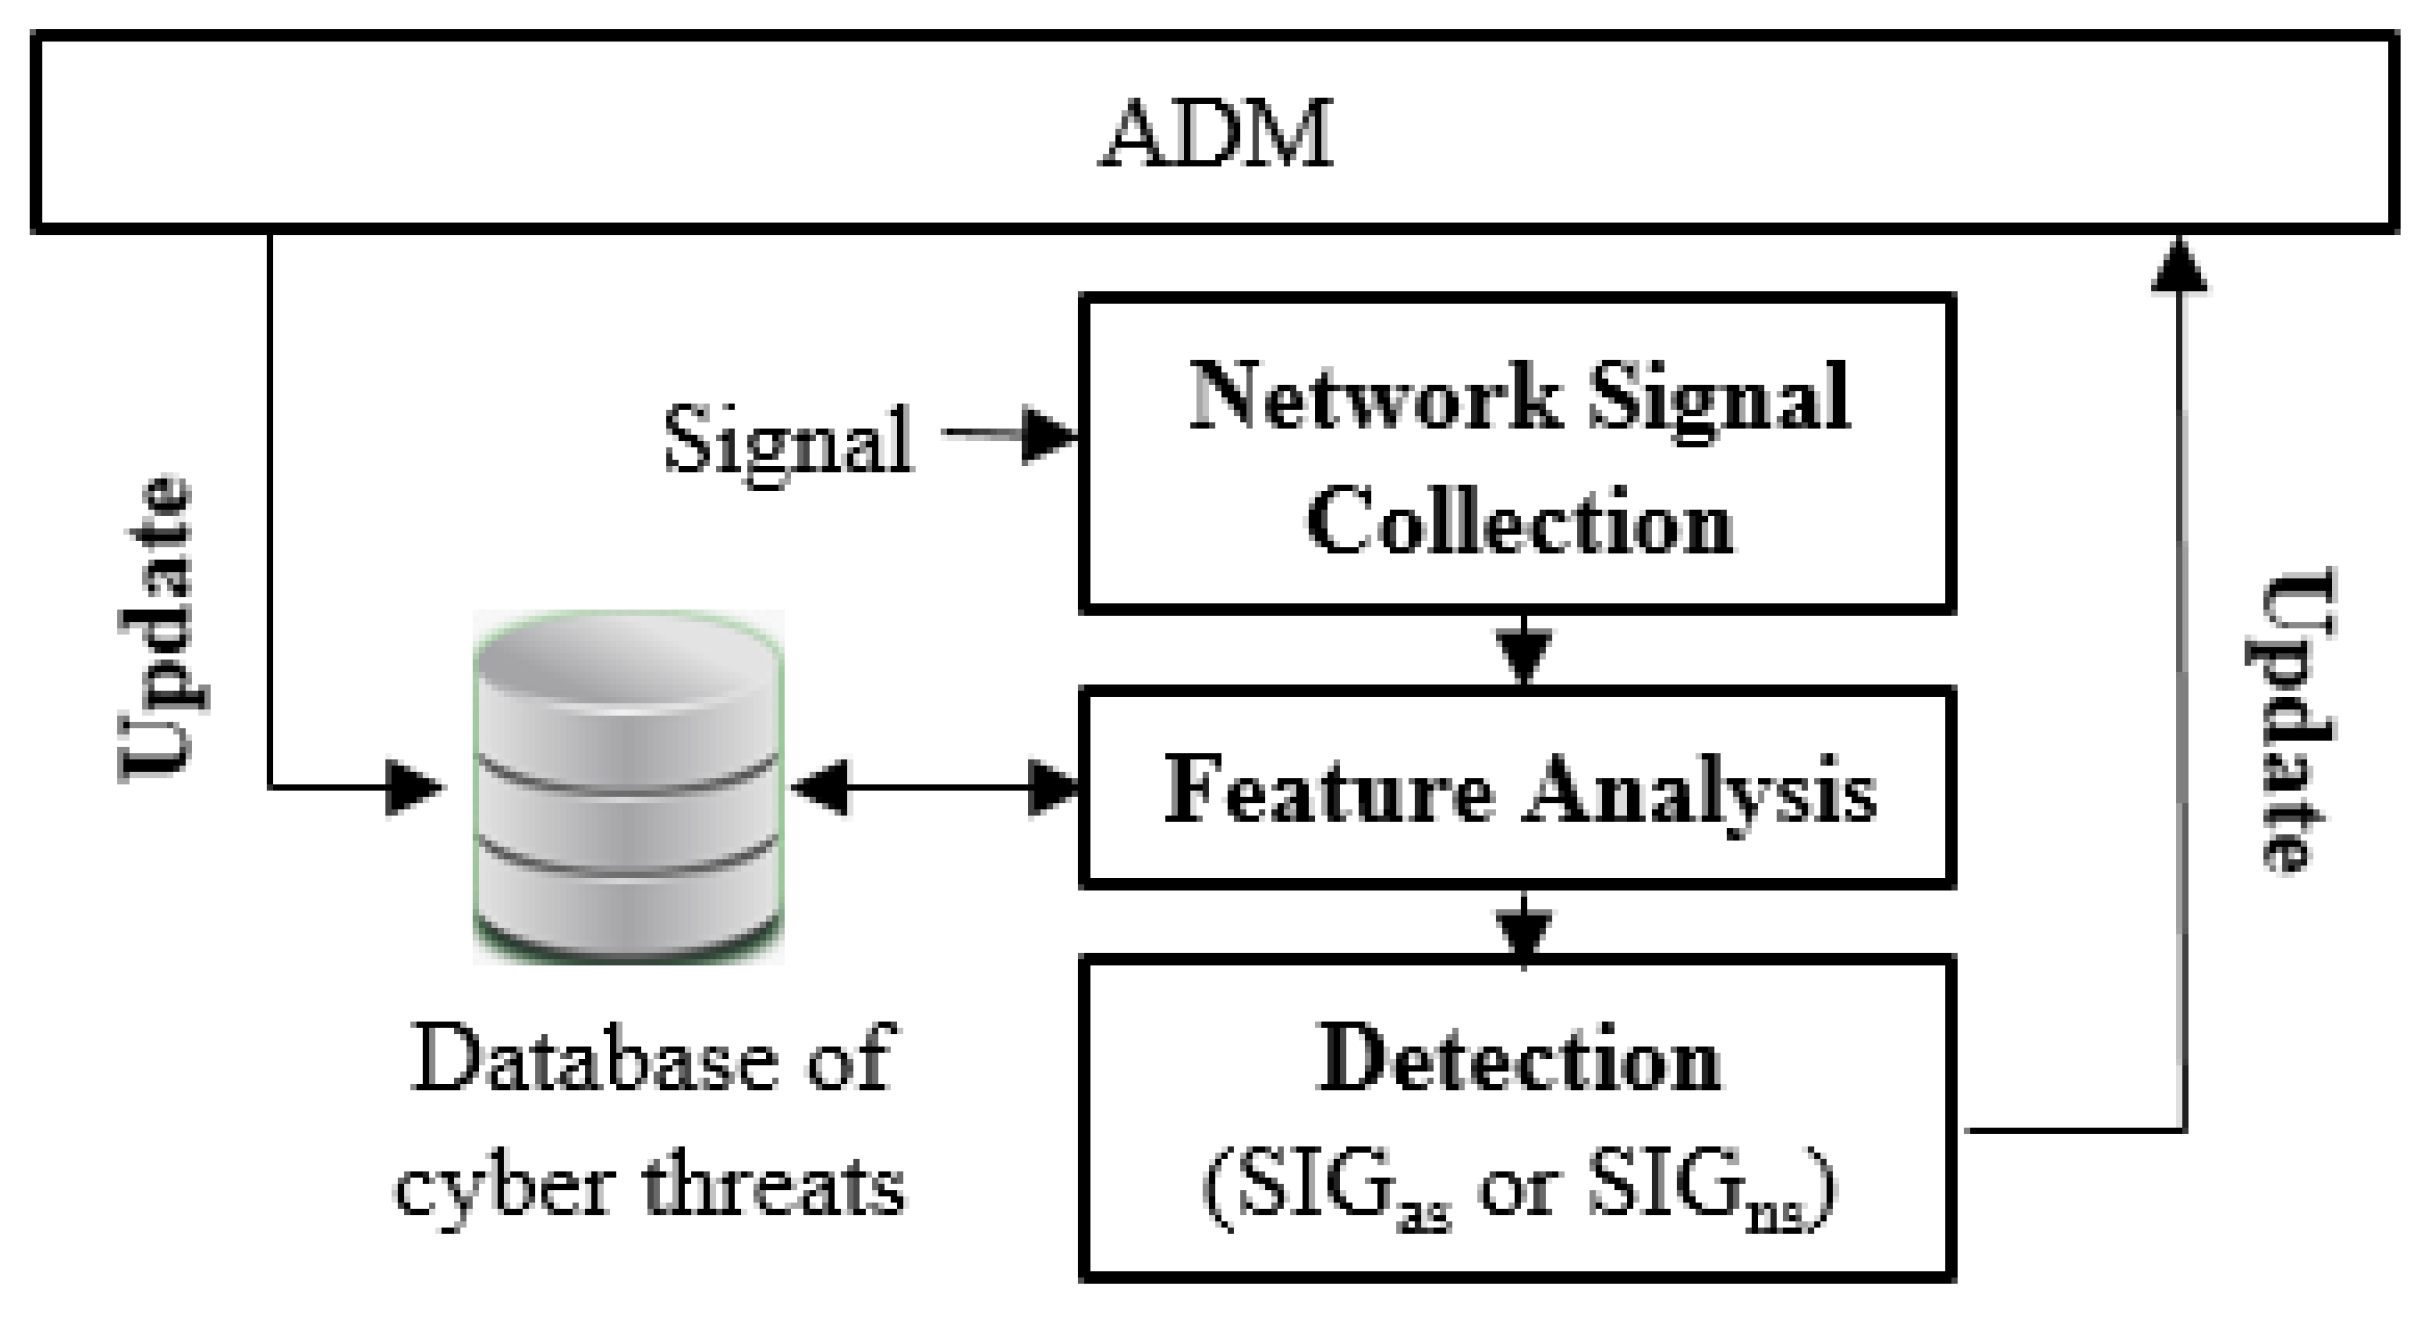
3. Anomaly Detection Model (ADM)
3.1. The Collection of Network Signals
3.2. Analysis of Network Signals
4. Analysis
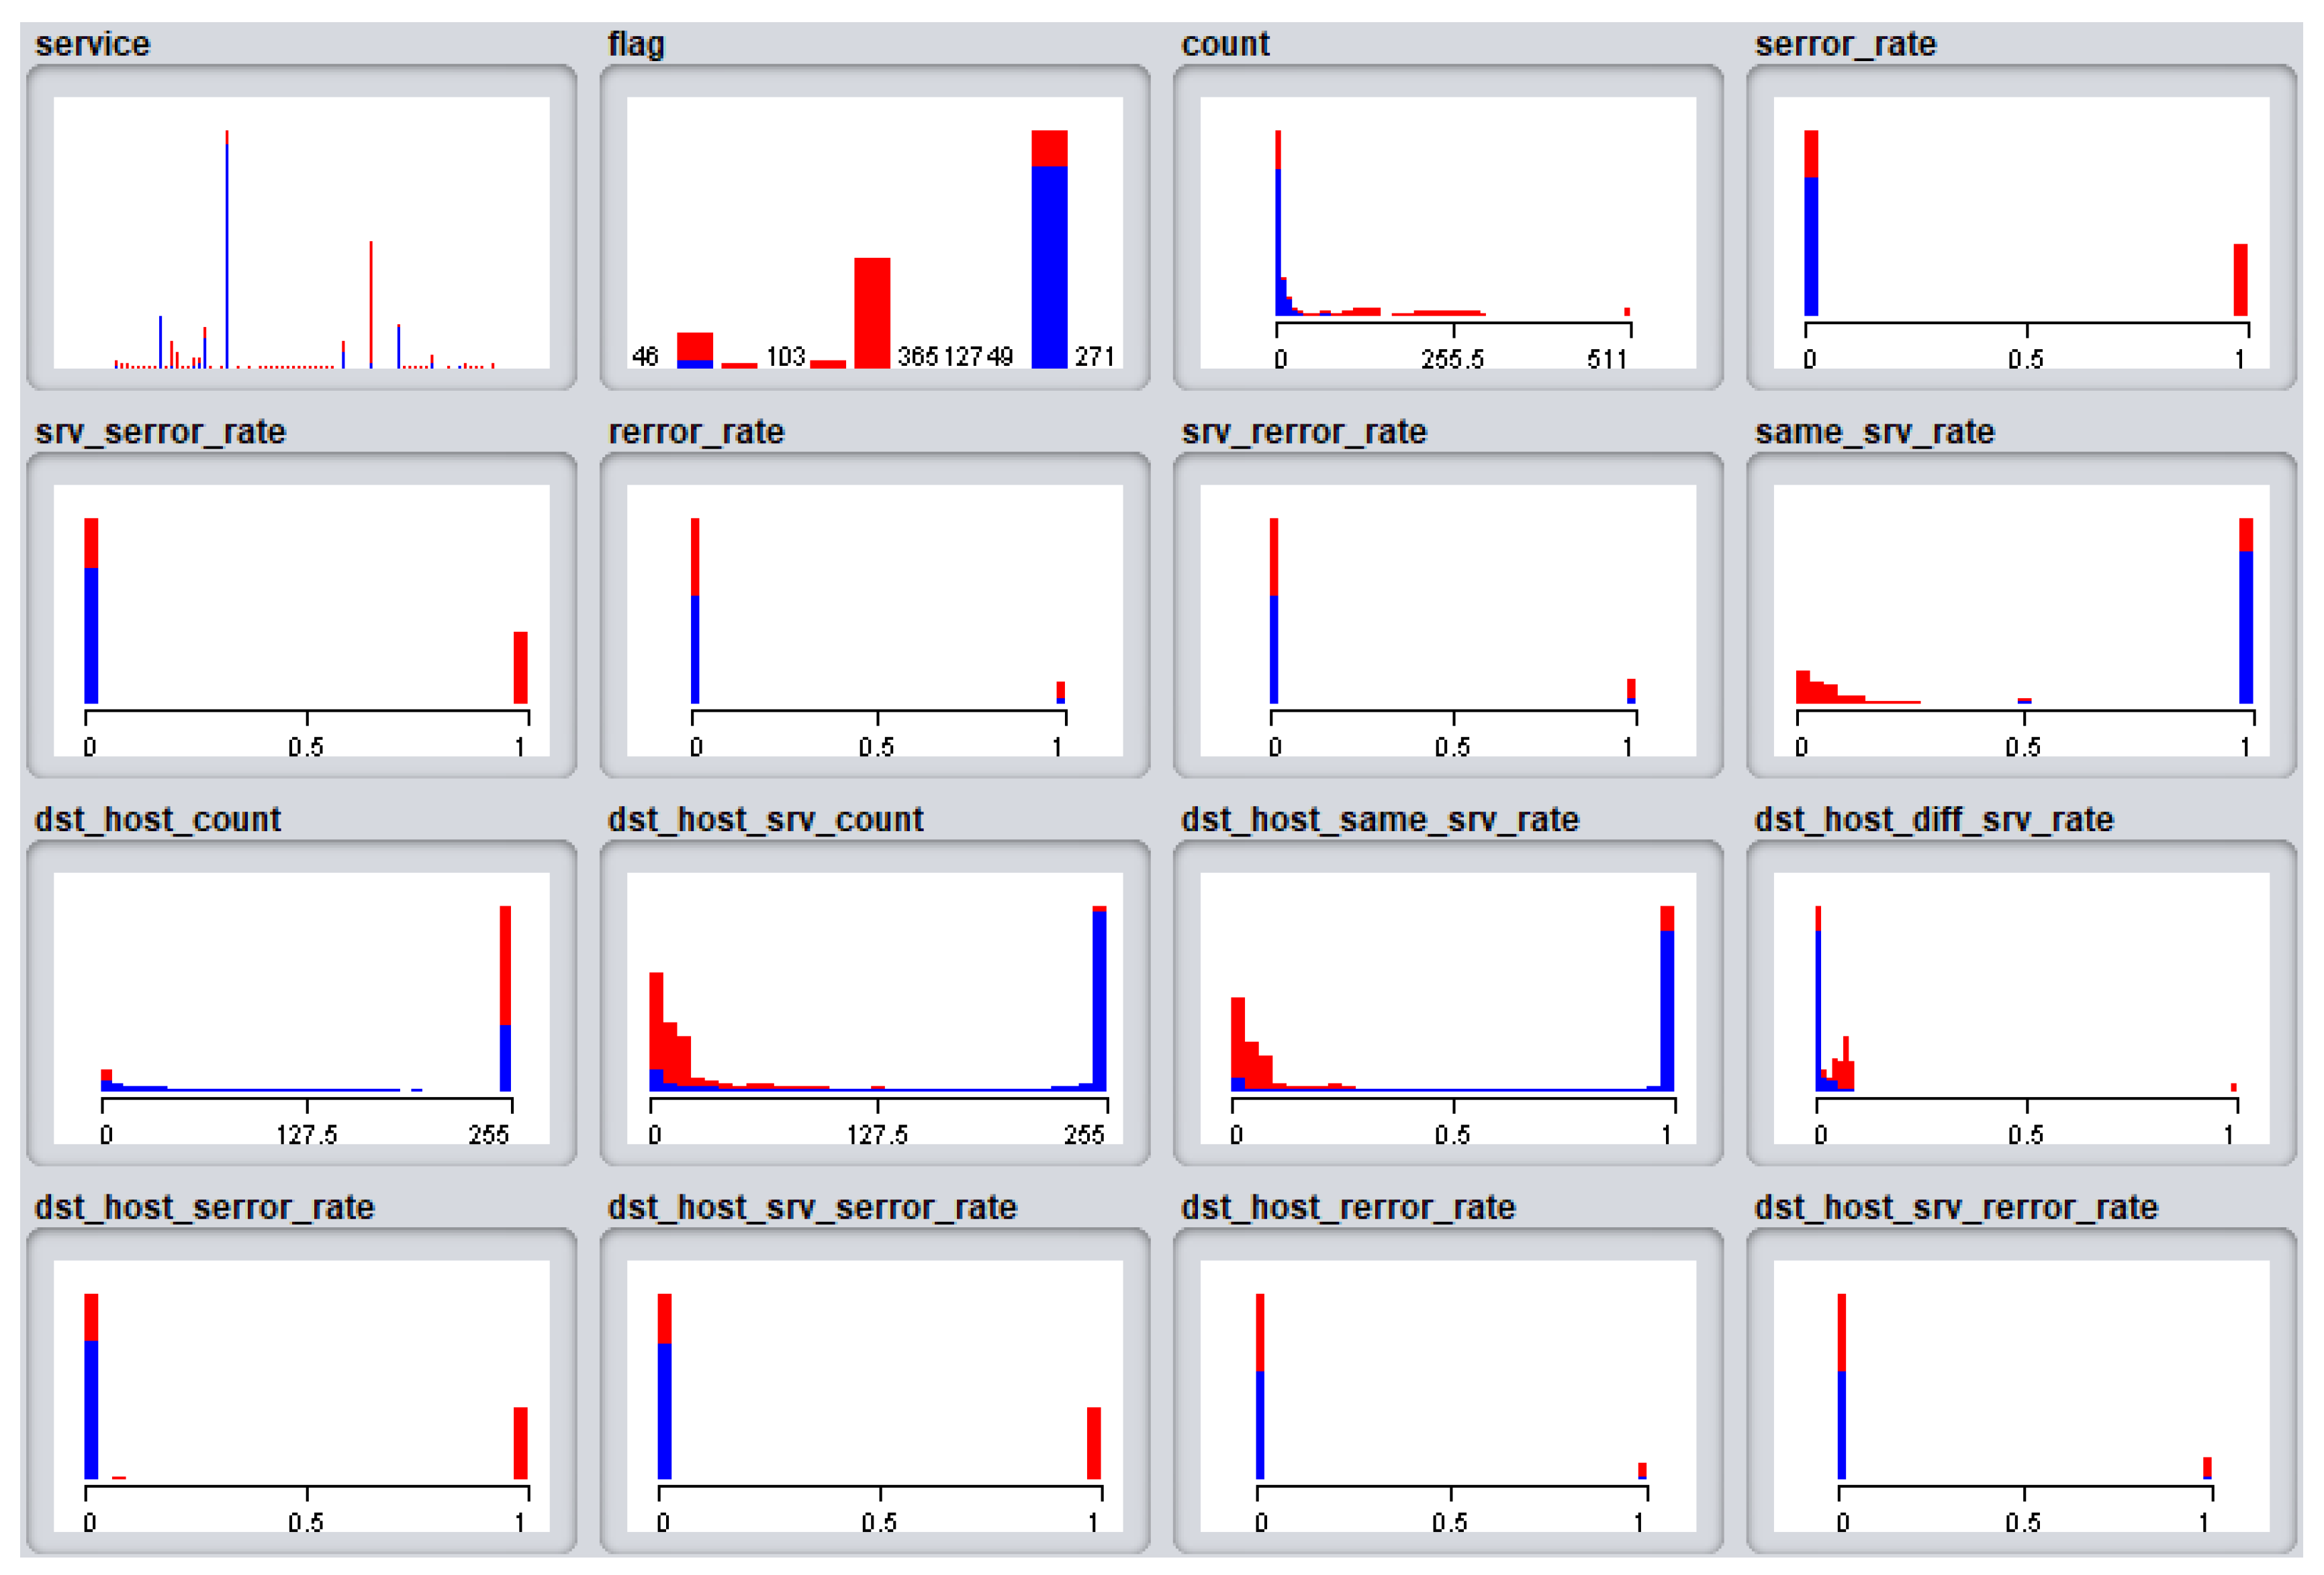
4.1. Feature Analysis
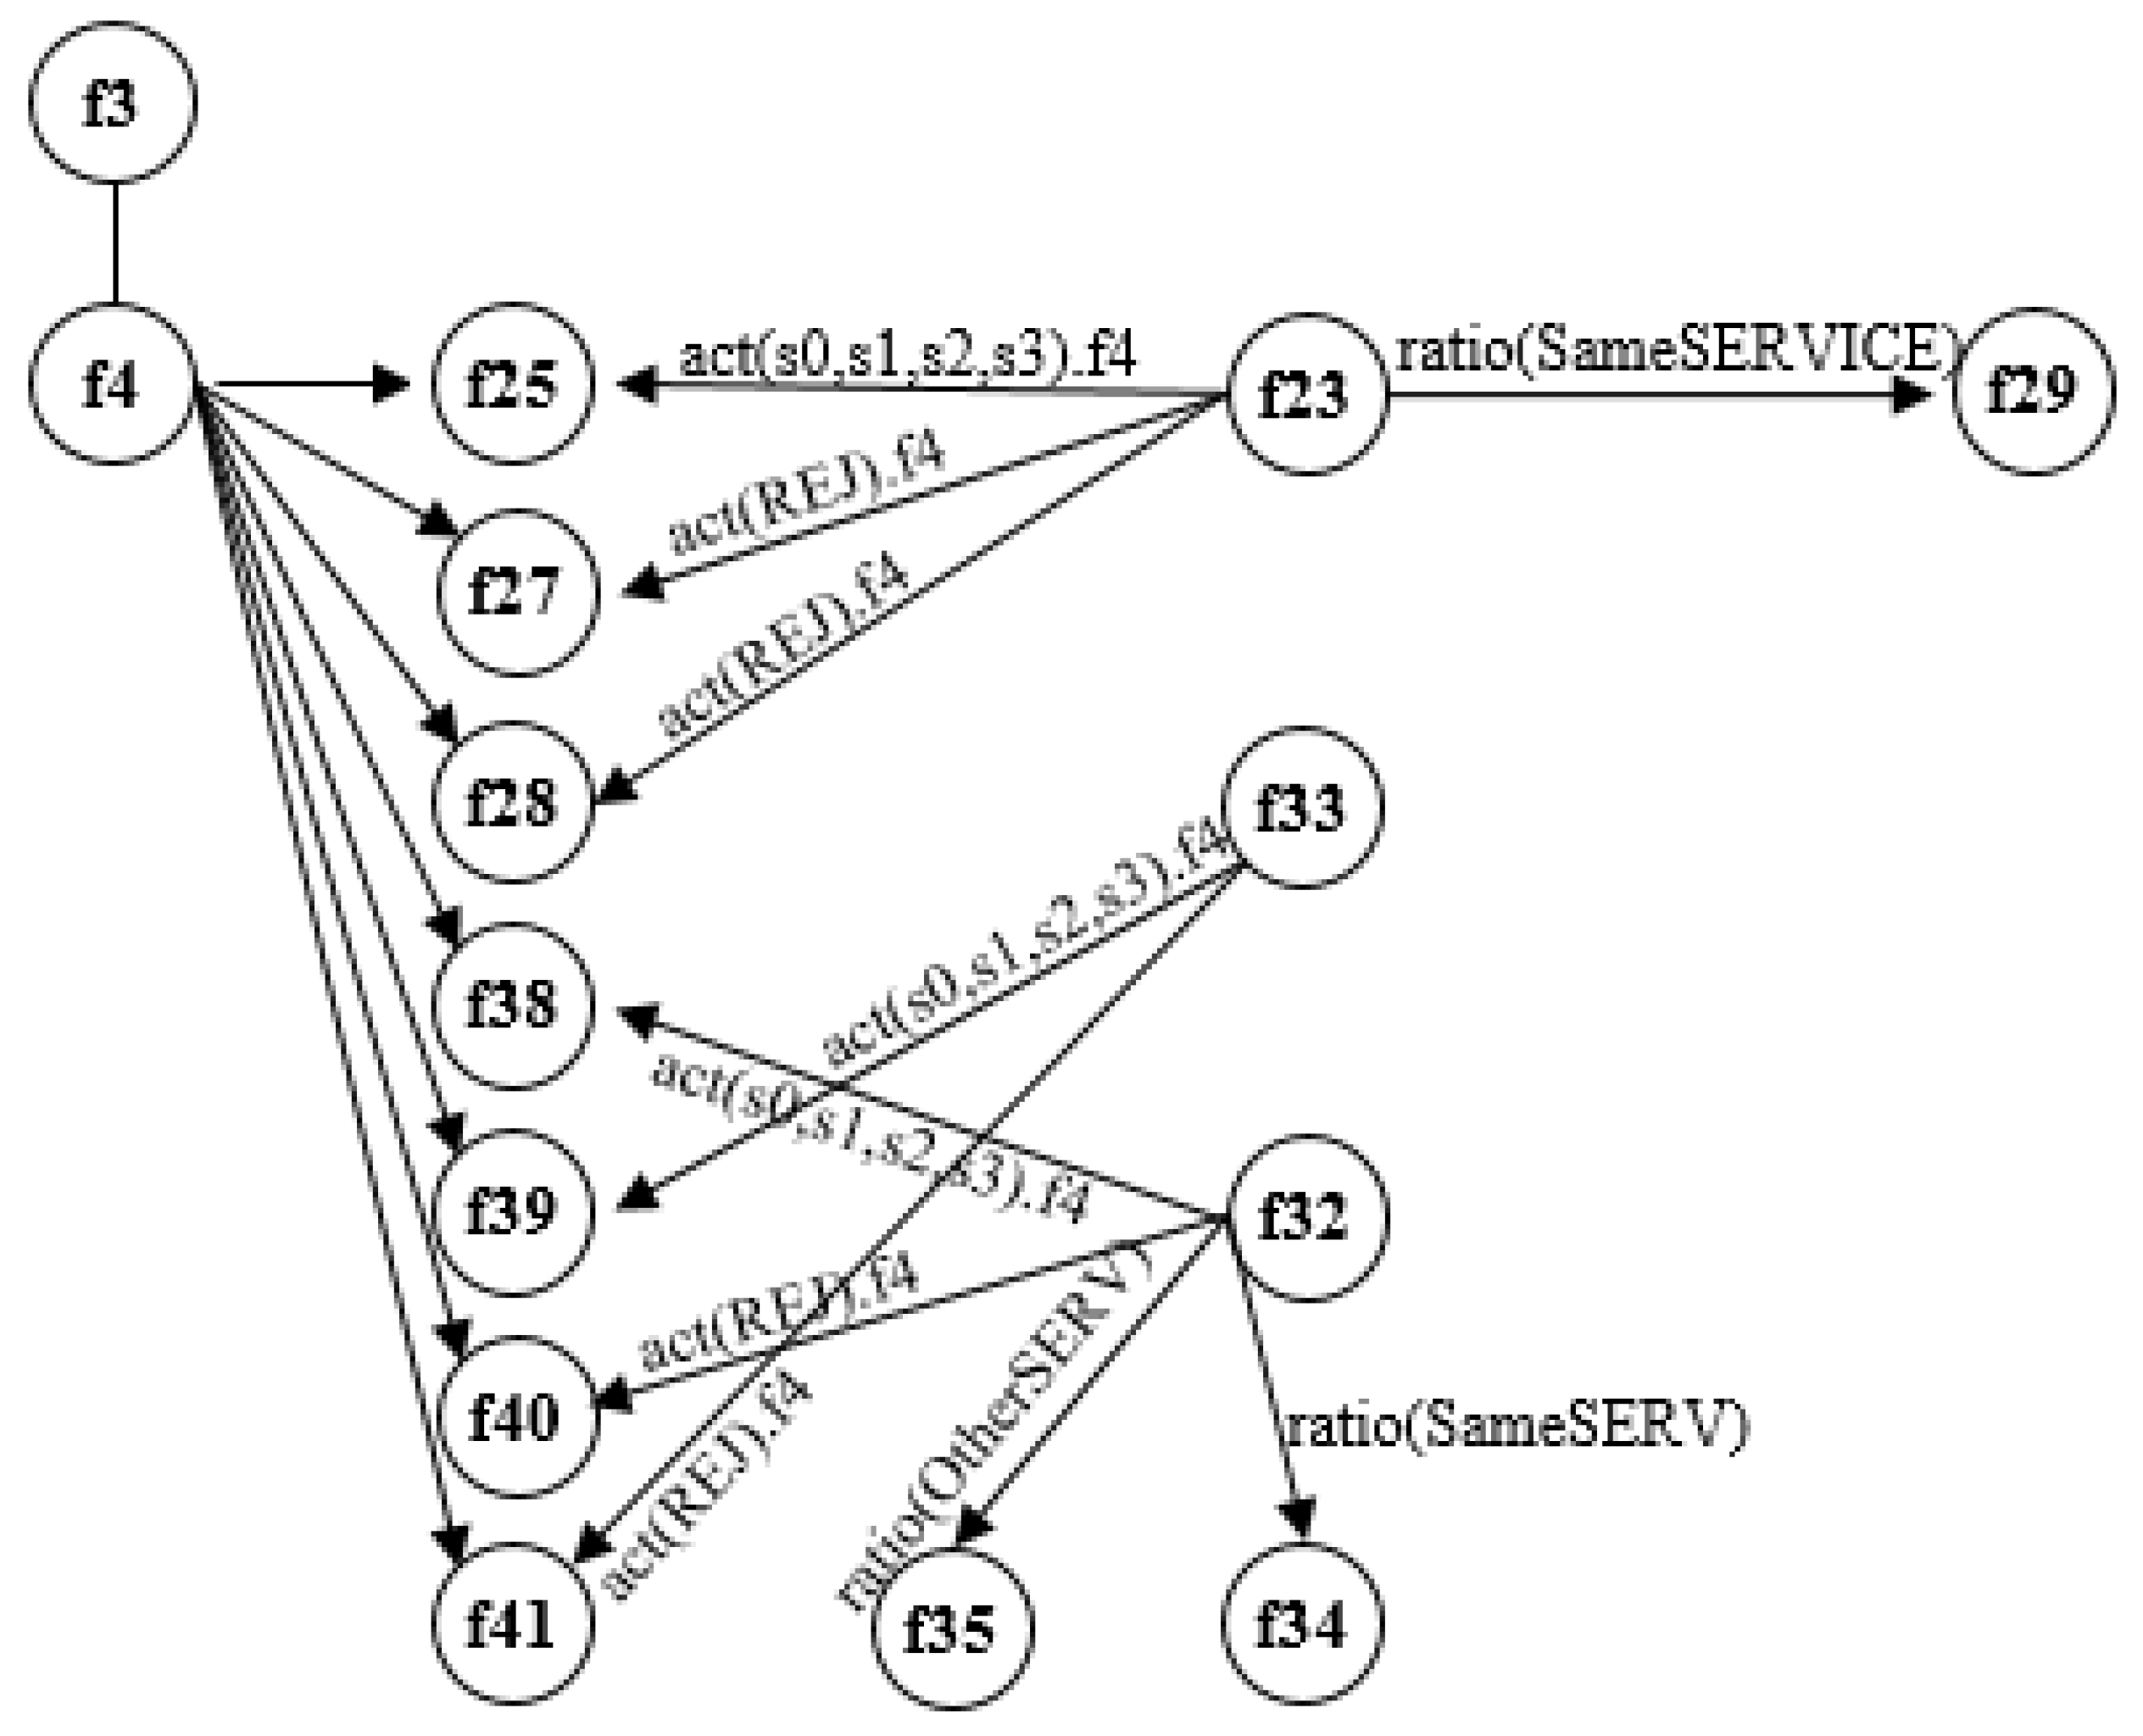
4.2. Correlation of Each Feature
5. Discussion
6. Conclusions
Author Contributions
Funding
Institutional Review Board Statement
Informed Consent Statement
Data Availability Statement
Acknowledgments
Conflicts of Interest
Abbreviations
| ADM | Anomaly Detection Model |
| CNN | Convolution Neural Network |
| ML | Machine Learning |
| DL | Deep Learning |
| I/F | Interface |
| AEWMA | Adaptive Exponentially Weighted Moving Average |
| EWMA | Exponentially Weighted Moving Average |
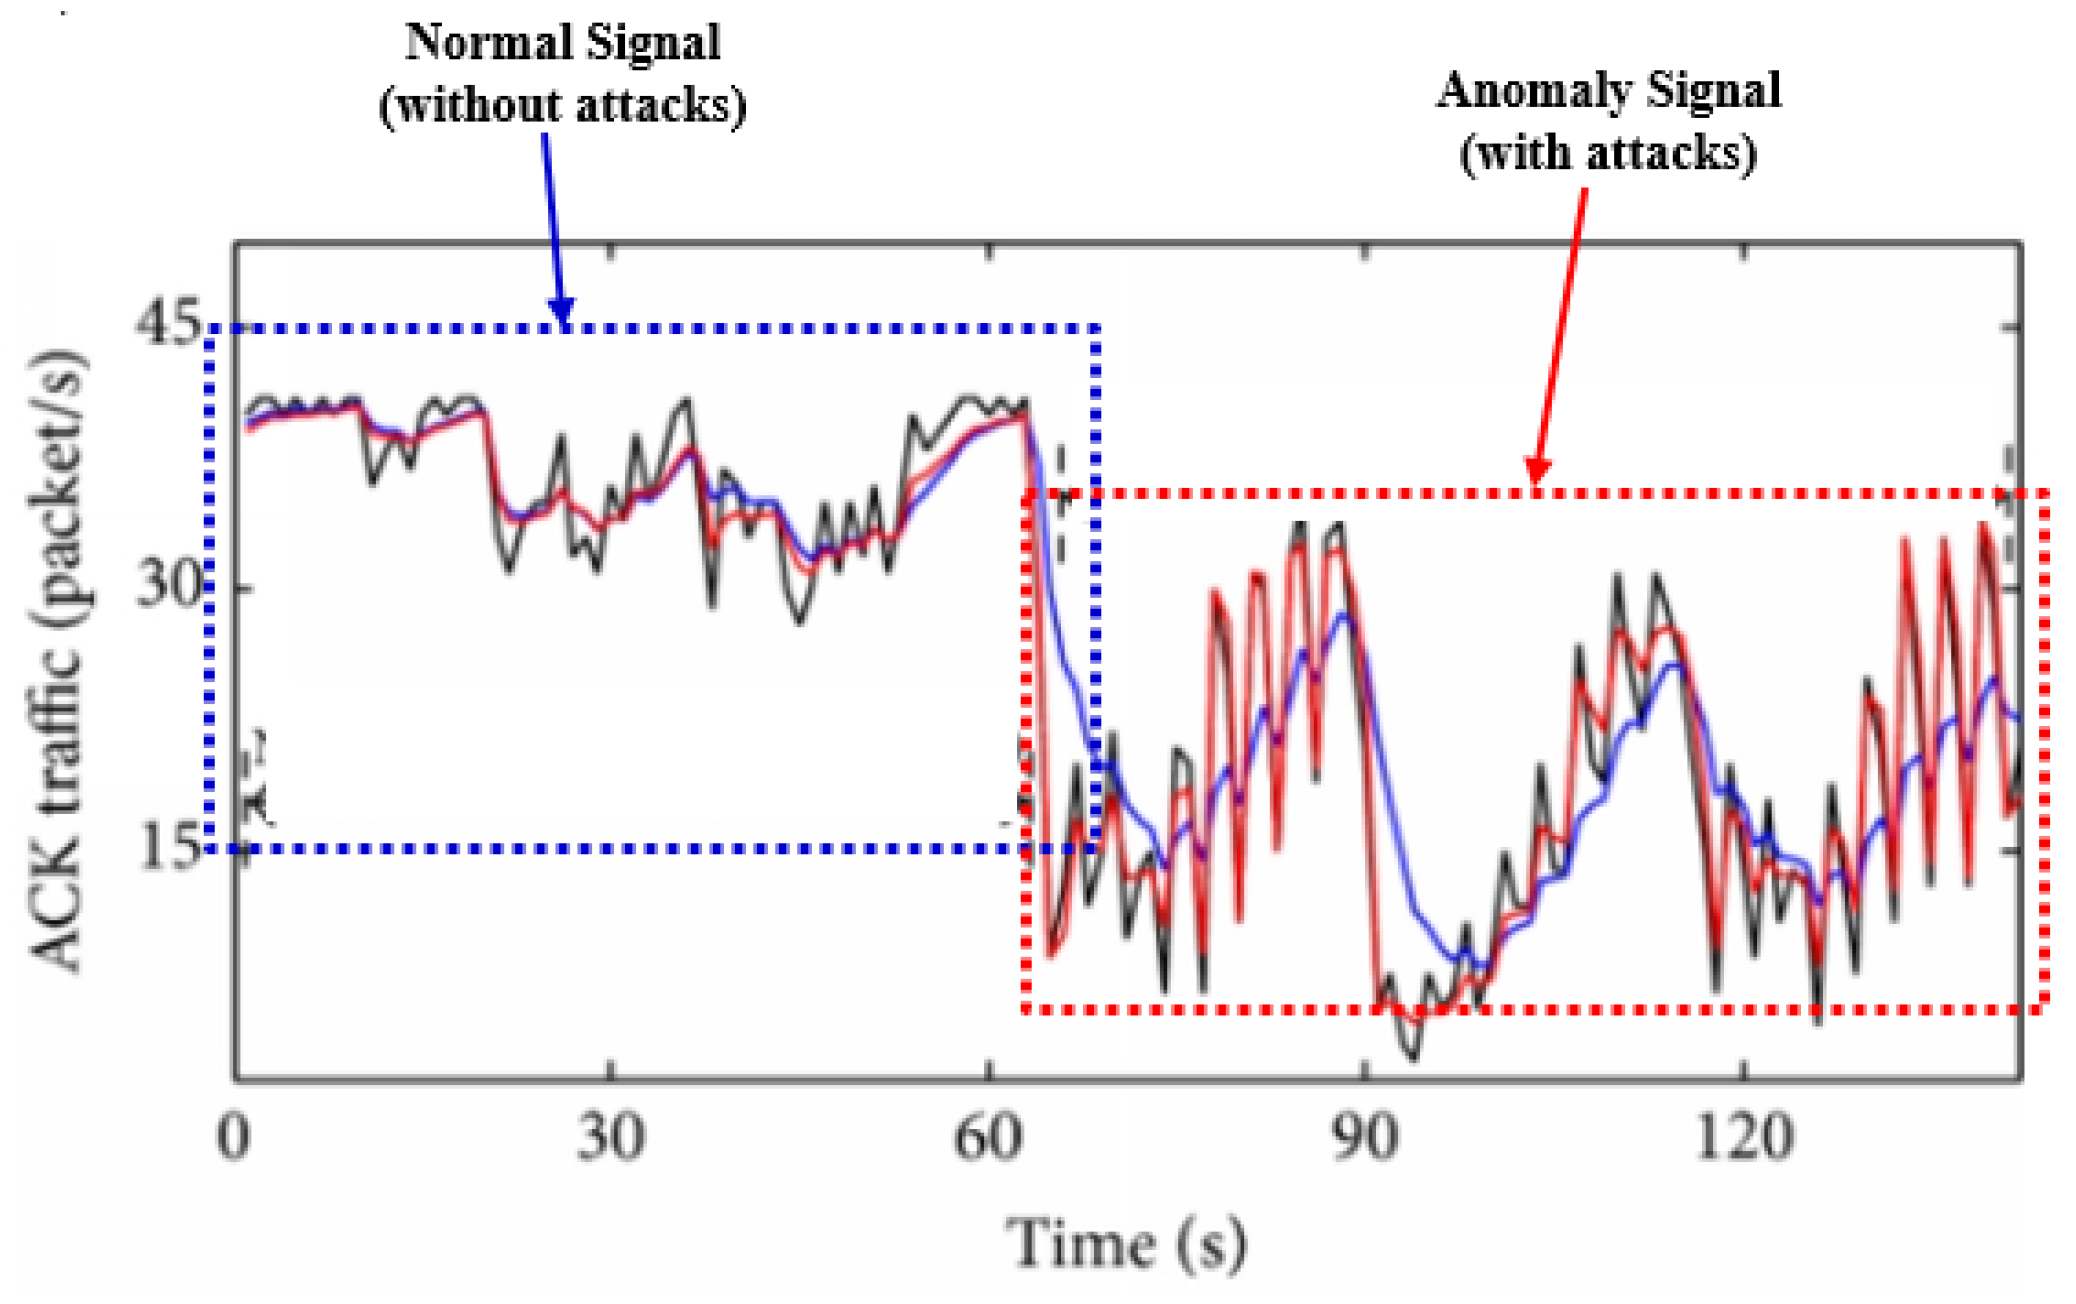
| AS | Anomaly Signal |
| NS | Normal Signal |
References
- Ko, H.; Praca, I. Design of a Secure Energy Trading Model Based on a Blockchain. Sustainability 2021, 13, 1634. [Google Scholar] [CrossRef]
- Sun, C.C.; Cardenas, D.J.S.; Hahn, A.; Liu, C.C. Intrusion Detection for Cybersecurity of Smart Meters. IEEE Trans. Smart Grid 2020, 12, 612–622. [Google Scholar] [CrossRef]
- Samie, F.; Bauer, L.; Henkel, J. From cloud down to things: An overview of machine learning in internet of things. IEEE Internet Things J. 2019, 6, 4921–4934. [Google Scholar] [CrossRef]
- Restuccia, F.; D’Oro, S.; Melodia, T. Securing the internet of things in the age of machine learning and software-defined networking. IEEE Internet Things J. 2018, 5, 4829–4842. [Google Scholar] [CrossRef] [Green Version]
- Handa, A.; Sharma, A.; Shukla, S.K. Machine learning in cybersecurity: A review. Wiley Interdiscip. Rev. Data Min. Knowl. Discov. 2019, 9, e1306. [Google Scholar] [CrossRef]
- Sarao, P. Machine learning and deep learning techniques on wireless networks. Int. J. Eng. Res. Technol. 2019, 12, 311–320. [Google Scholar]
- Zarpelão, B.B.; Miani, R.S.; Kawakani, C.T.; de Alvarenga, S.C. A survey of intrusion detection in Internet of Things. J. Netw. Comput. Appl. 2017, 84, 25–37. [Google Scholar] [CrossRef]
- Alabadi, M.; Celik, Y. Anomaly Detection for Cyber-Security Based on Convolution Neural Network: A survey. In Proceedings of the 2020 International Congress on Human-Computer Interaction, Optimization and Robotic Applications (HORA), Ankara, Turkey, 26–28 June 2020; pp. 1–14. [Google Scholar]
- Liu, Q.; Li, P.; Zhao, W.; Cai, W.; Yu, S.; Leung, V.C. A survey on security threats and defensive techniques of machine learning: A data driven view. IEEE Access 2018, 6, 12103–12117. [Google Scholar] [CrossRef]
- Xin, Y.; Kong, L.; Liu, Z.; Chen, Y.; Li, Y.; Zhu, H.; Gao, M.; Hou, H.; Wang, C. Machine learning and deep learning methods for cybersecurity. IEEE Access 2018, 6, 35365–35381. [Google Scholar] [CrossRef]
- Tang, D.; Chen, K.; Chen, X.; Liu, H.; Li, X. Adaptive EWMA Method based on abnormal network traffic for LDoS attacks. Math. Probl. Eng. 2014, 2014, 496376. [Google Scholar] [CrossRef]
- Chen, S.; Chen, B. Urban energy consumption: Different insights from energy flow analysis, input—Output analysis and ecological network analysis. Appl. Energy 2015, 138, 99–107. [Google Scholar] [CrossRef]
- Kotenko, I.; Saenko, I.; Lauta, O.; Kribel, A. An Approach to Detecting Cyber Attacks against Smart Power Grids Based on the Analysis of Network Traffic Self-Similarity. Energies 2020, 13, 5031. [Google Scholar] [CrossRef]
- Abarbanel, H.D.; Frison, T.W.; Tsimring, L.S. Obtaining order in a world of chaos [signal processing]. IEEE Signal Process. Mag. 1998, 15, 49–65. [Google Scholar] [CrossRef]
- Pedraza, A.; Deniz, O.; Bueno, G. Approaching Adversarial Example Classification with Chaos Theory. Entropy 2020, 22, 1201. [Google Scholar] [CrossRef]
- Iglesias, F.; Zseby, T. Analysis of network traffic features for anomaly detection. Mach. Learn. 2015, 101, 59–84. [Google Scholar] [CrossRef] [Green Version]


| Features | Calculation | Classes |
|---|---|---|
| service(f3) | Do not need | ‘aol’, ‘auth’, ‘bgp’, ‘courier’, ‘csnet_ns’, ‘ctf’, ‘daytime’, ‘discard’, ‘domain’, ‘domain_u’, ‘echo’, ‘eco_i’, ‘ecr_i’, ‘efs’, ‘exec’, ‘finger’, ‘ftp’, ‘ftp_data’, ‘gopher’, ‘harvest’, ‘hostnames’, ‘http’, ‘http_2784’, ‘http_443’, ‘http_8001’, ‘imap4’, ‘IRC’, ‘iso_tsap’, ‘klogin’, ‘kshell’, ‘ldap’, ‘link’, ‘login’, ‘mtp’, ‘name’, ‘netbios_dgm’, ‘netbios_ns’, ‘netbios_ssn’, ‘netstat’, ‘nnsp’, ‘nntp’, ‘ntp_u’, ‘other’, ‘pm_dump’, ‘pop_2’, ‘pop_3’, ‘printer’, ‘private’, ‘red_i’, ‘remote_job’, ‘rje’, ‘shell’, ‘smtp’, ‘sql_net’, ‘ssh’, ‘sunrpc’, ‘supdup’, ‘systat’, ‘telnet’, ‘tftp_u’, ‘tim_i’, ‘time’, ‘urh_i’, ‘urp_i’, ‘uucp’, ‘uucp_path’, ‘vmnet’, ‘whois’, ‘X11’, ‘Z39_50’ |
| flag(f4) | Do not need | ‘OTH’, ‘REJ’, ‘RSTO’, ‘RSTOS0’, ‘RSTR’, ‘S0’, ‘S1’, ‘S2’, ‘S3’, ‘SF’, ‘SH’ |
| class(f42) | Do not need | ‘normal’, ‘anomaly’ |
| count(f23), serror_rate(f25), | ||
| rerror_rate(f27), | ||
| srv_error_rate(f28), | ||
| same_srv_rate(f29), | ||
| dst_host_count(f32), | ||
| dst_host_srv_count(f33), | Need | |
| dst_host_same_srv_rate(f34), | ||
| dst_host_diff_srv_rate(f35), | ||
| dst_host_serror_rate(f38), | ||
| dst_host_srv_serror_rate(f39), | ||
| dst_host_rerror_rate(f40), | ||
| dst_host_srv_error_rate(f41) |
| Experiment # | Accuracy |
|---|---|
| 42 features, | |
| (+service(f3), +class(f42)) | 71.093 |
| 42 features, | |
| (+flag(f4), +class(f42)) | 99.564 |
| 17 features, | |
| (+flag(f4), +class(f42)) | 99.120 |
| 17 features, | |
| (+service(f3), +class(f42)) | 72.564 |
| Code | Description |
|---|---|
| S0 | Connection attempt seen, no reply. |
| S1 | Connection established, not terminated. |
| SF | Normal establishment and termination. Note that this is the same symbol as for state S1. You can tell the two apart because for S1 there will not be any byte counts in the summary, while for SF there will be. |
| REJ | Connection attempt rejected. |
| S2 | Connection established and close attempt by originator seen (but no reply from responder). |
| S3 | Connection established and close attempt by responder seen (but no reply from originator). |
| RSTO | Connection established, originator aborted (sent an RST). |
| RSTR | Established, responder aborted. |
| RSTOS0 | Originator sent an SYN followed by an RST, we never saw a SYN-ACK from the responder. |
| RSTRH | Responder sent an SYN ACK followed by an RST, we never saw a SYN from the (purported) originator. |
| SH | Originator sent an SYN followed by an FIN, we never saw a SYN ACK from the responder (hence the connection was “half” open). |
| SHR | Responder sent an SYN ACK followed by an FIN, we never saw an SYN from the originator. |
| OTH | No SYN seen, just midstream traffic (a “partial connection” that was not later closed). |
| TP Rate | FP Rate | Precision | Recall | F-Measure | MCC | ROC Area | PRC Area | Class |
|---|---|---|---|---|---|---|---|---|
| 0.998 | 0.006 | 0.996 | 0.998 | 0.997 | 0.992 | 0.998 | 0.998 | SF |
| 0.997 | 0.003 | 0.993 | 0.997 | 0.995 | 0.993 | 0.999 | 0.998 | S0 |
| 0.987 | 0.002 | 0.981 | 0.987 | 0.984 | 0.983 | 0.996 | 0.987 | REJ |
| 0.945 | 0.001 | 0.937 | 0.945 | 0.941 | 0.940 | 0.992 | 0.917 | RSTR |
| 0.943 | 0.000 | 0.980 | 0.943 | 0.962 | 0.962 | 0.981 | 0.927 | SH |
| 0.526 | 0.001 | 0.674 | 0.526 | 0.591 | 0.594 | 0.918 | 0.470 | S1 |
| 0.272 | 0.000 | 0.455 | 0.272 | 0.340 | 0.351 | 0.905 | 0.218 | S2 |
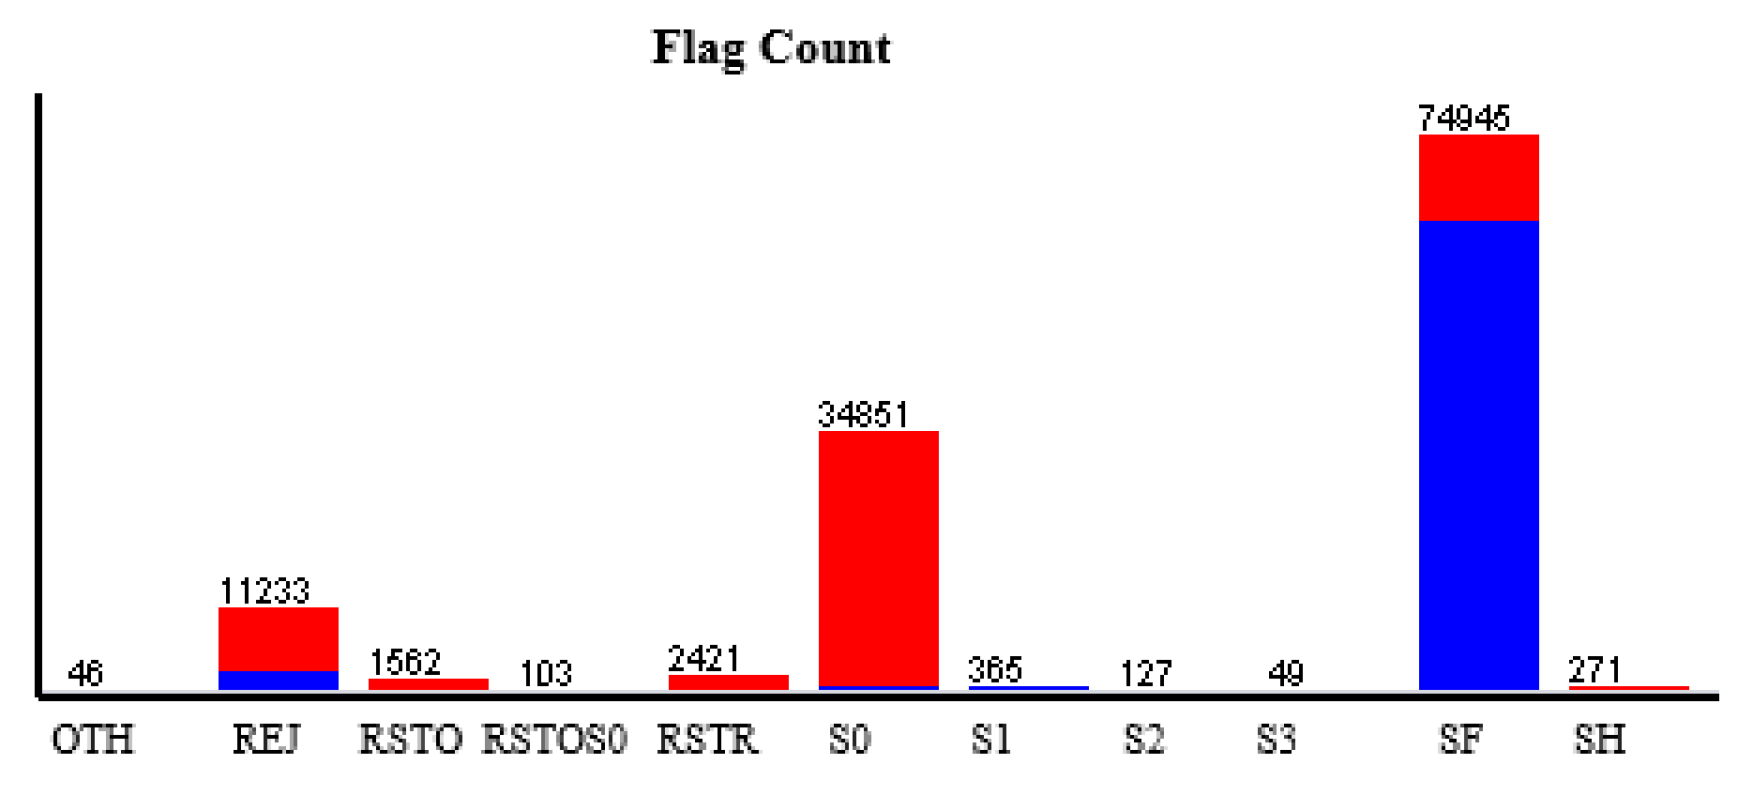
| Label | Count |
|---|---|
| OTH | 46 |
| REJ | 11,233 |
| RSTO | 1562 |
| RSTOS0 | 103 |
| RSTR | 2421 |
| S0 | 34,851 |
| S1 | 365 |
| S2 | 127 |
| S3 | 49 |
| SF | 74,945 |
| SH | 271 |
Publisher’s Note: MDPI stays neutral with regard to jurisdictional claims in published maps and institutional affiliations. |
© 2021 by the authors. Licensee MDPI, Basel, Switzerland. This article is an open access article distributed under the terms and conditions of the Creative Commons Attribution (CC BY) license (https://creativecommons.org/licenses/by/4.0/).
Share and Cite
Ko, H.; Rim, K.; Praça, I. Influence of Features on Accuracy of Anomaly Detection for an Energy Trading System. Sensors 2021, 21, 4237. https://doi.org/10.3390/s21124237
Ko H, Rim K, Praça I. Influence of Features on Accuracy of Anomaly Detection for an Energy Trading System. Sensors. 2021; 21(12):4237. https://doi.org/10.3390/s21124237
Chicago/Turabian StyleKo, Hoon, Kwangcheol Rim, and Isabel Praça. 2021. "Influence of Features on Accuracy of Anomaly Detection for an Energy Trading System" Sensors 21, no. 12: 4237. https://doi.org/10.3390/s21124237
APA StyleKo, H., Rim, K., & Praça, I. (2021). Influence of Features on Accuracy of Anomaly Detection for an Energy Trading System. Sensors, 21(12), 4237. https://doi.org/10.3390/s21124237