
Measurement of Ex Vivo Liver, Brain and Pancreas Thermal Properties as Function of Temperature


Abstract
:1. Introduction
2. Materials and Methods
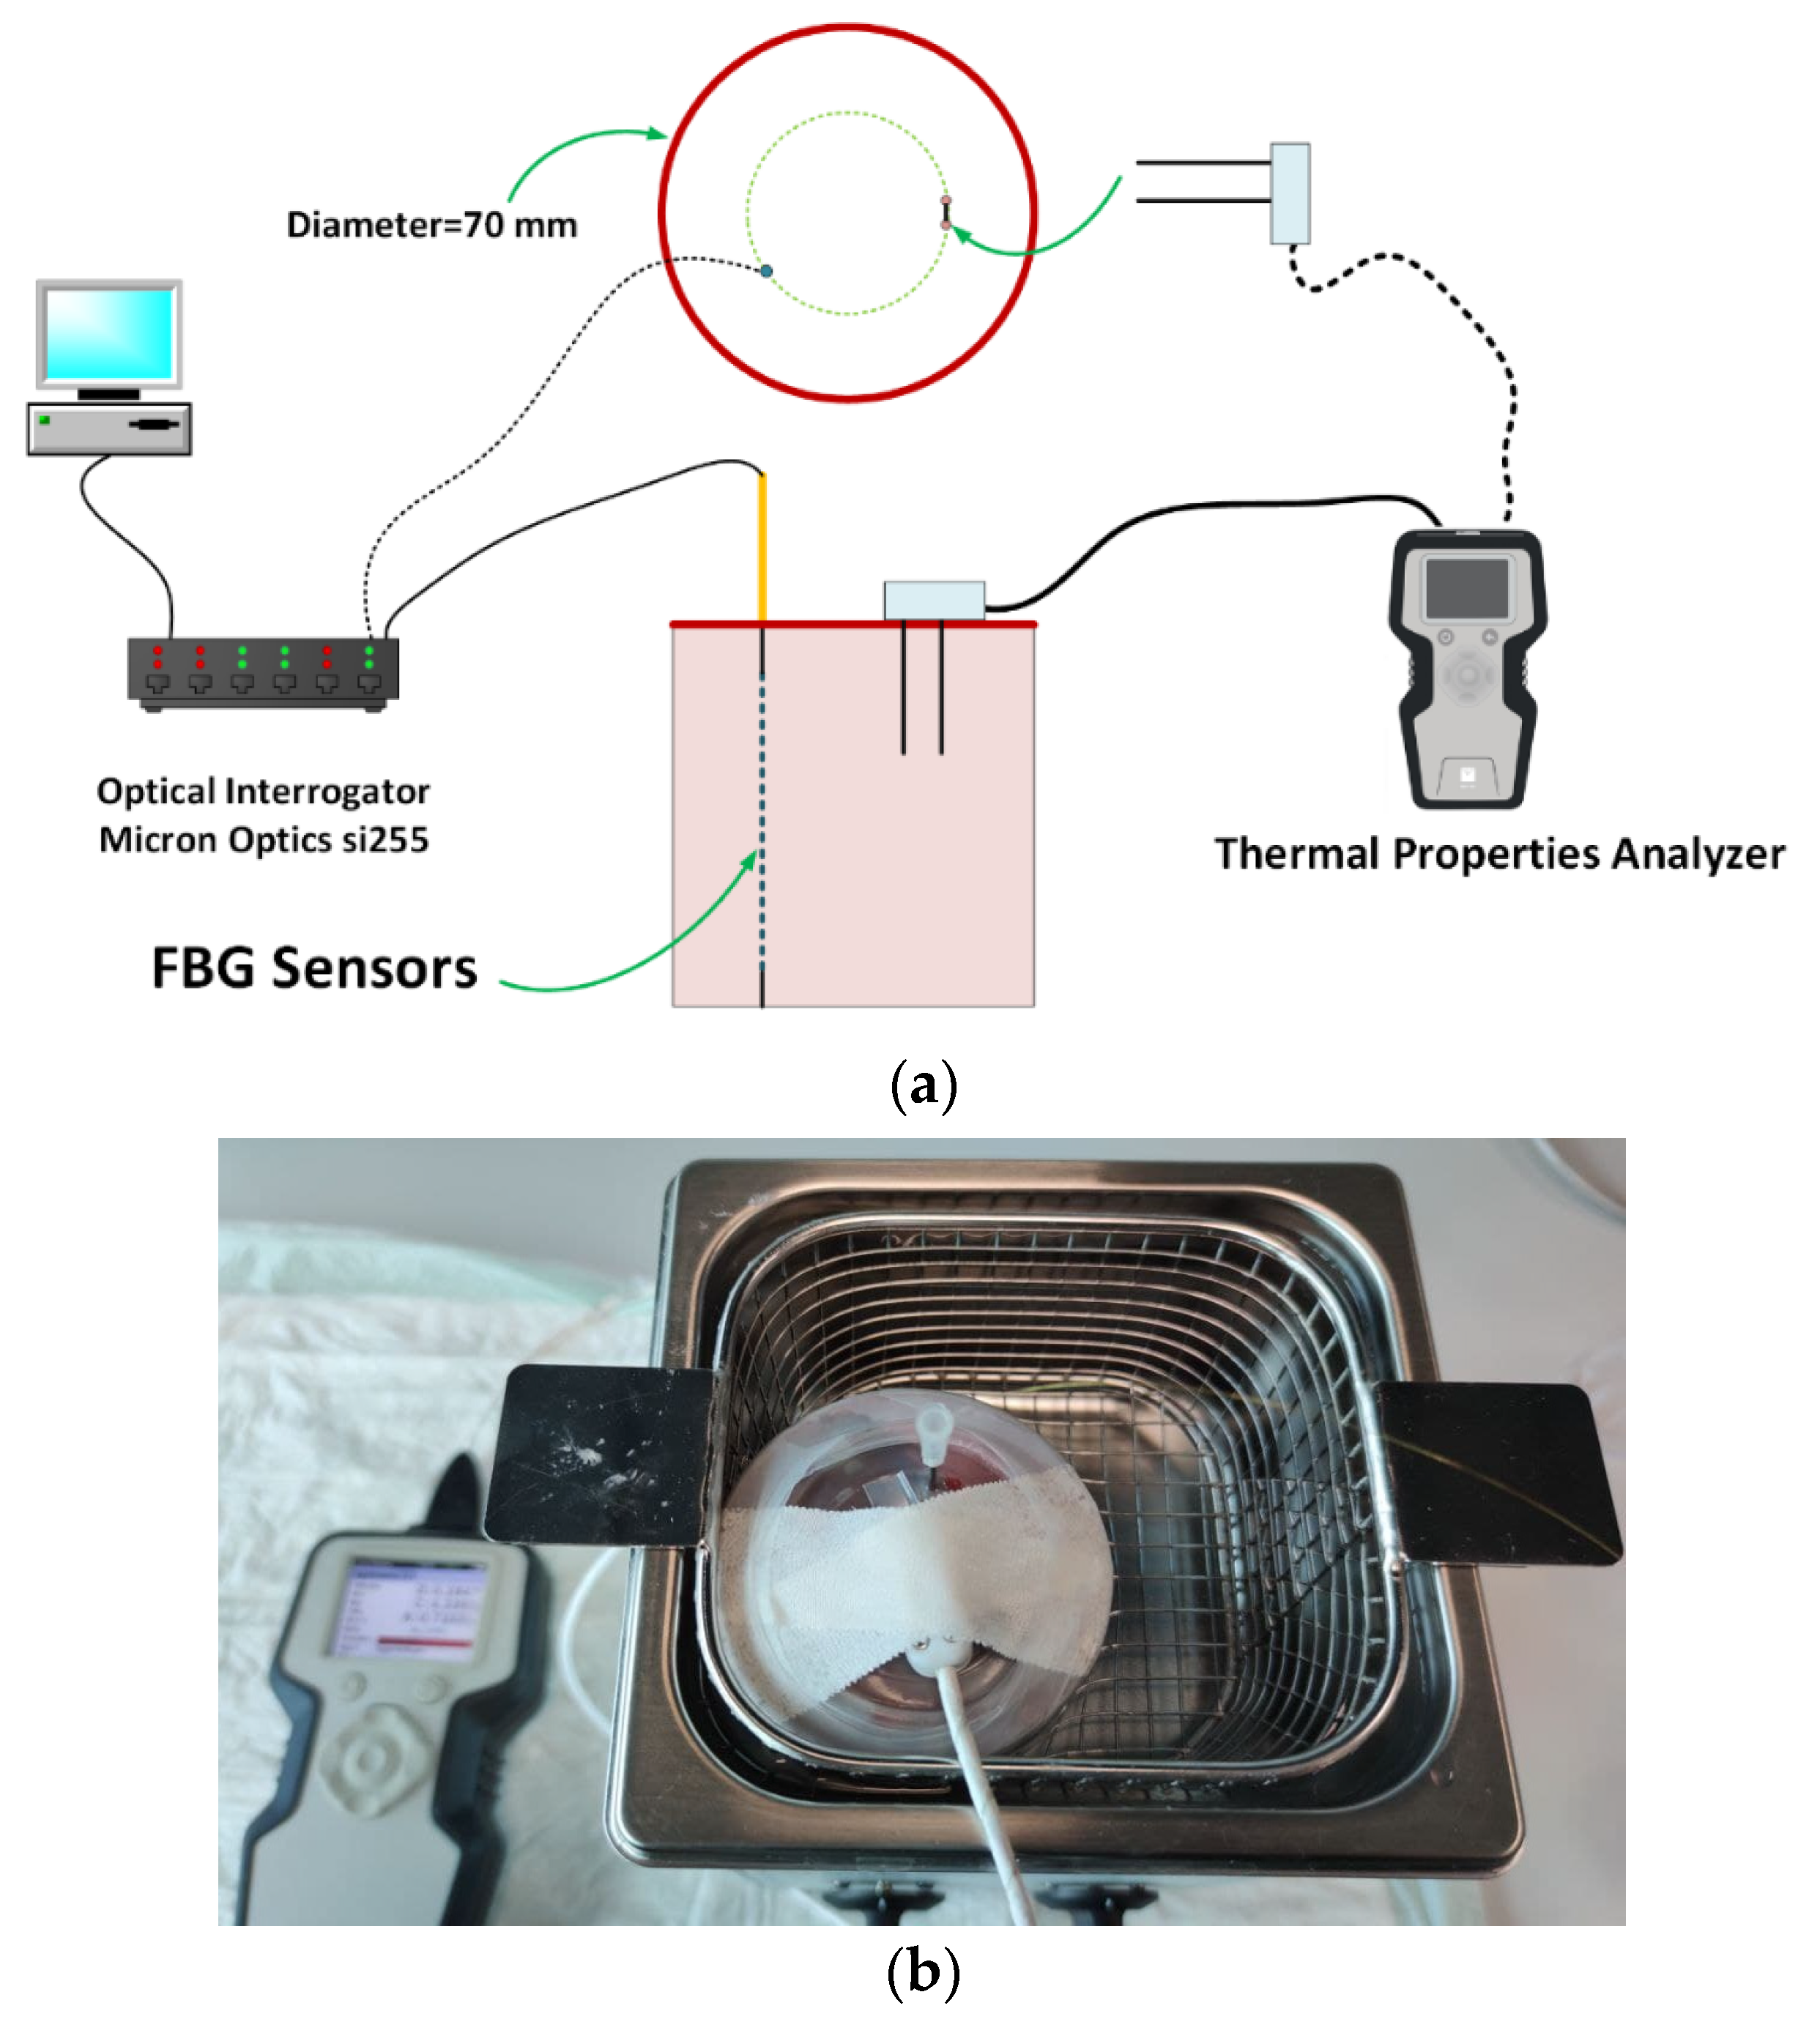
2.1. Tissue Preparation and Experimental Setup
- Temperature range: 20 to 100 °C;
- Temperature fluctuation: 0.5 °C;
- Fast ramp-up: 20 to 37 °C in 10 min;
- Rated wattage: 200 W.
2.2. Thermal Property Measurement Method
2.2.1. Measurement Uncertainty
2.2.2. Thermal Property Modeling
3. Results
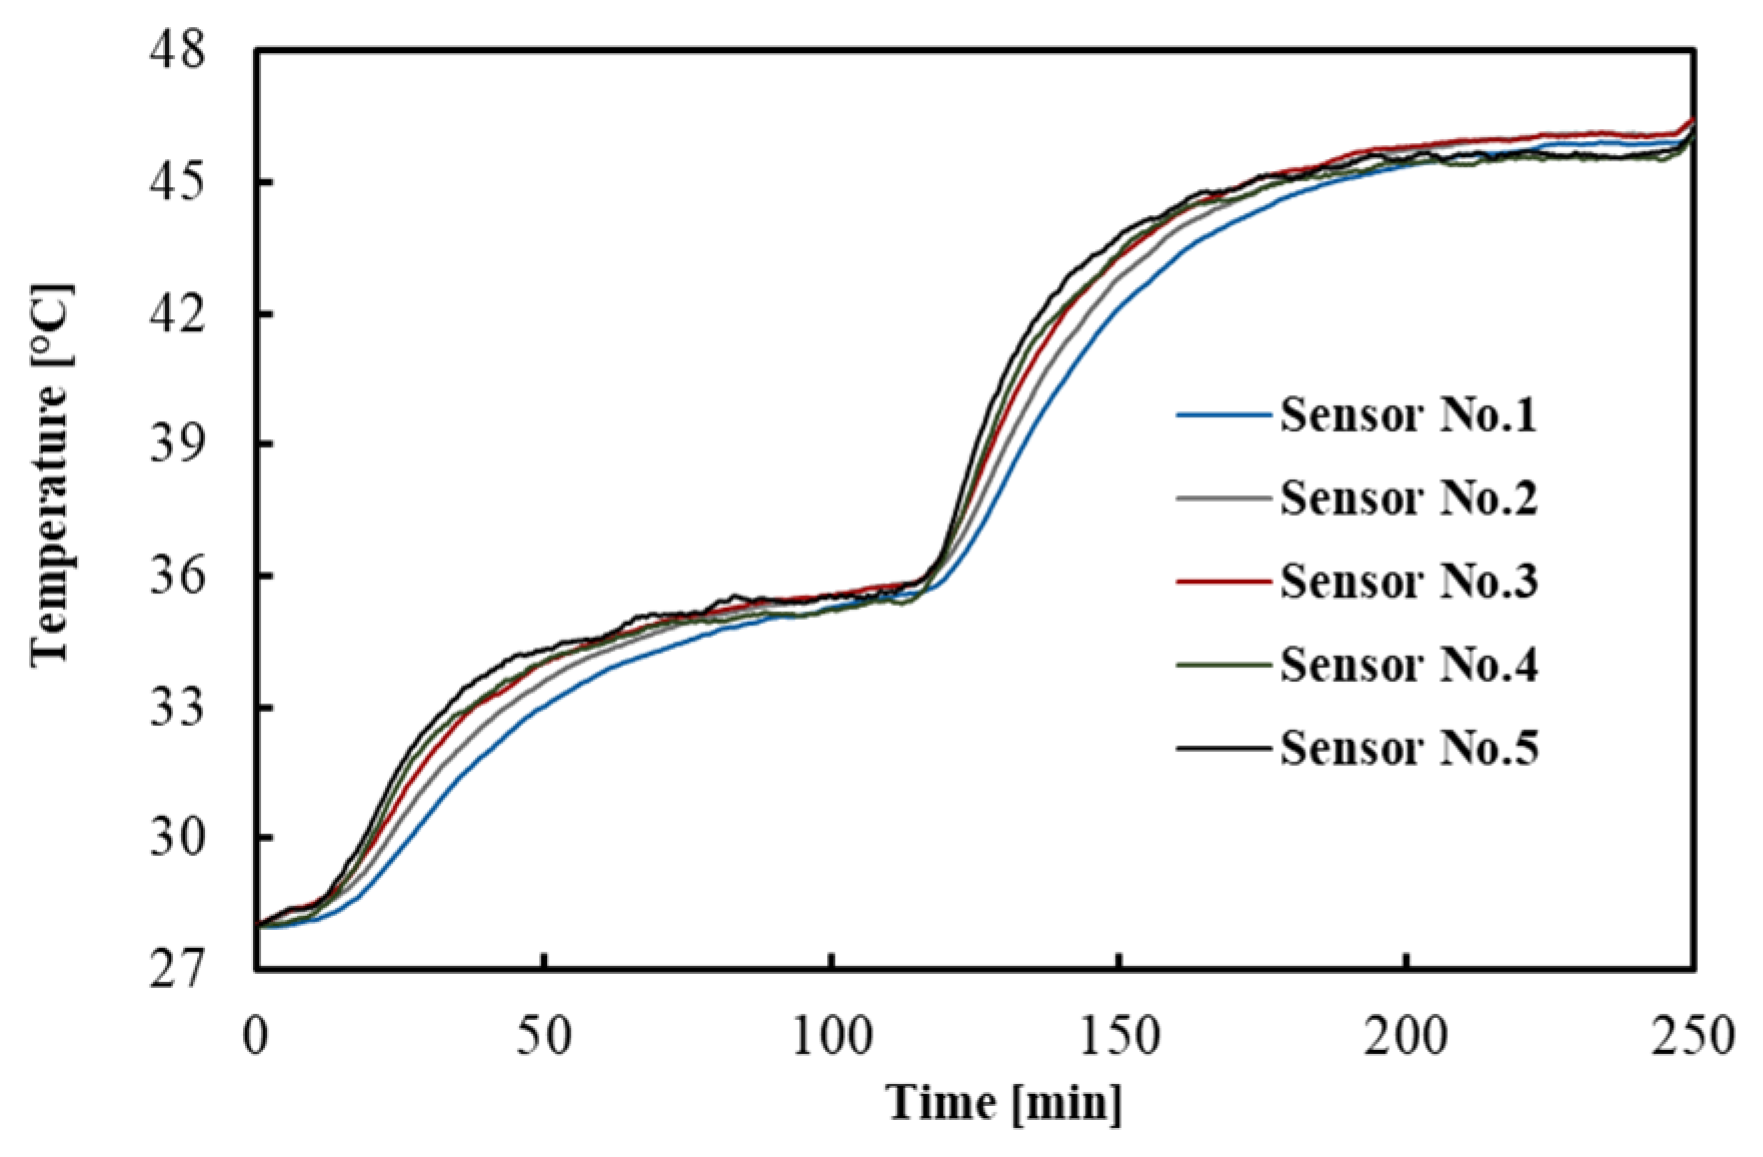
3.1. Temperature Distribution in Tissue
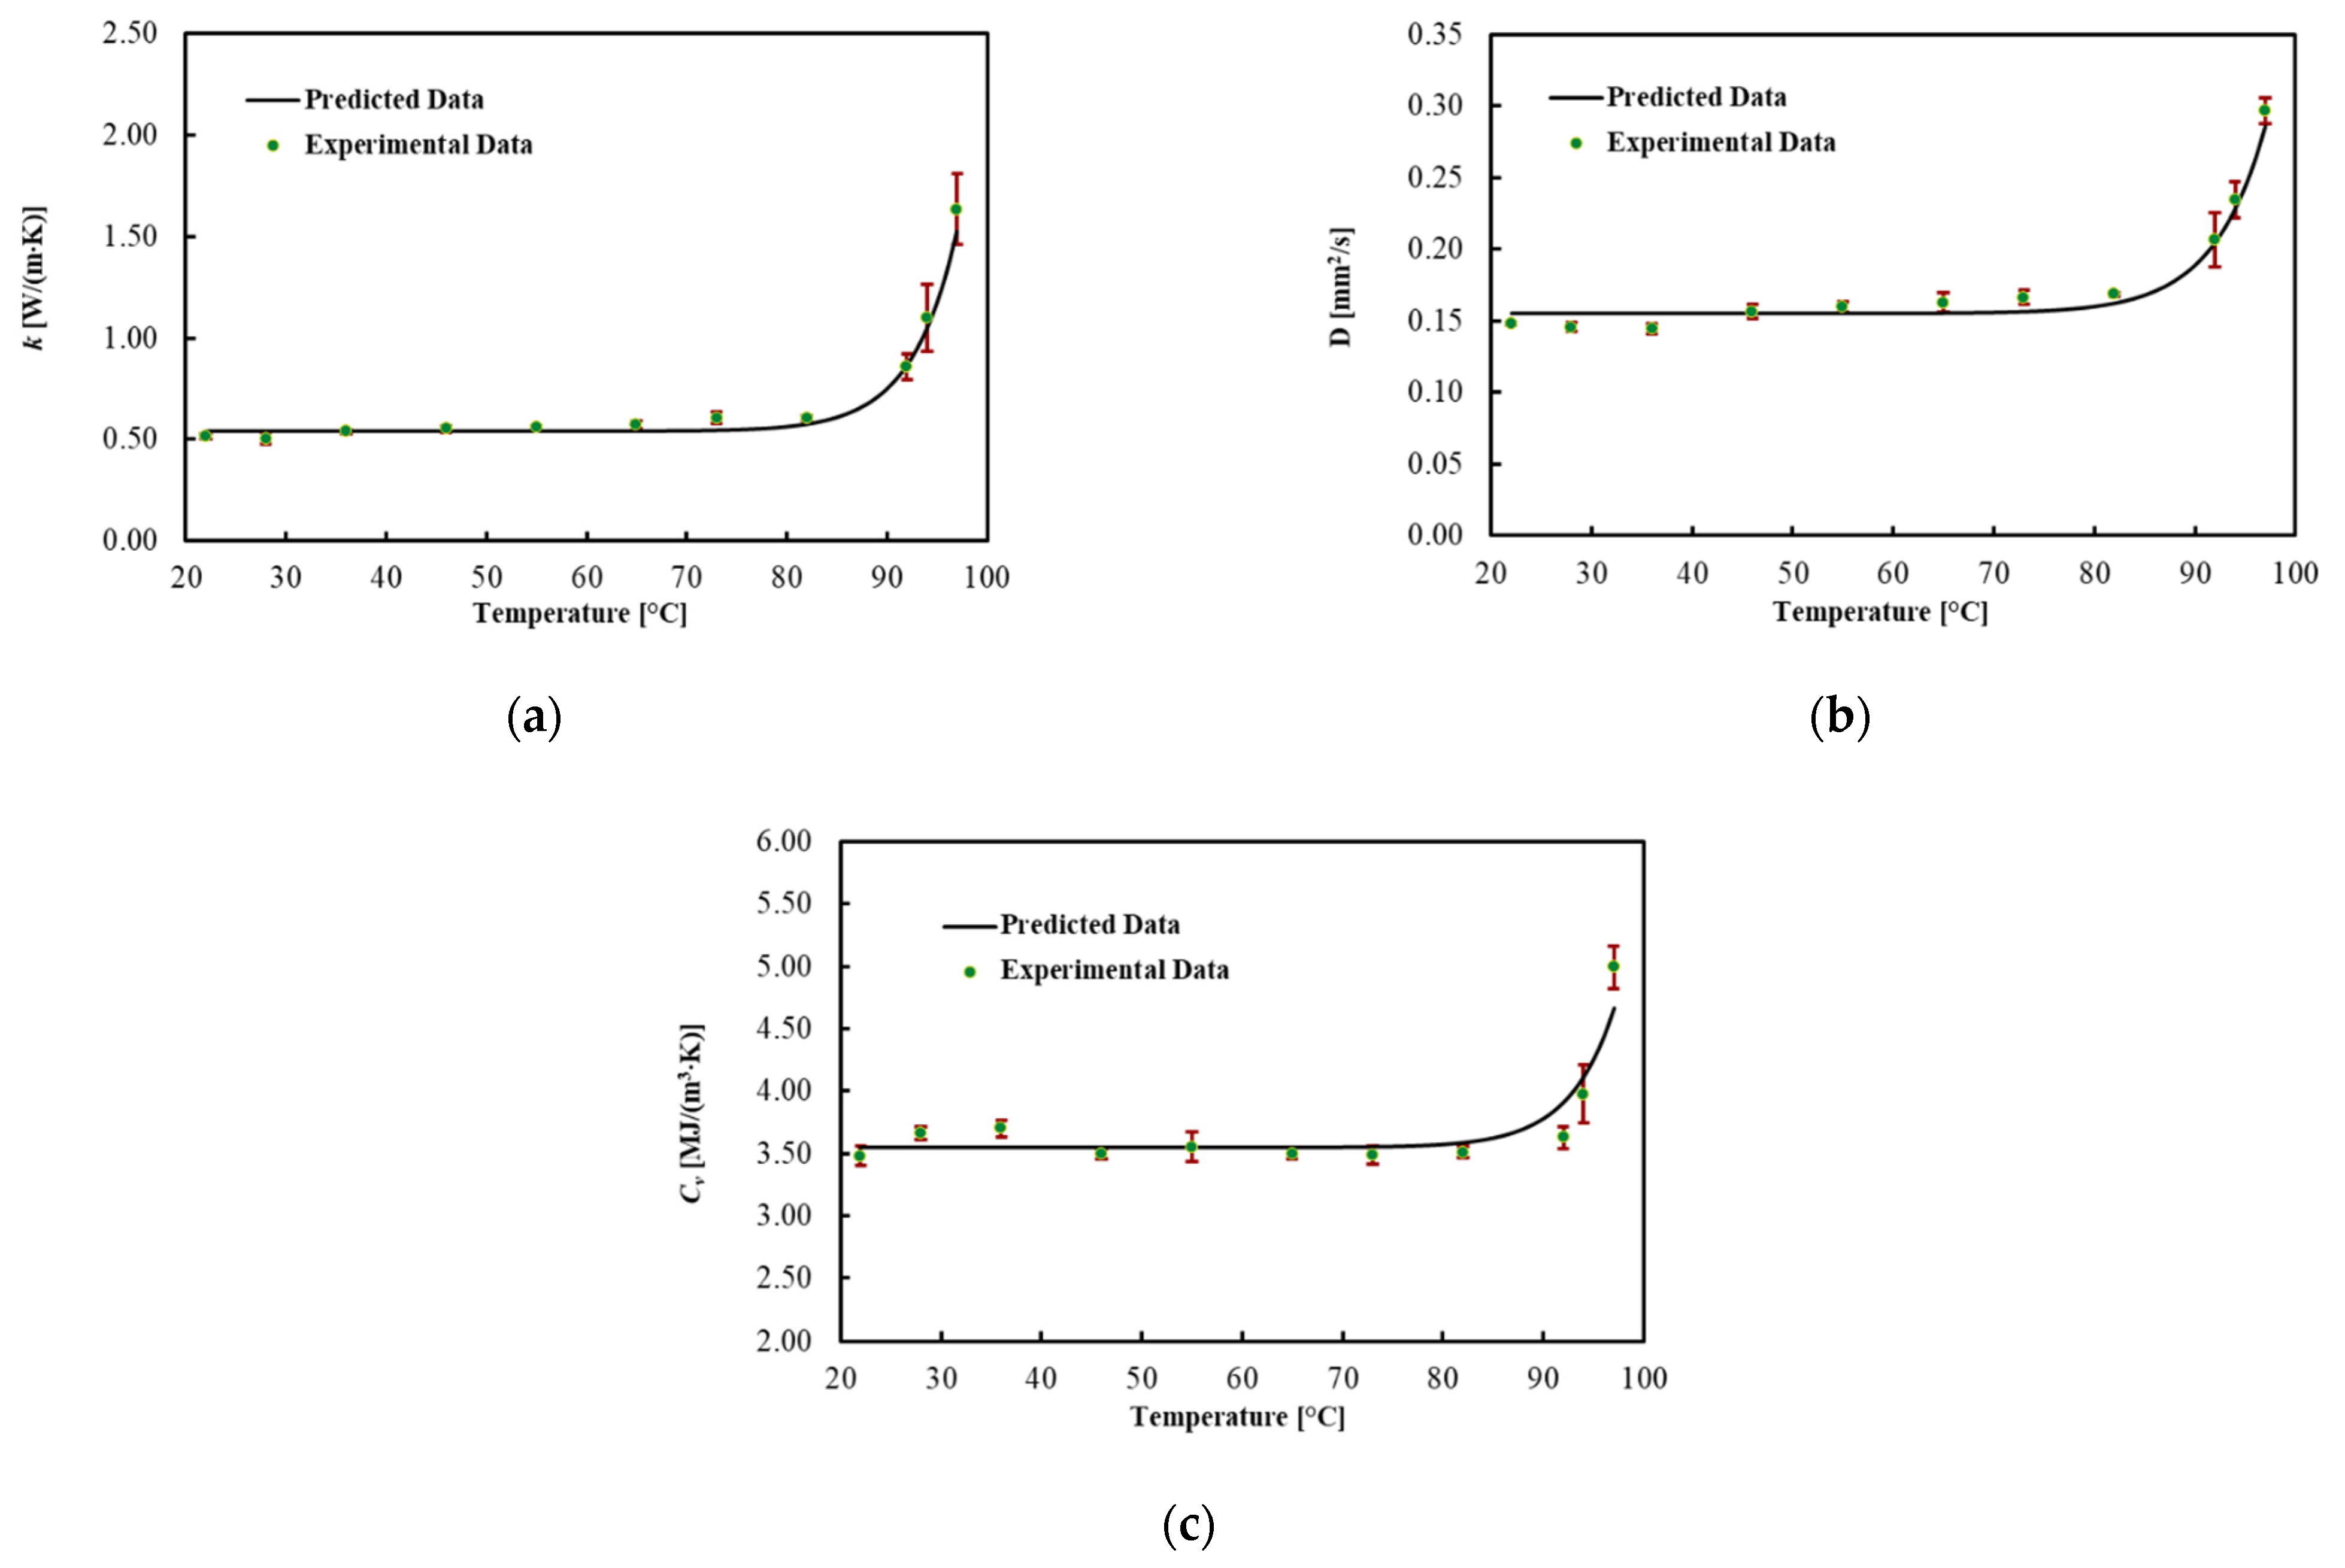
3.2. Liver
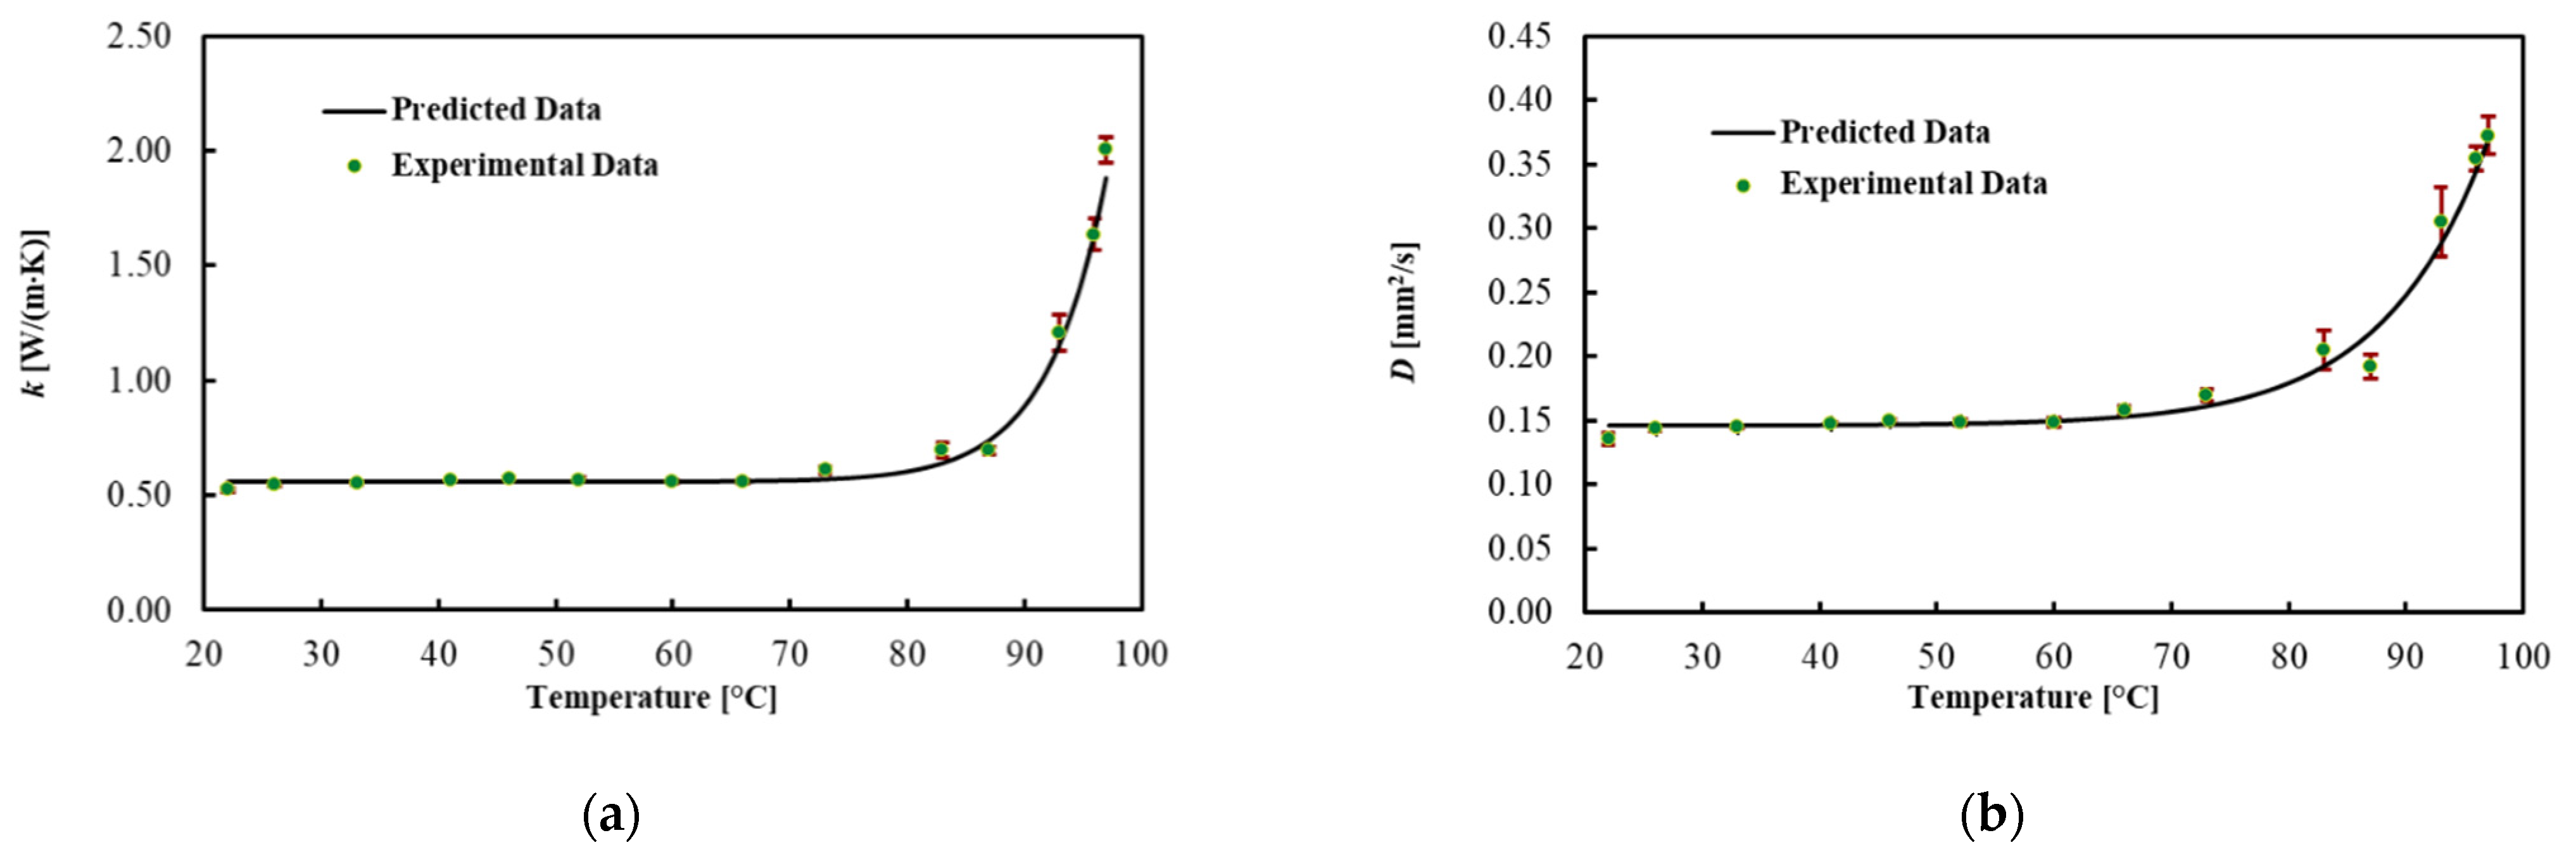
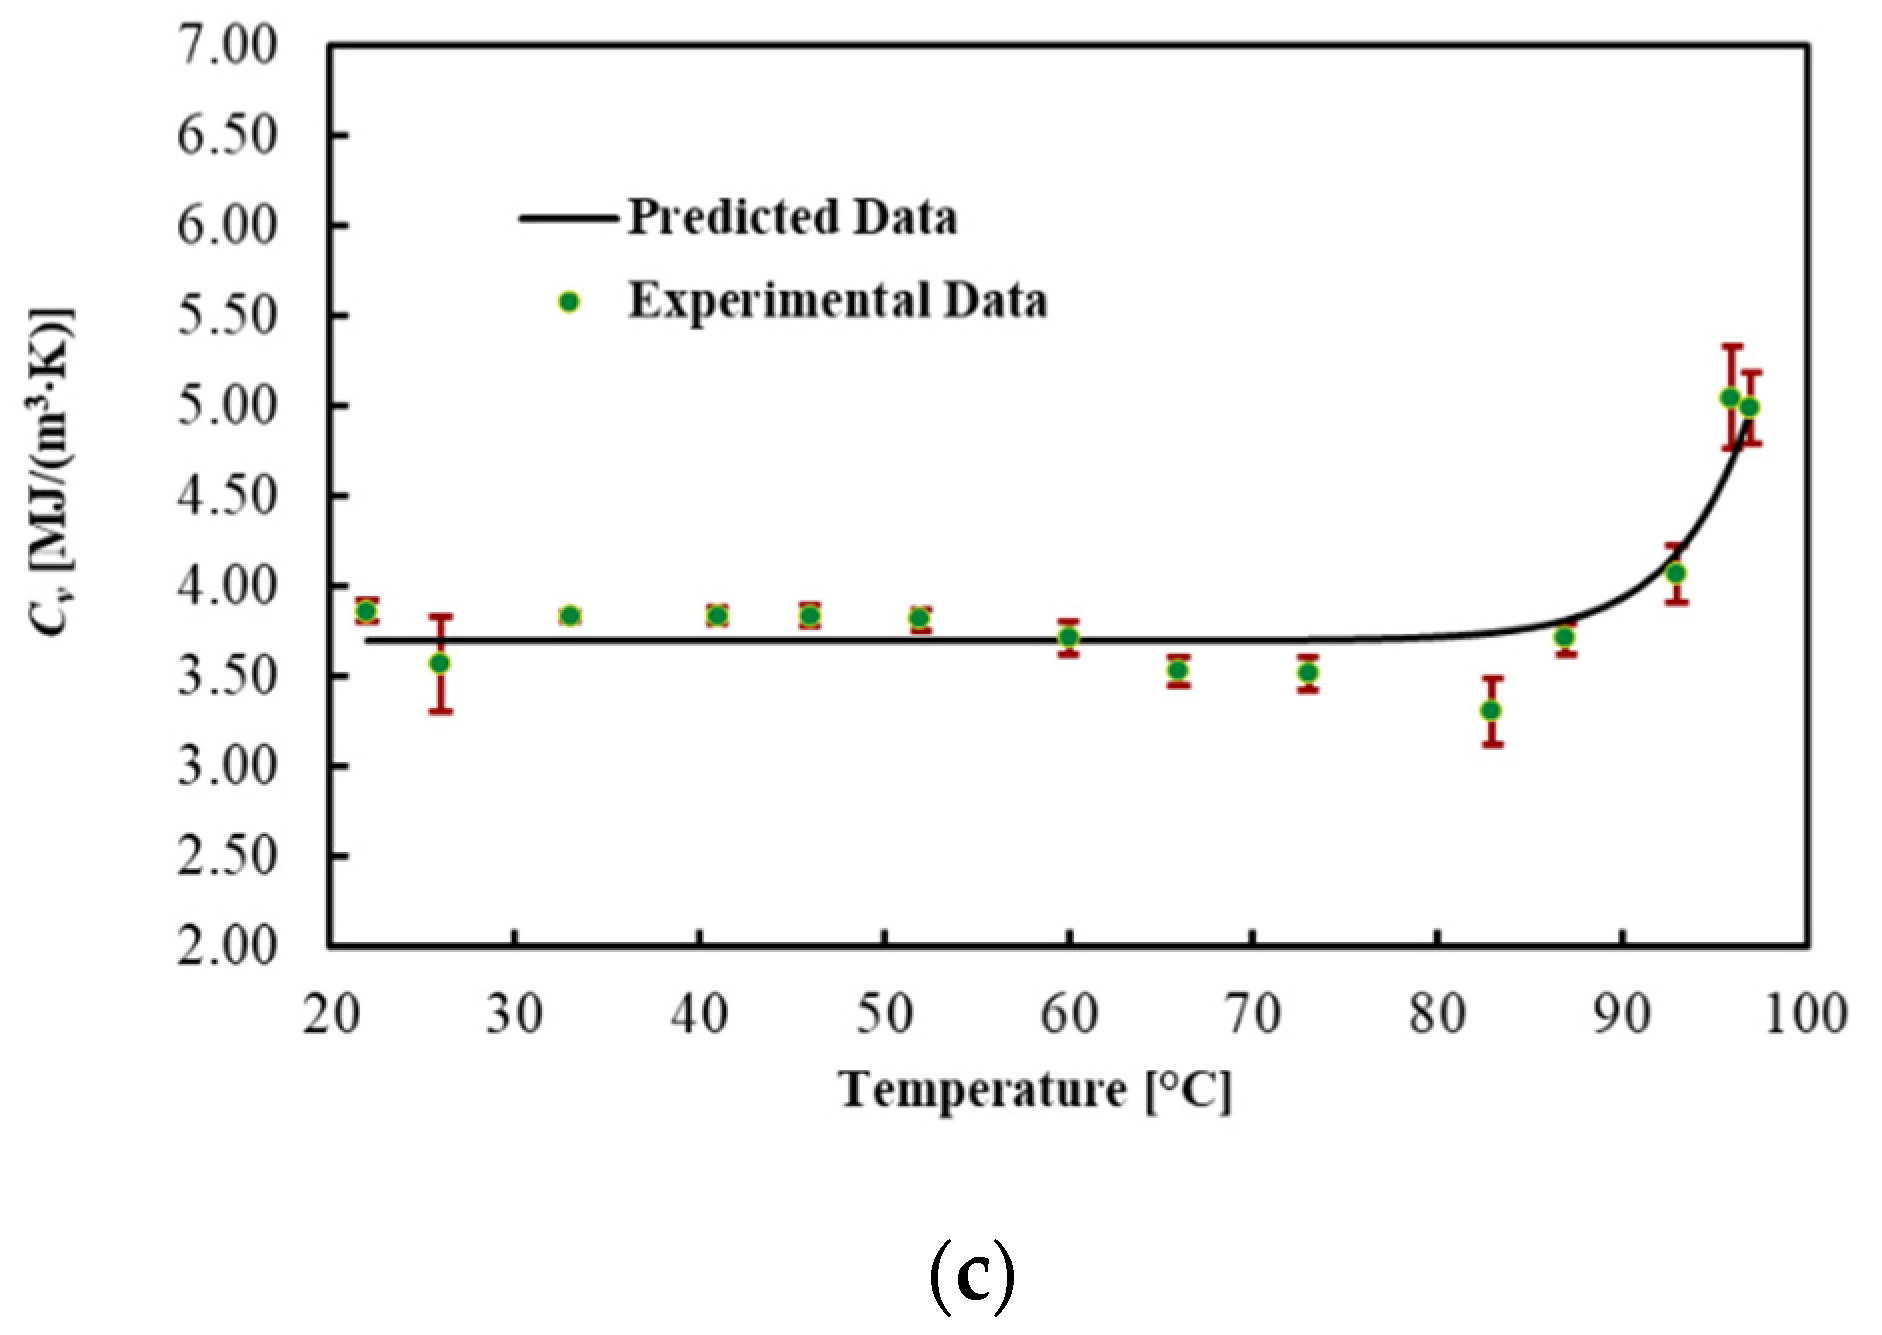
3.3. Brain
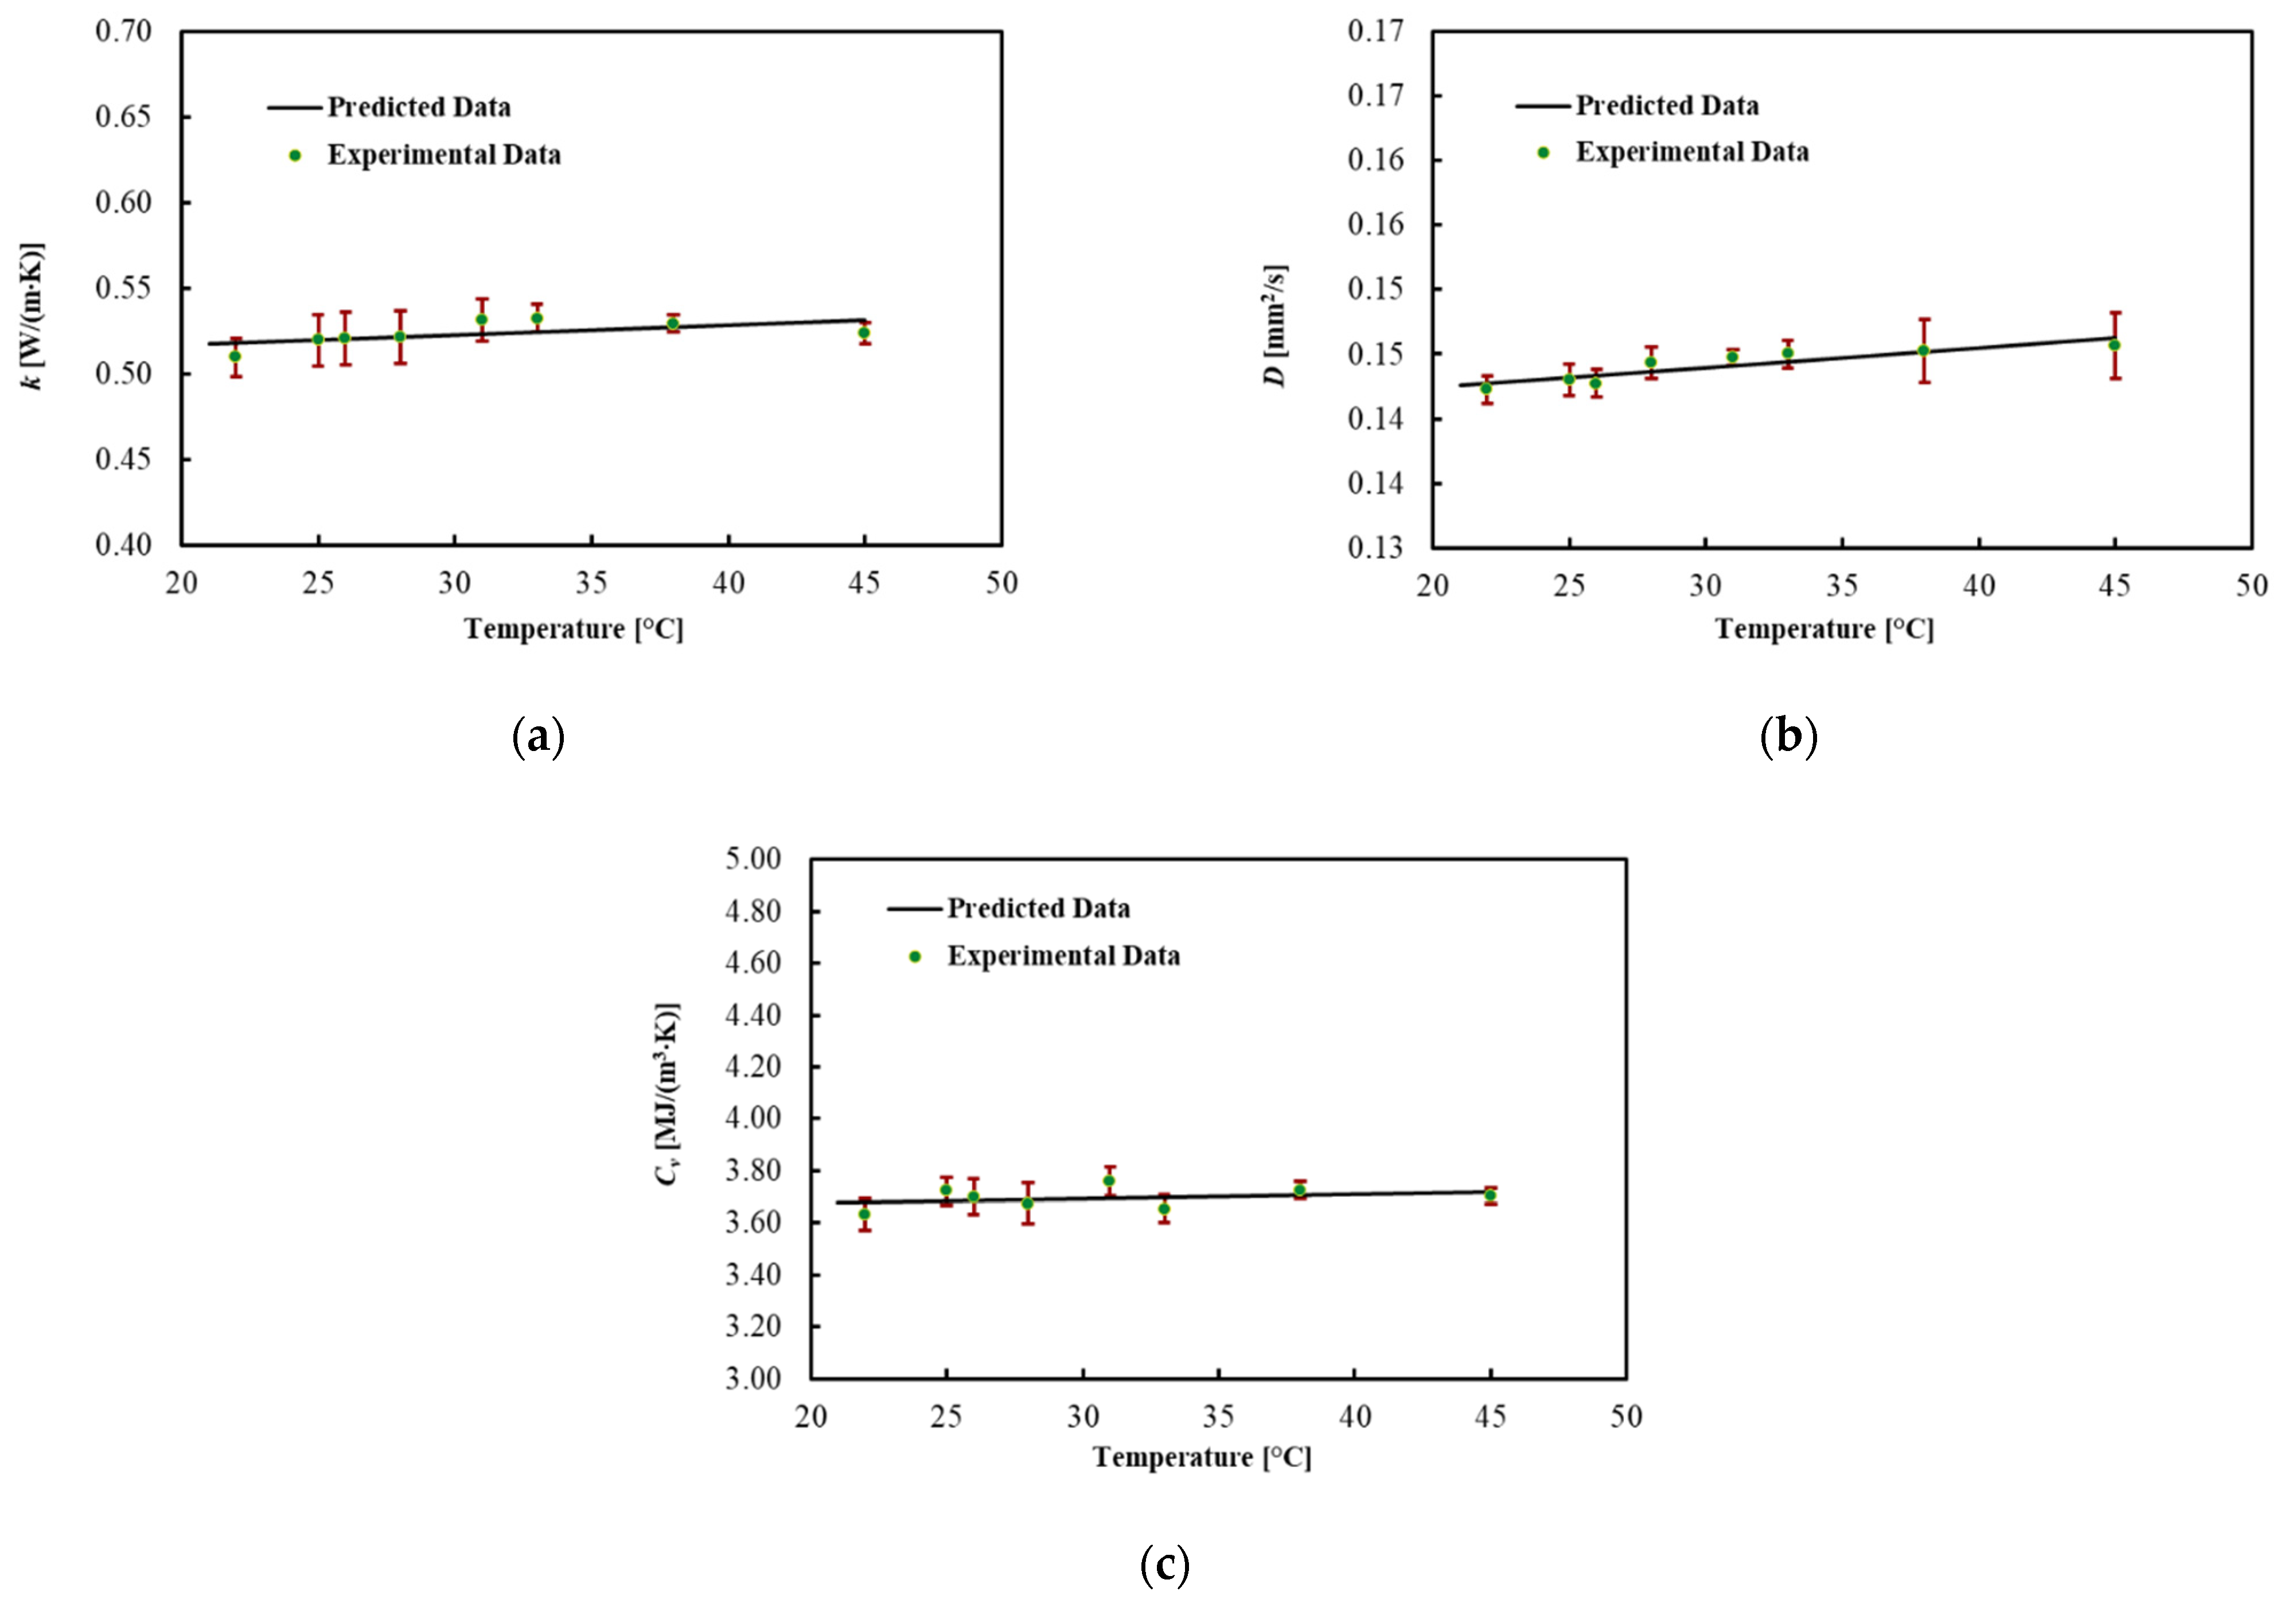
3.4. Pancreas
4. Discussion
5. Conclusions
Author Contributions
Funding
Data Availability Statement
Conflicts of Interest
References
- Ahmed, M.; Brace, C.L.; Lee, F.T., Jr.; Goldberg, S.N. Principles of and advances in percutaneous ablation. Radiology 2011, 258, 351–369. [Google Scholar] [CrossRef] [PubMed]
- Bianchi, L.; Korganbayev, S.; Orrico, A.; De Landro, M.; Saccomandi, P. Quasi-distributed fiber optic sensor-based control system for interstitial laser ablation of tissue: Theoretical and experimental investigations. Biomed. Opt. Express 2021, 12, 2841–2858. [Google Scholar] [CrossRef]
- Asadi, S.; Bianchi, L.; De Landro, M.; Korganbayev, S.; Schena, E.; Saccomandi, P. Laser-induced optothermal response of gold nanoparticles: From a physical viewpoint to cancer treatment application. J. Biophotonics 2021, 14, e202000161. [Google Scholar] [CrossRef] [PubMed]
- Korganbayev, S.; Orrico, A.; Bianchi, L.; De Landro, M.; Wolf, A.; Dostovalov, A.; Saccomandi, P. Closed-Loop Temperature Control Based on Fiber Bragg Grating Sensors for Laser Ablation of Hepatic Tissue. Sensors 2020, 20, 6496. [Google Scholar] [CrossRef] [PubMed]
- Brace, C. Thermal tumor ablation in clinical use. IEEE Pulse 2011, 2, 28–38. [Google Scholar] [CrossRef] [PubMed] [Green Version]
- Rossmann, C.; Haemmerich, D. Review of temperature dependence of thermal properties, dielectric properties, and perfusion of biological tissues at hyperthermic and ablation temperatures. Crit. Rev. Biomed. Eng. 2014, 42, 467–492. [Google Scholar] [CrossRef] [PubMed] [Green Version]
- Arkin, H.; Xu, L.; Holmes, K. Recent developments in modeling heat transfer in blood perfused tissues. IEEE Trans. Biomed. Eng. 1994, 41, 97–107. [Google Scholar] [CrossRef]
- Jaunich, M.; Raje, S.; Kim, K.; Mitra, K.; Guo, Z. Bio-heat transfer analysis during short pulse laser irradiation of tissues. Int. J. Heat Mass Transf. 2008, 51, 5511–5521. [Google Scholar] [CrossRef]
- Ng, E.; Tan, H.; Ooi, E. Prediction and parametric analysis of thermal profiles within heated human skin using the boundary element method. Philos. Trans. R. Soc. A Math. Phys. Eng. Sci. 2010, 368, 655–678. [Google Scholar] [CrossRef]
- Wessapan, T.; Srisawatdhisukul, S.; Rattanadecho, P. Numerical analysis of specific absorption rate and heat transfer in the human body exposed to leakage electromagnetic field at 915 MHz and 2450 MHz. J. Heat Transf. 2011, 133. [Google Scholar] [CrossRef]
- Paul, A.; Narasimhan, A.; Kahlen, F.J.; Das, S.K. Temperature evolution in tissues embedded with large blood vessels during photo-thermal heating. J. Therm. Biol. 2014, 41, 77–87. [Google Scholar] [CrossRef]
- Dua, R.; Chakraborty, S. A novel modeling and simulation technique of photo–thermal interactions between lasers and living biological tissues undergoing multiple changes in phase. Comput. Biol. Med. 2005, 35, 447–462. [Google Scholar] [CrossRef] [PubMed]
- Wu, X.; Zhang, K.; Chen, Y.; Wang, R.; Chen, L.; Zhang, A.; Hu, B. Theoretical and experimental study of dual-fiber laser ablation for prostate cancer. PLoS ONE 2018, 13, e0206065. [Google Scholar] [CrossRef] [PubMed]
- Barbés, B.; Páramo, R.; Blanco, E.; Pastoriza-Gallego, M.J.; Pineiro, M.M.; Legido, J.L.; Casanova, C. Thermal conductivity and specific heat capacity measurements of Al2O3 nanofluids. J. Therm. Anal. Calorim. 2013, 111, 1615–1625. [Google Scholar] [CrossRef]
- Lopresto, V.; Pinto, R.; Farina, L.; Cavagnaro, M. Microwave thermal ablation: Effects of tissue properties variations on predictive models for treatment planning. Med. Eng. Phys. 2017, 46, 63–70. [Google Scholar] [CrossRef]
- Sebek, J.; Albin, N.; Bortel, R.; Natarajan, B.; Prakash, P. Sensitivity of microwave ablation models to tissue biophysical properties: A first step toward probabilistic modeling and treatment planning. Med. Phys. 2016, 43, 2649–2661. [Google Scholar] [CrossRef]
- Singh, S.; Melnik, R. Thermal ablation of biological tissues in disease treatment: A review of computational models and future directions. Electromagn. Biol. Med. 2020, 39, 49–88. [Google Scholar] [CrossRef] [PubMed]
- Guntur, S.R.; Lee, K.I.; Paeng, D.-G.; Coleman, A.J.; Choi, M.J. Temperature-dependent thermal properties of ex vivo liver undergoing thermal ablation. Ultrasound Med. Biol. 2013, 39, 1771–1784. [Google Scholar] [CrossRef] [PubMed]
- Lopresto, V.; Argentieri, A.; Pinto, R.; Cavagnaro, M. Temperature dependence of thermal properties of ex vivo liver tissue up to ablative temperatures. Phys. Med. Biol. 2019, 64, 105016. [Google Scholar] [CrossRef]
- Silva, N.P.; Bottiglieri, A.; Conceição, R.C.; O’Halloran, M.; Farina, L. Characterisation of ex vivo liver thermal properties for electromagnetic-based hyperthermic therapies. Sensors 2020, 20, 3004. [Google Scholar] [CrossRef] [PubMed]
- Choi, J.H.; Bischof, J.C. A quantitative analysis of the thermal properties of porcine liver with glycerol at subzero and cryogenic temperatures. Cryobiology 2008, 57, 79–83. [Google Scholar] [CrossRef]
- Pospiech, E.; Greaser, M.L.; Mikolajczak, B.; Chiang, W.; Krzywdzińska, M. Thermal properties of titin from porcine and bovine muscles. Meat Sci. 2002, 62, 187–192. [Google Scholar] [CrossRef]
- Xiong, Y.; Brekke, C.; Leung, H. Thermal denaturation of muscle proteins from different species and muscle types as studied by differential scanning calorimetry. Can. Inst. Food Sci. Technol. J. 1987, 20, 357–362. [Google Scholar] [CrossRef]
- Lipkin, M.; Hardy, J.D. Measurement of some thermal properties of human tissues. J. Appl. Physiol. 1954, 7, 212–217. [Google Scholar] [CrossRef]
- Bennett, A. Thermal dependence of muscle function. Am. J. Physiol. Regul. Integr. Comp. Physiol. 1984, 247, R217–R229. [Google Scholar] [CrossRef] [PubMed]
- Silva, N.P.; Bottiglieri, A.; Porter, E.; O’Halloran, M.; Farina, L. Evaluation of Thermal Properties of Ex Vivo Kidney Up to Ablative Temperatures. In Proceedings of the European Medical and Biological Engineering Conference, Portorož, Slovenia, 29 November–3 December 2020; pp. 537–543. [Google Scholar]
- Salcman, M.; Moriyama, E.; Elsner, H.J.; Rossman, H.; Gettleman, R.A.; Neuberth, G.; Corradino, G. Cerebral blood flow and the thermal properties of the brain: A preliminary analysis. J. Neurosurg. 1989, 70, 592–598. [Google Scholar] [CrossRef]
- Valvano, J.; Cochran, J.; Diller, K. Thermal conductivity and diffusivity of biomaterials measured with self-heated thermistors. Int. J. Thermophys. 1985, 6, 301–311. [Google Scholar] [CrossRef]
- Center, M.M.; Jemal, A. International trends in liver cancer incidence rates. Cancer Epidemiol. Prev. Biomark. 2011, 20, 2362–2368. [Google Scholar] [CrossRef] [PubMed] [Green Version]
- Choi, J.; Morrissey, M.; Bischof, J.C. Thermal processing of biological tissue at high temperatures: Impact of protein denaturation and water loss on the thermal properties of human and porcine liver in the range 25–80 °C. J. Heat Transf. 2013, 135. [Google Scholar] [CrossRef]
- Silva, N.P.; Bottiglieri, A.; Conceição, R.C.; O’Halloran, M.; Farina, L. Thermal properties of Ex vivo biological tissue at room and body temperature. In Proceedings of the 2020 14th European Conference on Antennas and Propagation (EuCAP), Copenhagen, Denmark, 15–20 March 2020; pp. 1–5. [Google Scholar]
- Haemmerich, D.; Dos Santos, I.; Schutt, D.J.; Webster, J.G.; Mahvi, D.M. In vitro measurements of temperature-dependent specific heat of liver tissue. Med. Eng. Phys. 2006, 28, 194–197. [Google Scholar] [CrossRef]
- Franzini, A.; Moosa, S.; Servello, D.; Small, I.; DiMeco, F.; Xu, Z.; Elias, W.J.; Franzini, A.; Prada, F. Ablative brain surgery: An overview. Int. J. Hyperth. 2019, 36, 64–80. [Google Scholar] [CrossRef] [PubMed] [Green Version]
- Saccomandi, P.; Lapergola, A.; Longo, F.; Schena, E.; Quero, G. Thermal ablation of pancreatic cancer: A systematic literature review of clinical practice and pre-clinical studies. Int. J. Hyperth. 2018, 35, 398–418. [Google Scholar] [CrossRef] [PubMed]
- Cooper, T.E.; Trezek, G.J. A probe technique for determining the thermal conductivity of tissue. J. Heat Transfer. 1972. [Google Scholar] [CrossRef]
- Bowman, H. Heat transfer and thermal dosimetry. J. Microw. Power 1981, 16, 121–133. [Google Scholar] [CrossRef] [PubMed]
- Agafonkina, I.; Belozerov, A.; Vasilyev, A.; Pushkarev, A.; Tsiganov, D.; Shakurov, A.; Zherdev, A. Thermal Properties of Human Soft Tissue and Its Equivalents in a Wide Low-Temperature Range. J. Eng. Phys. Thermophys. 2021, 94, 233–246. [Google Scholar] [CrossRef]
- Farina, L.; Sumser, K.; van Rhoon, G.; Curto, S. Thermal Characterization of Phantoms Used for Quality Assurance of Deep Hyperthermia Systems. Sensors 2020, 20, 4549. [Google Scholar] [CrossRef]
- Morra, F.; De Landro, M.; Korganbayev, S.; Wolf, A.; Dostovalov, A.; Cigada, A.; Saccomandi, P. Spatially resolved thermometry during laser ablation in tissues: Distributed and quasi-distributed fiber optic-based sensing. Opt. Fiber Technol. 2020, 58, 102295. [Google Scholar] [CrossRef]
- TEMPOS—Thermal Properties Analyser Manual. Available online: https://www.metergroup.com/environment/products/tempos/ (accessed on 18 June 2021).
- Abramowitz, M.; Stegun, I.A. Handbook of Mathematical Functions: With Formulas, Graphs, and Mathematical Tables; National Bureau of Standards: Washington, DC, USA, 1972; Volume 55.
- Joint Committee for Guides in Metrology. Evaluation of measurement data—Guide to the expression of uncertainty in measurement. Int. Organ. Stand. Geneva ISBN 2008, 50, 134. [Google Scholar]
- Sung, H.; Ferlay, J.; Siegel, R.L.; Laversanne, M.; Soerjomataram, I.; Jemal, A.; Bray, F. Global cancer statistics 2020: GLOBOCAN estimates of incidence and mortality worldwide for 36 cancers in 185 countries. CA A Cancer J. Clin. 2021, 71, 209–249. [Google Scholar] [CrossRef]
- Rahib, L.; Smith, B.D.; Aizenberg, R.; Rosenzweig, A.B.; Fleshman, J.M.; Matrisian, L.M. Projecting cancer incidence and deaths to 2030: The unexpected burden of thyroid, liver, and pancreas cancers in the United States. Cancer Res. 2014, 74, 2913–2921. [Google Scholar] [CrossRef] [Green Version]
- Vlaisavljevich, E.; Owens, G.; Lundt, J.; Teofilovic, D.; Ives, K.; Duryea, A.; Bertolina, J.; Welling, T.H.; Xu, Z. Non-invasive liver ablation using histotripsy: Preclinical safety study in an in vivo porcine model. Ultrasound Med. Biol. 2017, 43, 1237–1251. [Google Scholar] [CrossRef] [PubMed]
- Cohen, Z.R.; Zaubermann, J.; Harnof, S.; Mardor, Y.; Nass, D.; Zadicario, E.; Hananel, A.; Castel, D.; Faibel, M.; Ram, Z. Magnetic resonance imaging-guided focused ultrasound for thermal ablation in the brain: A feasibility study in a swine model. Neurosurgery 2007, 60, 593–600. [Google Scholar] [CrossRef]
- Cools, K.S.; Moon, A.M.; Burke, L.M.; McGinty, K.A.; Strassle, P.D.; Gerber, D.A. Validation of the liver imaging reporting and data system treatment response criteria after thermal ablation for hepatocellular carcinoma. Liver Transplant. 2020, 26, 203–214. [Google Scholar] [CrossRef]
- Izzo, F.; Granata, V.; Grassi, R.; Fusco, R.; Palaia, R.; Delrio, P.; Carrafiello, G.; Azoulay, D.; Petrillo, A.; Curley, S.A. Radiofrequency ablation and microwave ablation in liver tumors: An update. Oncologist 2019, 24, e990. [Google Scholar] [CrossRef] [PubMed] [Green Version]
- Kim, A.H.; Tatter, S.; Rao, G.; Prabhu, S.; Chen, C.; Fecci, P.; Chiang, V.; Smith, K.; Williams, B.J.; Mohammadi, A.M. Laser ablation of abnormal neurological tissue using robotic neuroblate system (LAANTERN): 12-month outcomes and quality of life after brain tumor ablation. Neurosurgery 2020, 87, E338–E346. [Google Scholar] [CrossRef] [Green Version]
- Shah, A.H.; Semonche, A.; Eichberg, D.G.; Borowy, V.; Luther, E.; Sarkiss, C.A.; Morell, A.; Mahavadi, A.K.; Ivan, M.E.; Komotar, R.J. The role of laser interstitial thermal therapy in surgical neuro-oncology: Series of 100 consecutive patients. Neurosurgery 2020, 87, 266–275. [Google Scholar] [CrossRef] [PubMed]
- Coluccia, D.; Fandino, J.; Schwyzer, L.; O’Gorman, R.; Remonda, L.; Anon, J.; Martin, E.; Werner, B. First noninvasive thermal ablation of a brain tumor with MR-guided focusedultrasound. J. Ther. Ultrasound 2014, 2, 1–7. [Google Scholar] [CrossRef] [PubMed] [Green Version]
- Marinova, M.; Wilhelm-Buchstab, T.; Strunk, H. Advanced Pancreatic Cancer: High-Intensity Focused Ultrasound (HIFU) and Other Local Ablative Therapies. In RöFo-Fortschritte auf dem Gebiet der Röntgenstrahlen und der Bildgebenden Verfahren; Georg Thieme Verlag: Stuttgart, Germany, 2019; pp. 216–227. [Google Scholar]
- Yang, D.; Converse, M.C.; Mahvi, D.M.; Webster, J.G. Expanding the bioheat equation to include tissue internal water evaporation during heating. IEEE Trans. Biomed. Eng. 2007, 54, 1382–1388. [Google Scholar] [CrossRef]
- Chin, L.; Sherar, M. Changes in dielectric properties of ex vivo bovine liver at 915 MHz during heating. Phys. Med. Biol. 2001, 46, 197. [Google Scholar] [CrossRef] [PubMed]
- Svenstrup, G.; Brüggemann, D.; Kristensen, L.; Risbo, J.; Skibsted, L.H. The influence of pretreatment on pork fat crystallization. Eur. J. Lipid Sci. Technol. 2005, 107, 607–615. [Google Scholar] [CrossRef]
- Sharma, H.; Giriprasad, R.; Goswami, M. Animal fat-processing and its quality control. J. Food Process. Technol. 2013, 4, 252. [Google Scholar]
- Nollet, L.M.; Toldrá, F. Handbook of Analysis of Edible Animal by-Products; CRC Press: Boca Raton, FL, USA, 2011. [Google Scholar]
- Valvano, J.; Allen, J.; Bowman, H. The simultaneous measurement of thermal conductivity, thermal diffusivity, and perfusion in small volumes of tissue. J. Biomech. Eng. 1984, 106, 192–197. [Google Scholar] [CrossRef] [PubMed]
- Bhattacharya, A.; Mahajan, R. Temperature dependence of thermal conductivity of biological tissues. Physiol. Meas. 2003, 24, 769. [Google Scholar] [CrossRef] [PubMed]
- Hristov, J. Bio-heat models revisited: Concepts, derivations, nondimensalization and fractionalization approaches. Front. Phys. 2019, 7, 189. [Google Scholar] [CrossRef] [Green Version]
- Blauth, S.; Hübner, F.; Leithäuser, C.; Siedow, N.; Vogl, T.J. Mathematical modeling of vaporization during laser-induced thermotherapy in liver tissue. J. Math. Ind. 2020, 10, 1–16. [Google Scholar] [CrossRef]


| Set Temperature Ts (°C) | Thermal Conductivity k (W/(m·K)) | Thermal Diffusivity D (mm2/s) | Volumetric Heat Capacity Cv (MJ/(m3·K)) | |||
|---|---|---|---|---|---|---|
| Mean | Mean | Uncertainty | Mean | Uncertainty | Mean | Uncertainty |
| 22 | 0.515 | 0.014 | 0.148 | 0.001 | 3.48 | 0.08 |
| 28 | 0.504 | 0.027 | 0.146 | 0.004 | 3.66 | 0.05 |
| 36 | 0.537 | 0.009 | 0.144 | 0.004 | 3.70 | 0.07 |
| 46 | 0.550 | 0.014 | 0.156 | 0.005 | 3.50 | 0.04 |
| 55 | 0.559 | 0.009 | 0.160 | 0.004 | 3.55 | 0.12 |
| 65 | 0.571 | 0.017 | 0.163 | 0.007 | 3.50 | 0.05 |
| 73 | 0.607 | 0.028 | 0.166 | 0.005 | 3.48 | 0.07 |
| 82 | 0.603 | 0.015 | 0.168 | 0.002 | 3.51 | 0.05 |
| 92 | 0.858 | 0.061 | 0.206 | 0.019 | 3.63 | 0.09 |
| 94 | 1.099 | 0.167 | 0.235 | 0.013 | 3.98 | 0.24 |
| 97 | 1.635 | 0.175 | 0.297 | 0.009 | 4.99 | 0.17 |
| Thermal Property | a | b | c | MPE (%) | R2 |
|---|---|---|---|---|---|
| Thermal Conductivity k (W/(m·K)) | 0.543 | 4.41 × 10⁻¹⁰ | 0.222 | 5.0 | 0.990 |
| Thermal Diffusivity D (mm2/s) | 0.155 | 4.95 × 10⁻¹⁰ | 0.201 | 4.1 | 0.978 |
| Volumetric Heat Capacity Cv (MJ/(m3·K)) | 3.542 | 1.79 × 10⁻¹⁰ | 0.233 | 3.2 | 0.875 |
| Set Temperature Ts (°C) | Thermal Conductivity k (W/(m·K)) | Thermal Diffusivity D (mm2/s) | Volumetric Heat Capacity Cv (MJ/(m3·K)) | |||
|---|---|---|---|---|---|---|
| Mean | Mean | Uncertainty | Mean | Uncertainty | Mean | Uncertainty |
| 22 | 0.524 | 0.010 | 0.136 | 0.005 | 3.86 | 0.06 |
| 26 | 0.544 | 0.001 | 0.143 | 0.001 | 3.56 | 0.26 |
| 33 | 0.553 | 0.004 | 0.145 | 0.001 | 3.83 | 0.03 |
| 41 | 0.563 | 0.005 | 0.147 | 0.001 | 3.83 | 0.04 |
| 46 | 0.574 | 0.006 | 0.149 | 0.001 | 3.83 | 0.06 |
| 52 | 0.567 | 0.011 | 0.149 | 0.003 | 3.81 | 0.06 |
| 60 | 0.560 | 0.007 | 0.149 | 0.003 | 3.71 | 0.09 |
| 66 | 0.560 | 0.006 | 0.158 | 0.003 | 3.53 | 0.08 |
| 73 | 0.611 | 0.016 | 0.170 | 0.005 | 3.52 | 0.09 |
| 83 | 0.697 | 0.034 | 0.205 | 0.015 | 3.30 | 0.19 |
| 87 | 0.696 | 0.017 | 0.192 | 0.009 | 3.71 | 0.09 |
| 93 | 1.209 | 0.080 | 0.305 | 0.027 | 4.06 | 0.16 |
| 96 | 1.635 | 0.069 | 0.354 | 0.009 | 5.04 | 0.28 |
| 97 | 2.005 | 0.057 | 0.373 | 0.014 | 4.98 | 0.20 |
| Thermal Property | a | b | c | MPE (%) | R2 |
|---|---|---|---|---|---|
| Thermal Conductivity k (W/(m·K)) | 0.558 | 2.261 × 10⁻⁹ | 0.208 | 3.7 | 0.991 |
| Thermal Diffusivity D (mm2/s) | 0.147 | 9.406 × 10⁻⁷ | 0.127 | 3.5 | 0.984 |
| Volumetric Heat Capacity Cv (MJ/(m3·K)) | 3.732 | 9.530 × 10⁻¹¹ | 0.240 | 4.1 | 0.868 |
| Set Temperature Ts (°C) | Thermal Conductivity k (W/(m·K)) | Thermal Diffusivity D (mm2/s) | Volumetric Heat Capacity Cv (MJ/(m3·K)) | |||
|---|---|---|---|---|---|---|
| Mean | Mean | Uncertainty | Mean | Uncertainty | Mean | Uncertainty |
| 22 | 0.510 | 0.011 | 0.142 | 0.001 | 3.63 | 0.06 |
| 25 | 0.520 | 0.015 | 0.143 | 0.001 | 3.72 | 0.05 |
| 26 | 0.520 | 0.016 | 0.143 | 0.001 | 3.70 | 0.07 |
| 28 | 0.521 | 0.015 | 0.144 | 0.001 | 3.68 | 0.08 |
| 31 | 0.531 | 0.012 | 0.145 | 0.001 | 3.76 | 0.05 |
| 33 | 0.532 | 0.008 | 0.145 | 0.001 | 3.66 | 0.05 |
| 38 | 0.529 | 0.005 | 0.145 | 0.002 | 3.73 | 0.03 |
| 45 | 0.524 | 0.006 | 0.146 | 0.003 | 3.70 | 0.03 |
| Thermal Property | a | b | MPE (%) |
|---|---|---|---|
| Thermal Conductivity k (W/(m·K)) | 5.7 × 10⁻⁴ | 0.506 | 0.8 |
| Thermal Diffusivity D (mm2/s) | 1.5 × 10⁻⁴ | 0.139 | 0.4 |
| Volumetric Heat Capacity Cv (MJ/(m3·K)) | 1.6 × 10⁻⁴ | 3.645 | 0.9 |
| Temperature (°C) | Result of this Work (Ex Vivo Porcine Liver) | Nuno P. Silva et al. [20] (Ex Vivo Ovine Liver) | Lopresto et al. [19] (Ex Vivo Bovine Liver) | Guntur et al. [18] (Ex Vivo Porcine Liver) | Choi et al. [30] (Ex Vivo Human and Porcine Liver) |
|---|---|---|---|---|---|
| Conductivity (W/(m·K)) | |||||
| 22 | 0.51 | 0.5 | 0.5 | 0.5 | 0.57 |
| 80 | 0.6 | 0.56 | --- | 0.67 | 0.56 |
| 92 | 0.85 | 0.58 | 0.76 | --- | --- |
| 95 | 1.09 | --- | 1.19 | --- | --- |
| 97 | 1.63 | 1.08 | --- | --- | --- |
| 99 | --- | --- | 2.25 | --- | --- |
| Diffusivity (mm2/s) | |||||
| 22 | 3.48 | 3.39 | 3.49 | 3.68 | 3.50 |
| 80 | 3.51 | 3.37 | --- | --- | --- |
| 90 | --- | 3.41 | 3.36 | 4.30 | 3.60 |
| 92 | 3.63 | 3.55 | 3.84 | --- | --- |
| 95 | 3.98 | --- | 4.17 | --- | --- |
| 97 | 4.99 | 5.05 | --- | --- | --- |
| 99 | --- | --- | 7.31 | --- | --- |
| Volumetric Heat Capacity (MJ/(m3·K)) | |||||
| 22 | 0.148 | 0.15 | 0.14 | 0.15 | --- |
| 80 | 0.168 | 0.16 | --- | --- | --- |
| 90 | --- | 0.18 | 0.17 | 0.19 | --- |
| 92 | 0.206 | 0.16 | 0.20 | --- | --- |
| 95 | 0.235 | --- | 0.29 | --- | --- |
| 97 | 0.297 | 0.23 | --- | --- | --- |
| 99 | --- | --- | 0.31 | --- | --- |
Publisher’s Note: MDPI stays neutral with regard to jurisdictional claims in published maps and institutional affiliations. |
© 2021 by the authors. Licensee MDPI, Basel, Switzerland. This article is an open access article distributed under the terms and conditions of the Creative Commons Attribution (CC BY) license (https://creativecommons.org/licenses/by/4.0/).
Share and Cite
Mohammadi, A.; Bianchi, L.; Asadi, S.; Saccomandi, P. Measurement of Ex Vivo Liver, Brain and Pancreas Thermal Properties as Function of Temperature. Sensors 2021, 21, 4236. https://doi.org/10.3390/s21124236
Mohammadi A, Bianchi L, Asadi S, Saccomandi P. Measurement of Ex Vivo Liver, Brain and Pancreas Thermal Properties as Function of Temperature. Sensors. 2021; 21(12):4236. https://doi.org/10.3390/s21124236
Chicago/Turabian StyleMohammadi, Ahad, Leonardo Bianchi, Somayeh Asadi, and Paola Saccomandi. 2021. "Measurement of Ex Vivo Liver, Brain and Pancreas Thermal Properties as Function of Temperature" Sensors 21, no. 12: 4236. https://doi.org/10.3390/s21124236
APA StyleMohammadi, A., Bianchi, L., Asadi, S., & Saccomandi, P. (2021). Measurement of Ex Vivo Liver, Brain and Pancreas Thermal Properties as Function of Temperature. Sensors, 21(12), 4236. https://doi.org/10.3390/s21124236