Article

Paraconsistent Annotated Logic Algorithms Applied in Management and Control of Communication Network Routes

by
João Inácio Da Silva Filho
1,*,
Jair Minoro Abe
1,2,
Alessandro de Lima Marreiro
1,
Angel Antonio Gonzalez Martinez
2,
Cláudio Rodrigo Torres
1,
Alexandre Rocco
1,
Hyghor Miranda Côrtes
1,
Mauricio Conceição Mario
1,
Marcos Tadeu Tavares Pacheco
1,
Dorotéa Vilanova Garcia
1 and
Maurício Fontoura Blos
1
1
Laboratory of Applied Paraconsistent Logic, Santa Cecilia University, Oswaldo Cruz Street, 288, Santos 11045-100, Brazil
2
Graduate Program in Production Engineering, Paulista University, José Maria Whitaker Avenue, 320, São Paulo 04057-000, Brazil
*
Author to whom correspondence should be addressed.
Sensors 2021, 21(12), 4219; https://doi.org/10.3390/s21124219
Submission received: 6 May 2021 / Revised: 16 June 2021 / Accepted: 17 June 2021 / Published: 20 June 2021
(This article belongs to the Section Communications)

Abstract

:
This paper presents a computational method based on non-classical logic dedicated to routing management and information stream control in communication networks. Paraconsistent logic (PL) was used to create an algorithmic structure whose main property is to accept contradiction. Moreover, a computational structure, the denominated paraconsistent data analyzer (PDAPAL2v), was constructed to perform routing management in communication networks. Direct comparisons of PDAPAL2v with a classical logic system that simulates routing conditions were made in the laboratory. In the conventional system, the paraconsistent algorithms were considered as binary logic gates, and in the tests, the same adjustment limits of PDAPAL2v were applied. Using a database with controlled insertion of noise, we obtained an efficacy of 97% in the detection of deteriorated packets with PDAPAL2v and 72% with the conventional simulation system. Functional tests were carried out, showing that PDAPAL2v is able to assess the conditions and degradation of links and perform the analysis and correlation of various inputs and variables, even if the signals have contradictory values. From practical tests in the laboratory, the proposed method represents a new way of managing and controlling communication network routes with good performance.

1. Introduction

An organization’s communication network is defined through the pattern of contacts between members of the organization and the flow of information between them [1]. As seen in [2], the network configuration helps managers to establish contacts in different patterns through communication flows, and to be successful in this task, the information flow must be managed, regulated, and structured.
The management of a communication network consists of controlling the flow of information data routes to maximize its efficiency and productivity. The management system’s main activity is monitoring and controlling network elements (physical or logical) on a continuous basis and ensuring that a certain level of service always exists within certain limits.
A network management system has as its activity the coordination and monitoring of the use of material resources, such as modems and routers, as well as logical resources, such as the protocols physically distributed in the network, reliability assurance, acceptable response times, and information security [2,3,4].
Modern communication networks are becoming increasingly wide and heterogeneous due to a growing set of wireless and wired devices and services. This condition has brought about the need for interaction between numerous interconnected components, and this new design of information signal flow presents a challenge for communication engineering [5,6].
The term “routing” refers to the process that establishes the procedures for application in communication between two devices that are in different networks through package exchanges of information signals. The main routing procedures are to learn alternative routes to reach a remote network and to make the best routes among those available [7,8].
Currently, some algorithms define the data that originate in a particular network and how they can reach another remote network. However, due to the complexity of the current communication networks with the incorporation of new communication networks and modern infrastructure of existing connection links, it is required that the routing processes be efficient and with specific policies for quality control.
As these new adaptations are complex, the information systems operate with uncertainties, so routing management and optimized flow control require more efficient equipment that can respond in real time to the problems presented [2,9]. To obtain an acceptable level of quality, routing algorithms in these complex networks must be able to handle uncertain signals and values that express inconsistent information, and be sensitive to performance metrics that refer to the average signal transfer rate and delay time in its transferring process. These algorithms must respond well to scalability issues and automatically keep up-to-date with network changes and be stable when oscillations occur [8,9].
In the present work, non-classical methods are employed through paraconsistent logic (PL), which, under certain conditions, accepts contradiction in its foundations [10]. Based on an extension of the PL called paraconsistent annotated logic with annotation of two values (PAL2v) [11], a computational system for routing management is developed.
The routing management configuration consists of an analysis network constructed with paraconsistent algorithms that equate and direct the signals according to results based on PAL2v.
We highlight that with the new PL-based technique that is presented, it is possible to construct computational architectures capable of assessing the conditions and degradation of links and perform the analysis and correlation of various inputs and variables, even if the signals presented have contradictory values [11,12].
The possibility of forming computational structures capable of handling contradictory signals is important for supporting the research and development of new technologies essential to communication networks.

Organization

The remainder of this paper is structured as follows: In Section 2, the main works related to the application of algorithms in routing management are presented. In Section 3, we present the fundamental principles of paraconsistent logic and the equations and algorithms used in this research. In Section 4, we describe in detail the computational structure of PDAPAL2v, the signal acquisition procedures, and the information sources used in the routing process. In addition, in Section 4, we present the PDAPAL2v interface and its suitability for an architecture of a data network used in validation tests. In Section 5, we present the results through tables that show the values obtained by simulations performed with the PDAPAL2v interface. In Section 6, discussions about the results obtained in the simulations are presented. The concluding remarks and future works are given in Section 7.

2. Related Works

In the past years, several researchers have published papers related to the use of software to select the best route for data traffic in communication networks. This topic is presented just to show the related works.
In the work presented in [12], the authors showed a family of distributed algorithms that were like an extension of the classical routing algorithms. These algorithms combine the ideas of online asynchronous distance vector routing with adaptive link state routing. The routing system uses the current state of the traffic, and the connection costs are measured by sending routing agents in the network that mix with the regular information packets and keep a record of the costs. In the work presented in [13], the authors highlighted the problem in which uneven traffic distribution causes information congestion, increasing packet losses, and delay periods, thus reducing the lifetime of the communication network. To decrease these problems, the authors presented a technique with probability-based algorithms. This probabilistic procedure uses a new objective function (OF) and a new routing metric based on route minimization. In addition to the projects developed with algorithms based on classical binary logic, several forms and alternatives involving monitoring and controlling routes using non-classical processes have been researched. For instance, in the work presented in [14], the authors showed a monitoring system that performs alarm correlation in communication networks. The system works based on association rules where an artificial neural network (ANN) is used to classify alarms with different levels. In the same work, the authors explored an optimization AI technique with a tree structure to improve the detection efficiency. In the work presented in [15], the authors designed a controller to enable quality of service for delivering multimedia services over networks with Open Flow switches. In this work, the authors proposed an architecture where multimedia flows are dynamically allocated in routes where the quality of service is guaranteed. Traffic is classified into data streams using shortest-path algorithm and multimedia streams using the QoS dynamic routing algorithm. In the work presented in [16], an architecture was designed within a domain for video transmission over a software-defined network (SDN), which includes a routing module that contains a topology monitor, and it is responsible for verifying network conditions, considering parameters such as bandwidth, jitter, and link delay, and forwards data packets according to restriction-based routing algorithms. In the work presented in [17], a quality of service (QoS) control focuses on a computational cloud infrastructure within the same domain or data center. The QoS routing algorithm is based only on network bandwidth control. The results showed improvements in multimedia and web applications but did not consider high-performance computing applications in the experiment.
In the work presented in [18], an SDN QoS scheme that classifies application flows according to user needs was presented. In particular, the system controls bandwidth by allocating it according to user-defined priorities. The SDN controller is responsible for installing traffic-shaping rules for data streams, and it is focused on broadband access networks, such as ADSL, within a single domain. In the work presented in [19], a QoS model was oriented to emergency cases, such as primary communication link fails where it is necessary to use a backup link. In the case of a contingency, VoIP traffic from premium users or applications that control bandwidth is prioritized. To achieve bandwidth control, packets are tagged with a specific priority and routing is dynamically adapted to the highest-priority outgoing queues. The system considers packet loss, latency, and jitter metrics to determine QoS performance for this type of application.
These works, despite providing relevant forms of data treatment applied in routing management, do not offer methods capable of analyzing contradictory signals. Paraconsistent logic has this property, and its algorithms are able to act satisfactorily, in situations of uncertainty, analyze contradictory information. Our proposed method, which uses PAL2v algorithms with similar configurations as the architectures, is presented in this paper. Furthermore, this paper is dedicated to the analysis of communication network routes that can be adapted in microelectronics projects. In this case, the paraconsistent structure can be supported by more advanced techniques, such as those presented in [20], where the authors used a reliable network-on-chip router architecture.
A computational architecture with paraconsistent algorithms can be adapted to a similar operation of the most current techniques of communication networks such as the one presented in [21], where the authors work with a software-defined wide area network (SD-WAN). In this case, the adaptation of PAL2v algorithms with structures similar to those shown in this article can be applied with possibilities to handle contradictory signals. Regarding data analysis with algorithms based on paraconsistent logic, we highlight the work presented in [22], where the authors used an anomaly detection approach employing a network segment digital signature with flow analysis (DSNSF). The signature pattern is generated with an autoregressive integrated moving average (ARIMA) model, and a functional algorithm based on non-classical PAL2v logic is used with the objective of avoiding high false alarm rates due to data traffic variations in the communication network. In the work presented in [23], a new methodology for detecting anomalies in computer networks was proposed using the digital signature of network segment traffic (DSNSF) with the aid of PAL2v algorithms. In this work, the DSNSF is organized under the rules of two models, autoregressive integrated moving average (ARIMA) and ant colony optimization for digital signature (ACODS). Through the analysis of data traffic records, the DSNSF structures are used as normal profiles for traffic resources observed in the network. To assimilate the DSNSF of both models and the traffic disturbances caused by network anomalies, the authors presented a correlational paraconsistent machine (CPM) based on PAL2v.
Research involving data processing with paraconsistent artificial neural networks is currently under development and provides new technologies based on PAL2v. In the work presented in [24], the authors used an inverted pendulum paraconsistent control where the algorithmic structures of paraconsistent artificial neural networks based on PAL2v algorithms were used. With the necessary adaptations, these paraconsistent artificial neural networks used in [24] can be applied in the management of routes in communication networks. Therefore, the motivation of this article is the fact that there is still an open problem, which is to design routing management systems in communication systems capable of making decisions based on contradictory information.

3. Paraconsistent Logic

Classical logic is based on rigid binary laws, which makes it impossible to apply it in some real-world situations, such as situations of redundancy, inconsistencies, or incompleteness. Recently, non-classical logics such as multivalued, fuzzy, or paraconsistent, have been developed and introduced to use in situations in which binary logic cannot be applied. Therefore, non-classical logics have the main objective of opposing the binary principles of classical logic, and among these, PL stands out that has the main property of dealing with the concept of contradiction without trivialization [10].

3.1. Paraconsistent Annotated Logic with Annotation of Two Values (PAL2v)

PL has, as an extension, paraconsistent annotated logic (PAL), which has an associated lattice with logical states represented at its vertices. This way, logical sentences can be obtained, where propositions P can be analyzed based on evidence [11].
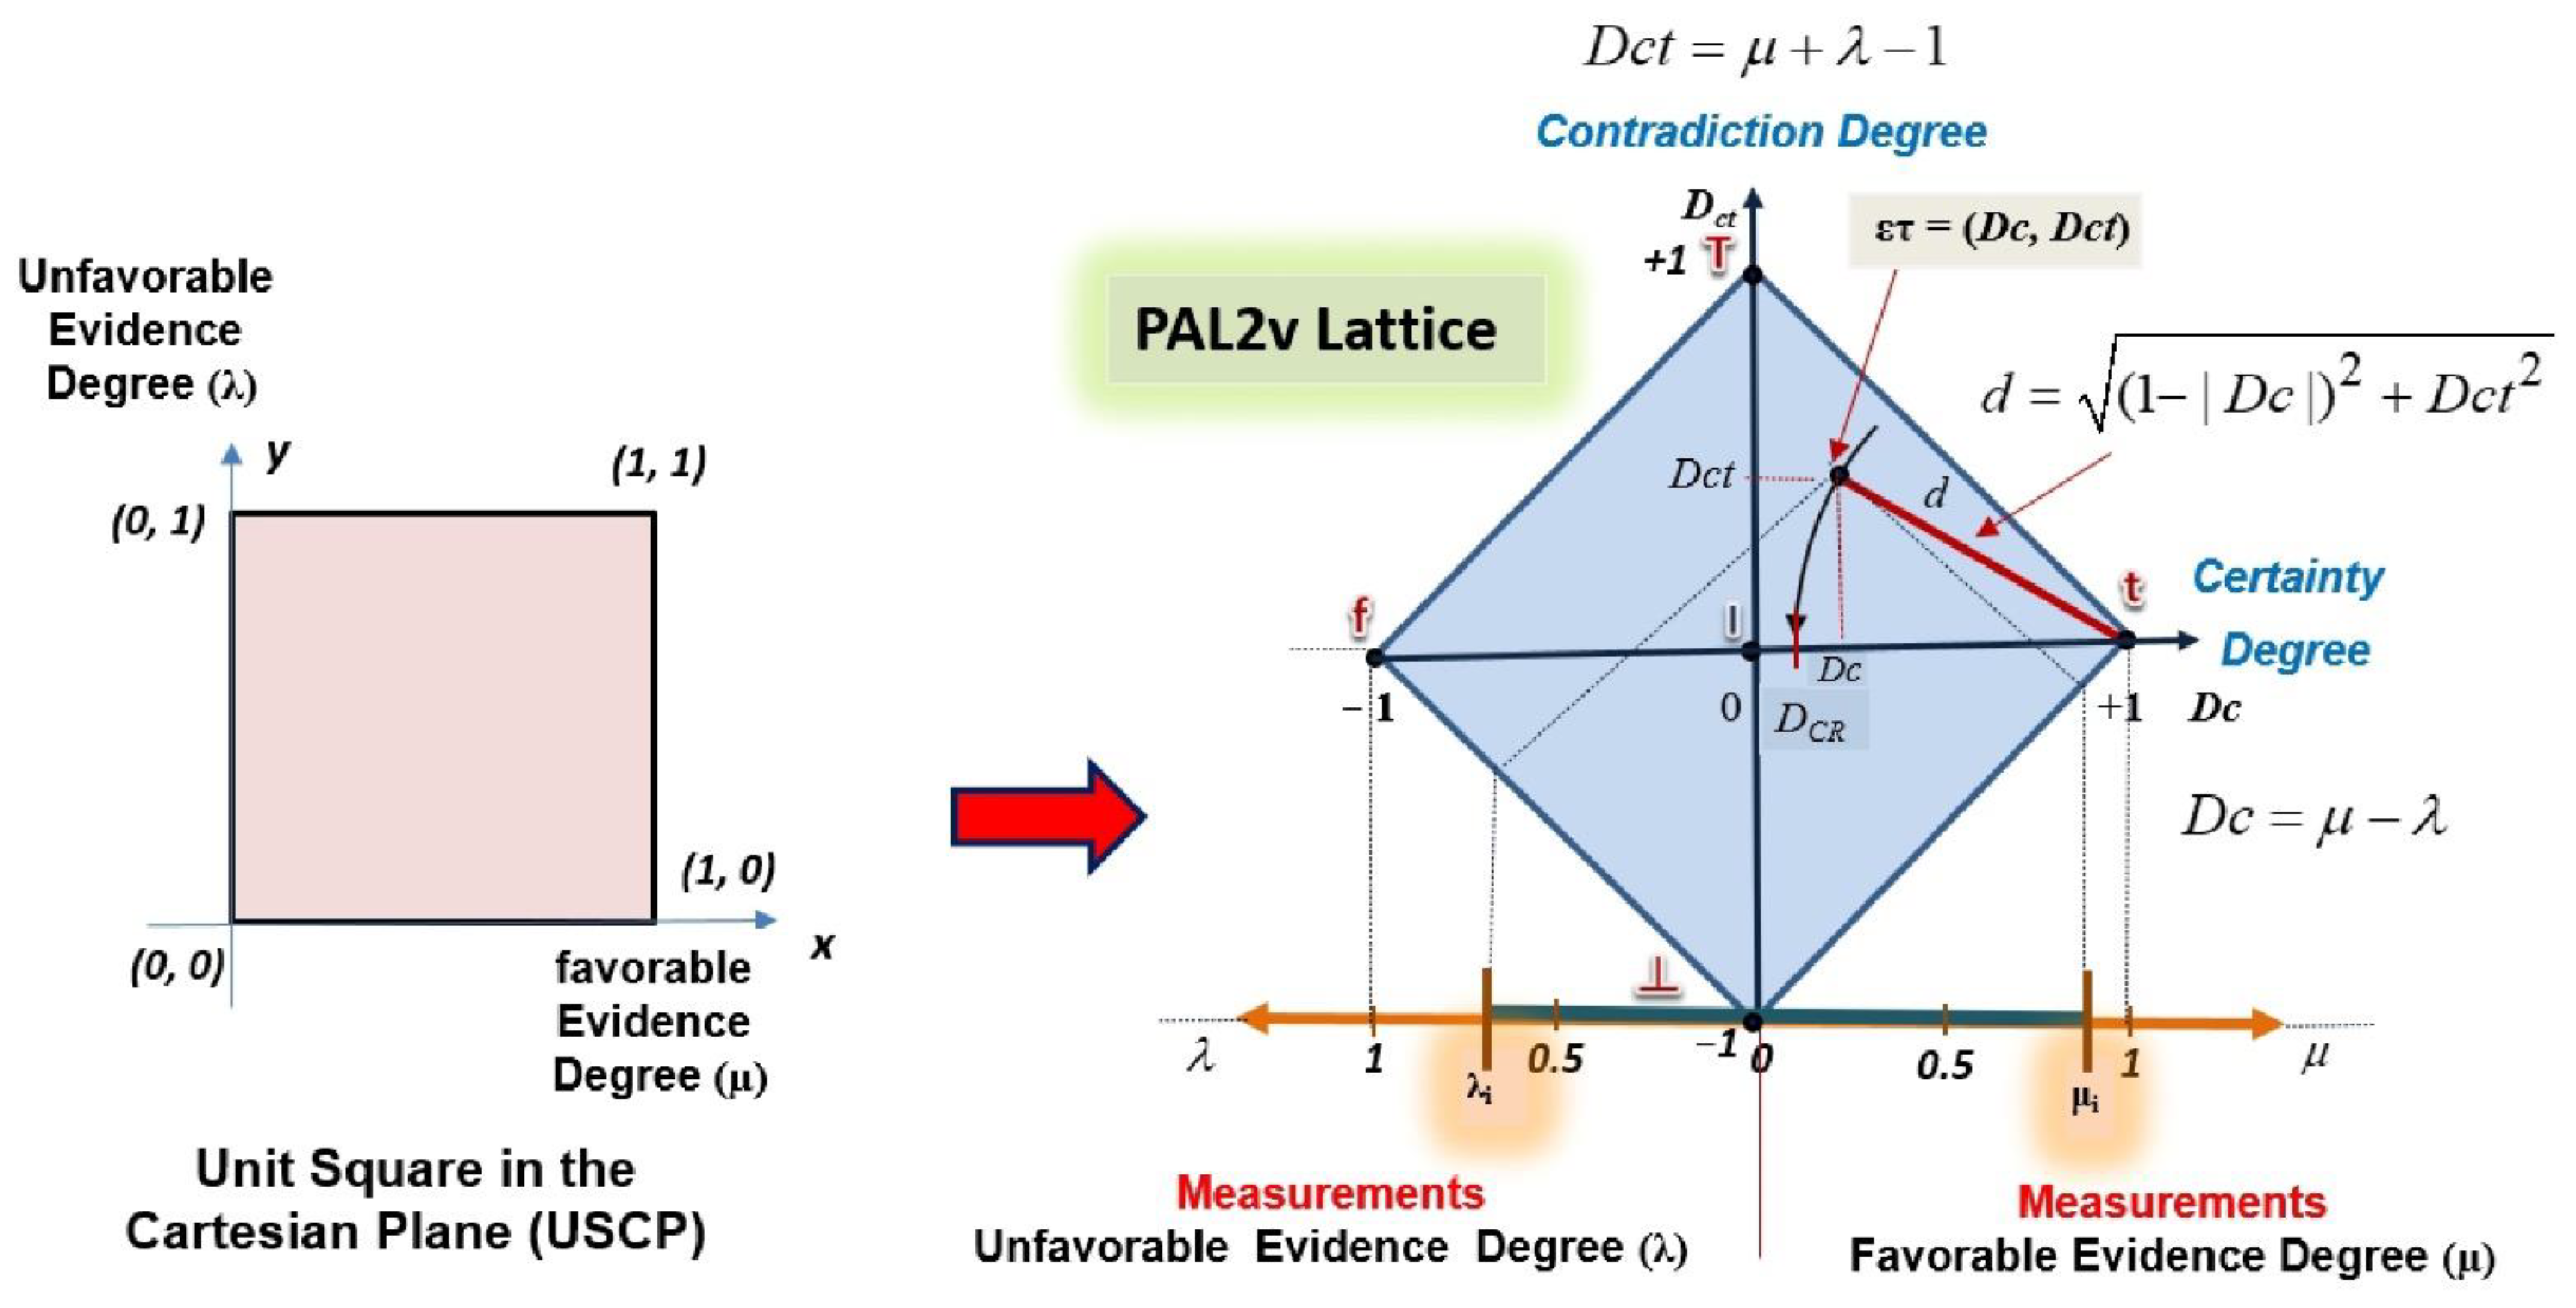
From a lattice of four vertices, it is possible to associate a type of paraconsistent annotated logic in which two evidential values (PAL2v) related to a particular proposition P are considered. By interpreting the evidential values by annotation or normalized degrees of evidence, we can obtain equations involving the logical states represented in the lattice of four vertices (Lattice FOUR). The four extreme logical states represented at the vertices of the lattice are True (t), False (f), Paracomplete or Indetermination (⊥), and Inconsistent (T). See Figure 1 [11]. Thus, the evidential atomic formula of the form P(μ, λ) can be seen as a proposition P with its annotation of two values, where μ, λ ∈ [0,1] (real unity interval) [11,25,26].
The favorable evidence degree (μ) is a value that represents the evidence favorable to the proposition P, and the unfavorable evidence degree (λ) is a value that represents the unfavorable evidence to the proposition P. Thus, the association of a pair (μ, λ) for a proposition P means that the degree of favorable evidence in P is μ and the degree of unfavorable evidence is λ according to the annotations in the lattice [11,27].
The equations of PAL2v are obtained through a transformation, where the degree of favorable evidence (μ) in the y axis and the degree of unfavorable evidence (λ) in the x axis are first plotted in a unit square in the Cartesian plane (USCP). Through three phases, linear transformations allow the degrees of evidence represented in the x and y axes of the USPC to be located on the X and Y axis of a lattice associated with PAL2v. The final transformation is given by
T ( X , Y ) = ( x y , x + y 1 )
Relating the components of the transformation T(X,Y) according to the usual nomenclature of PAL2v (Table 1), where x = μ → degree of favorable evidence, with 0 ≤ μ ≤ 1, and y = λ → degree of unfavorable evidence, with 0 ≤ λ ≤ 1, where the first term obtained in the ordered pair of the transformation equation is X = x y = μ λ →, which is called the degree of certainty (Dc). Therefore, the degree of certainty is obtained by
D c = μ λ
The second term obtained in the ordered pair of the transformation equation is
Y = x + y 1 = μ + λ 1 →, which is called the degree of contradiction (Dct). Therefore, the degree of contradiction is obtained by
D c t = μ + λ 1
As seen in Figure 2, the certainty degree of a real value (DCR) is obtained by determining the distance d (value between the paraconsistent logical state and the extreme logical state True t (or False f)) in the PAL2v lattice [11,27,28,29,30,31,32,33,34]:
d = ( 1 | D c | ) 2 + D c t 2
With distance d, the DCR values are calculated according to the conditions shown below [11,27]:
If DC > 0
D C R = 1 ( 1 | D c | ) 2 + D c t 2
If DC < 0
D C R = ( 1 | D c | ) 2 + D c t 2 1
The resulting evidence degree (μER) is calculated from Equations (5) and (6):
μ E R = D C R + 1 2
We can then build algorithms for the analysis and comparison of signals through paraconsistent logic with the presented equations. This work uses three algorithms: extractor of degrees of evidence, paraconsistent analysis node, and extractor of contradiction effects.
These three algorithms are shown below.

3.1.1. Algorithm for Extracting Degrees of Evidence

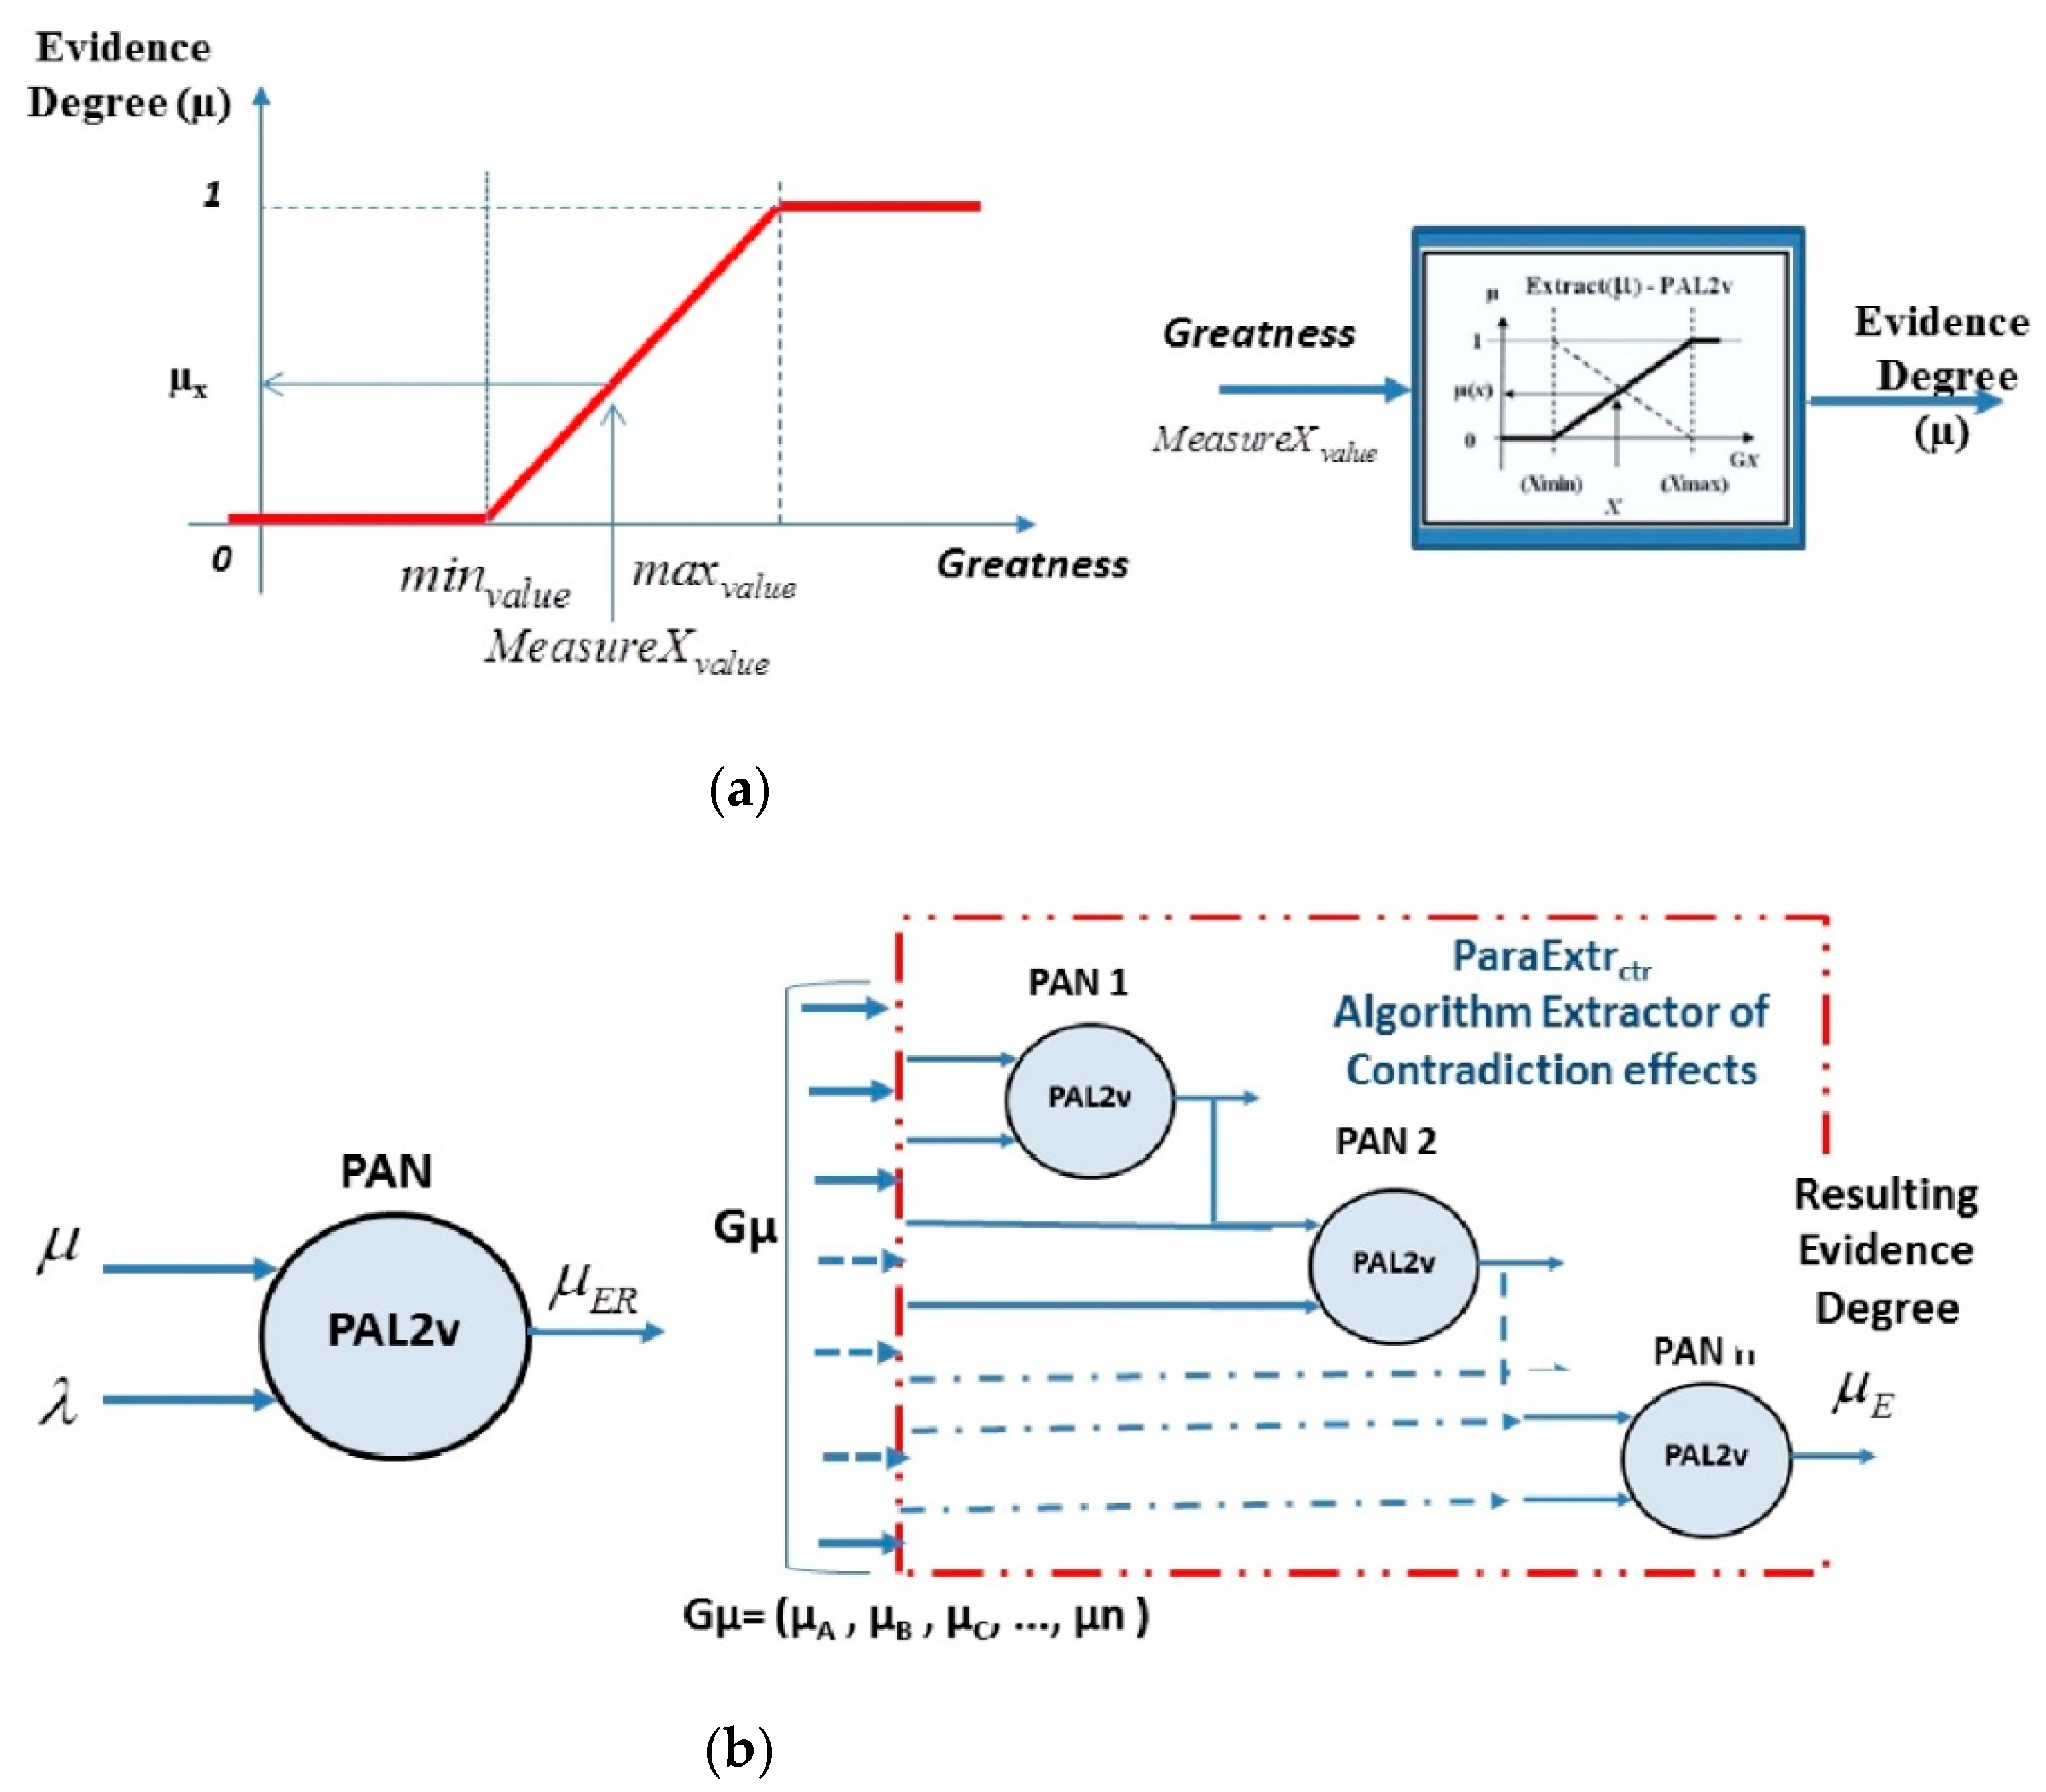
The algorithm for extracting degrees of evidence transforms the values of the measured physical quantities into degrees of evidence evaluated between 0 and 1. The degree of evidence is obtained as follows: The range of interest with the minimum and maximum values of greatness is established, and normalization is made for any measured value of greatness through an equation (for example, the straight-line equation) [27,29].
μ i = { 1   if   M e a s u r e X v a l u e m a x v a l u e     M e a s u r e X v a l u e m i n v a l u e m a x v a l u e m i n v a l u e   if   M e a s u r e X v a l u e [ m i n v a l u e , m a x v a l u e ]   0   if   M e a s u r e X v a l u e m i n v a l u e
The maxvalue and minvalue of Equation (8) are determined by an engineering decision based on the practical experience of the involved team and through technical and theoretical information from operation manuals.
The description of Algorithm 1 for extracting degrees of evidence is given below:
Algorithm 1: Extracting degrees of evidence: ext_deg_of_evid (measure_x_value, min_value, max_value)
  {Reading of measure_x_value, min_value and max_value}
  {Calculation of mi_x}
    If (measure_x_value >= max_value) then
    mi_x ← 1 ;                               { Value equal to 1}
    end_if
    if (measure_x_value <= min_value) then
    mi_x ← 0 ;                               { Value equal to 0}
    end_if
    if (measure_x_value > min_value) && (measure_x_value < max_value) then
    mi_x ← (measure_x_value-min_value)/(max_value-min_value);     { Value between 0 and 1}
    end_if
  {Return to mi_x in the output algorithm}
     return (“mi_x”)
Note: mi_x = evidence degree (µ)
Figure 3a shows the graph in which one can obtain the degree of evidence in the range of interest given by maxvalue and minvalue from a measurement of greatness (measure Xvalue), being in this case the equation of a straight line [27,29,33].

3.1.2. Paraconsistent Analysis Node (PAN) Algorithm

The paraconsistent analysis node (PAN) algorithm receives two information signals represented by degrees of evidence and presents a single value of the resulting degree of evidence as a final result.
The resulting evidence degree from the output is a value that expresses a representation of the analysis where the effect of the contradiction between the two values applied in its inputs is null [11,31,32,33,34].
In a PAN’s construction, the equations of PAL2v are used, and its structure is considered to be the minimum cell of analysis of a paraconsistent system of treatment of uncertainties.
The description of a PAN (Algorithm 2) is given below [11,29,33].
Algorithm 2: Paraconsistent analysis node (PAN): input: (mi, lambda), output: mi_er
  { Reading of the “mi” and “lambda” }
   { Initial Calculations }
      {Calculation of the contradiction degree }
      dg_dct ←(mi + lambda)−1;                   { contradiction degree value}
      { Calculation of the uncertaity degree }
      dg_dc ← mi–lambda;                    { uncertainty degree value }
      { Calculation of the d distance }
      d ← sqrt((1−| dg_dc|)^2 + (dg_dct)^2);                 { distance value }
      { Determination of the Real certainty degree }
      if (dg_dc >= 0) then
      dg_cr ← (1−d) ;                      { Real certainty degree value }
      end_if
      if (dg_dc < 0) then
      dg_cr ← (d−1) ;                      { Real certainty degree value }
      end_if
  { Determination of the Resulting evidence degree }
      mi_er ← (dg_cr + 1)/2;                   { Resulting evidence degree value}
      end_if
  {Return of the Resulting evidence degree in the output algorithm }
   return (“mi_er”)
return (“mi_x”)
Note: mi_x = favorable evidence degree (µ); lambda = unfavorable evidence degree (λ); dg_dct = contradiction degree (Dct); dg_dc = certainty degree (Dc); dg_cr = certainty degree of a real value (DCR); mi_er = resulting evidence degree (μER).
A PAN can be used in several fields of knowledge where incomplete and contradictory information receives adequate treatment through the PAL2v equations, resulting in a single value without the effect of contradiction.
The symbols of the PAN algorithm are shown in Figure 3b.
PANs are interconnected, forming a network-denominated paraconsistent analysis network (PANnet) [11,30]. These equations and algorithms of a PANnet act in the comparisons and analysis of values that represent information, even though these values come from contradictory information.
In this work, the analysis is performed under several conditions of the routing system and simultaneous modes and paraconsistent analysis. We use a network (PANnet) composed of four PANs.

3.1.3. Algorithm for Extraction of Contradiction Effects

The extractor of contradiction effects (ParaExtrctr) algorithm consists of a network of PANs that works through iterations [30,33]. With its recurrent operation, the algorithm is enabled to gradually remove the results or effects of the contradiction in groups of information signals. This algorithm uses a group of information signals represented by a set of degrees of evidence () with respect to a particular proposition P. In a recurring way, the algorithm thus performs paraconsistent verification through the PAN in its values and gradually withdraws the results of the effect of contradiction until there is only one single degree of evidence as output. The final degree of evidence µE is considered the representative value of the group and free from the effects of the contradiction [30,33].
The description of ParaExtrctr (Algorithm 3) is given below.
Algorithm 3: Extractor of contradiction effects: input: (vector_mi[mi_1, ..., mi_n ], n), output: mi_er_final
{Vector reading with “mi_1” to “mi_n, that is, n degrees of evidence at the input of the algorithm; Reading the n value}
{Algorithm Initial Calculations}
   index_mi_max ← 0;
   index_mi_min ← 0;
   mi_parcial ← 0;
   lambda_parcial ← 0;
   mi_er_final ← 0;
   mi_er_parcial ← 0;
   busy ← 0;
   For i = 1:(n−1) do
      {Reset control variable references}
      mi_max ← 0;
      mi_min ← 1000;
      busy ← 0;
      for j = 1:n do
         if ((vector_mi[j] > mi_max) && (vector_mi[j] ~= −1)) then
           mi_max ← vector_mi[j];                { highest mi value of mi_vector }
           index_ mi_max ←j;
         end_if
         if ((vector_mi[j] < mi_min) && (vector_mi[j] ~= −1)) then
           mi_min ← vetor_mi[j];                { smallest mi value of mi_vector }
           index_ mi_min ←j;
         end_if
      end_for
      { Deleting mi_min and mi_max from vector_mi }
      vetor_mi[index_ mi_min]← −1;
      vetor_mi[index_ mi_max]← −1;
      { Calculation of mi_resulting }
      mi_parcial ← mi_max;                   { Value from mi_partial to mi_max }
      { Calculation of lambda__resulting}
      lambda_parcial ← 1-mi_min;                {value from partial_lambda to mi_min}
      { Determination of mi_er_resulting }
      mi_er_parcial = PAN (mi_parcial, lambda_parcial);       {Value of mi_er_partial for mi_min and mi_max}
      for k = 1:n do
      if ((vector_mi[k] == −1) && (busy == 0)) then
         vector_mi[k] ← mi_er_parcial;            {Insertion of mi_er_partial in vector_mi}
         busy ← 1;
      end_if
      end_for
      if i = (n−1) then
      mi_er_final ← mi_er_partial;                 {Value of mi_re_final}
      end_if
    end_for
   { Return of the resulting evidence degree from the output algorithm }
   return (“mi_er_final”);
Note: (vector_mi[mi_1, ..., mi_n ], n) = set of evidence degrees (Gµ); mi_er_final = final evidence degree (µE).
Figure 3b shows a representation of the ParaExtrctr symbol.

3.1.4. Complexity of Paraconsistent Algorithms

The paraconsistent algorithms, when interconnected, compose a data analysis network in which the main algorithm is ParaExtrctr, whose kernel is the paraconsistent analysis node (PAN) algorithm. The structure of the algorithms used in this work is based on a topology that allows representing a variety of situations, with the possibility of also representing clusters, with different semantic natures. Structural metrics are based on properties of program flowchart templates, with attention on the complexity of control flow and data flow. In general, for the verification of complexity, McCabe’s cyclomatic complexity [35,36] technique can be used, which is defined as
V ( G ) = e n + 2 p
where V ( G ) is the cyclomatic complexity, e is the number of links in the flow graph, n is the number of nodes in the flow graph, and p is the number of disconnected parts of the flow graph.
As described in [35], the complexity of several graphs considered together is equal to the sum of the individual complexities of those graphs. The structure of the ParaExtrctr algorithm aims to implement computational language source code programs for an optimal number of cyclomatic complexities around values lower than 10. In [37], the complexity of the ParaExtrctr algorithm was calculated using McCabe’s cyclomatic analysis technique, where the network topology resulted in V(G) = 5. This value demonstrates that the paraconsistent algorithmic structure with the topology used in this research is of low complexity.

3.1.5. Overview of a Routing Management System (RMS) with Paraconsistent Algorithms

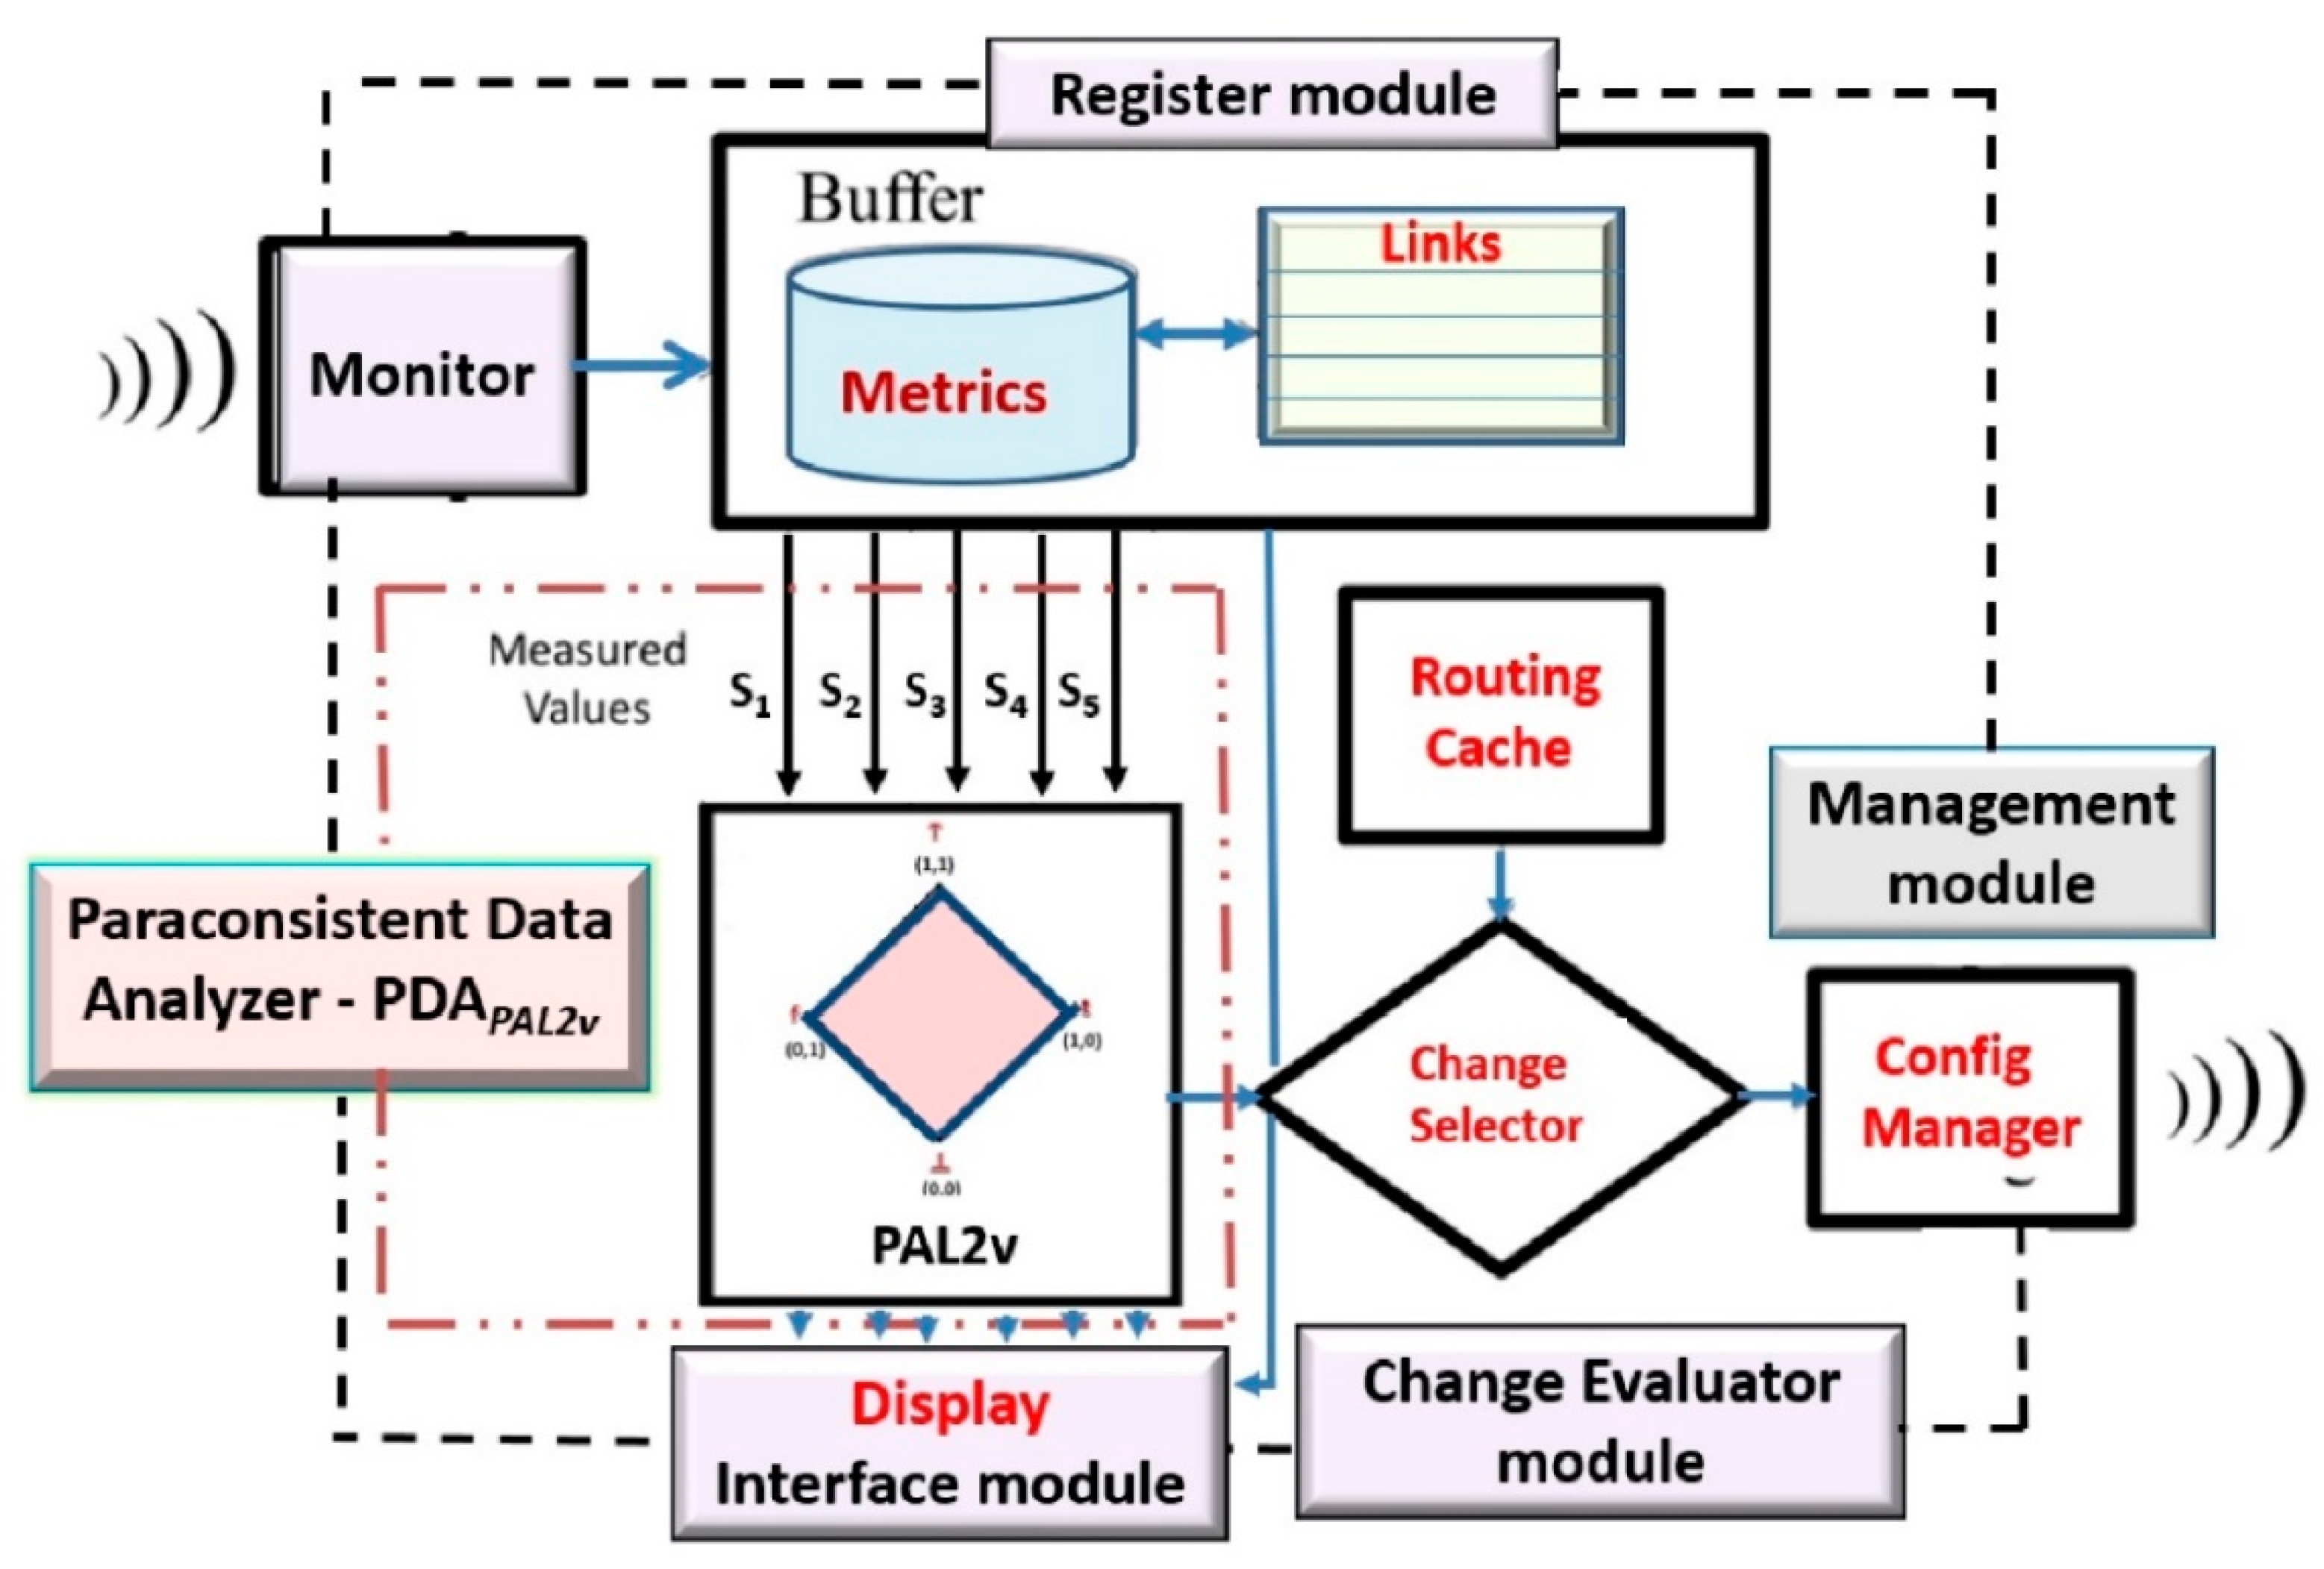
A computational paraconsistent data analysis system for routing management can be developed in communication networks. An overview of a routing management system (RMS) that uses paraconsistent algorithms for routing management in a communication network can be seen in Figure 4, where the data flows and their main modules are presented.
The component modules of the data analysis system shown in Figure 4 are (a) a component called Monitor, used to collect the information of the network interconnection equipment; (b) a Register module, where metrics and other information of the communication links are stored to serve as inputs to the next component as sources of information; (c) a Paraconsistent Data Analyzer (PDAPAL2v) module with the function of analyzing the input information and providing as output the information that defines whether to change the route of the traffic to another link with better quality among those available in the memory cache of routes; (d) a Change Evaluator module, which, based on the information received from the Paraconsistent Analysis block, chooses whether there is another available route within the evaluated routes and, in the case of non-evidence of degradation, sends the information to the management module; (e) a Management module, whose function is to send the information to change the route to the interconnection equipment; and (f) an Interface module, whose function is to provide information about the process and allow human–machine interaction through a computer screen.
In this paper, we present the method of using paraconsistent algorithms in data treatments for routing management. Therefore, the description focuses on the Paraconsistent Data Analyzer (PDA-PAL2v) module.

4. Materials and Methods

In the paraconsistent data analyzer (PDAPAL2v), the input signals receive logical treatment by the algorithms originated from the fundamentals of the paraconsistent annotated logic. In the information sources, these paraconsistent algorithms perform the acquisition and normalization of values, which are transformed into degrees of evidence.

4.1. Information Sources for Paraconsistent Data

The information sources used to extract the degrees of evidence are related to the following characteristics:
(a)
Communication route latency time (RTT)
(b)
Packet loss (PEP)
(c)
Variation in transmission delay (jitter-SD)
(d)
Variation in reception delay (jitter-DS)
(e)
Processing consumption (CPU) in a database originated from the real-time collection of signals obtained by the sensors of the interconnection equipment
Therefore, the input signals for the paraconsistent analyses are extracted from these five categories of information sources that show the quality level of the analyzed route.

4.2. Paraconsistent Data Analyzer (PDAPAL2v)

The paraconsistent data analyzer (PDAPAL2v) configuration is shown in Figure 5.
The initial data treatment is done by a paraconsistent analysis network (PANnet) composed of four interconnected PANs. First, the PANnet analyzes the five categories of signals that serve as metrics for decision making on the best route. These measuring values go through a normalization process that transforms them into degrees of evidence (μE) and then are treated using the PAL2v algorithms. After an N sequence of initial analysis of the evidence signals by the PANnet, the resulting initial signals (PoμE) of each sequence are sent to the extractor of contradiction effects algorithm, where they receive the second treatment, resulting in a single value (PoμER) representative of the evidence sampled in the inputs.
The auxiliary module, called Reading Interval, is installed between the PANnet and the extractor of contradiction effects algorithm to control the quantity (N sequence) of degrees of evidence to make up the group that the algorithm analyzes.

4.2.1. PANet Configuration

The configuration of the paraconsistent analysis network (PANnet) used in PDAPAL2v follows some criteria were each measurement characterizes the achievement of the favorable evidence degree of each greatness, according to partial propositions and an objective proposition. Therefore, the PANnet, as shown in Figure 5, has four PANs that work as follows:
For PAN P1 that responds to the proposition “There is variation of transmission delay”, two sources of information are used as degrees of evidence:
  • − Jitter source/destination (JITTER-SD): μ1 = favorable evidence
  • − Jitter destination/source (JITTER-DS): μ2 = unfavorable evidence
For PAN P2 that responds to the proposition “There is controllable degradation factor,” two sources of information are used as degrees of evidence:
  • − Round-trip time (RTT-Avg): μ3 = favorable evidence
  • − Busy CPU processing consumption (CPU-Busy1min): μ4 = unfavorable evidence
For PAN P3 that responds to the proposition “There is a factor of non-controllable degradation,” two sources of information are used as degrees of evidence:
  • − Real resulting evidence degree obtained in PAN P1μ5 = favorable evidence μErP1
  • − PEP-packet loss ratio (PEP-Ratio): μ6 = unfavorable evidence
For PAN Po that responds to the objective proposition “There is degradation of the link,” two sources of information are used as degrees of favorable evidence:
  • − Real resulting evidence degree obtained in PAN P3: μ7 = favorable evidence μErP3
  • − Real resulting evidence degree obtained in PAN P2: μ8 = unfavorable evidence μErP2
The (Po μE) outputs of this PAN Po in a group of 10 values are analyzed by the extractor of contradiction effects (ParaExtrctr) algorithm, resulting in the output (Po μER).

4.2.2. PDAPAL2v Operation

After the acquisition of measurements from information sources, the operation of the paraconsistent data analyzer (PDAPAL2v) consists of basically three steps of processing the data to be executed: (a) normalization, (b) initial paraconsistent logical treatment, and (c) rxtraction of contradiction effects.
These three steps are described below.
(a)
Normalization
Normalization is done through the evidence degree extractor algorithm. In this first step, the signals in their original metric units enter in a modeling process, which begins with the selection of an interval of interest or discourse universe. Next, they are normalized in a linear format following the limits for each information source by modeling their values within a closed interval [0, 1] belonging to the set of real numbers, which represent degrees of evidence μE for PAL2v. In this way, the degree of evidence for a linear upward variation is found.
(b)
Initial Paraconsistent Logical Treatment
This procedure consists of applying the favorable evidence degrees at the paraconsistent analysis network (PANnet) for an initial paraconsistent logical treatment.
The results obtained in this phase are stored momentarily until the system completes N measurements in the information sources. For this project, it was decided that the analysis would only be performed after completing a group of 10 readings. This amount of reading from the sensors was set to provide better veracity of the analysis, eliminating possible discrepancies or more inconsistencies caused by readings made at the instant of momentary instability of the route or of occasional events of concurrent traffic bursts in the links.
(c)
Extraction of contradiction effects
In this step, the signals represented by degrees of evidence resulting from the PANnet are counted by the Reading Interval module, forming a group of N = 10 values. This group of values is sent to the extractor of contradiction effects (ParaExtrctr) algorithm to receive the final logical treatment. Therefore, globally, this block receives a group of signals and, independently of other external information, performs a paraconsistent analysis on its values by subtracting, through the recurrence that happens in the algorithm, the effects caused by the contradiction.
The result presented in the output is a single degree of evidence related to the objective proposition (Po). In PDAPAL2v, this final value is referred to as the objective proposition Po “There is degradation of the link,” and it is extracted and evaluated to cover every communication arc that composes the route between the communicator points through which the information packets must pass. Therefore, it is calculated in each route, which promotes conditions that, through its values, the routing management system (RMS) chooses the best link and routes of the signal flow among the paths available in the system.

4.2.3. Comparison and Decision Making

According to the analyzed proposition Po “There is degradation of the link,” when the resulting evidence degree is equal to 1, it denotes that the evidence analyzed and represented by the partial propositions is confirming the objective proposition Po. If the value of the resulting evidence degree distances from 1 and approaches 0.5, consequently, from the undetermined state, it means that the information is bringing evidence that weakens the statement to the proposition Po. Under these conditions, the analysis indicates that some parameters are violated despite the communication route being functional and with traffic.
An investigation in the PANs about the values of the degrees of evidence of the partial propositions allows a validation of the possible origin of the violation of the parameters and the contradictions that are provoking this decrease in the resulting evidence degree objective proposition Po. When the final resulting evidence degree (resulting final signal PoμER) advances the undetermined value of 0.5 and approaches 0, the information that leads the evidence to the analysis on the partial propositions (resulting initial signal PoμE) indicates a more significant challenge to the objective proposition. Therefore, the evidence of degradation factors related to the current configuration of the routing management system (RMS) and restrictions suggests approaching a situation of an optimized state of the communication route.
A check in the evidence degrees (PoμE) of the analysis of the partial information enables the implementation of better action to decrease the evidence degree (PoμER) of the objective proposition and bring it close to the minimum zero value. Therefore, as a consequence, the routing management system (RMS) returns to the normality finding of optimal quality for the communication route under analysis.

4.2.4. PDAPAL2v Interface and Architecture of a Data Network

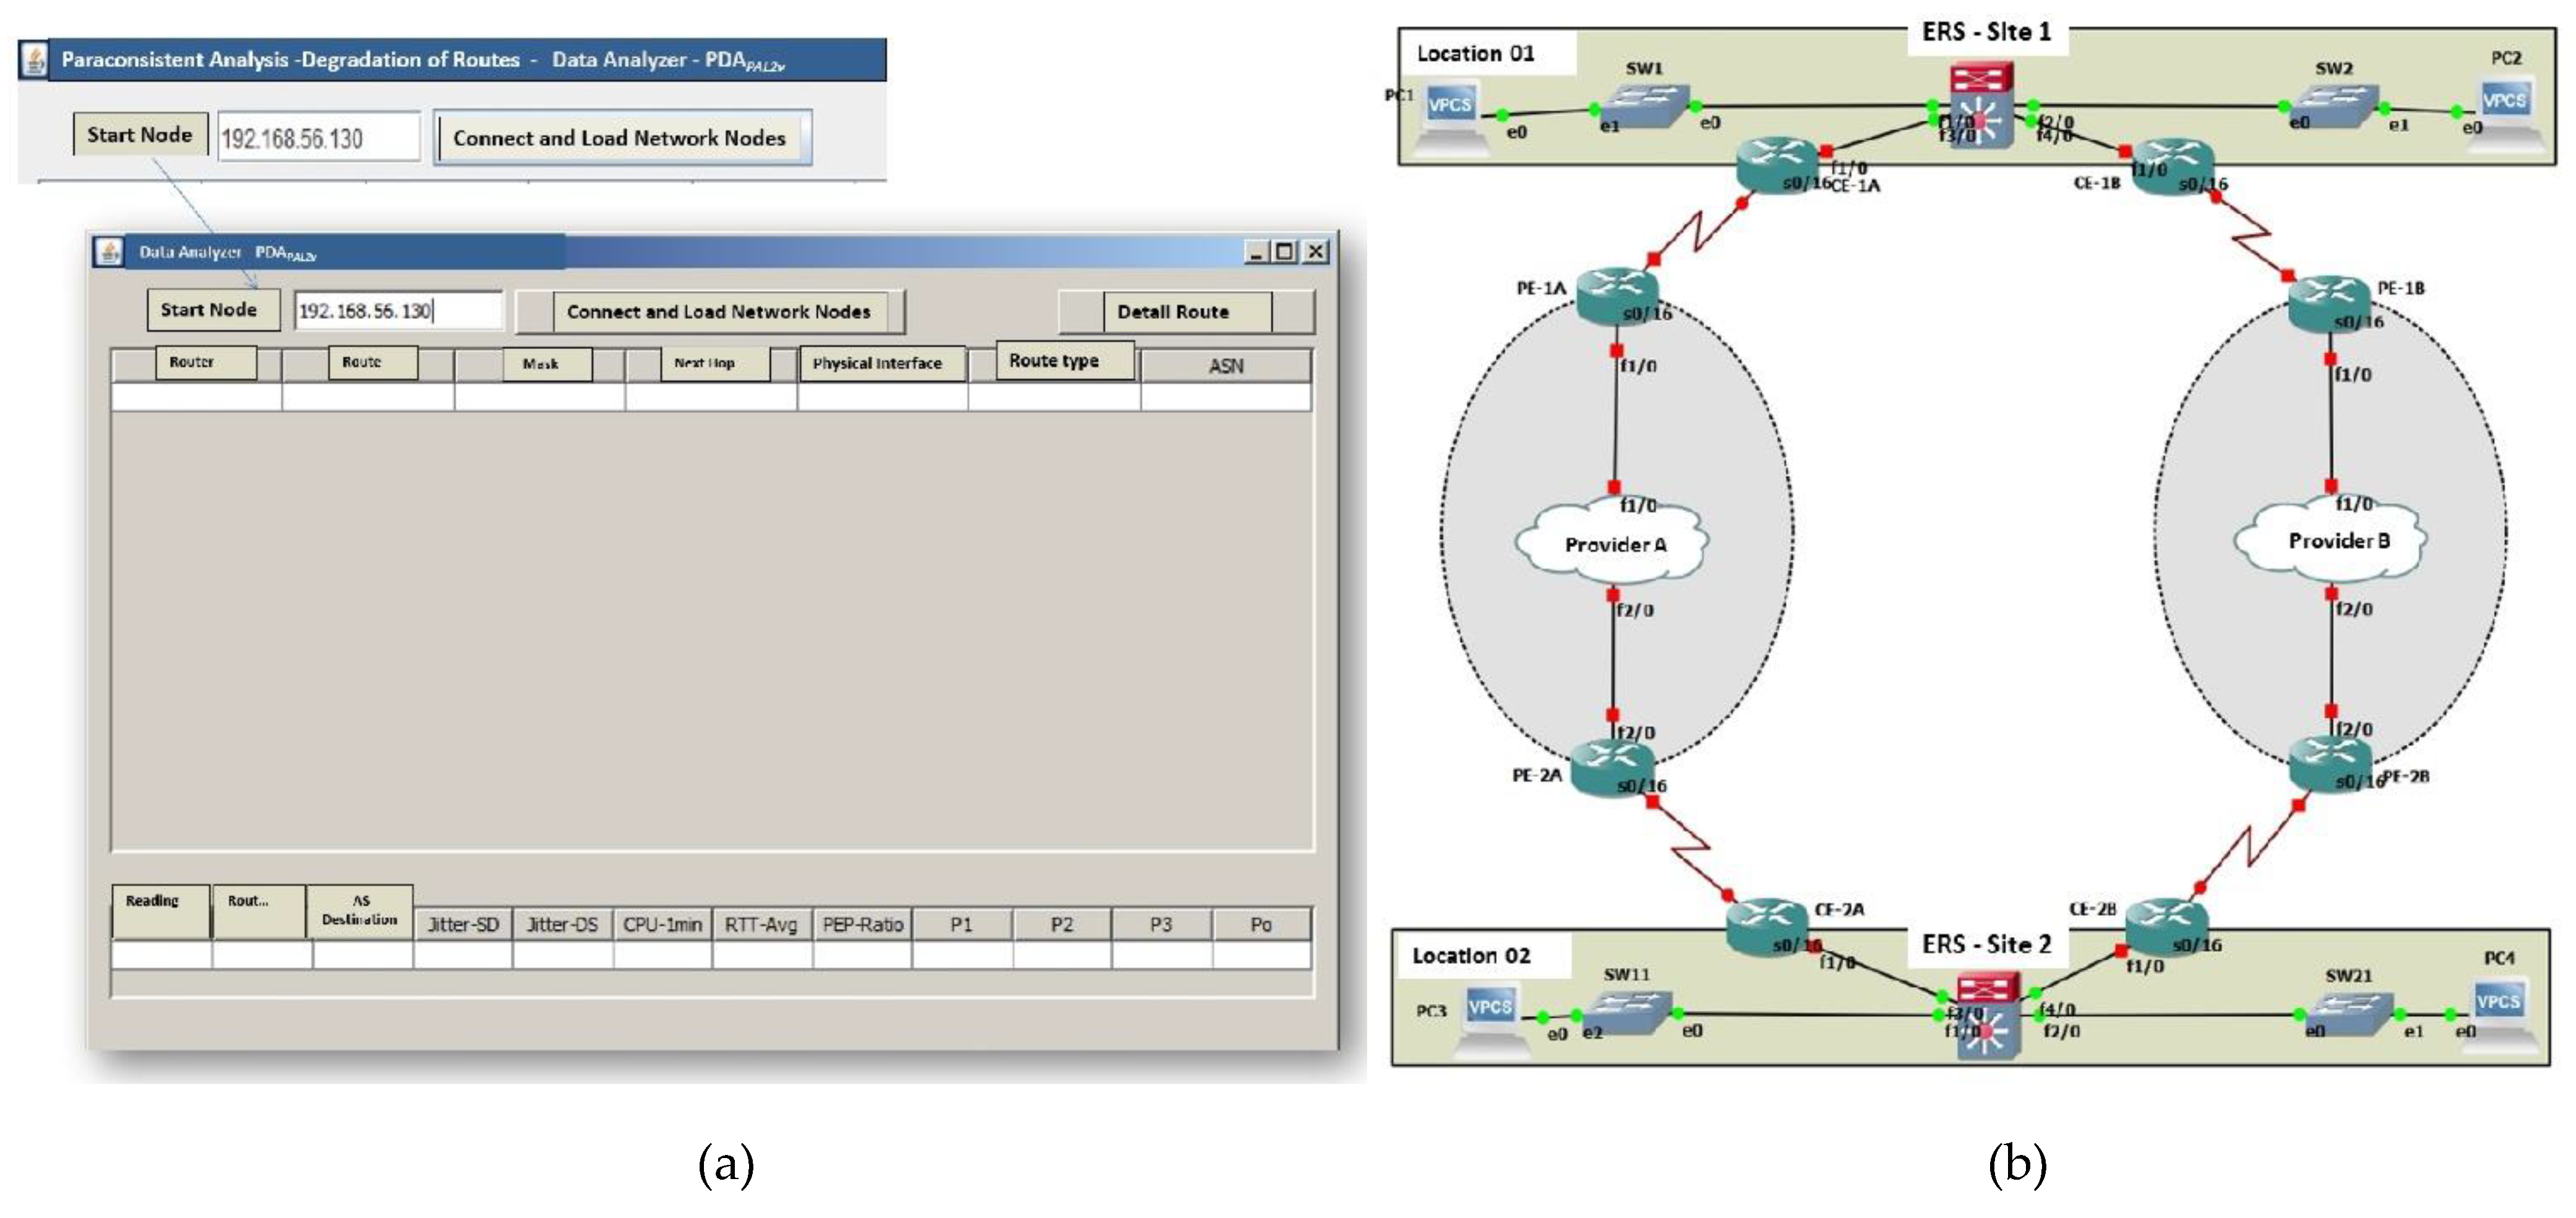
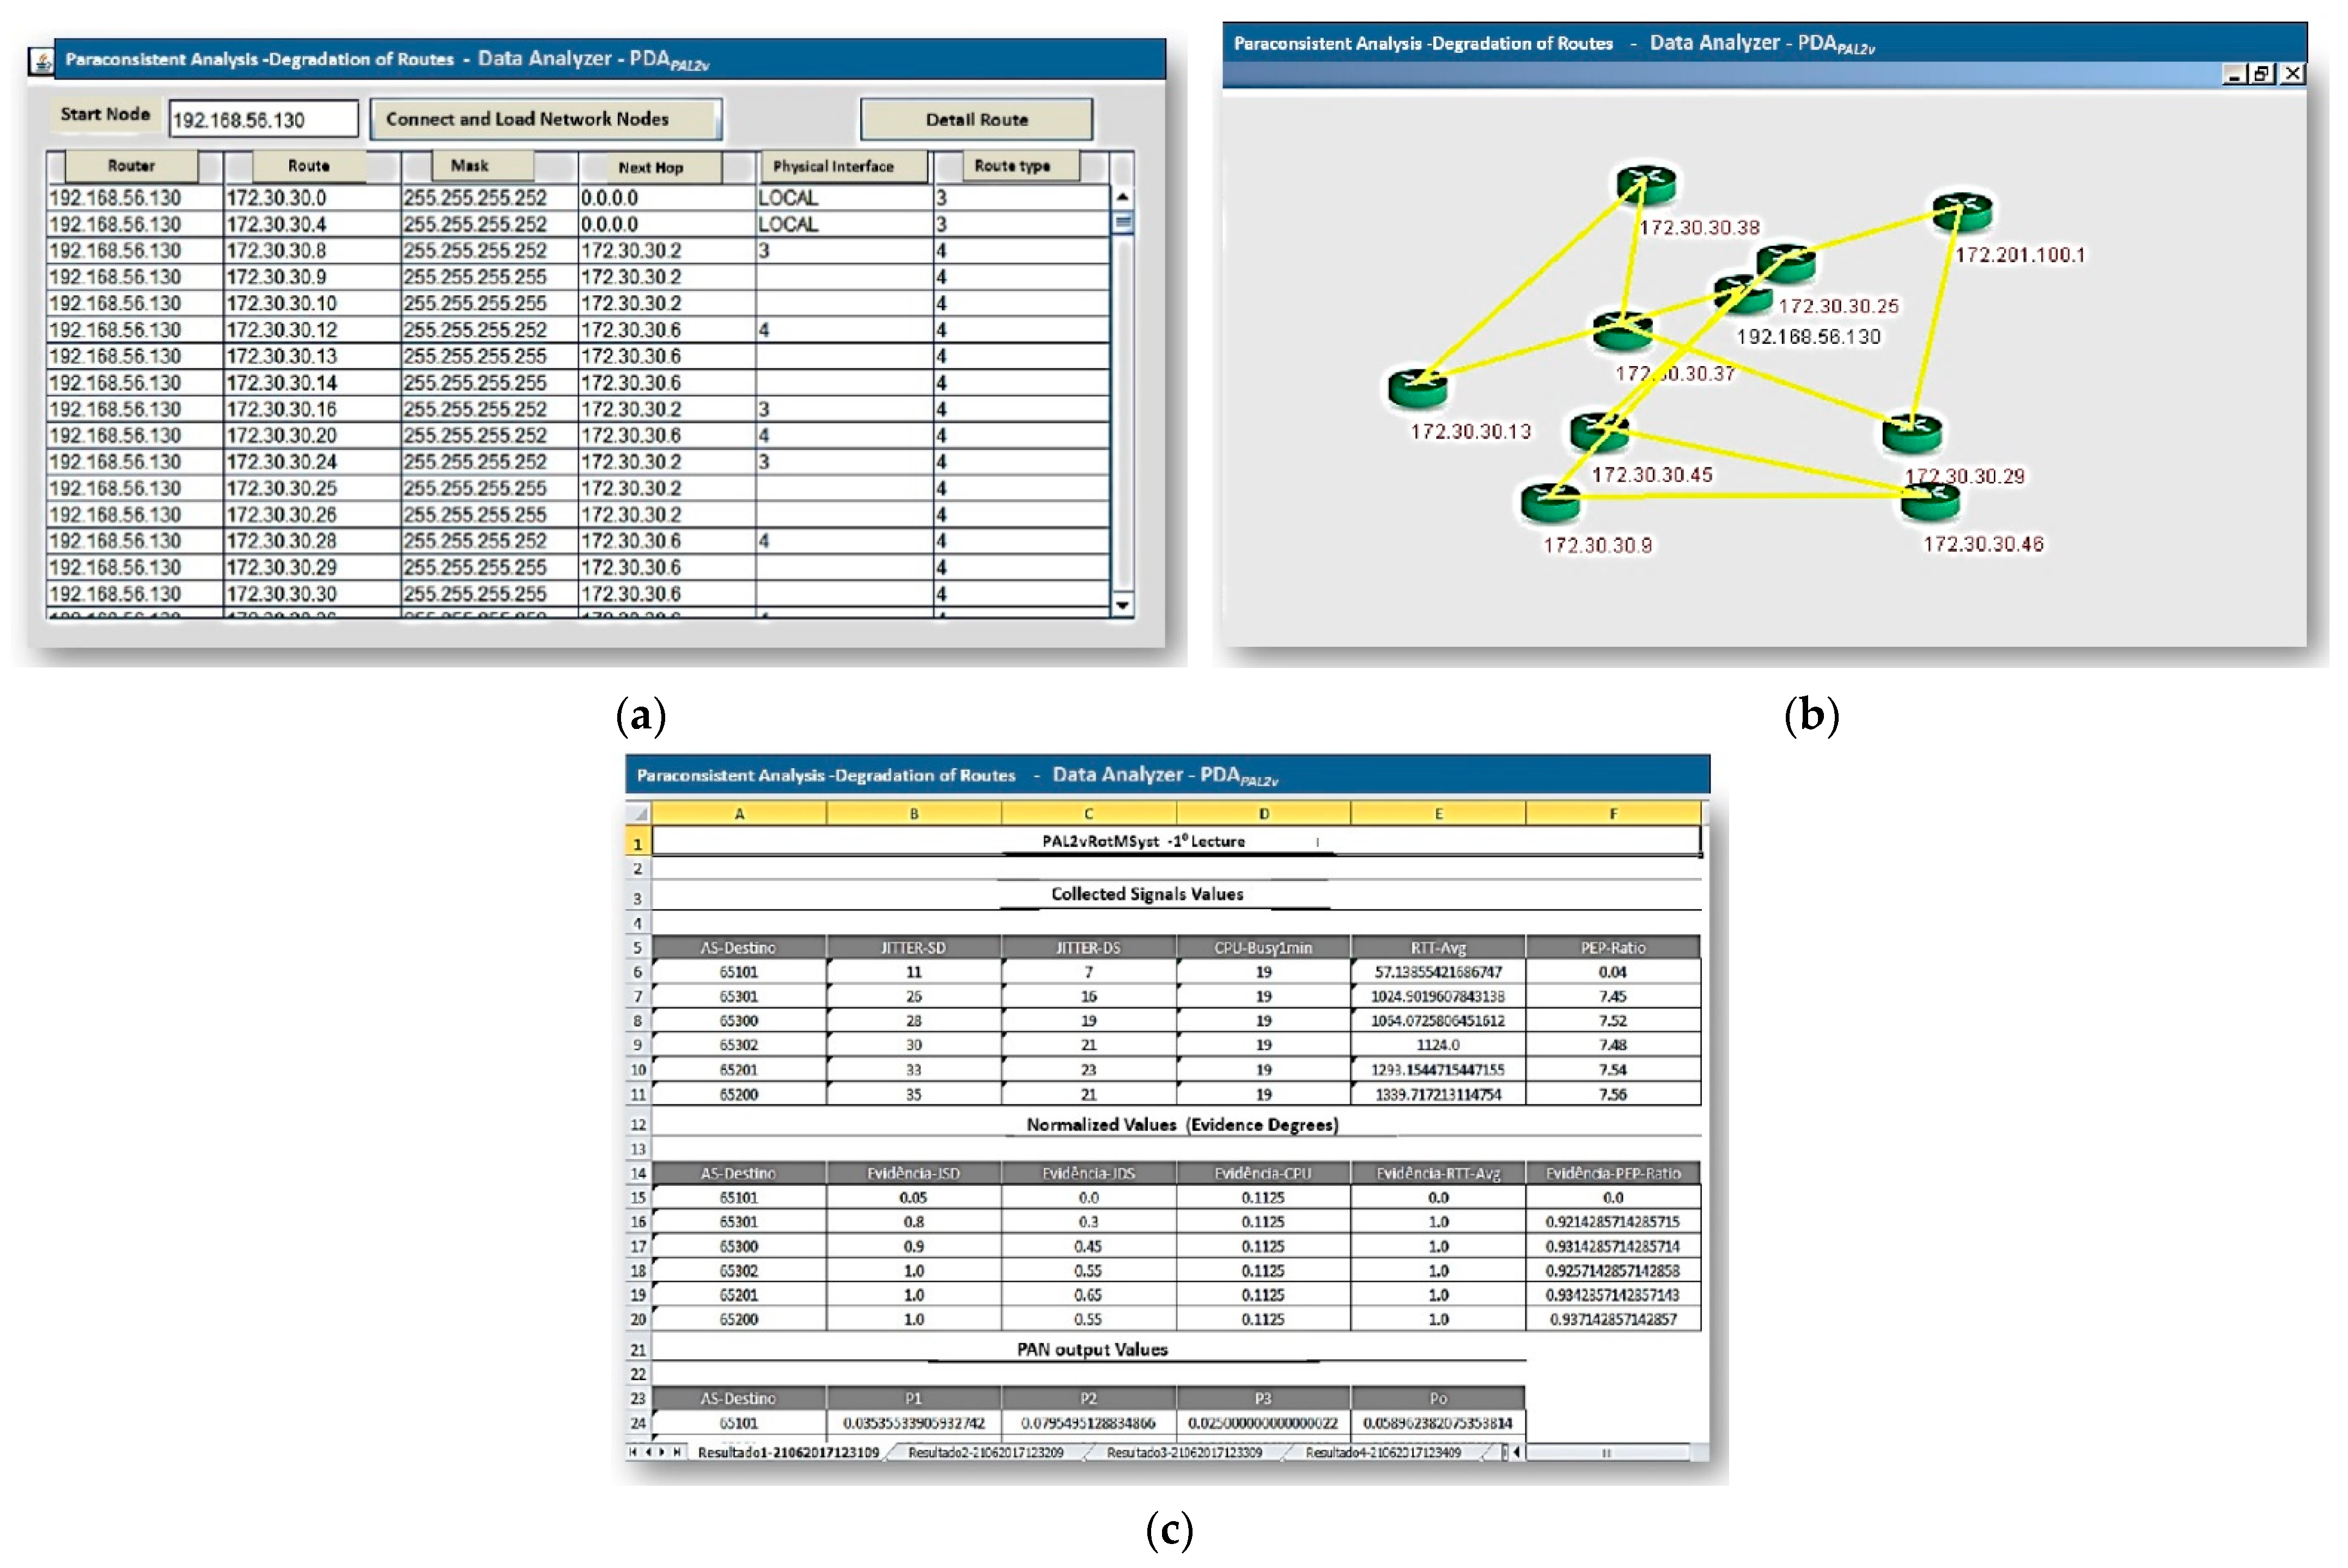
In this research, to test the operation and validate the system’s efficiency, an interface of PDAPAL2v was developed in its first version, using the Java programming language and Netbeans IDE 8.2 software. The initial screen of the PDAPAL2vversion 1 interface is shown in Figure 6a.
The user writes in the initial screen the network address of the equipment from which the network structure search (initial node) starts. The system uses this address (Internet Protocol (IP)) to obtain information on the connection structure between the equipment.
For the testing and validation of PDAPAL2v, a data network architecture was considered typical of the distribution between different locations, as shown in Figure 6b.
This architecture was used to serve as the primary data source in the tests of PDAPAL2v. For the data collection function that fed the Monitor module of the proposed system, read accesses with Simple Network Management Protocol (SNMP) were used for packet loss information, jitter, CPU consumption, and latency. Each collection was run at 1 min intervals, and the collection frequency was defined, taking into account that CPU consumption (one of the sources of information) has its reading via SNMP limited to a minimum of 1 min. From this information, the IP SLA operation was used in the data network standard equipment to verify the metrics between two different autonomous systems.
The structural metrics values from information sources used in the normalization process and for generating degrees of evidence for analysis of the PDAPAL2v interface have the following references:
(a)
Jitter (destination/source) signal (JITTER-DS): minimum = 10 ms and maximum = 30 ms
(b)
Jitter (source/destination) signal (JITTER-SD): minimum = 10 ms and maximum = 30 ms
(c)
Packet loss signal (PEP-Ratio): minimum = <1% and maximum = 8%
(d)
Round-trip time signal (RTT-Avg): minimum = 160 ms and maximum = 680 ms
(e)
CPU usage signal (CPU-Busy1min): minimum = 10% and maximum = 90%
These values (maxvalue, minvalue) of the previous references are applied in the algorithms of extractors of degrees of evidence (Equation (8)) to construct the interval of interest of each information source.
After completing this step, the normalization of the values of the readings of the equipment through modeling with linear variation and directly proportional to the measured quantity was adopted, resulting in a normalized value between 0 and 1, that is, the degree of evidence obtained from the source of information.
The data packets used in these analyses are composed of 10 readings, and once the Monitor module is activated, the collection starts simultaneously. At each interval of 1 min, the information is captured on the equipment and inserted into the database.

4.2.5. Comparative Tests with Conventional Algorithm

Initially, comparative tests were developed between the PDAPAL2v computational structure and a conventional algorithm built with classical logic.
The conventional algorithm uses the binary AND/OR logical gates instead of PANs, and for comparative tests, the same threshold values were used for the information sources and for the decision making about sending or not sending the analyzed package.
The database of information sources used in PDAPAL2v was used in the direct comparison tests, and furthermore, for every 10 analyses performed by the conventional algorithm, the average of the results was considered.

4.2.6. Functional Tests

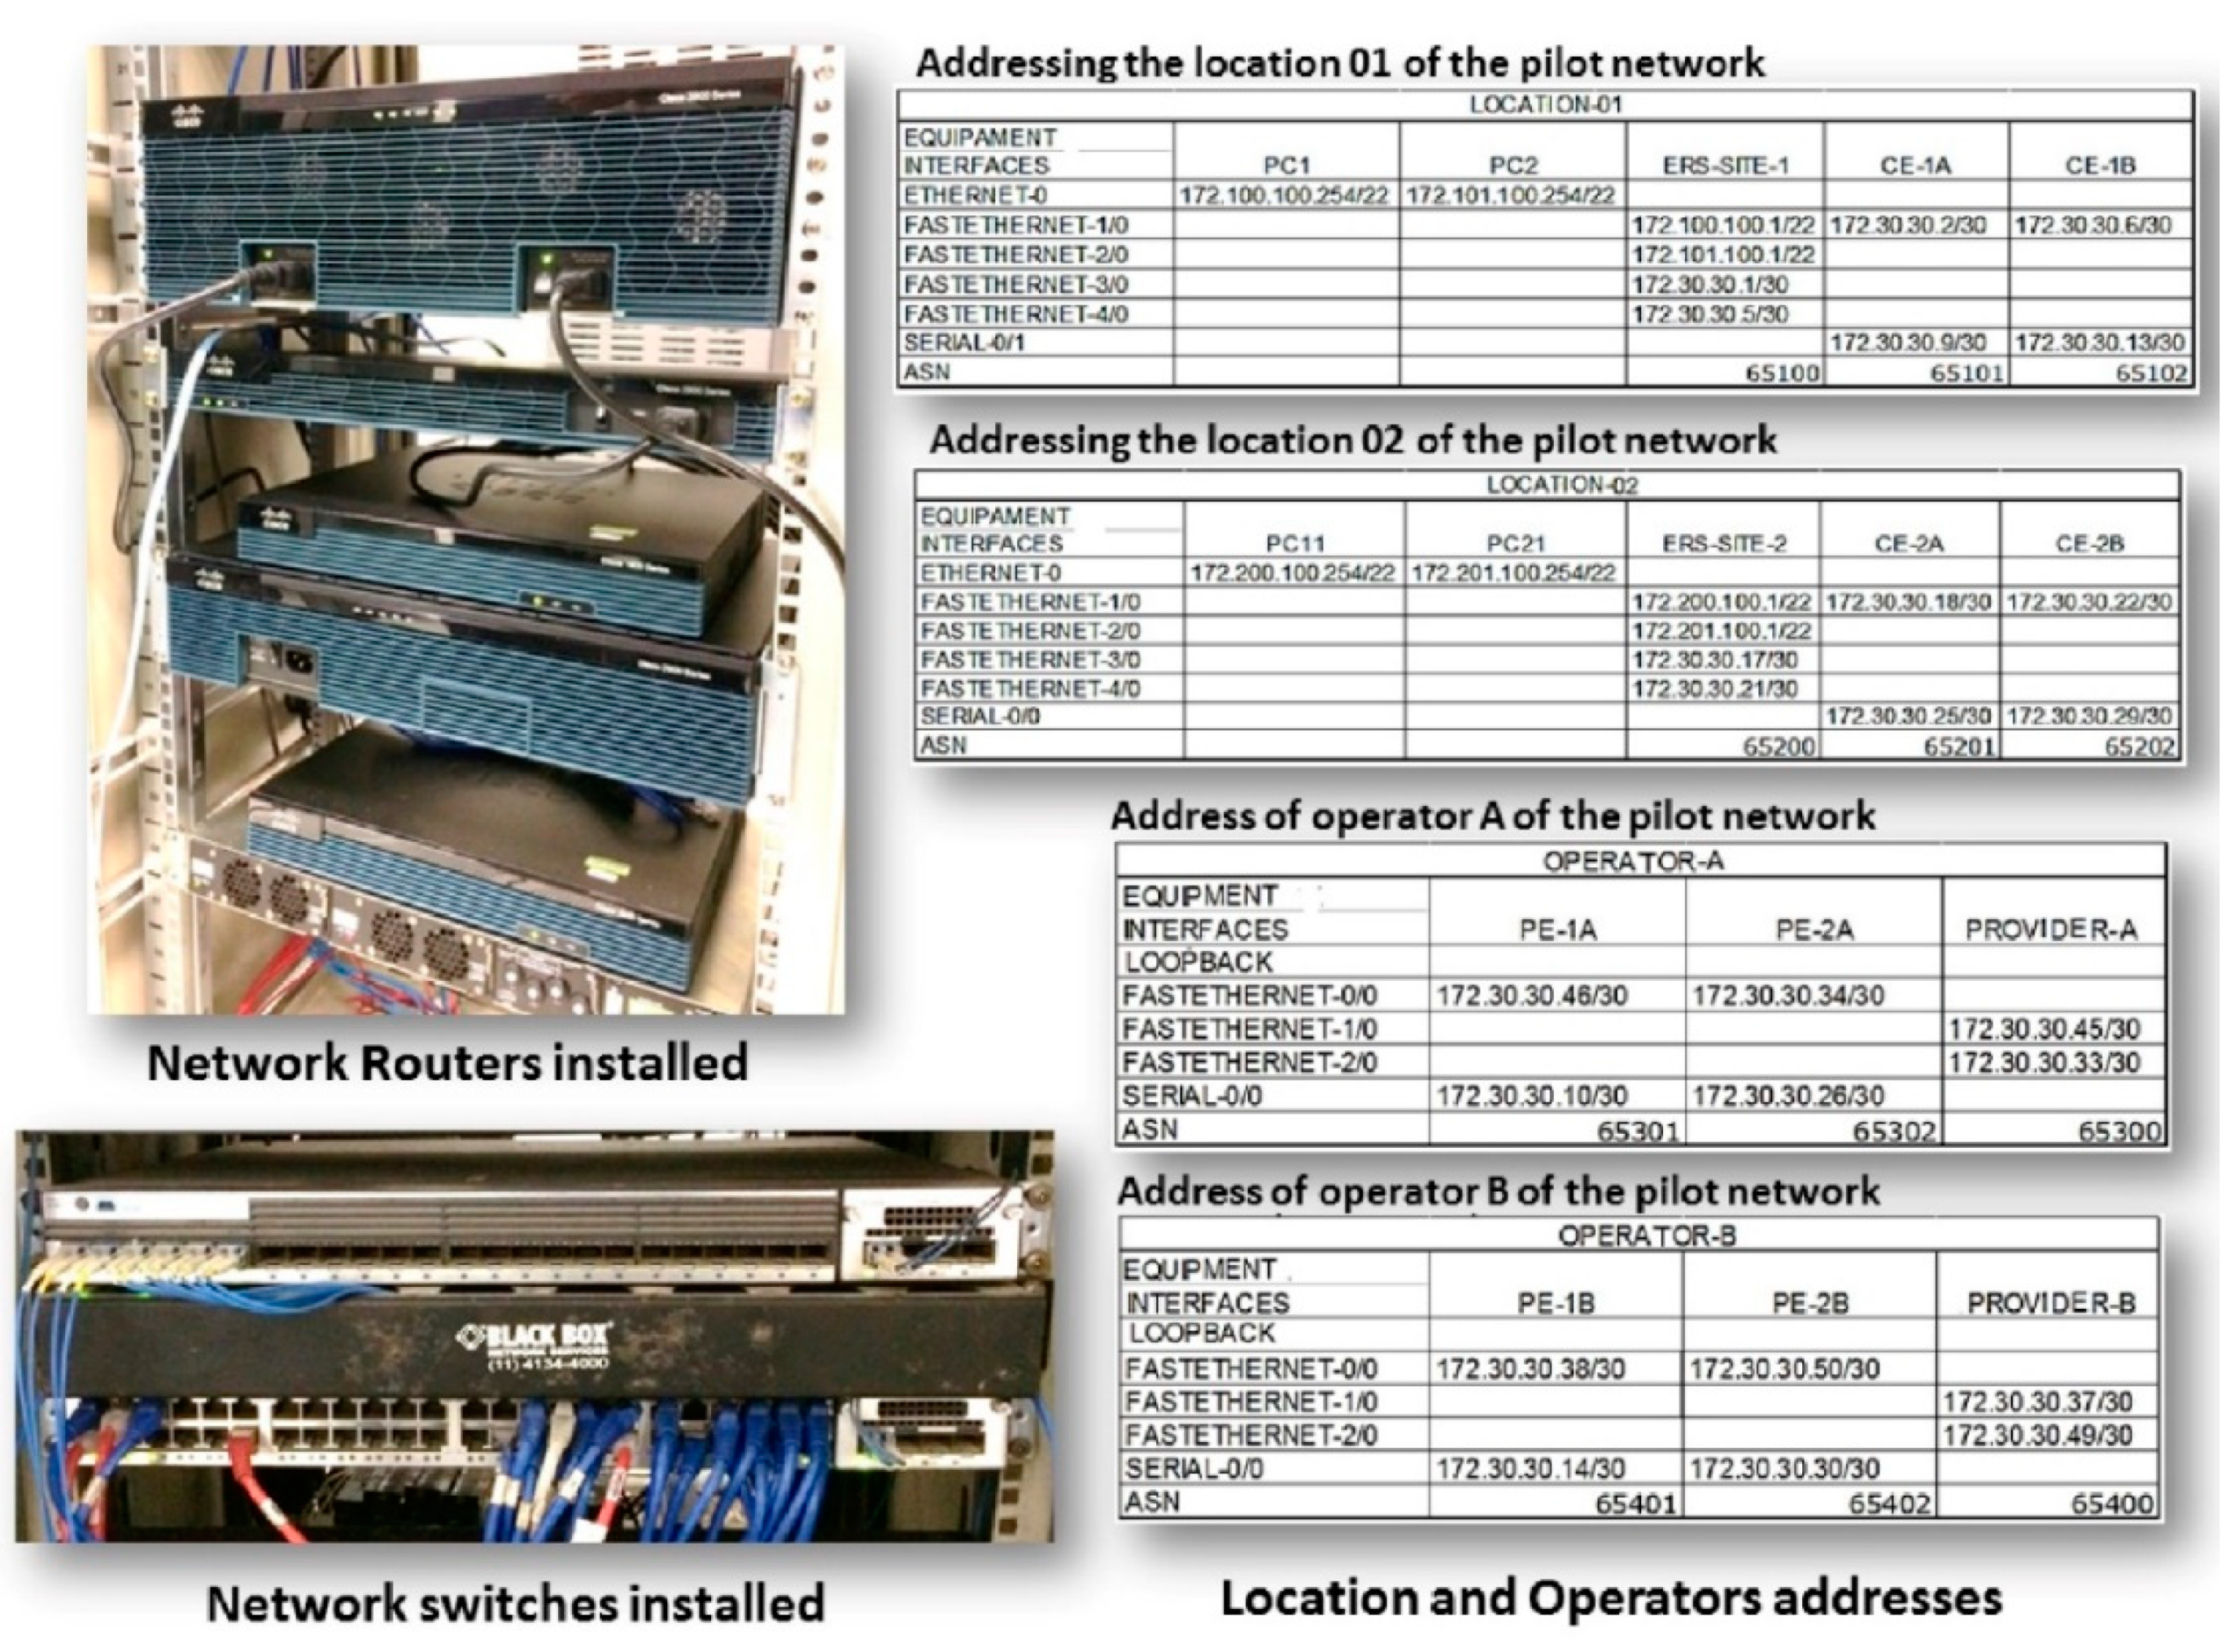
Functional tests were carried out with the PDAPAL2v interface connected to a pilot communication network of a CISCO system (equipment family 3945, 1911, 2911, 2921, 3750X, and 7200) where all the modules of the routing management system (RMS) were implemented (Figure 4).
Figure 7 shows the installation used for the functional tests of PDAPAL2v, with the informative table of the routes of interest.
In all functional tests, the following conditions in the pilot network were considered:
(a)
All active and functional interconnection nodes
(b)
Network of origin: SITE-1 (172.100.100.0)
(c)
Destination network: SITE-2 (172.200.100.0)
(d)
Number of pre-readings for the execution of the last step of the paraconsistent controller: 10
(e)
Interval between readings: 1 min
(f)
Higher traffic volume in the selected communication route
(g)
Higher CPU usage in the equipment
(h)
Lower limit of modeling of the CPU signal: 10%
(i)
Upper limit of modeling of the Jitter signal: 30 ms

5. Results

We show below the results obtained in the tests carried out with PADPAL2v in the simulations with the objective of comparison and to demonstrate its functionality in data analysis in the management of communication network routes.

5.1. Direct Comparative Tests Results

Several simulations were carried out for comparisons using a database with randomly inserted noises in the five sources of information. In this section, we pinpoint the results obtained with a noise insertion of 10%, in which we obtained efficacy up to 97% in detecting deteriorated packets with PDAPAL2v and 72% with the conventional system built with classical algorithms.

5.2. Functional Tests Results

The PDAPAL2v functional tests were carried out in a pilot communication network where the objective was the analysis of degradation in the main route. Therefore, for this test, the PDAPAL2v interface starts to operate through the configuration shown in Figure 6a and the architecture of a data network proposed for the study of routing shown in Figure 6b. When the button “Connect and load network nodes” is pressed, the information from the Register module is displayed on the screen, as shown in Figure 8a. From this signal, PDAPAL2v searches all the information of interfaces and interconnections of the network equipment from the informed initial node in real time. In sequence, when “Detail route” is requested, the connections between the equipment are shown on the screen, as shown in Figure 8b.
The PDAPAL2v interface is activated from this information to start collecting information, highlighting the selected route for analysis on the screen. As a last step of the graphical interface of PDAPAL2v, a function records the information collected/generated in spreadsheet format for later consultation, validation, and comparisons of test values. The values resulting from the analyses are presented on the screen, as seen in Figure 8c.
The PAN Po algorithm that responds to the objective proposition “There is degradation of the link” is the reference for conclusions based on the values resulting from the output. Therefore, after the conclusion of the PAL2v analysis, if the degree of the final resulting evidence is low, it means that PDAPAL2v concludes that there is no degradation of the route under analysis.
If the resulting degree of evidence is high, there is degradation in the route, and the system must choose another route of better quality. Therefore, the other route presents itself with the lowest value of the resulting degree of evidence.

5.3. Example 1: Functional Results of the Paraconsistent Data Analyzer (PDAPAL2v)

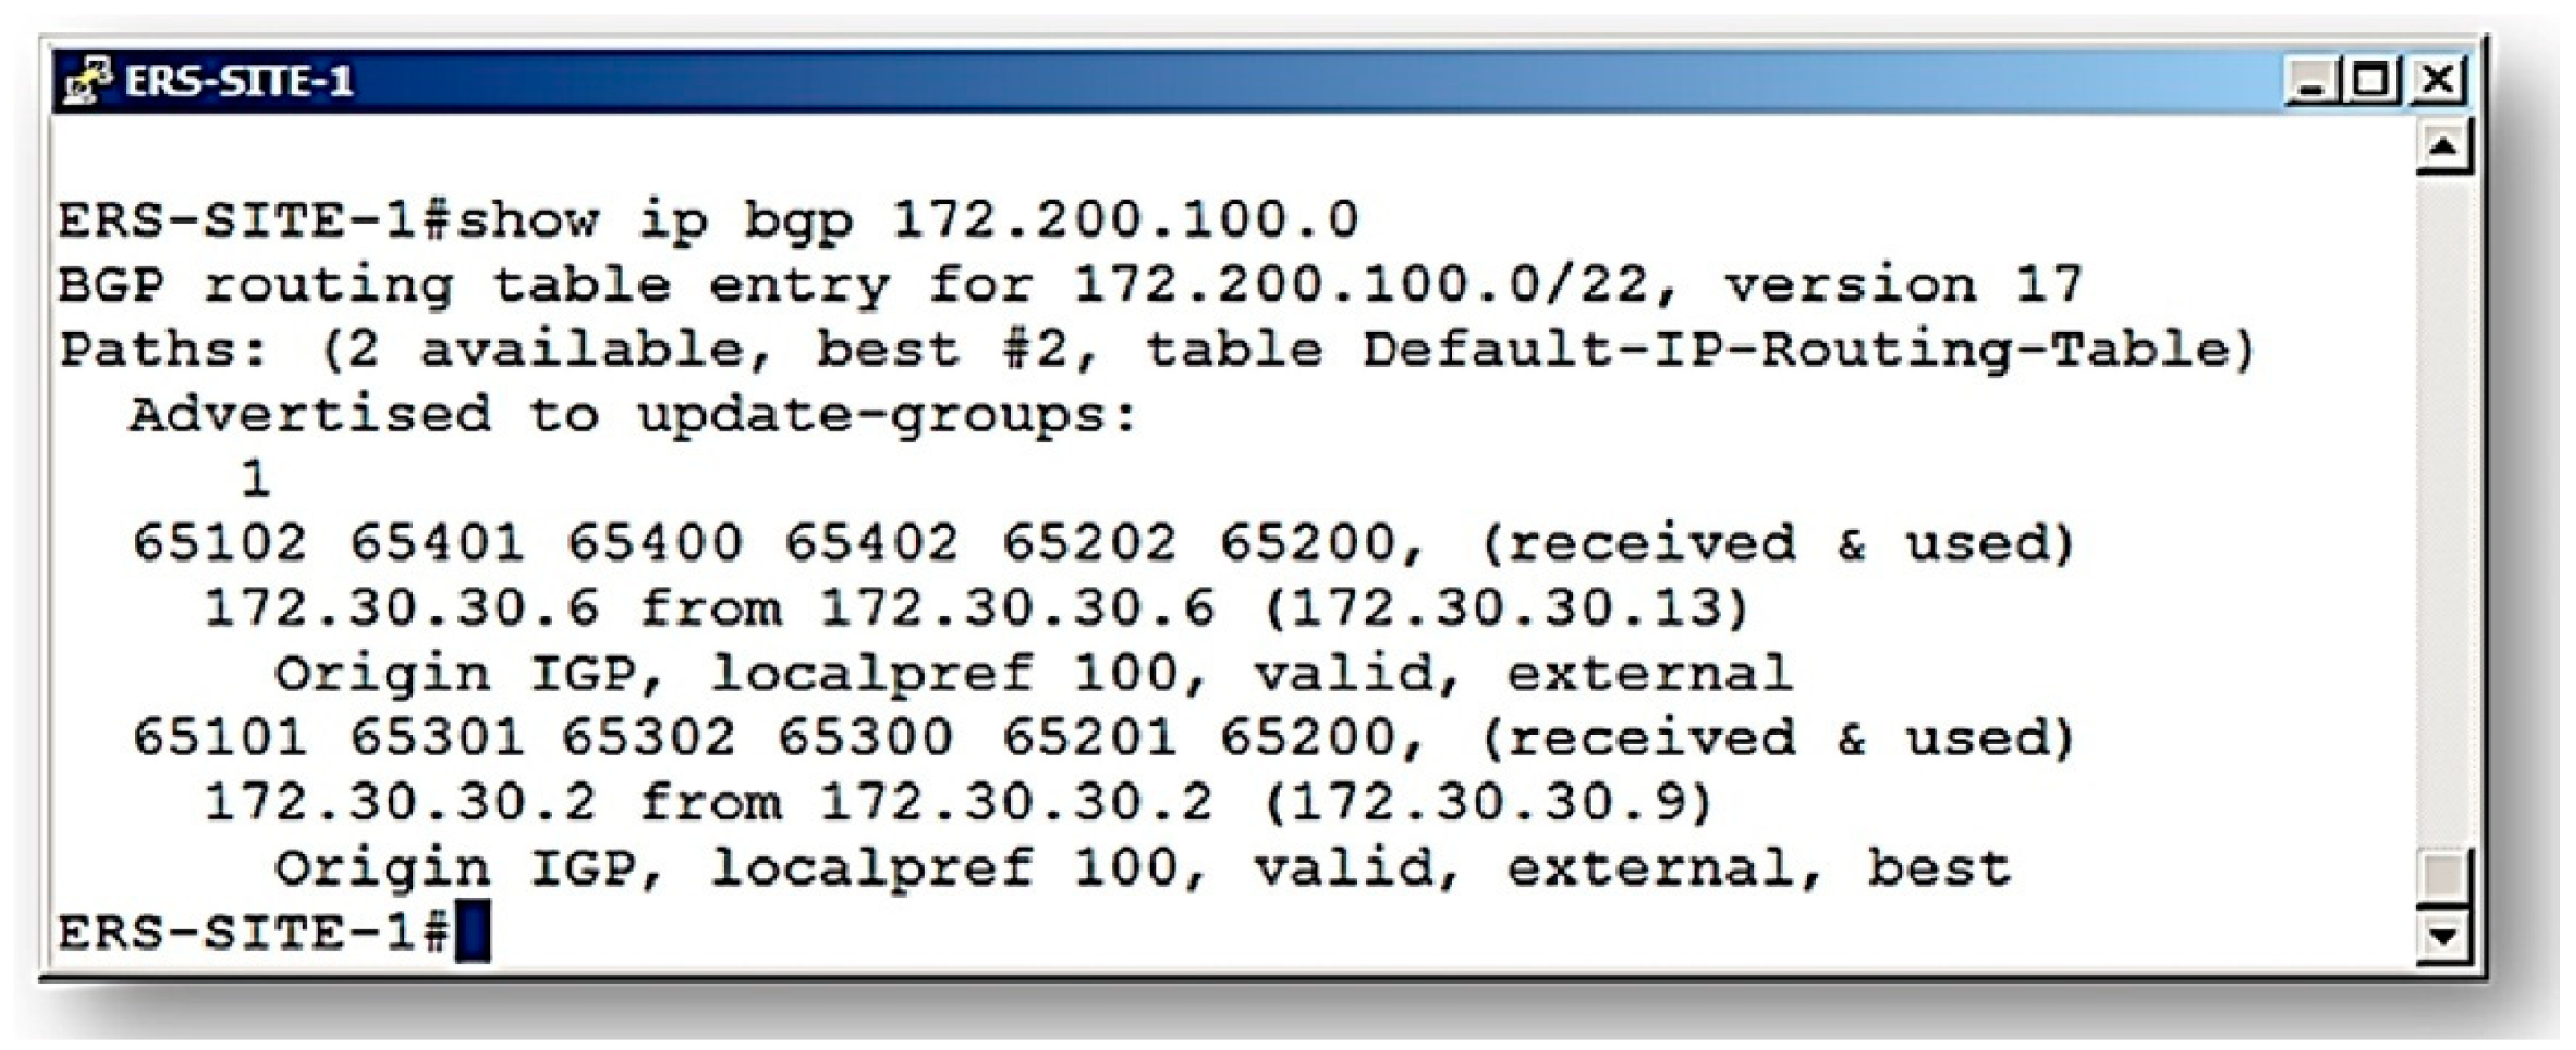
For this first analysis, we considered the route presented by Border Gateway Protocol (BGP) on the pilot network showed in Figure 9, called route A. In this case, it was observed that the communication route traced by the BGP routing algorithm indicates that the route through (65101–65301–65300–65302–65201–65200) was defined as the one with the best characteristics (Signalizing–best ERS-SITE-1#).
When executing the paraconsistent data analyzer (PDAPAL2v), it is selected in the application to analyze the same route (route A) suggested by the protocol.
The results for the action of the paraconsistent data analyzer (PDAPAL2v) obtained in the analysis of route A are shown in the tables below. Therefore, the tables shown in sequence contain the results obtained in each phase of data processing according to the paraconsistent analysis performed by PDAPAL2v.
As mentioned in the previous section, before the final result, 10 readings are required, and Table 2 shows the signal values obtained in the first acquisition. These values correspond to the evidence degree obtained in each link traveled and the evidence degrees in PAN outputs that make up the paraconsistent analysis network (PANnet).
The last column of Table 2 shows the initial result of this first acquisition. Therefore, for the destination network located on AS 65200, this first reading showed a real resulting degree of evidence of PAN Po1 μER = 0.6110266653071952.
Table 3 shows the results corresponding to the 10 readings performed before the action of the ParaExtrctr algorithm of PDAPAL2v. Therefore, in Table 3 are data related to final values of the real resulting degree of evidence obtained in the route traveled between the autonomous systems (ASs).
With these values, the monitoring Module builds the group of the resulting evidence degrees: GμER = {PAN Po1μR1, PAN Po2 μR2, PAN Po3 μR3, PAN Po4 μR4, PAN Po5 μR5, PAN Po6 μR6, PAN Po7 μR7, PAN Po8 μR8, PAN Po9 μR9, PAN Po10 μR10}.
In the next step, PDAPAL2v sends this set of values to an algorithm that extracts the effects of the contradiction. Subsequent readings in Table 3 display only the packet’s final destination network information and the propositions that determine its link degradation state.
As described, readings are taken at 10 measurement intervals. Each interval generates a value of the resulting degree of evidence that composes the group of values that ultimately is analyzed by the ParaExtrctr algorithm that extracts the effects of the contradiction.
Table 4 shows the values of the 10 evidence degrees involved in the final data treatment using the contradiction effects extraction algorithm ParaExtrctr. The final result of the analysis was the resulting degree of evidence equal to Po μER = 0.6242804.
As shown in Figure 10, all degrees of evidence obtained in the analysis are shown on the PDAPAL2v screen with a scale of degradation of the transmission network that helps in decision making.
With this result in evidence degree format, the paraconsistent data analyzer (PDAPAL2v) offers a condition for checking whether another route is available to access the destination network. In this case, PDAPAL2v then performs the same paraconsistent analysis of this new route.
This procedure is shown in example 2.

5.4. Example 2: Functional Results of the Paraconsistent Data Analyzer (PDAPAL2v)

In this second analysis, we consider the result presented by BGP on the pilot network, as shown in Figure 11. It is observed that the communication route traced by the BGP routing algorithm indicates that the route (65101–65301–65302–65300–65201–65200) was defined as the one with the best characteristics (Signalizing–best ERS-SITE-1#). This route is called route B.
Table 5 shows the collected information data and the values of evidence degrees obtained in each link traveled for the first reading interval.
The last column of Table 5 shows the final result of this first acquisition. Therefore, the data in Table 5 show the results obtained in the route traveled between the autonomous systems (ASs). For the destination network located on AS 65200, this first reading demonstrates a real resulting degree of evidence of PAN Po1 μER = 0.470729459976530.
Table 6 shows the results corresponding to the 10 readings performed before the action of the ParaExtrctr algorithm of PDAPAL2v. With these values, the Monitor module builds the group of the resulting evidence degrees: GμER = {PAN Po1μR1, PAN Po2 μR2, PAN Po3 μR3, PAN Po4 μR4, PAN Po5 μR5, PAN Po6 μR6, PAN Po7 μR7, PAN Po8 μR8, PAN Po9 μR9, PAN Po10 μR10}.
In the next step, the Monitor module sends this set of values to the ParaExtrctr algorithm that extracts the effects of the contradiction.
Table 7 shows the values of the 10 evidence degrees involved in the final data treatment using the contradiction effects extraction algorithm ParaExtrctr. The final result of the analysis was the resulting degree of evidence equal to Po μER = 0.47451572.
After obtaining the final result, all degrees of evidence obtained in the analysis are shown on the PDAPAL2v screen with a scale of degradation of the transmission network to help in decision making. This presentation of the results is seen in Figure 12.
With this result, the paraconsistent data analyzer (PDAPAL2v) offers a condition for checking whether another route is available to access the destination network. In another form of action, based on the results, PDAPAL2v can make verification among the five sources of information used to increase the efficiency of the network by decreasing the degree of evidence resulting from the output.

6. Discussion

The results of direct comparative tests showed that paraconsistent logic offers better resources for building data analyzer systems capable of handling uncertainties.
In the functional tests, it was verified that the results indicate the evidence of degradation of the links that make up the routes. The greater the degree of resulting evidence, the more it reveals the confirmation of the objective proposition P1 (there is degradation of the link) after extracting the contradiction between the 10 readings performed by the ParaExtrctr algorithm paraconsistent data analyzer (PDAPAL2v).
As seen, two functional tests were performed, and for better understanding of the degradation level values found in the tests by PDAPAL2v, we can observe the values of the measurements obtained in the five sources of information (shown in Table 2 and Table 5) that originated the degrees of evidence for analysis by the PAL2v algorithms.
The data from JITTER-SD in Table 2, example 1, are presented with high values in comparison to those found in Table 5, example 2.
The data from JITTER-DS in Table 2, example 1, are presented with low values in comparison to those found in Table 5, example 2. Still, observing these two Table 2 and Table 5, we see that they presented high values of RTT-Avg; however, Table 5, example 2, presented a low value of PEP-Ratio compared to Table 2, example 1. In relation to CPU-Busy1min, the alternative route B, Table 5, example 2, presented lower values than those found in Table 2, example 1.
Paraconsistent analysis of the values found in the measurements of the information sources that characterized the alternative route B showed that this route reached the lowest degree of resulting evidence (as shown in Table 7) compared to the degree of resulting evidence found in Table 4, route A.
The results presented in the tables obtained by PDAPAL2v indicate that PAL2v adaptive algorithms can be helpful in routing management. The paraconsistent method provides fundamental characteristics for the transmission between communicating elements and the resilience of the telecommunications links in the case of interruptions in the network environment. As a consequence, in the functional tests, the alternative route B showed the lowest level of degradation compared to route A. Thus, route B can be selected for transmission.
In a preliminary analysis, it can be suggested that PDAPAL2v would only act in degradation situations, but it is observed that the system can be configured to act in a decisive way, allowing the distribution of traffic between redundant routes by establishing other levels of parameterization in the output of the algorithm. In a more detailed analysis of the results presented in Table 4 and Table 7, it is believed that the use of the ParaExtrctr algorithm contributes to a better veracity degree of the analysis, eliminating possible divergences caused by readings performed at instants of momentary instability of the route.
With application of the paraconsistent data analyzer (PDAPAL2v), we can check whether there is another route available for access to the destination network and where adjustments can be made among the five sources of information used in order to increase the efficiency of the network by decreasing the degree of evidence resulting from the output.
It is also observed that the PANnet structured with the four PANs correctly provided the importance of the information sources for this research, showing that other sources that can bring evidence to enrich the analysis can be added. Therefore, this technique can be used in the search for configurations that can obtain acceptable quality using the paraconsistent routing algorithms applied in the analysis of complex communication networks, because they have demonstrated that they can treat uncertain signals. These values express inconsistent information and are sensitive to routing system performance metrics. As seen in this research, these interconnected paraconsistent algorithms are able to support and infer the distribution of traffic, even in communication networks with redundant links.

7. Conclusions

This article presents an application of paraconsistent logic (PL) in a routing management system in data communication networks. Through equations based on a particular form of PL, called paraconsistent annotated logic of annotation with two values (PAL2v), an efficient computational system of route analysis and monitoring called PDAPAL2v was developed. Only three types of algorithms were used: extractor of degrees of evidence, paraconsistent analysis node, and extractor of contradiction effects. The algorithms used are adaptive and efficient in analyzing information about the conditions of the communication linkage in real time. The results verify that with the application of structured algorithms in annotated paraconsistent logic, we can detect anomalies and obtain conditions for making proactive decisions on optimal routing. In data communication networks, it is essential to take advantage of the links between origin and destination networks by considering traffic policies and media degradation that represent a great technical and economic challenge. Therefore, finding new ways to efficiently distribute application traffic between locations linked by redundant telecommunications links is significant for research in this area. This study presented a proposal for the construction of expert systems dedicated to tracing the best routes, and the best distribution of data transfer flow for each of them applied exclusively to the communications environment. However, it can be extended to applications in other areas, such as transportation logistics and robotics, to specify arrival points for machines moving in structured or unstructured environments. The results and tests obtained in this work show the importance of the use of PL in projects of expert systems, manipulating flexibly and effectively data that contain uncertainties and inconsistencies. Based on these results, the paraconsistent data analyzer (PDAPAL2v) was connected to a CISCO platform to support routing management in the communication network of a steel industry in Brazil.

Future Works

Contributions to future works are related to research to obtain new applications of PDAPAL2v in routing systems that encompass new technologies. In data communication networks, taking advantage of the availability of communication links between the source and destination networks, considering traffic policies and degradations of the means of communication, represents a great technical and economic challenge. A field of research in this area is the adaptation of PDAPAL2v in techniques that involve software-defined wide area networks (SDWANs). Project developments in microelectronics involving PDAPAL2v and other configurations of paraconsistent analysis networks is another field of research that can be investigated.
Another line of research under development is directed toward the functioning of PDAPAL2v as a sensor of physical quantities. In this case, studies can investigate ways to use PDAPAL2v in signal analysis, monitoring in real time the risks of damage to industrial machines.

Author Contributions

Methodology, investigation, J.I.D.S.F.; formal analysis, validation, J.M.A.; investigation, conceptualization, A.d.L.M.; investigation, software, A.A.G.M. and M.C.M.; validation, editing, A.R.; formal analysis, C.R.T.; conceptualization, data curation, H.M.C.; writing—review and editing, M.T.T.P.; validation, software, D.V.G.; supervision, writing—review and editing, M.F.B. All authors have read and agreed to the published version of the manuscript.

Funding

This research received no external funding.

Institutional Review Board Statement

Not applicable.

Informed Consent Statement

Not applicable.

Data Availability Statement

Not applicable.

Conflicts of Interest

The authors declare no conflict of interest.

References

  1. Dignum, F.; Greaves, M. Issues in Agent Communication. In Lecture Notes in Computer Science; Dignum, F., Greaves, M., Eds.; Springer: Berlin/Heidelberg, Germany, 2000; Volume 1916. [Google Scholar] [CrossRef]
  2. Miller, S.L.; Childers, D. Introduction. In Probability and Random Processes; Scott, L.M., Donald, C., Eds.; Academic Press: Cambridge, MA, USA, 2004; pp. 1–6. ISBN 9780121726515. [Google Scholar] [CrossRef]
  3. Tanenbaum, A.S.; Wetherall, D.J. Computer Networks, 5th ed.; Pearson: London, UK, 2010. [Google Scholar]
  4. Kułacz, Ł.; Kliks, A.; Kryszkiewicz, P.; Bossy, B. Dynamic Transmit Profile Selection in Dense Wireless Networks. Sensors 2020, 21, 134. [Google Scholar] [CrossRef]
  5. Wei, H.; Zhang, S.; He, X. Shortest Path Algorithm in Dynamic Restricted Area Based on Unidirectional Road Network Model. Sensors 2020, 21, 203. [Google Scholar] [CrossRef]
  6. Fortz, B.; Rexford, J.; Thorup, M. Traffic engineering with traditional IP routing protocols. IEEE Commun. Mag. 2002, 40, 118–124. [Google Scholar] [CrossRef] [Green Version]
  7. Garg, V.K.; Wang, Y.-C. Communication Network Architecture. In The Electrical Engineering Handbook; Wai-Kai, C., Ed.; Academic Press: Cambridge, MA, USA, 2005; pp. 989–1003. [Google Scholar]
  8. Oida, K.; Sekido, M. An agent-based routing system for QoS guarantees. In Proceedings of the IEEE International Conference on Systems, Man, and Cybernetics, Tokyo, Japan, 12–15 October 1999; pp. 833–838. [Google Scholar]
  9. Smith, D.K.; Ahuja, R.K.; Magnanti, T.L.; Orlin, J.B. Network Flows: Theory, Algorithms, and Applications. J. Oper. Res. Soc. 1994, 45, 1340. [Google Scholar] [CrossRef] [Green Version]
  10. Da Costa, N.C.A.; Abe, J.M.; Subrahmanian, V.S. Remarks on annotated logic. Z. Math. Logik Grundl. Math. 1991, 37, 561–570. [Google Scholar]
  11. Da Silva Filho, J.I.; Lambert-Torres, G.; Abe, J.M. Uncertainty Treatment Using Paraconsistent Logic—Introducing Paraconsistent Artificial Neural Networks; IOS Press: Amsterdam, The Netherlands, 2010; p. 320. ISBN 978-1-60750-557-0. [Google Scholar]
  12. Heusse, M.; Snyers, D.; Guérin, S.; Kuntz, P. Adaptive Agent-Driven Routing and Load Balancing in Communication Networks. Adv. Complex Syst. 1998, 1, 237–254. [Google Scholar] [CrossRef] [Green Version]
  13. Seyfollahi, A.; Ghaffari, A. A lightweight load balancing and route minimizing solution for routing protocol for low-power and lossy networks. Comput. Networks 2020, 179, 107368. [Google Scholar] [CrossRef]
  14. Li, T.; Li, X. Novel alarm correlation analysis system based on association rules mining in telecommunication networks. Inf. Sci. 2010, 180, 2960–2978. [Google Scholar] [CrossRef]
  15. Egilmez, H.E.; Dane, S.T.; Bagci, K.T.; Tekalp, A.M. OpenQoS: An OpenFlow controller design for multimedia delivery with end-to-end Quality of Service over Software-Defined Networks. In Proceedings of the 2012 Asia Pacific Signal and Information Processing Association Annual Summit and Conference, Hollywood, CA, USA, 3 March 2012; pp. 1–8. [Google Scholar]
  16. Ii, H.O.; Durresi, A.; Owens, H. Video over Software-Defined Networking (VSDN). In Proceedings of the 2013 16th International Conference on Network-Based Information Systems, Gwangju, Korea, 4–6 September 2013; pp. 44–51. [Google Scholar]
  17. Govindarajan, K.; Meng, K.C.; Ong, H.; Tat, W.M.; Sivanand, S.; Leong, L.S. Realizing the Quality of Service (QoS) in Software-Defined Networking (SDN) based Cloud infrastructure. In Proceedings of the 2014 2nd International Conference on Information and Communication Technology (ICoICT), Bandung, Indonesia, 28–30 May 2014; pp. 505–510. [Google Scholar]
  18. Seddiki, M.; Shahbaz, M.; Donovan, S.; Grover, S.; Park, M.; Feamster, N.; Song, Y. FlowQoS: PerFlow Quality of Service for Broadband Access Networks. 2015. Available online: https://smartech.gatech.edu/handle/1853/53190 (accessed on 23 May 2021).
  19. Karaman, M.; Gorkemli, B.; Tatlicioglu, S.; Komurcuoglu, M.; Karakaya, O. Quality of service control and resource priorization with software defined networking. In Proceedings of the 1st IEEE Conference on Network Softwarization (NetSoft), London, UK, 13–17 April 2015. [Google Scholar]
  20. Shafique, M.A.; Baloch, N.K.; Baig, M.I.; Hussain, F.; Bin Zikria, Y.; Kim, S.W. NoCGuard: A Reliable Network-on-Chip Router Architecture. Electronics 2020, 9, 342. [Google Scholar] [CrossRef] [Green Version]
  21. Yang, Z.; Cui, Y.; Li, B.; Liu, Y.; Xu, Y. Software-Defined Wide Area Network (SD-WAN): Architecture, Advances and Opportunities. In Proceedings of the 2019 28th International Conference on Computer Communication and Networks (ICCCN), Valencia, Spain, 29 July–1 August 2019; pp. 1–9. [Google Scholar] [CrossRef]
  22. Pena, E.H.M.; Barbon, S.; Rodrigues, J.J.P.C.; Proença, M.L., Jr. Anomaly detection using digital signature of network segment with adaptive ARIMA model and Paraconsistent Logic. In Proceedings of the 2014 IEEE Symposium on Computers and Communications (ISCC), Funchal, Portugal, 23–26 June 2014; pp. 1–6. [Google Scholar]
  23. Pena, E.H.M.; Carvalho, L.F.; Barbon, P.C.S., Jr.; Rodrigues, M.L.P. Anomaly detection using the correlational paraconsistent machine with digital signatures of network segment. Inf. Sci. 2017, 420, 313–328. [Google Scholar] [CrossRef]
  24. de Carvalho, A.; Justo, J.F.; Angelico, B.A.; de Oliveira, A.M.; Da Silva Filho, J.I. Rotary Inverted Pendulum Identification for Control by Paraconsistent Neural Network. IEEE Access 2021, 9, 74155–74167. [Google Scholar] [CrossRef]
  25. Da Cruz, C.M.; Rocco, A.; Mario, M.C.; Garcia, D.V.; Lambert-Torres, G.; Abe, J.M.; Torres, C.R.; Da Silva Filho, J.I. Application of Paraconsistent Artificial Neural Network in Statistical Process Control acting on voltage level monitoring in Electrical Power Systems. In Proceedings of the 2015 18th International Conference on Intelligent System Application to Power Systems (ISAP), Porto, Portugal, 11–16 September 2015; pp. 1–6. [Google Scholar]
  26. Da Silva Filho, J.I.; Da Cruz, C.M. A Method with Paraconsistent Partial Differential Equation used in Explicit Solution of one-dimensional Heat Conduction. IEEE Lat. Am. Trans. 2016, 14, 1842–1848. [Google Scholar] [CrossRef]
  27. Garcia, D.V.; Da Silva Filho, J.I.; Silveira, L.; Pacheco, M.T.T.; Abe, J.M.; Carvalho, A.; Blos, M.F.; Pasqualucci, C.A.G.; Mario, M.C. Analysis of Raman spectroscopy data with algorithms based on paraconsistent logic for characterization of skin cancer lesions. Vib. Spectrosc. 2019, 103, 102929. [Google Scholar] [CrossRef]
  28. Da Silva Filho, J.I.; Camargo, J.M.; Santos, M.R.; Onuki, A.; Mario, M.; Ferrara, L.; Garcia, D.; Pereira, J.; Rocco, A. Support at Decision in Electrical Systems of subtransmission through selection of Topologies by a Paraconsistent Simulator. IEEE Lat. Am. Trans. 2016, 14, 1993–1999. [Google Scholar] [CrossRef]
  29. Coelho, M.S.; Da Silva Filho, J.I.; Côrtes, H.M.; de Carvalho, A.; Blos, M.F.; Mario, M.C.; Rocco, A. Hybrid PI controller constructed with paraconsistent annotated logic. Control. Eng. Pract. 2019, 84, 112–124. [Google Scholar] [CrossRef]
  30. Da Silva Filho, J.I.; Lambert-Torres, G.; Ferrara, L.F.P.; Mário, M.C.; dos Santos, M.R.; Onuki, A.S.; Camargo, J.D.M.; Rocco, A. Paraconsistent Algorithm Extractor of Contradiction Effects—Paraextrctrctr. J. Softw. Eng. Appl. 2011, 04, 579–584. [Google Scholar] [CrossRef] [Green Version]
  31. Favieiro, G.W.; Balbinot, A. Paraconsistent Random Forest: An Alternative Approach for Dealing with Uncertain Data. IEEE Access 2019, 7, 147914–147927. [Google Scholar] [CrossRef]
  32. Da Silva Filho, J.I. Treatment of Uncertainties with Algorithms of the Paraconsistent Annotated Logic. J. Intell. Learn. Syst. Appl. 2012, 4, 144–153. [Google Scholar] [CrossRef] [Green Version]
  33. Da Silva Filho, J.I.; Caetano, I.D.S.; Pontes, F.N.; Mario, M.C.; Abe, J.M.; Giordano, F. Paraconsistent Logic Algorithms Applied to Seasonal Comparative Analysis with Biomass Data Extracted by the Fouling Process. Paraconsistent Intelligent-Based Systems—New Trends in the Applications of Paraconsistency; Springer: Berlin/Heidelberg, Germany, 2015; pp. 131–151. [Google Scholar]
  34. Da Silva Filho, J.I.; Nunes, C.V.; Garcia, D.V.; Mario, M.C.; Giordano, F.; Abe, J.M.; Pacheco, M.T.T.; Silveira, L., Jr. Paraconsistent analysis network applied in the treatment of Raman spectroscopy data to support medical diagnosis of skin cancer. Med. Biol. Eng. Comput. 2016, 54, 1453–1467. [Google Scholar] [CrossRef] [PubMed]
  35. McCabe, T.J. A Complexity Measure. IEEE Trans. Softw. Eng. 1976, 308–320. [Google Scholar] [CrossRef]
  36. Shanthi, V.; Jeevana, P.; Chaithanya, G.K.; Thirumalai, C. Evaluation of McCabe’s cyclomatic complexity metrics for secured medical image. In Proceedings of the 2017 International Conference on Trends in Electronics and Informatics (ICEI), Tirunelveli, India, 11–12 May 2017; pp. 1122–1126. [Google Scholar]
  37. Nascimento, M.R.D.; Dias, L.A.V.; Da Silva Filho, J.I. An Application of Paraconsistent Annotated Logic for Design Software Testing Strategies. J. Softw. Eng. Appl. 2014, 7, 371–386. [Google Scholar] [CrossRef] [Green Version]
Figure 1. Associated PAL Lattice FOUR and PAL2v lattice with paraconsistent logical states and annotations.
Sensors 21 04219 g001
Figure 2. Unit square on Cartesian plane (USCP): lattice κ and PAL2v lattice with Dc (certainty degree (X)), Dct (contradiction degree (Y)), and distance d for obtaining DCR.
Sensors 21 04219 g002
Figure 3. Representations of three main PAL2v algorithms. (a) Graph of the straight-line equation to be used in the extractor of the degrees of evidence algorithm and symbol of the extractor of the degrees of evidence algorithm. (b) Symbol of a typical paraconsistent analysis node PAN and extractor of the effects of contradiction algorithm (ParaExtrctr).
Sensors 21 04219 g003
Figure 4. Overview of a routing management system (RMS) with application of paraconsistent algorithms.
Sensors 21 04219 g004
Figure 5. Details of the paraconsistent data analyzer (PDAPAL2v) with the PANnet, Reading Interval module, and the extractor of contradiction effects algorithm.
Sensors 21 04219 g005
Figure 6. PDAPAL2v interface and network for the routing study. (a) Interface of PDAPAL2v version 1. (b) The network proposed for the routing study using PDAPAL2v.
Sensors 21 04219 g006
Figure 7. Installation of the pilot network used for PDAPAL2v functional tests.
Sensors 21 04219 g007
Figure 8. Register module: equipment routes and interface panel. (a) Screen with the details and values of the selected node. (b) Detailed route and the connections between the equipment. (c) Data export function in spreadsheet format and its display on the screen.
Sensors 21 04219 g008
Figure 9. Representations of route verification analyses (example 1: route A).
Sensors 21 04219 g009
Figure 10. Results of the analysis with the paraconsistent data analyzer (PDAPAL2v): example 1, route A.
Sensors 21 04219 g010
Figure 11. Representation of route verification analyses (example 2: route B).
Sensors 21 04219 g011
Figure 12. Result of the analysis with PDAPAL2v: example 2, route B.
Sensors 21 04219 g012
Table 1. Symbols and abbreviations.
Symbols/AbbreviationsMeaning
μFavorable evidence degree
λUnfavorable evidence degree
(μ, λ)Annotation
PLParaconsistent logic
PAL2vParaconsistent annotated logic with annotation of two values
USCPUnit square in the Cartesian plane
PProposition
tTrue logical state
fFalse logical state
Paracomplete logical state
TInconsistent logical state
DcCertainty degree
DctContradiction degree
DCRCertainty degree of a real value
μERResulting evidence degree
PANParaconsistent analysis node algorithm
PANnetParaconsistent analysis network
Set of evidence degrees
ParaExtrctrContradiction effects extractor algorithm
V(G)Cyclomatic complexity
PoμEResulting initial signal
PoμERResulting final signal
JITTER-SDJitter source/destination signal
JITTER-DSJitter destination/source signal
RTT-AvgRound-trip time signal
CPU-Busy1minBusy CPU processing consumption signal
PEP-RatioPacket loss ratio signal
SNMPSimple Network Management Protocol
BGPBorder Gateway Protocol
Table 2. Paraconsistent data analyzer (PDAPAL2v): first gathering interval of principal route A of the proposed network.
Collected Signal Values
ASN-DestinationJITTER-SDJITTER-DSCPU-Busy1minRTT-AvgPEP-Ratio
651011171957.13854216867470.004
653012616191024.9019607843138 7.45
653002819191064.07258064516127.52
653023021191124.07.48
652013323191293.1544715447155 7.54
652003521191339.7172131147547.56
Normalized Values (Evidence Degrees)
ASN-DestinationJSDJDSCPURTT-AvgPEP-Ratio
651010.0050.00.11250.00.0
653010.80.30.11251.00.921428571428715
653000.90.450.11251.00.931428571428758
653021.00.550.11251.00.9257142857142858
652011.00.650.11251.00.9342857142857143
652001.00.550.11251.00.9371428527142857
PAN Output Values
ASN-DestinationPAN P1PAN P2PAN P3PAN Po
651010.0353553390593270.07954951288348660.00250000000000220.0589623820753538
653010.50.50.64210792870772120.5652088232876168
653000.6047152924789520.50.71631704244321750.5935052150345818
653020.6818019484660530.50.76894982433793870.6105233102780929INITIAL RESULT
652010.7525126265847080.50.8189359680293476 0.6239786018898197PAN Po1μ1
652000.6818019484660530.50.77065198888134730.61102666530719520.6110266653071952
Table 3. Values of the real resulting degree of evidence obtained in the route traveled between the autonomous systems: example 1.
PAN Output Values
Reading
Intervals
ASN-DestinationPAN P1PAN P2PAN P3 PAN Po
652000.6818019484660530.50.7706519888813473PAN Po2μ10.6110266653071952
652000.6798443788128350.50.7713192225848801PAN Po2μ20.6112231372887633
652000.6757353648054110.50.7274113138137706PAN Po3μ30.5973186173680645
652000.7171572875253810.50.7961568229831409PAN Po4μ40.6181937396949033
652000.8585786437626900.50.8987022977072239PAN Po5μ50.6392637913309811
652000.8232233047033630.50.8740849816871129PAN Po6μ60.6354080418901602
652000.7763932022500210.50.8407254968711602PAN Po7μ70.6289418055432956
652000.7171572875253810.50.7987690939467289PAN Po8μ80.6188872361419652
652000.9292893218813450.50.9495024753308189PAN Po9μ90.6446480617753182
10°652000.8585786437662690.50.8975603711885854PAN Po10μ100.6391025924511091
Table 4. ParaExtrctr algorithm of the paraconsistent data analyzer (PDAPAL2v) applied to the selected main route evidence.
Evidence Degrees1° Cycle1° Cycle
Sorted
2° Cycle
Sorted
3° Cycle
Sorted
4° Cycle
Sorted
5° Cycle
Sorted
6° Cycle
Sorted
7° Cycle
Sorted
8° Cycle
Sorted
9° Cycle
Sorted
Result
Po μER
μ10.61102670.59731860.61102670.61122310.61819370.61888720.62024530.62345960.623880900.62418100.6242804
μ20.61122310.61102670.61122310.61819370.61888720.62024530.62388090.62388090.624181000.6243798
μ30.59731860.61122310.61819370.61888720.62024530.62487940.62487940.62487940.62487940
μ40.61819370.61819370.61888720.62024530.62487940.62490380.62490380.6249038
μ50.63926370.61888720.62024530.62487940.62490380.62670160.6267016
μ60.63540800.62894180.62894180.62894180.62894180.6289418
μ70.62894180.63540800.63540800.63540800.6354080
μ80.61888720.63910250.63910250.6391025
μ90.64464800.63926370.6446480
μ100.63910250.6446480
μMax 0.64464800.64464800.63910250.63540800.62894180.62670160.62490380.62487940.6243798
μMin 0.59731860.61102670.61122310.61819370.61888720.62024530.62345960.62388090.6241810
μEr 0.62024530.62487940.62490380.62670160.62388090.62345960.62418100.62437980.72348031
Table 5. Paraconsistent data analyzer (PDAPAL2v): first gathering interval of principal route B of the proposed network.
Collected Signal Values
ASN-DestinationJITTER-SDJITTER-DSCPU-Busy1minRTT-AvgPEP-Ratio
65101331416.8110.0
6530112514735.82429501084605.39
6530212614745.22559652928425.39
6530013714768.37093275488065.39
65201131014823.94055201698525.29
65200131114829.24152542372885.28
Normalized Values (Evidence Degrees)
ASN-DestinationJSDJDSCPURTT-AvgPEP-Ratio
651010.00.00.050.00.0
653010.10.00.051.00.6271428571428571
653020.10.00.051.00.6271428571428571
653000.150.00.051.00.6271428571428571
652010.150.00.051.00.6128571428571429
652000.150.050.051.00.6114285714285714
PAN Output Values
ASN-DestinationPAN P1PAN P2PAN P3PAN Po
651010.00.035355339059327420.00.02500000000002
653010.070710678118650.50.4462668278425500.47389560117849
653020.070710678118650.50.4462668278425500.47389560117849
653000.106066017177980.50.4497544681630770.47554131346953INITIAL RESULT
652010.106066017177980.50.4397976111525730.470861943023382PAN Po1μ1
652000.111803398874980.50.4395138780284320.4707294599765300.470729459976530
Table 6. Values of the real resulting degree of evidence obtained in the route traveled between the autonomous systems: example 2.
PAN Output Values
Reading
Intervals
ASN-DestinationPAN P1PAN P2PAN P3 PAN Po
652000.111803398874980.50.439513878028432PAN Po2μ10.47072945997653
652000.176776695296630.50.488997829801953PAN Po2μ20.49452951254248
652000.070710678118650.50.450282224424474PAN Po3μ30.47579096336135
652000.111803398874980.50.458406735000564PAN Po4μ40.47965442492167
652000.111803398874980.50.454427201686533PAN Po5μ50.47775730325796
652000.111803398874980.50.450448755834282PAN Po6μ60.47586977295929
652000.111803398874980.50.449454317671406PAN Po7μ70.47539940243624
652000.180277563773190.50.473077203864576PAN Po8μ80.48672478918600
6520000.50.337390949880438PAN Po9μ90.42651650206130
10°652000.035355339059320.50.417941383449880PAN Po10μ100.46080093315877
Table 7. ParaExtrctr algorithm applied to the selected main route evidence (example 2).
Evidence Degrees1° Cycle1° Cycle
Sorted
2° Cycle
Sorted
3° Cycle
Sorted
4° Cycle
Sorted
5° Cycle
Sorted
6° Cycle
Sorted
7° Cycle
Sorted
8° Cycle
Sorted
9° Cycle
Sorted
Result
Po μER
μ10.470729450.426516500.460800930.461776870.470729450.470800510.473341930.473940140.474256390.474463410.47451572
μ20.494529510.460800930.461776870.470729450.470800510.473940140.473940140.474256390.474568020.47456802
μ30.475790960.470729450.470729450.473940140.473940140.474256390.474256390.474568020.47467033
μ40.479654420.475399400.475399400.475399400.475399400.475399400.475399400.47539940
μ50.477757300.475790960.475790960.475790960.475790960.475790960.47579096
μ60.475869770.475869770.475869770.475869770.475869770.47586977
μ70.475399400.477757300.477757300.477757300.47775730
μ80.486724780.479654420.479654420.47965442
μ90.426516500.486724780.48672478
μ100.460800930.49452951
μMax 0.494529510.486724780.479654420.477757300.475869770.475790960.475399400.474670330.47456802
μMin 0.426516500.460800930.461776870.470729450.470800510.473341930.473940140.474256390.47446341
μEr 0.461776870.473940140.470800510.474256390.473341930.474568020.474670330.474463410.47451572
Publisher’s Note: MDPI stays neutral with regard to jurisdictional claims in published maps and institutional affiliations.