Review

Ultrasensitive Materials for Electrochemical Biosensor Labels

School of Integrative Engineering, Chung-Ang University, 84 Heuseok-ro, Dongjak-Gu, Seoul 06974, Korea
*
Author to whom correspondence should be addressed.
Sensors 2021, 21(1), 89; https://doi.org/10.3390/s21010089
Submission received: 29 November 2020 / Revised: 18 December 2020 / Accepted: 23 December 2020 / Published: 25 December 2020
(This article belongs to the Special Issue Labeling Biosensors)

Abstract

:
Since the fabrication of the first electrochemical biosensor by Leland C. Clark in 1956, various labeled and label-free sensors have been reported for the detection of biomolecules. Labels such as nanoparticles, enzymes, Quantum dots, redox-active molecules, low dimensional carbon materials, etc. have been employed for the detection of biomolecules. Because of the absence of cross-reaction and highly selective detection, labeled biosensors are advantageous and preferred over label-free biosensors. The biosensors with labels depend mainly on optical, magnetic, electrical, and mechanical principles. Labels combined with electrochemical techniques resulted in the selective and sensitive determination of biomolecules. The present review focuses on categorizing the advancement and advantages of different labeling methods applied simultaneously with the electrochemical techniques in the past few decades.

1. Introduction

The never-ending demand for improved selectivity and sensitivity has prompted intense research and proposed improved methods for the detection/determination of different analytes in the fields of clinical diagnostics [1,2,3]. Different bioassays based on the specific interaction between the biological recognition elements, such as antibody, nucleotide, enzyme, and the target analyte have been proposed and developed to meet these requirements. These methods are often characterized by low cost, rapid results, high selectivity and specificity, the potential for multiplexed detection/determination, operational and instrumental simplicity, and the scope for point-of-care (POC) applications. In bioassays, the signal is generated from the specific interaction between the analyte molecule and the recognition element, which is usually immobilized on a solid surface, and is used to detect and quantify the analyte by using a suitable transducer. The attractive features of electrochemical transducers are widely adopted in bioassays because of the sensitivity, potential for miniaturization and automation, and simple/often portable instrumentation. The advantages of label-free sensors such as less complicated designs, less preparation time, reduced cost due to the elimination of complex labels, and scalability are severely overwhelmed by the disadvantages such as lack of sensitivity, cross-reactivity, and interference. Labeled sensors are preferred over label-free designs when adequate preparation facilities and trained personnel are available. Labels are combined with techniques such as optical [4], electrochemical [5], fluorescence [6], Raman technique [7], magnetic [8], electro chemiluminescent [9], etc., for the selective and sensitive detection of analytes. Labels combined with electrochemical techniques have gained considerable momentum over the past decades because of the advancements in electrochemical techniques [10,11,12,13,14,15,16,17]. Electrochemical labels based on the principle of bio-specificity interactions have gained attention in clinical diagnosis or environmental monitoring because of the sensitivity, simplicity, low cost of analysis, and miniaturization possibilities [18]. Labels combined with electrochemical techniques generate a current response suitable for the detection/determination of analytes with high selectivity and specificity. Despite the increasing number of published works and interest in labels in electrochemical biosensing, there is a lack of reviews covering specifically the application of labels with electrochemistry, and the results are often uncategorized. In this context, this review aims to categorize different labels and present a general overview of the recent applications and advancements of labels in electrochemical sensors (Scheme 1).

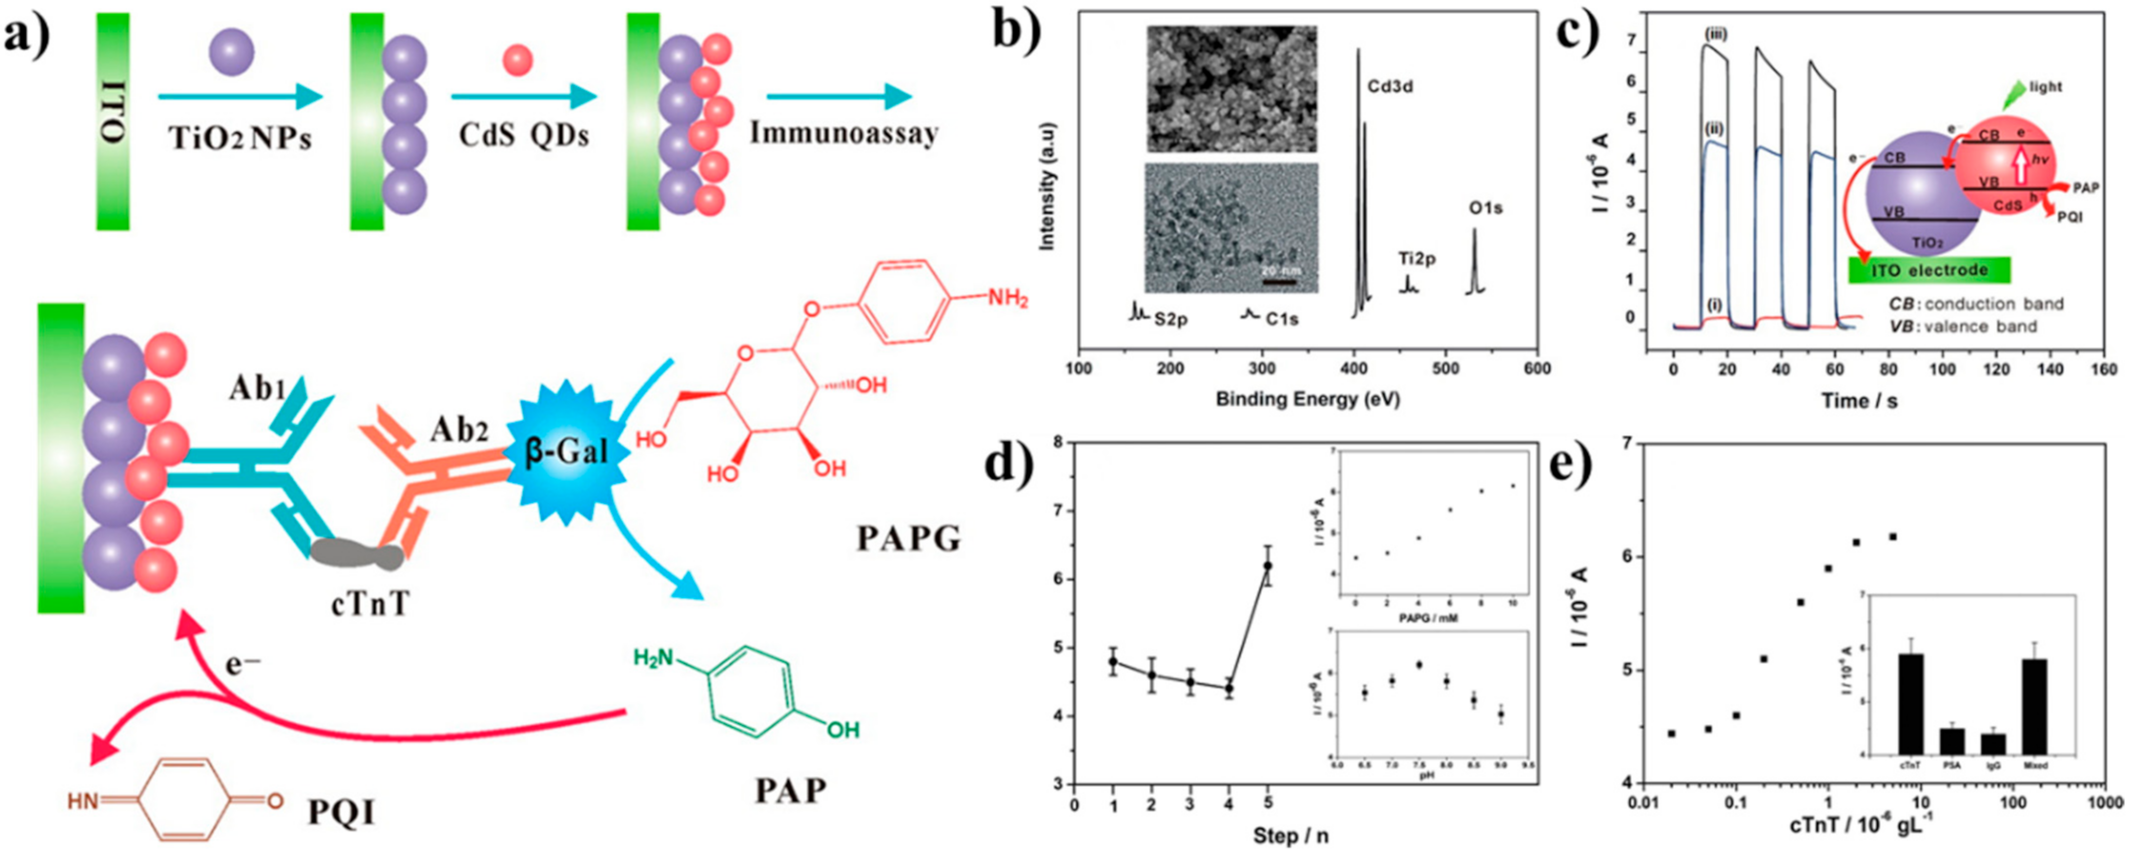
2. Enzyme Labels Combined with Electrochemical Applications

Enzymatic catalytic properties are renowned for the determination of extremely small quantities of reactants, thereby making these natural catalysts an efficient label. Enzyme labels have advantages such as the possibility of simultaneous assay because of the availability of a wide variety of enzymes, availability of different conjugation techniques, sensitive assays due to the amplification effect of enzymes, and the availability of cheap reagents for cost-effective assays [19]. Enzyme labels with the advancement in electrochemical techniques resulted in selective, sensitive, and rapid assays. Enzyme labels such as Alkaline phosphatase (ALP), Horseradish peroxidase (HRP), Glucose oxidase (GOx), Glucose-6-phosphate dehydrogenase (G6PDH), β-galactosidase (β-gal), and DT-diaphorase (DT-D) are combined with detection systems such as electrochemical, colorimetric, fluorimetry, and chemiluminescent for the detection of target analytes. An efficient enzyme label should catalyze the enzymatic reaction on its substrate at a sufficiently high reaction rate and exhibit long-term stability. These requirements are satisfied by enzymes such as ALP and HRP, making them the most common enzyme labels [20]. Zhao et al. [21] reported an electrochemical detection system based on photocurrent measurement for the determination of cardiac troponin T(cTnT) using beta-galactosidase as a label. Here, the photocurrent, which was directly correlated to the target analyte, was generated from the photooxidation of p-aminophenol, which, in-turn, was generated from the β-Gal enzyme-catalyzed conversion of p-aminophenyl galactopyranoside (Figure 1). The method is renowned for its importance as the first PEC immunoassay towards the cardiac biomarker.
An interesting enzyme label based on the two-electron reductase enzyme DT-diaphorase (NAD(P)H: Quinone Oxidoreductase1) combined with electrochemical immunosensor application was reported by Kang et al. [22]. Here, the thermostable DT-diaphorase enzyme and an electrochemically inactive compound 4-nitroso-1-naphthol were used as an enzyme label and reacting substrate, respectively. Signal amplification was achieved by the enzymatic amplification and an electrochemical redox process. The electrochemically inactive substrate was converted to an amine compound by the DT-diaphorase, which further undergoes electrochemical-chemical and electrochemical-enzymatic redox process, respectively (Figure 2). The enzyme label-based electrochemical immunosensor was applied for the determination of parathyroid hormone (PTH) over a wide range of concentrations from PBS containing BSA with an LOD of 2 pg/mL for PTH.

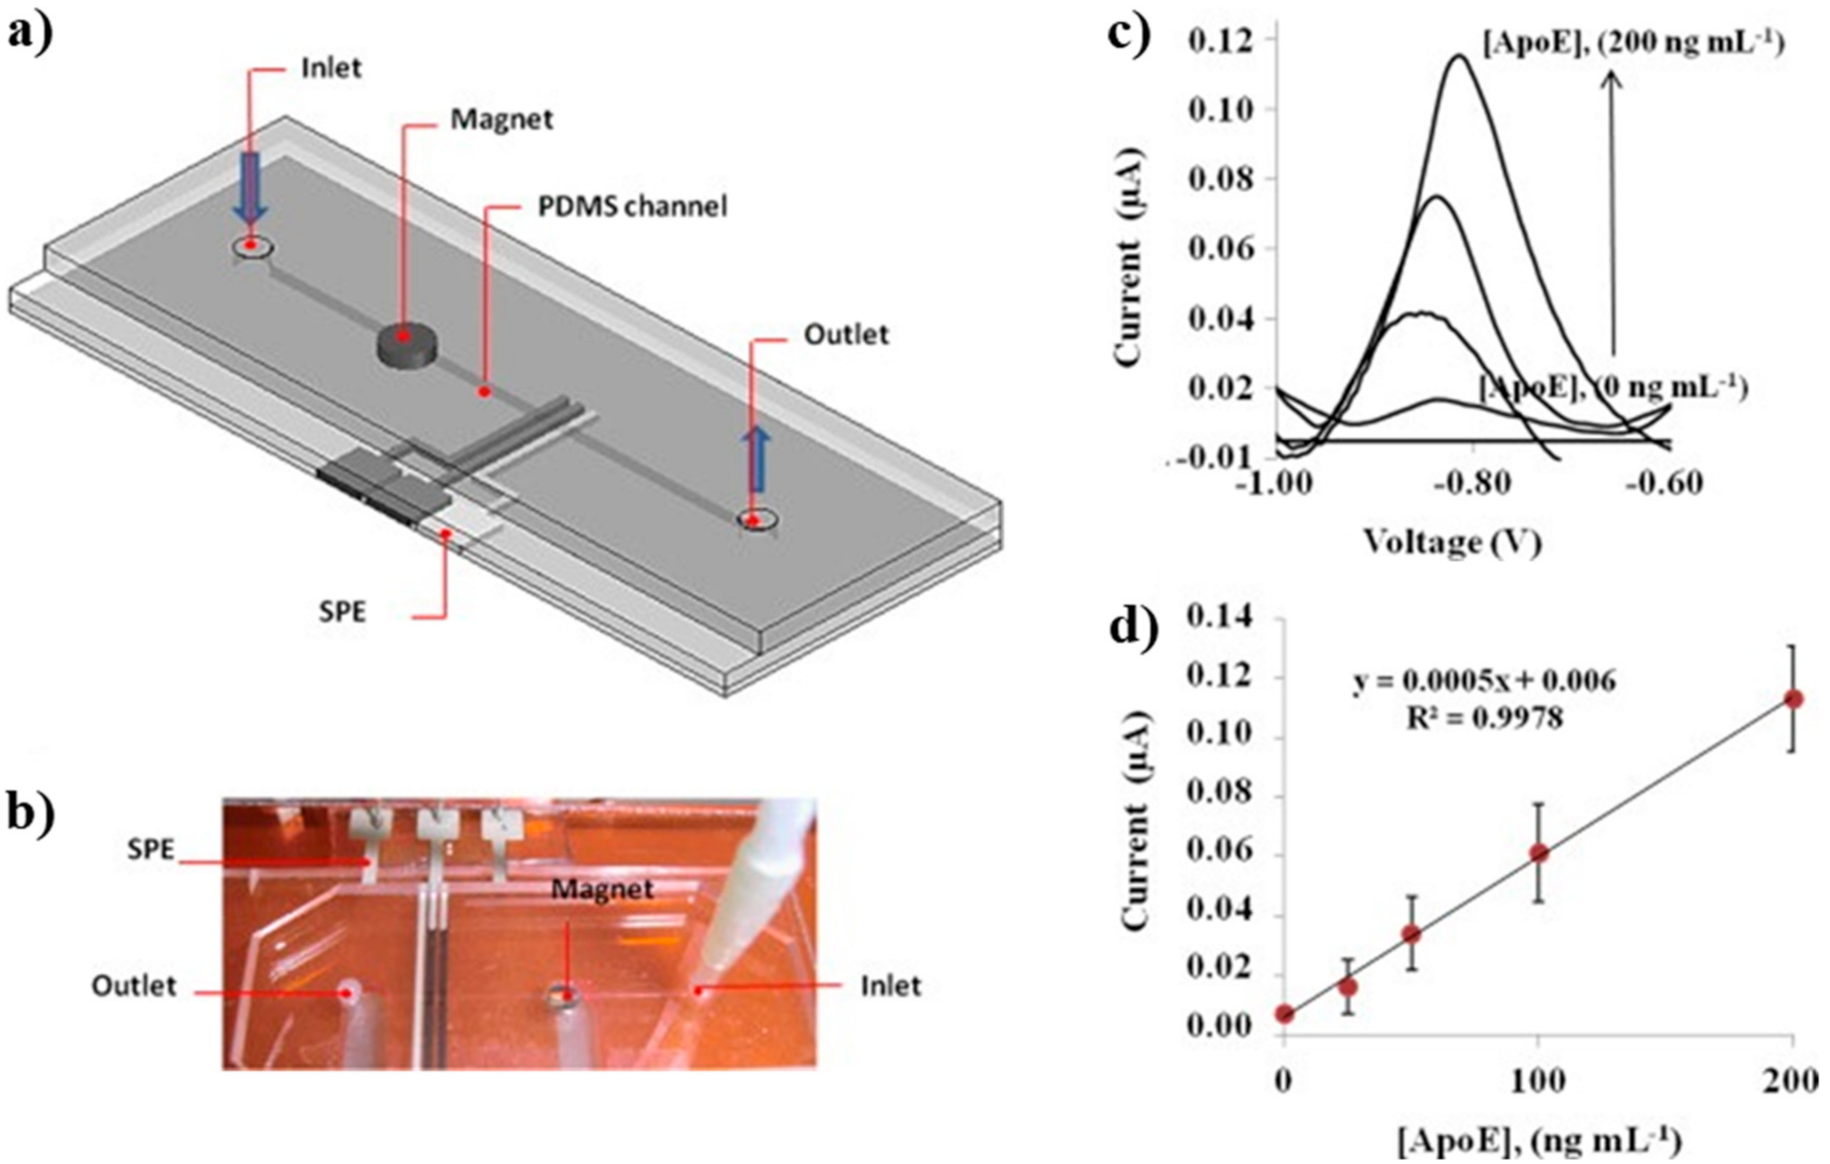
3. Nanoparticles as Labels for Electrochemical Applications

The inherent instability and other shortcomings associated with enzyme labels have promoted the use of nanoparticles as their substituent. Nanoparticles have many advantages over natural enzymes. The redox current generated from the redox properties enables them to be used as an easy label without any additional steps or reactions in electrochemical immunosensor applications. Some of the well-explored nanoparticle labels include Au NPs [23] and Ag NPs [24], whereas nanoparticle labels such as multimetallic nanoparticles [25], metal oxide nanoparticles [26,27], and metal sulfide nanoparticles [28] have also been explored with interesting applications.
Gold particles of nano dimension have attracted attention because of the stability [29], ease of conjugation with biomolecules [30], affinity towards thiol (-SH2) group [31], and the shape- and size-related quantum effects [32]. Au NPs serve as an ideal label for electrochemical assay for biomolecules. Various ultrasensitive assays are reported by using Au NPs as the label. Oliveira et al. [33] reported an ultrasensitive magnetoimmuno-assay for the determination of Salmonella typhimurium by using a low-cost, disposable microfluidic device (DμFD). Here, the Salmonella typhimurium was separated from the samples by capturing with a monoclonal anti-Salmonella antibody modified magnetic beads (Figure 3). This was followed by the addition of Au NPs labeled polyclonal anti-Salmonella antibody to form a magneto-immunoconjugate, which was then injected onto the microfluidic device and captured by placing magnets behind the working electrodes. Finally, the electrochemical response from the labeled Au NPs was used for the determination of the Salmonella typhimurium.
Liao et al. [34] reported an interesting strategy for the determination of goat anti-rabbit IgG by using Au NPs as label. Here, the autocatalytic decomposition of Au ions onto the Au NPs and the resulting enlarged Au NPs resulted in a three times amplification of the electrochemical assay compared to Au NPs in the conventional assay. Mao et al. [35] reported an assay for the determination of HIgG by using Au NPs as the label. Here, a chemical reaction between avidin and dethiobiotin in the presence of the vitamin biotin resulted in the cyclic accumulation of Au NPs, and the resultant signal was used for the quantification of IgG up to 0.1 ng/mL. Another interesting example of Au NPs as the label for electrochemical immunoassay was reported by Leng et al. [36]. Here, the capture of Au NPs labeled antibodies and a sandwich format on a disposable chip resulted in the crosstalk-free simultaneous determination of HIgG and GIgG (Figure 4).
The excellent electroactivity combined with well-defined sharp voltammetric oxidation peak makes Ag NPs an excellent choice for electroanalytical applications [37]. In one report, Ag tags were employed for the detection of PSA at fg/mL levels [38]. Miao et al. [24] reported melamine functionalized Ag nanoparticles as label for the determination of important therapeutic agent clenbuterol (Figure 5). Here, the solid-state reaction of Ag/AgCl resulted in sharp, well-defined silver stripping peaks, and an LOD of 10 pM for clenbuterol was achieved.

4. Quantum Dots (QDs) as Labels for Electrochemical Applications

QDs are nanostructured and zero-dimensional materials defined as semiconductor structures [39]. Besides the properties of semiconductor metal oxides, QDs exhibit photochemical [40], magnetic [41], optoelectrical [42], and catalytic properties [43]. Since the demonstration of water-soluble and biocompatible QDs [44,45], research on the synthesis of QDs for biosensing applications has gained considerable momentum, and many QDs, such as CdS and CdTe, have been reported and used as labels for electrochemical bio-sensing applications. An ultrasensitive immunoassay for protein HIgG by using CdTe QDs as an electrochemical label was reported by Cui et al. [46]. The method demonstrated a sensitive assay with results consistent in comparison with ELISA (Figure 6).
Hu et al. reported CdTe QDs as DNA labels on nanoporous gold leaf electrodes (NPGL) for the ultrasensitive DNA analysis by using electrochemiluminescence as the electrochemical technique (Figure 7). Here, the remarkably increased sensitivity of the assay was attributed to the ultra-thin nanoporous nature of the electrode. The NPGL electrode was first modified with thioglycolic acid (TGA) which was then conjugated to amino-modified c-DNA. Following that, the hybridization of probe DNA with t-DNA yielded sandwich-type hybrids on the nanoporous electrode. The amino end group of the sandwich hybrids was then labeled with mercaptopropionic acid capped CdTe QDs. Finally, the ECL emission of the CdTe QD-labeled electrode was measured by scanning between 0 to −2 V in the presence of peroxydisulfate ion (S2O82−) as a co-reactant. The ECL intensity recorded was correlated to t-DNA concentration in the linear range of 5 × 10⁻¹⁵ − 1 × 10⁻¹¹ M. The study also proposes the possibility of using the ECL DNA assay protocol for the determination of mRNA in cell extracts [47].
Sánchez et al. proposed a cadmium-selenide/zinc-sulfide (CdSe@ZnS) quantum dots (QDs)-based on-chip magneto-immunoassay for the SWASV-based electrochemical detection of Alzheimer’s biomarker ApoE [48]. The electrochemical sensing platform was established by integrating screen-printed electrodes on to a hybrid polydimethylsiloxane-polycarbonate microfluidic chip with tosyl activated magnetic beads as a preconcentration platform (Figure 8). The ApoE was quantified with a limit of detection of ~12.5 ng/mL with a linear range of 10–200 ng/mL. The method was successful for the accurate determination of ApoE from diluted human plasma.

5. Redox-Active Molecules as Labels for Electrochemical Applications

The redox current from redox probes can serve as an excellent label for electrochemical applications. Li et al. [49] reported ferrocene-loaded polyelectrolyte nanoparticles on the CaCO3 template as a label for the detection of oral cancer biomarker IL-6. The ferrocene redox current from square wave voltammetry was exploited for the selective and sensitive determination of interleukin-6 with a wide linear range of 0.002–20 ng/mL, and a low detection limit of 1 pg/mL (Figure 9). Ning et al. [50] reported an ultrasensitive electrochemical sensor for avian leukosis virus-based on differential pulse voltammetry using β-cyclodextrin-nanogold-ferrocene host-guest label on a perylene-3,4,9,10-tetracarboxylic acid-functionalized graphene composite (GR-PTCA). The abundance of polycarboxylic sites on GR-PTCA and the excellent electrical conductivity was suitable for the immobilization of primary antibodies and promoted electron transfer. As shown in Figure 10, signal amplification was achieved by the strong binding of β-cyclodextrin with ferrocene-gold nanoparticles. The sensor achieved linearity for the determination of avian leukosis virus in the concentration range of 102.0–104.0 TCID50/mL, and a low detection limit of 101.93 TCID50/mL. Mohammadniaei et al. [5] reported an interesting redox-active molecule labeled electrochemical biosensor and signal amplification strategy based on Mxene and Au NPs. Here, the combination of methylene blue and ferrocene labeled single-stranded DNAs on Au NPs decorated Mxene nanosheets resulted in the rapid and multiple quantifications of microRNAs. The Mxene decorated with Au NPs provided a four-time electrochemical signal enhancement compared to Au NPs/Au electrode due to the surface area enhancement and charge mobility increment of the electrode. The method was successfully applied for the attomolar detection of miR-21 and miR-141 with a wide linear range (500 aM–50 nM).

6. Low Dimensional Carbon Materials as Ultrasensitive Labels

Graphene and graphene-related materials are renowned for exceptional electrical, chemical, thermal, mechanical, and optical properties [51,52,53,54,55]. The significant interest of graphene and related materials in electrochemical applications is mainly due to the large surface area and the fast charge transfer kinetics [56,57,58,59,60,61]. These unique features also make them promising signaling labels for bio-recognition events in biosensing applications. Graphene and related materials can serve as a “Direct label” or “Indirect label” for signal generation in immunoassays [62]. The direct labeling strategy exploits the working signal generated from the reduction of the oxygen-containing groups, whereas the indirect label strategy relies on the graphene labels modified with other electroactive probes for the generation of working signal [57]. Bonanni et al. [63] reported graphene oxide as a direct label for the detection of DNA polymorphism (Figure 11). Here, the DNA probes were immobilized on a carbon electrode followed by hybridization with a DNA sequence showing single nucleotide polymorphism, and a non-complementary sequence was used as the negative control. The hybrid modified electrodes were able to conjugate to different amounts of graphene oxide because of the differential affinity of graphene towards single and double-strand DNA. The reduction signal generated from the conjugated hybrid-electrode were able to discriminate the single nucleotide polymorphism at 10 nM level in the analyzed sequences.
In the indirect labeling strategy, the working signal is not directly generated from the graphene. Here, an electroactive species was added during the detection process and the graphene label serves to promote the transfer of electrons. An interesting example is the impedimetric determination of adenosine triphosphate (ATP) reported by Wang et al. [64]. Here, a decrease in the charge transfer resistance (Rct) of the system was observed when an ATP-aptamer modified Au electrode was adsorbed with graphene (Figure 12). The aptamer-analyte complex formed in the presence of ATP prevented the graphene interaction with ATP-aptamer resulted in a higher Rct.
The remarkable one–dimension conductance [65] and the possibility of specific biomolecule adsorption [66,67] on the surface have prompted the application of CNTs as an efficient label for biosensing applications. Adeyabeba Abera and Jin–Woo Choi [68] reported a lateral flow–based novel immune assay based on MWCNTs as a label for the determination of HIgG. Here, the HIgG was first immobilized on the surface of bare MWCNTs and applied on a lateral flow immunosensor (Figure 13). The MWCNT–HIgG conjugate formed a conducting network, which was then captured at the capture zone by an immobilized protein. The conductivity at the capture zone varied with the amount of HIgG binding with MWCNT and a simple resistance measurement quantified the HIgG. The method was able to quantify HIgG in the range of 25–200 μg/mL without the requirement for an amplification step.
Even though the correct choice of the label and the electrochemical technique is to be determined from the application perspective, labels combined with suitable electrochemical techniques often result in sensitive assays helps overcome various challenges such as low detection limit and high sensitivity. Table 1 summarizes the various categories of electroactive materials (redox-activity or electrocatalytic activity towards secondary reactions) reported as labels in electrochemical applications. It is noteworthy that sensitive assays resulting from the combination of labels and electrochemical techniques are advantageous for POC devices and real sample analysis.

7. Summary and Outlook

With the advancement in electrochemical techniques, various ultrasensitive materials such as enzymes, nanoparticles, redox-active molecules, quantum dots, low dimensional carbon materials, etc. have been reported as labels for the sensitive and selective determinations of target analytes. This review focuses on the advancement and advantages of various labels combined with electrochemical techniques to meet the high requirements for biomedical applications over the past few decades. Several fabrication methods and novel functionalization methods are discussed, while some interesting techniques are emphasized in detail in this review. Each of these labels has advantages and drawbacks that should be balanced with the needs of a specific application. By analyzing the design of various types of labels, the trend of designing new multifunctional labels can be pointed out. However, numerous obstacles, such as the reproducibility and scope for massive production, remain for the commercial utilization of these ultrasensitive labeled sensors. More systematic studies involving the optimization of different labeling protocols are still needed.

Author Contributions

A.K.: conceptualization; methodology; validation; writing—original draft preparation, M.-H.L.; writing—review and editing; project administration; funding acquisition. All authors have read and agreed to the published version of the manuscript.

Funding

This work was supported by the Chung-Ang University Research Grants in 2019 and by the Ministry of Trade, Industry and Energy (Grant no. 20000580).

Institutional Review Board Statement

Not applicable.

Informed Consent Statement

Not applicable.

Acknowledgments

Authors wish to thank Chung-Ang University for the Research Grants in 2019.

Conflicts of Interest

The authors declare no conflict of interest.

Abbreviations

AFPAlpha-fetoprotein
Ag NPsSilver nanoparticles
ALPAlkaline phosphatase
anti-tTGAnti-tissue transglutaminase immunoglobulin A antibodies
ApoEApolipoprotein E
ATPAdenosine triphosphate
Au NPsGold nanoparticles
BSABovine serum albumin
CA125Carcinoma antigen 125
CdS QDsCadmium sulfide quantum dots
CdSe@ZnS QDsCadmium selenide@Zinc sulfide quantum dots
CdTe QDsCadmium telluride quantum dots
CEACarcinoembryonic antigen
cTnICardiac troponin I
cTnTCardiac troponin T
Cu NPsCopper nanoparticles
CVCyclic voltammetry
CVsCyclic voltammograms
DNADeoxyribonucleic acid
DPVDifferential pulse voltammetry
DT-DDT-Diaphorase
DμFDDisposable microfluidic device
E. coliEscherichia coli
ECLElectrochemiluminescence
EISElectrochemical impedance spectroscopy
Fe3O4 NPsFerromagnetic nanoparticles
G6PDHGlucose-6-phosphate dehydrogenase
GCEGlassy carbon electrode
GIgGGoat immunoglobulin G
GNGraphene
GO NPsGraphene oxide nanoparticles
GOGraphene oxide
GOxGlucose oxidase
GPDHGlycerol-3-phosphate dehydrogenase
GSHGlutathione
HgSe NPsMercury selenide nanoparticles
HIgGHuman Immunoglobulin G
HRPHorseradish peroxidase
IgGImmunoglobulin G
IL-6Interleukin-6
Ir NPsIridium nanoparticles
IrO2 NPsIridium oxide nanoparticles
ITOIndium tin oxide
LOxLactate oxidase
LSVLinear sweep voltammetry
MBsMagnetic beads
miR-141MicroRNA 141
miR-21MicroRNA 21
MoS2 NPsMolybdenum disulfide nanoparticles
MSNsMesoporous silica nanoparticles
MSOMercury-specific oligonucleotide
MWCNTMulti-walled carbon nanotubes
NPsNanoparticles
ORROxygen reduction reaction
PAPp-aminophenol
PAPGp-aminophenyl galactopyranoside
PBSSodium phosphate buffer
PCBPolychlorinated biphenyls
Pd NPsPalladium nanoparticles
PDBEPolybrominated diphenyl ethers
PECPhotoelectrochemical
POCPoint-of-care
PSAProstate specific antigen
Pt NPsPlatinum nanoparticles
PTHParathyroid hormone
QDs Quantum Dots
RctCharge transfer resistance
RIgGRabbit immunoglobulin G
S. typhiSalmonella typhimurium
SARSSevere acute respiratory syndrome
SEMScanning electron microscope
SPEsScreen-printed electrodes
ssDNASingle stranded DNA
SWASVSquare wave anodic stripping voltammetry
SWCNTSingle walled carbon nanotubes
SWSVSquare wave stripping voltammetry
SWVSquare wave voltammetry
TCIDTissue culture infective dose
t-DNATransfer DNA
TEMTransmission electron microscopy
TGAThioglycolic acid
TiO2 NPsTitanium dioxide nanoparticles
TMB3,3′,5,5′-Tetramethylbenzidine
XPSX-ray photoelectron spectroscopy
ZnS NPsZinc sulfide nanoparticles
α-SYNα-Synuclein
β-galβ-galactosidase

References

  1. Carr, O.; Raymundo-Pereira, P.A.; Shimizu, F.M.; Sorroche, B.P.; Melendez, M.E.; de Oliveira, P.R.; Oliveira, O.N., Jr. Genosensor made with a self-assembled monolayer matrix to detect MGMT gene methylation in head and neck cancer cell lines. Talanta 2020, 210, 120609. [Google Scholar] [CrossRef] [PubMed]
  2. Raymundo-Pereira, P.A.; Shimizu, F.M.; Coelho, D.; Piazzeta, M.H.O.; Gobbi, A.L.; Machado, S.A.S. A Nanostructured Bifunctional platform for Sensing of Glucose Biomarker in Artificial Saliva: Synergy in hybrid Pt/Au surfaces. Biosens. Bioelectron. 2016, 86, 369–376. [Google Scholar] [CrossRef] [PubMed]
  3. Dos Santos Pereira, T.; Mauruto de Oliveira, G.C.; Santos, F.A.; Raymundo-Pereira, P.A.; Oliveira, O.N.; Janegitz, B.C. Use of zein microspheres to anchor carbon black and hemoglobin in electrochemical biosensors to detect hydrogen peroxide in cosmetic products, food and biological fluids. Talanta 2019, 194, 737–744. [Google Scholar] [CrossRef]
  4. Chen, Z.; Zhang, X.; Yang, R.; Zhu, Z.; Chen, Y.; Tan, W. Single-walled carbon nanotubes as optical materials for biosensing. Nanoscale 2011, 3, 1949–1956. [Google Scholar] [CrossRef] [PubMed]
  5. Mohammadniaei, M.; Go, A.; Chavan, S.G.; Koyappayil, A.; Kim, S.E.; Yoo, H.J.; Min, J.; Lee, M.H. Relay-race RNA/barcode gold nanoflower hybrid for wide and sensitive detection of microRNA in total patient serum. Biosens. Bioelectron. 2019, 141, 111468. [Google Scholar] [CrossRef]
  6. Sahoo, H. Fluorescent labeling techniques in biomolecules: A flashback. RSC Adv. 2012, 2, 7017–7029. [Google Scholar] [CrossRef]
  7. Wang, C.; Chen, Y.; Wang, T.; Ma, Z.; Su, Z. Monodispersed Gold Nanorod-Embedded Silica Particles as Novel Raman Labels for Biosensing. Adv. Funct. Mater. 2008, 18, 355–361. [Google Scholar] [CrossRef]
  8. Takamura, T.; Morimoto, Y.; Sandhu, A. Planar Microfluidic System Based on Electrophoresis for Detection of 130-nm Magnetic Labels for Biosensing. Jpn. J. Appl. Phys. 2011, 50, 04DL10. [Google Scholar] [CrossRef]
  9. Zhou, Y.; Chen, S.; Luo, X.; Chai, Y.; Yuan, R. Ternary Electrochemiluminescence Nanostructure of Au Nanoclusters as a Highly Efficient Signal Label for Ultrasensitive Detection of Cancer Biomarkers. Anal. Chem. 2018, 90, 10024–10030. [Google Scholar] [CrossRef]
  10. Zoski, C.G. Nanoscale scanning electrochemical microscopy: Emerging advances in applications and theory. Curr. Opin. Electrochem. 2017, 1, 46–52. [Google Scholar] [CrossRef]
  11. Sadik, O.A.; Aluoch, A.O.; Zhou, A. Status of biomolecular recognition using electrochemical techniques. Biosens. Bioelectron. 2009, 24, 2749–2765. [Google Scholar] [CrossRef] [PubMed]
  12. Barry, S.; O’Riordan, A. Electrochemical nanosensors: Advances and applications. Rep. Electrochem. 2016, 6, 1. [Google Scholar]
  13. Liu, Z.; Qi, W.; Xu, G. Recent advances in electrochemiluminescence. Chem. Soc. Rev. 2015, 44, 3117–3142. [Google Scholar] [CrossRef] [PubMed] [Green Version]
  14. Batchelor-McAuley, C.; Kätelhön, E.; Barnes, E.O.; Compton, R.G.; Laborda, E.; Molina, A. Recent advances in voltammetry. ChemistryOpen 2015, 4, 224. [Google Scholar] [CrossRef] [Green Version]
  15. Mirceski, V.; Gulaboski, R. Recent achievements in square-wave voltammetry (a review). Maced. J. Chem. Chem. Eng. 2014, 33, 1–12. [Google Scholar]
  16. Lawrence, N.S.; Beckett, E.L.; Davis, J.; Compton, R.G. Advances in the voltammetric analysis of small biologically relevant compounds. Anal. Biochem. 2002, 303, 1–16. [Google Scholar] [CrossRef]
  17. Trojanowicz, M.; Szewczynska, M.; Wcislo, M. Electroanalytical flow measurements—Recent advances. Electroanal. Int. J. Devoted Fundam. Pract. Asp. Electroanal. 2003, 15, 347–365. [Google Scholar] [CrossRef]
  18. Grieshaber, D.; MacKenzie, R.; Vörös, J.; Reimhult, E. Electrochemical biosensors-sensor principles and architectures. Sensors 2008, 8, 1400–1458. [Google Scholar] [CrossRef]
  19. O’sullivan, M.; Bridges, J.; Marks, V. Enzyme immunoassay: A review. Ann. Clin. Biochem. 1979, 16, 221–239. [Google Scholar] [CrossRef] [Green Version]
  20. Savage, M.; Mattson, G.; Desai, S.; Nielander, G.; Morgensen, S.; Conklin, E. Avidin-Biotin Chemistry: A Handbook, 2nd ed.; Pierce Chemical Company: Rockford, IL, USA, 1994. [Google Scholar]
  21. Zhao, W.-W.; Chen, R.; Dai, P.-P.; Li, X.-L.; Xu, J.-J.; Chen, H.-Y. A General Strategy for Photoelectrochemical Immunoassay Using an Enzyme Label Combined with a CdS Quantum Dot/TiO2 Nanoparticle Composite Electrode. Anal. Chem. 2014, 86, 11513–11516. [Google Scholar] [CrossRef]
  22. Kang, C.; Kang, J.; Lee, N.-S.; Yoon, Y.H.; Yang, H. DT-Diaphorase as a Bifunctional Enzyme Label That Allows Rapid Enzymatic Amplification and Electrochemical Redox Cycling. Anal. Chem. 2017, 89, 7974–7980. [Google Scholar] [CrossRef] [PubMed]
  23. De la Escosura-Muñiz, A.; Parolo, C.; Maran, F.; Mekoçi, A. Size-dependent direct electrochemical detection of gold nanoparticles: Application in magnetoimmunoassays. Nanoscale 2011, 3, 3350–3356. [Google Scholar] [CrossRef] [PubMed] [Green Version]
  24. Miao, P.; Han, K.; Sun, H.; Yin, J.; Zhao, J.; Wang, B.; Tang, Y. Melamine Functionalized Silver Nanoparticles as the Probe for Electrochemical Sensing of Clenbuterol. ACS Appl. Mater. Interfaces 2014, 6, 8667–8672. [Google Scholar] [CrossRef] [PubMed]
  25. Russo, L.; Leva Bueno, J.; Bergua, J.F.; Costantini, M.; Giannetto, M.; Puntes, V.; Merkoçi, A. Low-Cost Strategy for the Development of a Rapid Electrochemical Assay for Bacteria Detection Based on Au-Ag Nanoshells. ACS Omega 2018, 3, 18849–18856. [Google Scholar] [CrossRef]
  26. Quesada-González, D.; Baiocco, A.; Martos, A.A.; de la Escosura-Muñiz, A.; Palleschi, G.; Merkoçi, A. Iridium oxide (IV) nanoparticle-based electrocatalytic detection of PBDE. Biosens. Bioelectron. 2019, 127, 150–154. [Google Scholar] [CrossRef] [Green Version]
  27. Li, W.; Fan, G.-C.; Gao, F.; Cui, Y.; Wang, W.; Luo, X. High-activity Fe3O4 nanozyme as signal amplifier: A simple, low-cost but efficient strategy for ultrasensitive photoelectrochemical immunoassay. Biosens. Bioelectron. 2019, 127, 64–71. [Google Scholar] [CrossRef]
  28. Xiong, W.; Wu, S.F.; Liao, F.S.; Hong, N.; Fan, H.; Wei, G.B. A ZnS-Nanoparticle-Label-Based Electrochemical Codeine Sensor. In Applied Mechanics and Materials; Trans Tech Publications Ltd.: Bach, Switzerland, 2017; pp. 173–177. [Google Scholar]
  29. Balasubramanian, S.K.; Yang, L.; Yung, L.-Y.L.; Ong, C.-N.; Ong, W.-Y.; Liya, E.Y. Characterization, purification, and stability of gold nanoparticles. Biomaterials 2010, 31, 9023–9030. [Google Scholar] [CrossRef]
  30. Spampinato, V.; Parracino, M.A.; la Spina, R.; Rossi, F.; Ceccone, G. Surface Analysis of Gold Nanoparticles Functionalized with Thiol-Modified Glucose SAMs for Biosensor Applications. Front. Chem. 2016, 4. [Google Scholar] [CrossRef]
  31. Reimers, J.R.; Ford, M.J.; Halder, A.; Ulstrup, J.; Hush, N.S. Gold surfaces and nanoparticles are protected by Au(0)-thiyl species and are destroyed when Au(I)-thiolates form. Proc. Natl. Acad. Sci. USA 2016, 113, E1424–E1433. [Google Scholar] [CrossRef] [Green Version]
  32. Daniel, M.-C.; Astruc, D. Gold nanoparticles: Assembly, supramolecular chemistry, quantum-size-related properties, and applications toward biology, catalysis, and nanotechnology. Chem. Rev. 2004, 104, 293–346. [Google Scholar] [CrossRef]
  33. De Oliveira, T.R.; Martucci, D.H.; Faria, R.C. Simple disposable microfluidic device for Salmonella typhimurium detection by magneto-immunoassay. Sens. Actuators B Chem. 2018, 255, 684–691. [Google Scholar] [CrossRef]
  34. Liao, K.-T.; Huang, H.-J. Femtomolar immunoassay based on coupling gold nanoparticle enlargement with square wave stripping voltammetry. Anal. Chim. Acta 2005, 538, 159–164. [Google Scholar] [CrossRef]
  35. Mao, X.; Jiang, J.; Chen, J.; Huang, Y.; Shen, G.; Yu, R. Cyclic accumulation of nanoparticles: A new strategy for electrochemical immunoassay based on the reversible reaction between dethiobiotin and avidin. Anal. Chim. Acta 2006, 557, 159–163. [Google Scholar] [CrossRef]
  36. Leng, C.; Lai, G.; Yan, F.; Ju, H. Gold nanoparticle as an electrochemical label for inherently crosstalk-free multiplexed immunoassay on a disposable chip. Anal. Chim. Acta 2010, 666, 97–101. [Google Scholar] [CrossRef] [PubMed]
  37. Tschulik, K.; Batchelor-McAuley, C.; Toh, H.-S.; Stuart, E.J.E.; Compton, R.G. Electrochemical studies of silver nanoparticles: A guide for experimentalists and a perspective. Phys. Chem. Chem. Phys. 2014, 16, 616–623. [Google Scholar] [CrossRef]
  38. Ting, B.P.; Zhang, J.; Khan, M.; Yang, Y.Y.; Ying, J.Y. The solid-state Ag/AgCl process as a highly sensitive detection mechanism for an electrochemical immunosensor. Chem. Commun. 2009, 6231–6233. [Google Scholar] [CrossRef]
  39. Niemeyer, C.M. Nanoparticles, Proteins, and Nucleic Acids: Biotechnology Meets Materials Science. Angew. Chem. Int. Ed. 2001, 40, 4128–4158. [Google Scholar] [CrossRef]
  40. Xiong, H.-M.; Wang, Z.-D.; Xia, Y.-Y. Polymerization Initiated by Inherent Free Radicals on Nanoparticle Surfaces: A Simple Method of Obtaining Ultrastable (ZnO)Polymer Core-Shell Nanoparticles with Strong Blue Fluorescence. Adv. Mater. 2006, 18, 748–751. [Google Scholar] [CrossRef]
  41. Jun, Y.-W.; Lee, J.-H.; Cheon, J. Chemical Design of Nanoparticle Probes for High-Performance Magnetic Resonance Imaging. Angew. Chem. Int. Ed. 2008, 47, 5122–5135. [Google Scholar] [CrossRef]
  42. Leschkies, K.S.; Divakar, R.; Basu, J.; Enache-Pommer, E.; Boercker, J.E.; Carter, C.B.; Aydil, E.S. Photosensitization of ZnO Nanowires with CdSe Quantum Dots for Photovoltaic Devices. Nano Lett. 2007, 7, 1793–1798. [Google Scholar] [CrossRef]
  43. Xu, F.; Zhang, P.; Navrotsky, A.; Yuan, Z.Y.; Ren, T.Z.; Halasa, M.; Su, B.L. Hierarchically Assembled Porous ZnO Nanoparticles:  Synthesis, Surface Energy, and Photocatalytic Activity. Chem. Mater. 2007, 19, 5680–5686. [Google Scholar] [CrossRef]
  44. Bruchez, M.; Moronne, M.; Gin, P.; Weiss, S.; Alivisatos, A.P. Semiconductor Nanocrystals as Fluorescent Biological Labels. Science 1998, 281, 2013–2016. [Google Scholar] [CrossRef] [Green Version]
  45. Chan, W.C.W.; Nie, S. Quantum Dot Bioconjugates for Ultrasensitive Nonisotopic Detection. Science 1998, 281, 2016–2018. [Google Scholar] [CrossRef] [Green Version]
  46. Cui, R.; Pan, H.-C.; Zhu, J.-J.; Chen, H.-Y. Versatile Immunosensor Using CdTe Quantum Dots as Electrochemical and Fluorescent Labels. Anal. Chem. 2007, 79, 8494–8501. [Google Scholar] [CrossRef] [PubMed]
  47. Hu, X.; Wang, R.; Ding, Y.; Zhang, X.; Jin, W. Electrochemiluminescence of CdTe quantum dots as labels at nanoporous gold leaf electrodes for ultrasensitive DNA analysis. Talanta 2010, 80, 1737–1743. [Google Scholar] [CrossRef] [PubMed]
  48. Medina-Sánchez, M.; Miserere, S.; Morales-Narváez, E.; Merkoçi, A. On-chip magneto-immunoassay for Alzheimer’s biomarker electrochemical detection by using quantum dots as labels. Biosens. Bioelectron. 2014, 54, 279–284. [Google Scholar] [CrossRef]
  49. Li, T.; Yang, M.H. Electrochemical sensor utilizing ferrocene loaded porous polyelectrolyte nanoparticles as label for the detection of protein biomarker IL-6. Sens. Actuators B Chem. 2011, 158, 361–365. [Google Scholar] [CrossRef]
  50. Ning, S.; Zhou, M.; Liu, C.; Waterhouse, G.I.N.; Dong, J.; Ai, S. Ultrasensitive electrochemical immunosensor for avian leukosis virus detection based on a β-cyclodextrin-nanogold-ferrocene host-guest label for signal amplification. Anal. Chim. Acta 2019, 1062, 87–93. [Google Scholar] [CrossRef]
  51. Choi, W.; Lee, J. Graphene: Synthesis and Applications; CRC Press: Boca Raton, FL, USA, 2011. [Google Scholar]
  52. Neto, A.H.C.; Guinea, F.; Peres, N.M.R.; Novoselov, K.S.; Geim, A.K. The electronic properties of graphene. RvMP 2009, 81, 109–162. [Google Scholar]
  53. Pop, E.; Varshney, V.; Roy, A.K. Thermal properties of graphene: Fundamentals and applications. MRS Bull. 2012, 37, 1273–1281. [Google Scholar] [CrossRef] [Green Version]
  54. Papageorgiou, D.G.; Kinloch, I.A.; Young, R.J. Mechanical properties of graphene and graphene-based nanocomposites. Prog. Mater. Sci. 2017, 90, 75–127. [Google Scholar] [CrossRef]
  55. Falkovsky, L. Optical properties of graphene. J. Phys. Conf. Ser. 2008, 129, 012004. [Google Scholar] [CrossRef]
  56. Ambrosi, A.; Chua, C.K.; Latiff, N.M.; Loo, A.H.; Wong CH, A.; Eng AY, S.; Pumera, M. Graphene and its electrochemistry—An update. Chem. Soc. Rev. 2016, 45, 2458–2493. [Google Scholar] [CrossRef] [PubMed] [Green Version]
  57. Ambrosi, A.; Chua, C.K.; Bonanni, A.; Pumera, M. Electrochemistry of graphene and related materials. Chem. Rev. 2014, 114, 7150–7188. [Google Scholar] [CrossRef]
  58. Al Hassan, M.; Sen, A.; Zaman, T.; Mostari, M. Emergence of graphene as a promising anode material for rechargeable batteries: A review. Mater. Today Chem. 2019, 11, 225–243. [Google Scholar] [CrossRef]
  59. Macedo, L.J.; Iost, R.M.; Hassan, A.; Balasubramanian, K.; Crespilho, F.N. Bioelectronics and interfaces using monolayer graphene. ChemElectroChem 2019, 6, 31–59. [Google Scholar] [CrossRef]
  60. Szunerits, S.; Boukherroub, R. Graphene-based nanomaterials in innovative electrochemistry. Curr. Opin. Electrochem. 2018, 10, 24–30. [Google Scholar] [CrossRef]
  61. Peterlevitz, A.; May, P.; Harniman, R.; Jones, J.; Ceragioli, H.; Zanin, H. Fast electron transfer kinetics on novel interconnected nanospheres of graphene layers electrodes. Thin Solid Film. 2016, 616, 698–702. [Google Scholar] [CrossRef] [Green Version]
  62. Bonanni, A. Advances on the Use of Graphene as a Label for Electrochemical Biosensors. ChemElectroChem 2020, 7, 4177–4185. [Google Scholar] [CrossRef]
  63. Bonanni, A.; Chua, C.K.; Zhao, G.; Sofer, Z.; Pumera, M. Inherently Electroactive Graphene Oxide Nanoplatelets As Labels for Single Nucleotide Polymorphism Detection. ACS Nano 2012, 6, 8546–8551. [Google Scholar] [CrossRef]
  64. Wang, L.; Xu, M.; Han, L.; Zhou, M.; Zhu, C.; Dong, S. Graphene enhanced electron transfer at aptamer modified electrode and its application in biosensing. Anal. Chem. 2012, 84, 7301–7307. [Google Scholar] [CrossRef] [PubMed]
  65. Charlier, J.-C.; Blase, X.; Roche, S. Electronic and transport properties of nanotubes. Rev. Mod. Phys. 2007, 79, 677–732. [Google Scholar] [CrossRef] [Green Version]
  66. Liu, Z.; Tabakman, S.; Welsher, K.; Dai, H. Carbon nanotubes in biology and medicine: In vitro and in vivo detection, imaging and drug delivery. Nano Res. 2009, 2, 85–120. [Google Scholar] [CrossRef] [Green Version]
  67. Negri, V.; Pacheco-Torres, J.; Calle, D.; López-Larrubia, P. Carbon nanotubes in biomedicine. Top. Curr. Chem. 2020, 378, 15. [Google Scholar] [CrossRef] [PubMed]
  68. Abera, A.; Choi, J.-W. Quantitative lateral flow immunosensor using carbon nanotubes as label. Anal. Methods 2010, 2, 1819–1822. [Google Scholar] [CrossRef]
  69. An, Y.; Tang, L.; Jiang, X.; Chen, H.; Yang, M.; Jin, L.; Zhang, W. A Photoelectrochemical Immunosensor Based on Au-Doped TiO2 Nanotube Arrays for the Detection of α-Synuclein. Chem. Eur. J. 2010, 16, 14439–14446. [Google Scholar] [CrossRef]
  70. Zhao, W.-W.; Ma, Z.-Y.; Yan, D.-Y.; Xu, J.-J.; Chen, H.-Y. In Situ Enzymatic Ascorbic Acid Production as Electron Donor for CdS Quantum Dots Equipped TiO2 Nanotubes: A General and Efficient Approach for New Photoelectrochemical Immunoassay. Anal. Chem. 2012, 84, 10518–10521. [Google Scholar] [CrossRef] [PubMed]
  71. Pakchin, P.S.; Ghanbari, H.; Saber, R.; Omidi, Y. Electrochemical immunosensor based on chitosan-gold nanoparticle/carbon nanotube as a platform and lactate oxidase as a label for detection of CA125 oncomarker. Biosens. Bioelectron. 2018, 122, 68–74. [Google Scholar] [CrossRef]
  72. Del Carlo, M.; Mascini, M. Enzyme immunoassay with amperometric flow-injection analysis using horseradish peroxidase as a label. Application to the determination of polychlorinated biphenyls. Anal. Chim. Acta 1996, 336, 167–174. [Google Scholar] [CrossRef]
  73. Dutta, G.; Park, S.; Singh, A.; Seo, J.; Kim, S.; Yang, H. Low-Interference Washing-Free Electrochemical Immunosensor Using Glycerol-3-phosphate Dehydrogenase as an Enzyme Label. Anal. Chem. 2015, 87, 3574–3578. [Google Scholar] [CrossRef]
  74. Liao, K.-T.; Cheng, J.-T.; Li, C.-L.; Liu, R.-T.; Huang, H.-J. Ultra-sensitive detection of mutated papillary thyroid carcinoma DNA using square wave stripping voltammetry method and amplified gold nanoparticle biomarkers. Biosens. Bioelectron. 2009, 24, 1899–1904. [Google Scholar] [CrossRef] [PubMed]
  75. Shahdost-fard, F.; Salimi, A.; Khezrian, S. Highly selective and sensitive adenosine aptasensor based on platinum nanoparticles as catalytical label for amplified detection of biorecognition events through H2O2 reduction. Biosens. Bioelectron. 2014, 53, 355–362. [Google Scholar] [CrossRef]
  76. Wei, Y.; Li, Y.; Li, N.; Zhang, Y.; Yan, T.; Ma, H.; Wei, Q. Sandwich-type electrochemical immunosensor for the detection of AFP based on Pd octahedral and APTES-M-CeO2-GS as signal labels. Biosens. Bioelectron. 2016, 79, 482–487. [Google Scholar] [CrossRef] [PubMed]
  77. Wang, Z.; Han, P.; Mao, X.; Yin, Y.; Cao, Y. Sensitive detection of glutathione by using DNA-templated copper nanoparticles as electrochemical reporters. Sens. Actuators B Chem. 2017, 238, 325–330. [Google Scholar] [CrossRef]
  78. Miao, L.; Jiao, L.; Zhang, J.; Li, H. Amperometric sandwich immunoassay for the carcinoembryonic antigen using a glassy carbon electrode modified with iridium nanoparticles, polydopamine and reduced graphene oxide. Microchim. Acta 2017, 184, 169–175. [Google Scholar] [CrossRef]
  79. Yang, M.; Li, H.; Javadi, A.; Gong, S. Multifunctional mesoporous silica nanoparticles as labels for the preparation of ultrasensitive electrochemical immunosensors. Biomaterials 2010, 31, 3281–3286. [Google Scholar] [CrossRef]
  80. Bouša, D.; Mayorga-Martinez, C.C.; Mazánek, V.; Sofer, Z.; Boušová, K.; Pumera, M. MoS2 Nanoparticles as Electrocatalytic Labels in Magneto-Immunoassays. ACS Appl. Mater. Interfaces 2018, 10, 16861–16866. [Google Scholar] [CrossRef]
  81. Yang, M.; Javadi, A.; Gong, S. Sensitive electrochemical immunosensor for the detection of cancer biomarker using quantum dot functionalized graphene sheets as labels. Sens. Actuators B Chem. 2011, 155, 357–360. [Google Scholar] [CrossRef]
  82. Martín-Yerga, D.; González-García, M.B.; Costa-García, A. Electrochemical immunosensor for anti-tissue transglutaminase antibodies based on the in situ detection of quantum dots. Talanta 2014, 130, 598–602. [Google Scholar] [CrossRef]
  83. Kara, P.; Ozkan, D.; Kerman, K.; Meric, B.; Erdem, A.; Ozsoz, M. DNA sensing on glassy carbon electrodes by using hemin as the electrochemical hybridization label. Anal. Bioanal. Chem. 2002, 373, 710–716. [Google Scholar] [CrossRef]
  84. García-González, R.; Costa-García, A.; Fernández-Abedul, M.T. Methylene blue covalently attached to single stranded DNA as electroactive label for potential bioassays. Sens. Actuators B Chem. 2014, 191, 784–790. [Google Scholar] [CrossRef] [PubMed]
  85. Blackburn, G.F.; Shah, H.P.; Kenten, J.H.; Leland, J.; Kamin, R.A.; Link, J.; Talley, D.B. Electrochemiluminescence detection for development of immunoassays and DNA probe assays for clinical diagnostics. Clin. Chem. 1991, 37, 1534–1539. [Google Scholar] [CrossRef]
  86. Mohammadniaei, M.; Koyappayil, A.; Sun, Y.; Min, J.; Lee, M.-H. Gold Nanoparticle/MXene for multiple and sensitive detection of OncomiRs based on synergetic signal amplification. Biosens. Bioelectron. 2020, 159, 112208. [Google Scholar] [CrossRef] [PubMed]
  87. Wang, Y.; Wang, P.; Wang, Y.; He, X.; Wang, K. Single strand DNA functionalized single wall carbon nanotubes as sensitive electrochemical labels for arsenite detection. Talanta 2015, 141, 122–127. [Google Scholar] [CrossRef] [PubMed]
Scheme 1. Schematic illustration of various labels combined with electrochemical techniques.
Sensors 21 00089 sch001
Figure 1. (a) Schematics of the photoelectrochemical immunoassay for the detection of cTnT using the β- galactosidase tags. (b) XPS spectrum of the CdS QDs/TiO2 NPs electrode (the inset above shows the SEM image of the TiO2 NPs film and below shows the TEM image of the CdS QDs). (c) Photoelectrochemical responses of the TiO2 NPs electrode (i), after loading with the CdS QDs (ii), and in the presence of 10 mM PAP (iii). (d) Photocurrent response from the CdS QDs/TiO2 NPs electrode (step 1), the electrode after immobilization with Ab1 and BSA blocking (step 2), after target recognition (step 3), after complexing with Ab2 (step 4), and after incubation in 10 mM PAPG (step 5) (the inset above shows the effect of PAPG on the photocurrent intensity in the presence of 1.0 × 10⁻⁶ g/mL of cTnT, and the inset below shows the photoelectrochemical response as a function of pH). (e) Photocurrent of the immunoassay in the presence of different cTnT concentrations (the inset shows the selectivity of the sensor in the presence of PSA, IgG, and the mixed sample). Reproduced with permission from [21] Copyright © 2020, American Chemical Society.
Sensors 21 00089 g001
Figure 2. (a) Schematics of the electrochemical immunosensor using DT-diaphorase as an enzyme label. (b) Cyclic voltammograms (CVs) obtained at the bare indium tin oxide (ITO) electrodes in (i) tris buffer of pH 7.5, (ii) mixture of 1-nitroso-2-naphthol and NADH, (iii) mixture of 4-nitroso-1-naphthol and NADH, (iv) mixture of 4-nitrosophenol and NADH at a scan rate of 20 mV/s after 10 min. incubation period at 25 °C. (c) CVs obtained at the bare ITO electrodes in (i) tris buffer of pH 7.5 containing NADH, 4-nitroso-1-naphthol, and DT-diaphorase, (ii) tris buffer of pH 7.5 containing NADH, 4-nitrosophenol, and DT-diaphorase. (d) CVs obtained at the bare ITO electrodes in (i) tris buffer of pH 7.5 containing NADH, Diaphorase, and 4-nitroso-1-naphthol, (ii) tris buffer of pH 7.5 containing NADH, nitroreductase, and 4-nitroso-1-naphthol. (e) CVs obtained at the bare ITO electrodes in (i) tris buffer of pH 9.0 containing NADH, 4-nitroso-1-naphthol, and DT-diaphorase, and (ii) PBS of pH 7.4 containing 4-nitroso-1-naphthol, NADH, and DT-diaphorase. Reproduced with permission from reference [22]. Copyright © 2020 American Chemical Society.
Sensors 21 00089 g002
Figure 3. (a) Schematic illustration showing the steps involved in the offline Salmonella typhimurium capture with MB-AB1 followed by washing. (b) The formation of MB-Ab1/S. typhi/Ab2-AuNP magneto-immunoconjugate after the addition of Ab2-AuNP. (c) DPV curves for the S. typhi detection (0–100 cells/mL of bacteria) in PBS-T20 (pH 7.4). (d) The corresponding calibration curve (n = 8). (e) DPV curves obtained for the determination of Salmonella typhimurium (0–100 cells/mL) from milk sample using a single DμFD. (f) Specificity study of the immunoassay, including negative control (concentration of 25 cells/mL for each bacteria). Reproduced with permission from reference [33]. Copyright © 2020 Elsevier B.V.
Sensors 21 00089 g003
Figure 4. (a) Schematics of the preparation of immunosensor array for the simultaneous detection of HIgG and GIgG. (b) DPV responses for the simultaneous multiplexed detection of HIgG (5–600 ng/mL), and (c) GIgG (5–500 ng/mL) using Au NPs as a label. Insets show the corresponding calibration curves. Reproduced with permission from reference [36]. Copyright © 2020 Elsevier B.V.
Sensors 21 00089 g004
Figure 5. (a) Schematics of the melamine-silver nanoparticles (M-Ag NPs)-based sensor for clenbuterol determination. (b) CV response of the sensor in the presence of (A) 0, and (B) 1 nM clenbuterol. (C) melamine modified Au electrode at a scan rate of 100 mV/s in the presence of 0.1 M KCl. (c) The LSV response of the sensor in the presence of different concentrations of clenbuterol (0–100 nM). Inset shows the corresponding linear calibration plot (n = 3). Reproduced with permission from [24]. Copyright © 2020 American Chemical Society.
Sensors 21 00089 g005
Figure 6. (a) Schematics of the CdTe QDs label-based immunoassay for the detection of protein. (b) Square wave voltammograms for the determination of HIgG (0–100 ng/mL). (c) The corresponding calibration curve on a semilog scale. Reproduced with permission from [46]. Copyright © 2020, American Chemical Society.
Sensors 21 00089 g006
Figure 7. (a) Schematics of the process of DNA determination. (b) Electro chemiluminescent current (IECL) vs. potential (E) curves for the CdTe Quantum dot-labeled DNA hybrids immobilized on the nanoporous gold leaf electrode for different t-DNA concentrations (the inset shows the linear relationship between Im,ECL on the IECL-E curves and the t-DNA concentration). (c). A magnified portion of the IECL-E curve. Reproduced with permission from [47]. Copyright © 2020 Elsevier B.V.
Sensors 21 00089 g007
Figure 8. (a) Schematics of the electrochemical immunosensing system for ApoE detection. (b) Microfluidic platform integrated with screen–printed electrodes, and the picture of actual the set–up. (c) Square wave voltammograms of the ApoE–immunoassay in the presence of different concentrations of ApoE (0–200 ng/mL) using QDs as electrochemical labels (Electrochemical conditions; −1.1 V of deposition potential for 120 s; stripping between −1.1–−0.15 V; V scan rate = 10 mV/s; Frequency = 25 Hz; and flow rate = 5 μL/min). (d) The calibration plot for the standard sample of ApoE. Reproduced with permission from [48]. Copyright © 2020 Elsevier B.V.
Sensors 21 00089 g008
Figure 9. (a) Schematics of the fabrication of ferrocene loaded porous polyelectrolyte nanoparticles–Ab2 and (b) the immunosensor. (c) SWV response of the immunosensor towards different concentrations of interleukin–6 (0.01–20 ng/mL). Scanning the potential window was from 0–0.4 V with a frequency of 25 Hz using a 5–mV potential step and 25 mV amplitude. The insert is the corresponding calibration curve. Reproduced with permission from reference [49]. Copyright © 2020 Elsevier B.V.
Sensors 21 00089 g009
Figure 10. (a) Schematics of the fabrication of Ferrocene–AuNP–β–cyclodextrin–Ab2, (b) GR–PTCA, and (c) the electrochemical immunosensor. (d) The DPV responses of the immunosensor in the presence of varying concentrations of avian leukosis virus (102.0–104.0TCID50/mL). (e) The linear calibration plot for the determination of avian leukosis virus. Reproduced with permission from reference [50]. Copyright © 2020 Elsevier B.V.
Sensors 21 00089 g010
Figure 11. (a) Schematics of the experimental protocol, (i) after complementary target hybridization, (ii) one–mismatch target, and (iii) non–complementary target. (b) Voltammetric response towards different target DNAs in the case of hybridization with wild–type (red line), mutant (blue line), and non–complementary (black line). (c) Voltammetric signal for conjugation with different amounts of GO NPs in the case of hybridization with wild–type (red bars), mutant (blue bars), and nc (black bars) sequences (n = 3). Reproduced with permission from Ref. [63]. Copyright (2012) American Chemical Society.
Sensors 21 00089 g011
Figure 12. (a) Schematics of the sensing platform for the detection of ATP. (b) EIS response on the ABA/Au electrode after reacting with different concentrations of ATP (4 mM–0.1 μM) for 1 h and incubation with 0.3 mg/mL GN. (c) The corresponding relationship between Rct and ATP concentration (n = 3). (d) EIS response on (i) MSO/Au film, (ii) MSO/Au film incubated with GN, and (iii) MSO/Au reacted with 800 nM Hg2+ and then incubated with the GN. (e) The linear relationship between the EIS and the concentration of Hg2+. Reproduced with permission from reference [64]. Copyright © 2020 American Chemical Society.
Sensors 21 00089 g012
Figure 13. (a) Schematics of the quantitative lateral flow immunoassay using CNTs as label. (b) The lateral flow immunosensor (7 mm width) with varying concentrations of HIgG. (c) The plot of the electrical resistance at the capture zones vs. HIgG concentration. Reproduced with permission from reference [68]. Copyright © 2020 Royal Society of Chemistry.
Sensors 21 00089 g013
Table 1. Literature comparison of the analytical performance of various labels reported for electrochemical applications.
Label TypeLabelElectrochemical TechniqueTargetLinear RangeLODRef.
Enzymesβ-galPECcTnT----1.0 × 10⁻⁷ g/L[21]
DT-DChronocoulometryPTH2 pg/mL
-
1 μg/mL
2 pg/mL[22]
GOxPECα-SYN50 pg/mL
-
100 ng/mL
34 pg/mL[69]
ALPPECPSA----0.5 ng/mL[70]
LOxAmperometryCA1250.01–100U/mL0.002 U/mL[71]
HRPAmperometryPCB0.1–50 μg/mL0.1 μg/mL[72]
GPDHChronocoulometrycTnI----10 pg/mL[73]
NanoparticlesAg NPsLSVClenbuterol0.01–100 nM0.01 nM[24]
ZnS NPsDPVCodeine73 pM
-
73 nM
37 pM[28]
Au NPsSWSVDNA0.52–1300 aM0.35 aM[74]
Au-Ag NPsDPVE. coli----102 CFU/mL[25]
Pt NPsLSVAdenosine1–750 nM1 nM[75]
Pd NPsAmperometryAFP0.1–50,000 pg/mL0.033 pg/mL[76]
Cu NPsDPVGSH1–1000 nM0.27 nM[77]
Ir NPsAmperometryCEA0.5–5000 pg/mL0.23 pg/mL[78]
IrO2 NPsAmperometryPDBE----21.5 ppb[26]
Fe3O4 NPsPECPSA0.05–1000 pg/mL18 fg/mL[27]
MSNsAmperometryHIgG0.01–10 ng/mL5 pg/mL[79]
MoS2 NPsAmperometryRIgG----1.94 pg/mL[80]
Quantum dotsCdS QDsSWVPSA0.005–10 ng/mL3 pg/mL[81]
CdTe QDsSWVHIgG0.005–100 ng/mL5 pg/mL[46]
CdSe@ZnS QDsDPVanti-tTG IgG0–40 U/mL2.2 U/mL[82]
Redox-active moleculesHeminDPVDNA----2.35 ng/mL[83]
Methylene blueDPVSARS DNA1–25 μM800 nM[84]
Ru(bpy)32+ECLCEA0.2–2000 μg/L200 ng/L[85]
FerroceneDPVmiR-141500 aM-50 nM138 aM[86]
Low dimensional carbon materialsSWCNTDPVArsenite0.5–10 ppb0.5 ppb[87]
GODPVDNA----500 pM[63]
MWCNTElectrical resistanceHIgG25–200 μg/mL----[68]
‘----’ Data not provided in the literature.
Publisher’s Note: MDPI stays neutral with regard to jurisdictional claims in published maps and institutional affiliations.

