Real-Time Detection for Wheat Head Applying Deep Neural Network

Abstract
1. Introduction
2. Related Work
3. Methods
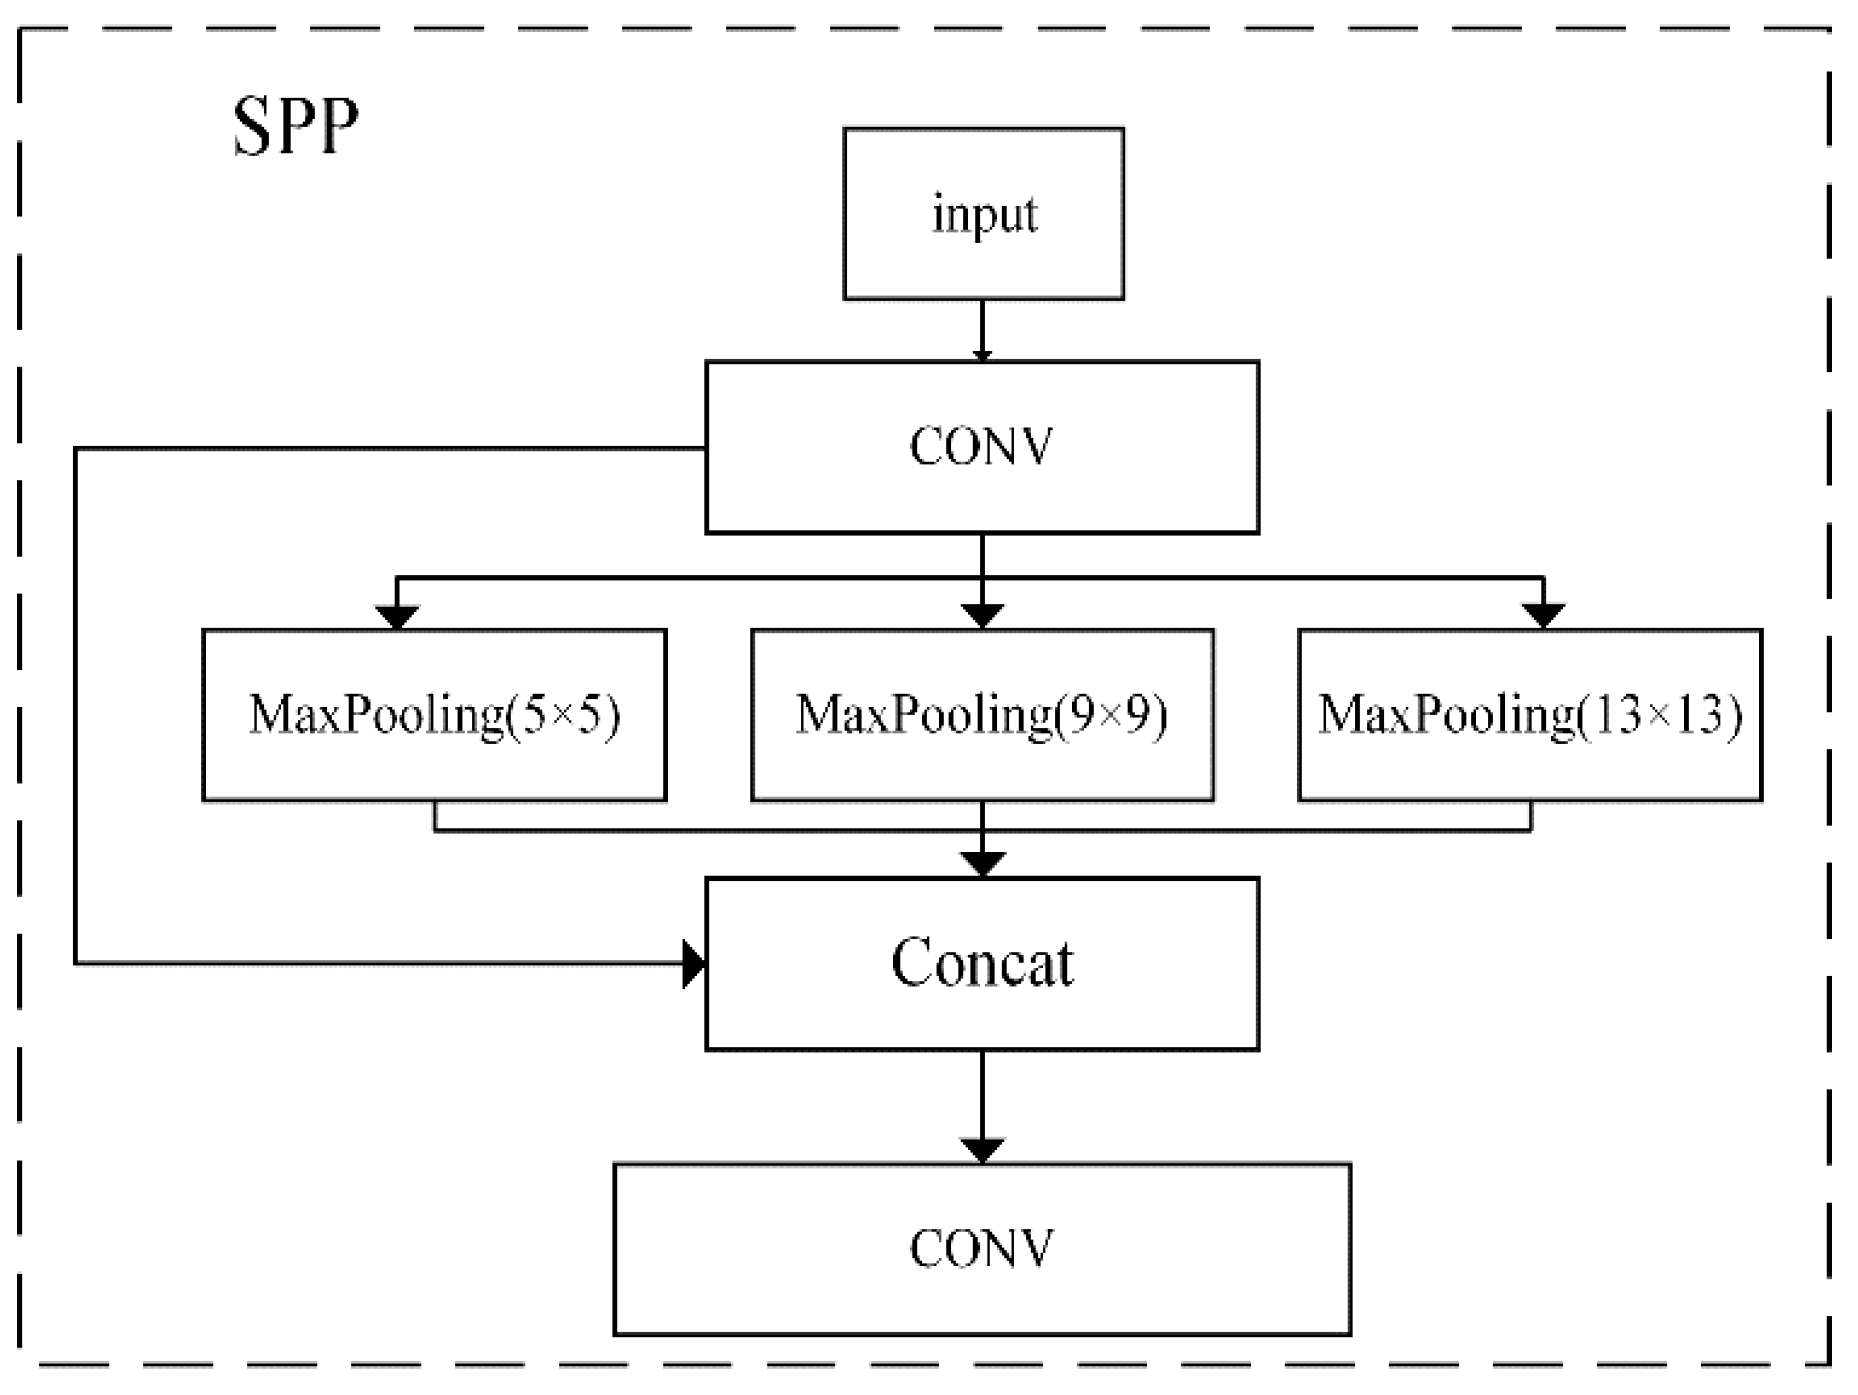
3.1. Dual SPP on the Backbone of Our Detector
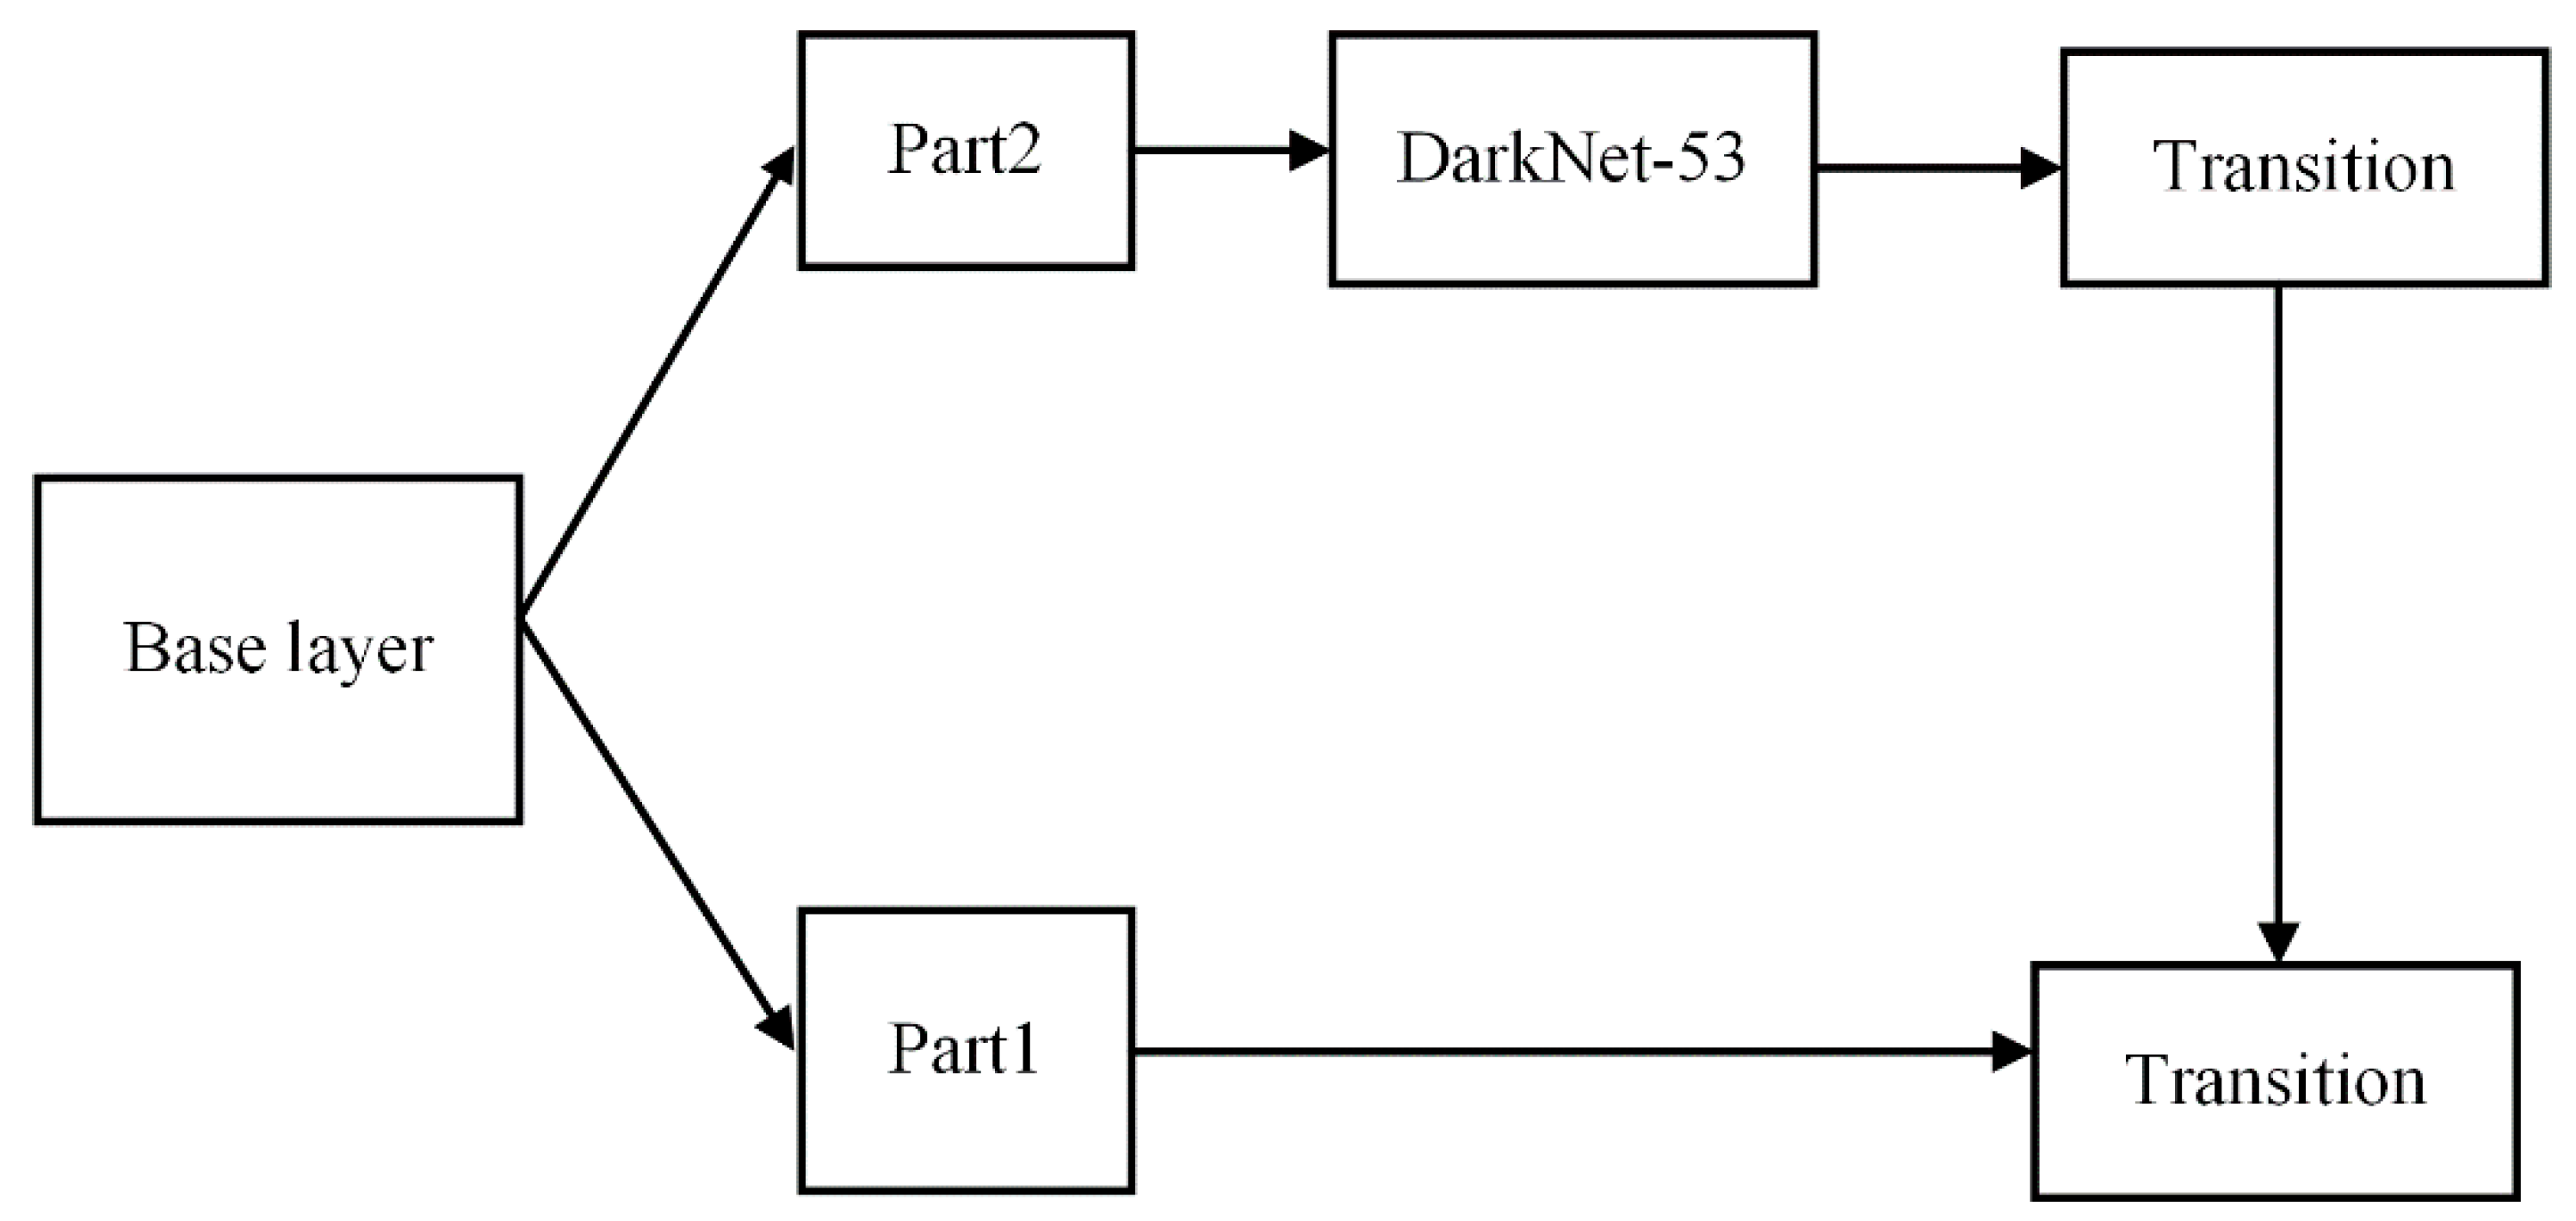
3.2. MultiPath Neck
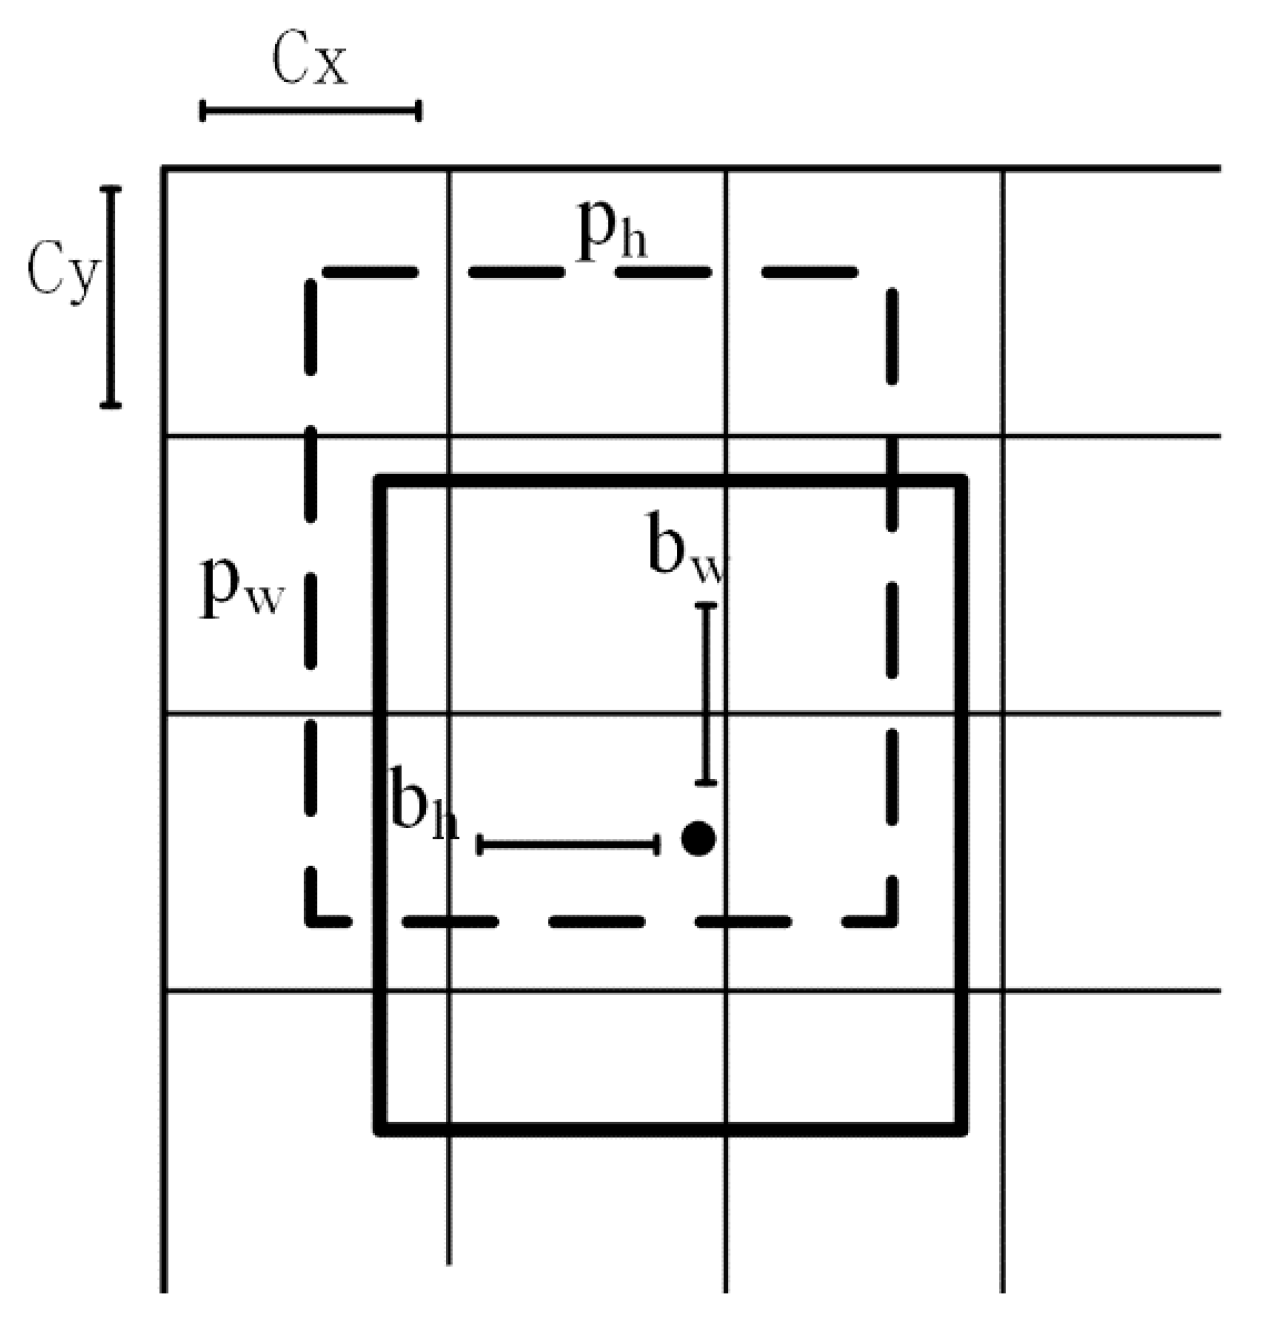
3.3. Loss Function
4. Experiments
4.1. Datasets
4.2. Evaluation Metrics
4.3. Training
5. Results and Discussion
5.1. Wheat-Head Detection Results
5.2. Comparison of Different Backbone Model Detection Indexes
6. Conclusions
Author Contributions
Funding
Institutional Review Board Statement
Informed Consent Statement
Data Availability Statement
Acknowledgments
Conflicts of Interest
References
- FAOSTAT. 2019. Available online: http://www.fao.org/faostat/zh/#data/QC (accessed on 29 December 2020).
- Madec, S.; Jin, X.; Lu, H.; De Solan, B.; Liu, S.; Duyme, F.; Heritier, E.; Baret, F. Ear density estimation from high resolution RGB imagery using deep learning technique. Agric. For. Meteorol. 2019, 264, 225–234. [Google Scholar] [CrossRef]
- Zhu, Y.; Cao, Z.; Lu, H.; Li, Y.; Xiao, Y. In-field automatic observation of wheat heading stage using computer vision. Biosyst. Eng. 2016, 143, 28–41. [Google Scholar] [CrossRef]
- Dammer, K.-H.; Möller, B.; Rodemann, B.; Heppner, D. Detection of head blight (Fusarium ssp.) in winter wheat by color and multispectral image analyses. Crop Prot. 2011, 30, 420–428. [Google Scholar] [CrossRef]
- Bi, K.; Jiang, P.; Li, L.; Shi, B.; Wang, C. Non-destructive measurement of wheat spike characteristics based on morphological image processing. Trans. Chin. Soc. Agric. Eng. 2010, 26, 212–216. [Google Scholar]
- Lecun, Y.; Bengio, Y.; Hinton, G. Deep learning. Nature 2015, 521, 436–444. [Google Scholar] [CrossRef] [PubMed]
- Zhang, Z.; Flores, P.; Igathinathane, C.; Naik, D.L.; Kiran, R.; Ransom, J.K. Wheat Lodging Detection from UAS Imagery Using Machine Learning Algorithms. Remote Sens. 2020, 12, 1838. [Google Scholar] [CrossRef]
- Pound, M.P.; Atkinson, J.A.; Wells, D.M.; Pridmore, T.P.; French, A.P. Deep learning for multi-task plant phenotyping. In Proceedings of the IEEE International Conference on Computer Vision Workshops (ICCVW), Venice, Italy, 22–29 October 2017; pp. 2055–2063. [Google Scholar] [CrossRef]
- Buzzy, M.; Thesma, V.; Davoodi, M.; Velni, J.M. Real-time plant leaf counting using deep object detection networks. Sensors 2020, 20, 6896. [Google Scholar] [CrossRef] [PubMed]
- Luo, Z.; Yu, H.; Zhang, Y. Pine cone detection using boundary equilibrium generative adversarial networks and improved YOLOv3 model. Sensors 2020, 20, 4430. [Google Scholar] [CrossRef] [PubMed]
- Hasan, M.M.; Chopin, J.P.; Laga, H.; Miklavcic, S.J. Detection and analysis of wheat spikes using Convolutional Neural Networks. Plant Methods 2018, 14, 1–13. [Google Scholar] [CrossRef] [PubMed]
- Misra, T.; Arora, A.; Marwaha, S.; Chinnusamy, V.; Rao, A.R.; Jain, R.; Sahoo, R.N.; Ray, M.; Kumar, S.; Raju, D.; et al. SpikeSegNet-a deep learning approach utilizing encoder-decoder network with hourglass for spike segmentation and counting in wheat plant from visual imaging. Plant Methods 2020, 16, 1–20. [Google Scholar] [CrossRef] [PubMed]
- Bochkovskiy, A.; Wang, C.-Y.; Liao, H.-Y.M. YOLOv4: Optimal Speed and Accuracy of Object Detection. arXiv 2020, arXiv:2004.10934. [Google Scholar]
- David, E.; Madec, S.; Sadeghi-Tehran, P.; Aasen, H.; Zheng, B.; Liu, S.; Kirchgessner, N.; Ishikawa, G.; Nagasawa, K.; Badhon, M.A.; et al. Global Wheat Head Detection (GWHD) dataset: A large and diverse dataset of high resolution RGB labelled images to develop and benchmark wheat head detection methods. arXiv 2020, arXiv:2005.02162. [Google Scholar] [CrossRef] [PubMed]
- Girshick, R.; Donahue, J.; Darrell, T.; Malik, J. Rich feature hierarchies for accurate object detection and semantic segmentation. In Proceedings of the 2014 IEEE Conference on Computer Vision and Pattern Recognition, Columbus, OH, USA, 24–27 June 2014; pp. 580–587. [Google Scholar] [CrossRef]
- Girshick, R. Fast R-CNN. In Proceedings of the 2015 IEEE International Conference on Computer Vision (ICCV), Santiago, Chile, 7–13 December 2015; pp. 1440–1448. [Google Scholar] [CrossRef]
- Ren, S.; He, K.; Girshick, R.; Sun, J. Faster R-CNN: Towards Real-Time Object Detection with Region Proposal Networks. IEEE Trans. Pattern Anal. Mach. Intell. 2017, 39, 1137–1149. [Google Scholar] [CrossRef] [PubMed]
- Tian, Z.; Shen, C.; Chen, H.; He, T. FCOS: Fully Convolutional One-Stage Object Detection. In Proceedings of the 2019 IEEE/CVF International Conference on Computer Vision (ICCV), Seoul, Korea, 27–28 October 2019; pp. 9626–9635. [Google Scholar] [CrossRef]
- Uijlings, J.R.R.; Van De Sande, K.E.A.; Gevers, T.; Smeulders, A.W.M. Selective search for object recognition. Int. J. Comput. Vis. 2013, 104, 154–171. [Google Scholar] [CrossRef]
- Redmon, J.; Divvala, S.; Girshick, R.; Farhadi, A. You Only Look Once: Unified, Real-Time Object Detection. In Proceedings of the 2016 IEEE Conference on Computer Vision and Pattern Recognition (CVPR), Las Vegas, NV, USA, 27–30 June 2016; pp. 779–788. [Google Scholar] [CrossRef]
- Redmon, J.; Farhadi, A. YOLO9000: Better, Faster, Stronger. In Proceedings of the 2017 IEEE Conference on Computer Vision and Pattern Recognition (CVPR), Honolulu, HI, USA, 21–26 July 2017; pp. 6517–6525. [Google Scholar] [CrossRef]
- Redmon, J.; Farhadi, A. YOLOv3: An Incremental Improvement. arXiv 2018, arXiv:1804.02767. Available online: http://arxiv.org/abs/1804.02767 (accessed on 29 December 2020).
- Lin, T.; Dollár, P.; Girshick, R.; He, K.; Hariharan, B.; Belongie, S. Feature Pyramid Networks for Object Detection. In Proceedings of the 2017 IEEE Conference on Computer Vision and Pattern Recognition (CVPR), Honolulu, HI, USA, 21–26 July 2017; pp. 936–944. [Google Scholar] [CrossRef]
- Wang, C.; Liao, H.M.; Wu, Y.; Chen, P.; Hsieh, J.; Yeh, I. CSPNet: A New Backbone that can Enhance Learning Capability of CNN. In Proceedings of the 2020 IEEE/CVF Conference on Computer Vision and Pattern Recognition Workshops (CVPRW), Seattle, WA, USA, 14–19 June 2020; pp. 1571–1580. [Google Scholar] [CrossRef]
- He, K.; Zhang, X.; Ren, S.; Sun, J. Deep Residual Learning for Image Recognition. In Proceedings of the 2016 IEEE Conference on Computer Vision and Pattern Recognition (CVPR), Las Vegas, NV, USA, 27–30 June 2016; pp. 770–778. [Google Scholar] [CrossRef]
- He, K.; Zhang, X.; Ren, S.; Sun, J. Spatial Pyramid Pooling in Deep Convolutional Networks for Visual Recognition. IEEE Trans. Pattern Anal. Mach. Intell. 2015, 37, 1904–1916. [Google Scholar] [CrossRef] [PubMed]
- Liu, S.; Qi, L.; Qin, H.; Shi, J.; Jia, J. Path Aggregation Network for Instance Segmentation. In Proceedings of the IEEE Conference on Computer Vision and Pattern Recognition 2018, Salt Lake City, UT, USA, 18–22 June 2018; pp. 8759–8768. [Google Scholar] [CrossRef]
- Rezatofighi, H.; Tsoi, N.; Gwak, J.; Sadeghian, A.; Reid, I.; Savarese, S. Generalized intersection over union: A metric and a loss for bounding box regression. In Proceedings of the IEEE Conference on Computer Vision and Pattern Recognition 2019, Long Beach, CA, USA, 16–20 June 2019; pp. 658–666. [Google Scholar] [CrossRef]
- Brooks, J. COCO Annotator 2019. Available online: https://github.com/jsbroks/coco-annotator (accessed on 29 December 2020).


| Data Augmentation | Training | Validation | Testing | Total |
|---|---|---|---|---|
| Original | 3412 | 10 | 10 | 3432 |
| Cutout | √ | - | - | |
| Crop | √ | - | - | |
| Blur | √ | - | - | |
| Flips | √ | - | - |
| Method | Datasets | mAP50 | mAP95 | FPS |
|---|---|---|---|---|
| YOLOv3 [13] | GWHD | 90.5% | 46.7% | 38 |
| YOLOv4 [14] | - | 91.4% | 51.2% | 52 |
| Faster R-CNN [8] | - | 76.6% | 49.1% | 10 |
| Our method | - | 94.5% | 54.5% | 71 |
| Backbones | Datasets | mAP50 | mAP95 | FPS |
|---|---|---|---|---|
| DarkNet-53 | GWHD | 87.6% | 48.6% | 55 |
| CSPDarkNet-53 | - | 90.2% | 50.4% | 65 |
| Our backbone | - | 94.5% | 54.5% | 71 |
Publisher’s Note: MDPI stays neutral with regard to jurisdictional claims in published maps and institutional affiliations. |
© 2020 by the authors. Licensee MDPI, Basel, Switzerland. This article is an open access article distributed under the terms and conditions of the Creative Commons Attribution (CC BY) license (http://creativecommons.org/licenses/by/4.0/).
Share and Cite
Gong, B.; Ergu, D.; Cai, Y.; Ma, B. Real-Time Detection for Wheat Head Applying Deep Neural Network. Sensors 2021, 21, 191. https://doi.org/10.3390/s21010191
Gong B, Ergu D, Cai Y, Ma B. Real-Time Detection for Wheat Head Applying Deep Neural Network. Sensors. 2021; 21(1):191. https://doi.org/10.3390/s21010191
Chicago/Turabian StyleGong, Bo, Daji Ergu, Ying Cai, and Bo Ma. 2021. "Real-Time Detection for Wheat Head Applying Deep Neural Network" Sensors 21, no. 1: 191. https://doi.org/10.3390/s21010191
APA StyleGong, B., Ergu, D., Cai, Y., & Ma, B. (2021). Real-Time Detection for Wheat Head Applying Deep Neural Network. Sensors, 21(1), 191. https://doi.org/10.3390/s21010191