RSI-CB: A Large-Scale Remote Sensing Image Classification Benchmark Using Crowdsourced Data


Abstract
1. Introduction
- We propose a crowdsourced data-based method to build RSI-CB. The crowdsourced data in our method is a high-precision supervisor. Traditional methods require a significant amount of manual work; thus, they are less efficient and time-consuming. Using crowdsourced data as a supervisor facilitates machine self-learning through the Internet. Moreover, the size of the benchmark sample could be vast, both in amount and variety. In addition, crowdsourced data are basic data sources in the big data era and are updated rapidly. Therefore, a remote sensing benchmark constructed using crowdsourced data may continue to expand, in terms of the diversity, quantity, and robustness of samples. Consequently, our method can potentially realize weak supervised learning further for remote sensing images.
- Based on the above method, we construct a global-scale RSI-CB. We build a hierarchical grading object category system. The system contains six categories with 35 subclasses. With diverse objects, rich categories, and a large number of images, this data set can be used to effectively develop new data-driven algorithms and further improve the state-of-the-art methods
- We conduct various experiments to compare RSI-CB with SAT-4, SAT-6, and UC-Merced data sets on handcrafted features, such as scale-invariant feature transform (SIFT) [53], color histogram indexing (CH) [54], local binary patterns (LBP) [55], GIST [56], and classical DCNN models, such as AlexNet [7], VGGNet [10], GoogLeNet [57], and ResNet [9]. In addition, we demonstrate that DCNN models trained by RSI-CB have good performance when transferred to the UC-Merced data sets, and have good generalization ability. The experiments show that RSI-CB is a more suitable benchmark for remote sensing image classification than the other existing benchmarks in the big data era and has many potential applications.
2. Remote Sensing Image Labeling Method Based on Crowdsourced Data
2.1. Basic Requirements for Remote Sensing Image Benchmark Using Deep Learning
- (1)
- Scale of benchmarkDCNN models have a strong learning ability and the ability to approximate any function, which can be combined with large data sets to better describe the inherent characteristics of the distribution of large data. Moreover, the image classification effect is related to the depth and width of the network model, which corresponds to network complexity. A more complex network model indicates more training parameters, which require more image training samples. In addition, when the sample data is insufficient, sampling error cannot be ignored, even when the network is simple. When sample features do not fit well with the distribution of actual features, the knowledge learned by the model is insufficient as well, leading to unsatisfactory robustness and generalization ability.
- (2)
- Object diversityA strong distinction exists within classes. In constructing large-scale data sets, the data should be representative of the classes, causing the learning model to learn not only the unique characteristics, but the general ones as well. Therefore, different images of the same type of object (such as aircraft) should have different sizes, shapes, perspectives, backgrounds, light intensities, colors, and other conditions that diversify the objects within the class. Our images come from Google Earth and Bing Maps, so the images come from different sensors. To improve the class diversity further, the selection within categories should be based on the diversity requirements mentioned above.
- (3)
- Category differencesIn addition to the idea that massive representative training data can help to learn more visual features, the differences between classes is also a determinant of image classification accuracy. In data set construction, if the differences between classes are large, the probability of independent feature interval distributions in each category is higher, whereas similarity between classes leads to a higher overlapping ratio of various features. Therefore, a feasible method is to increase the number of images in these categories, which can cause the inter-class feature response interval to have a higher probability of being an independent distribution, further improving the accuracy of image classification.
- Each category must be rich with data. RSI-CB includes approximately 690 patches per category.
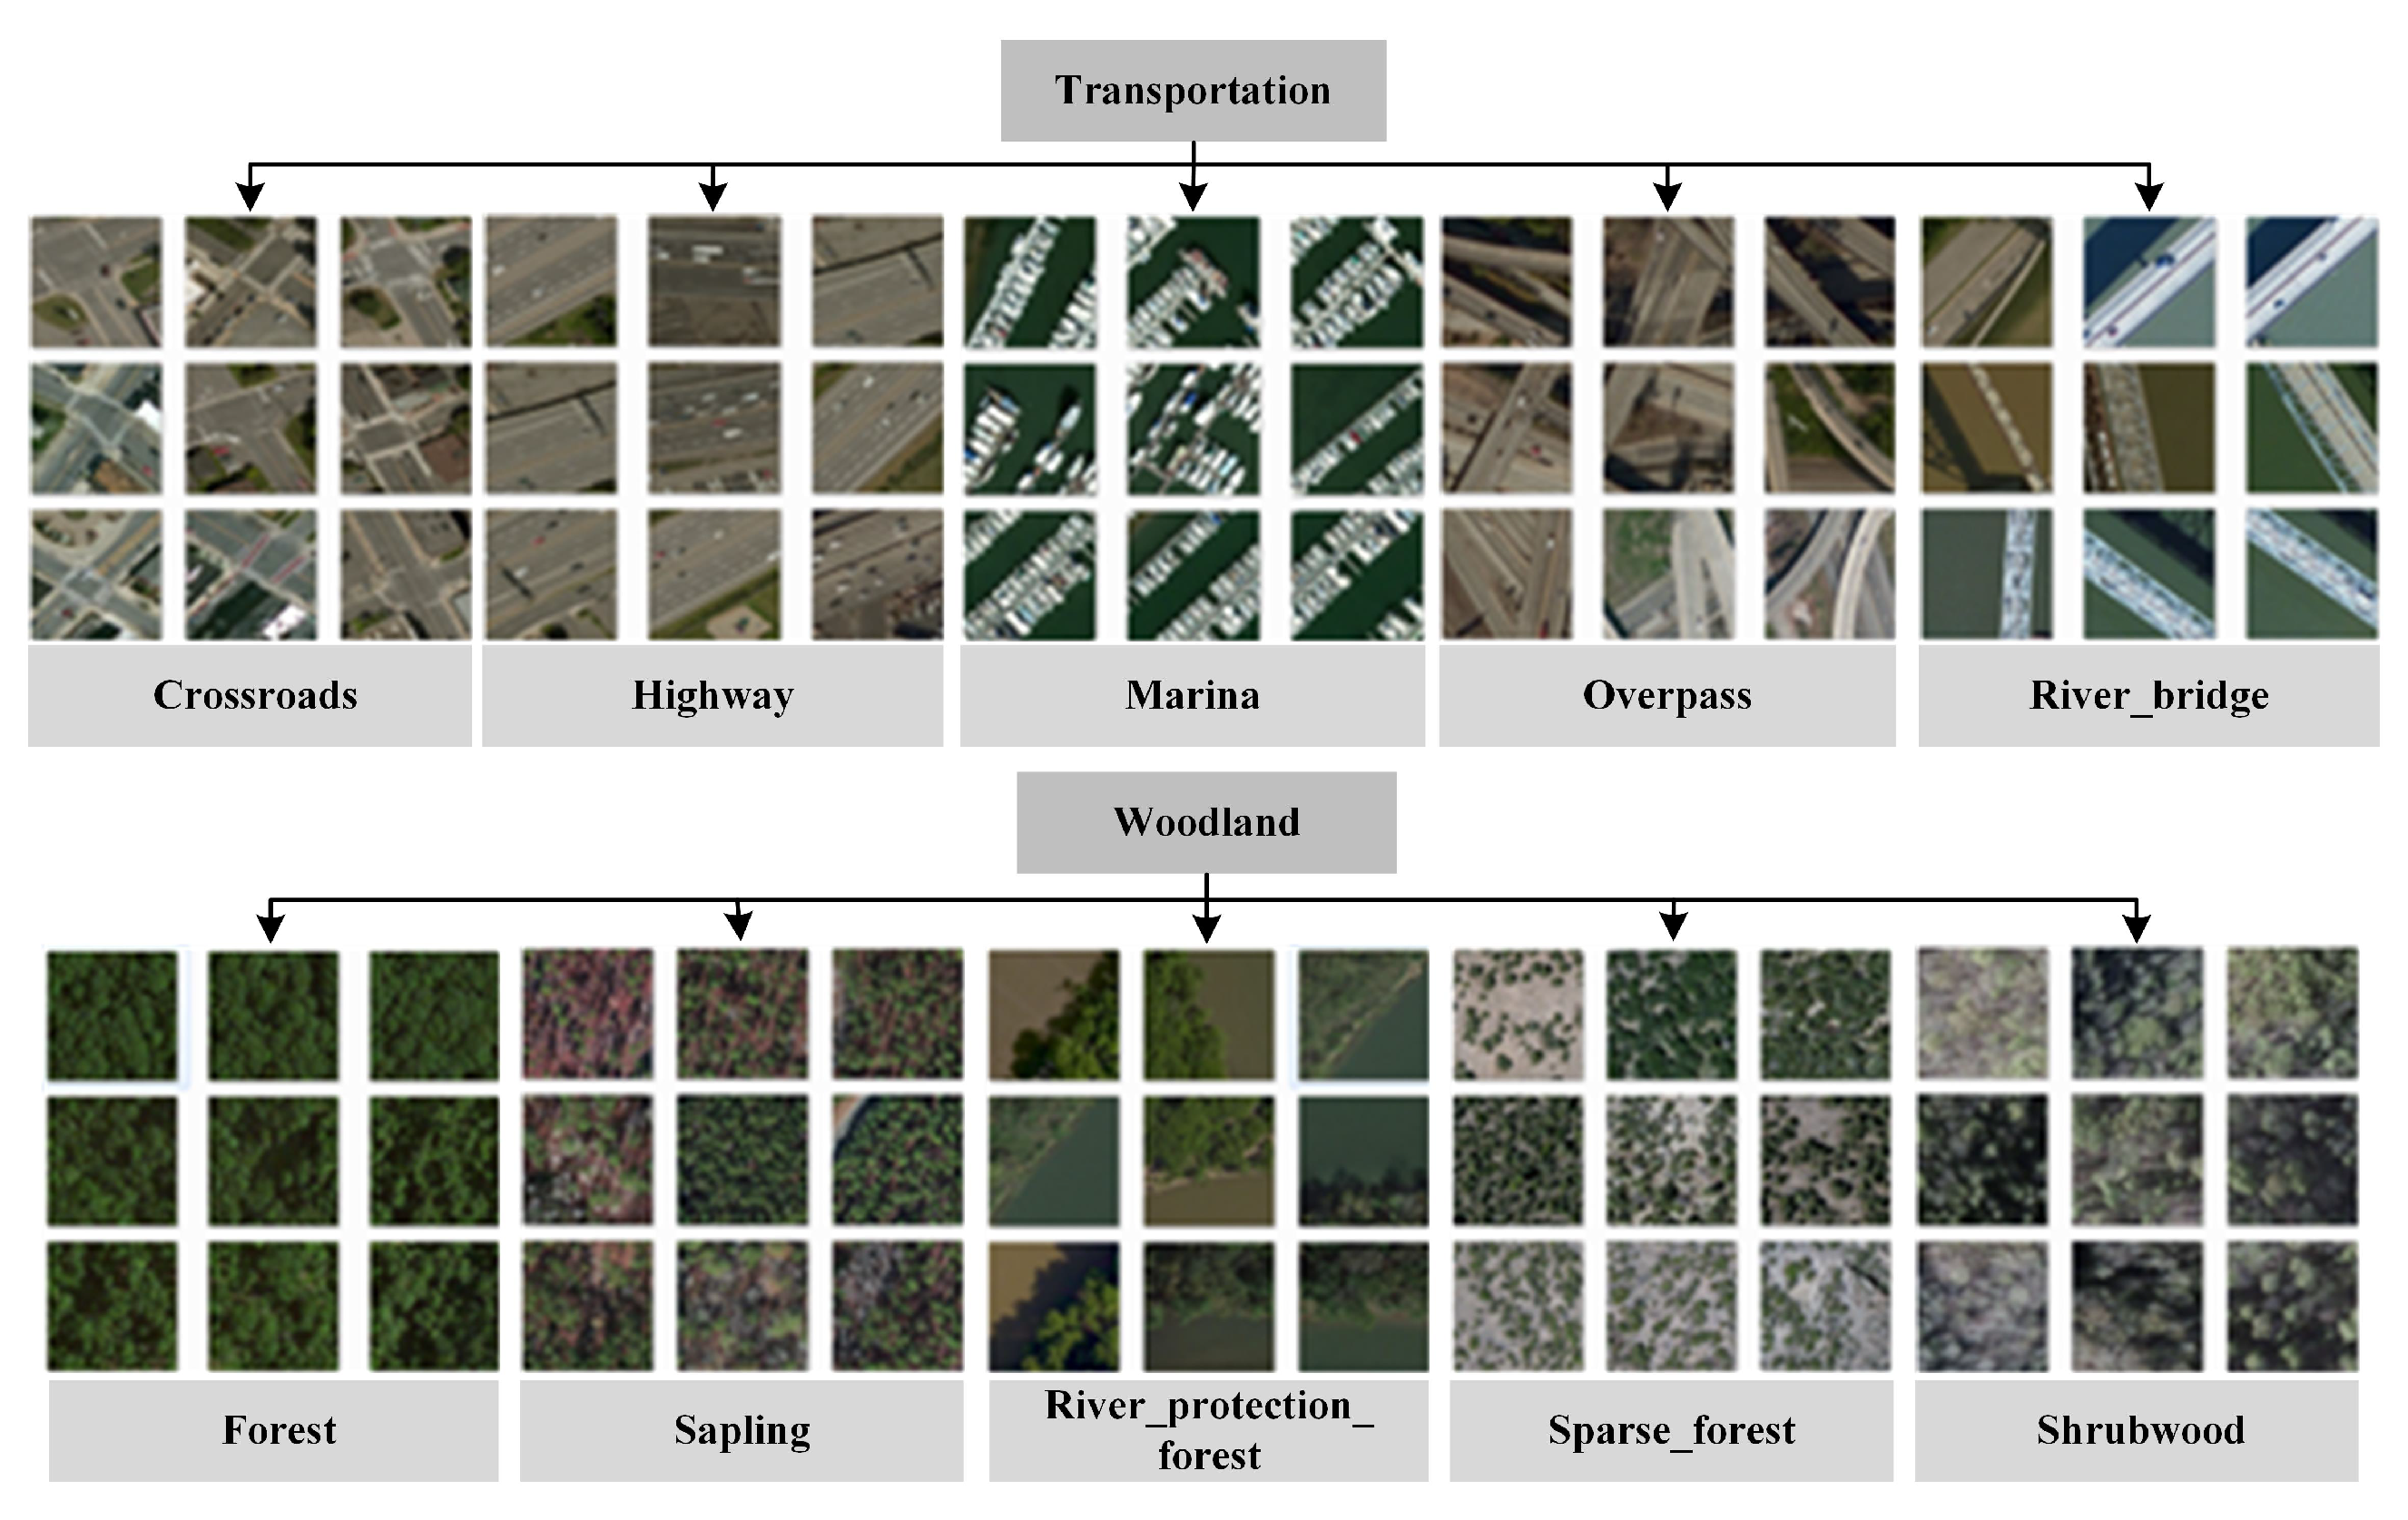
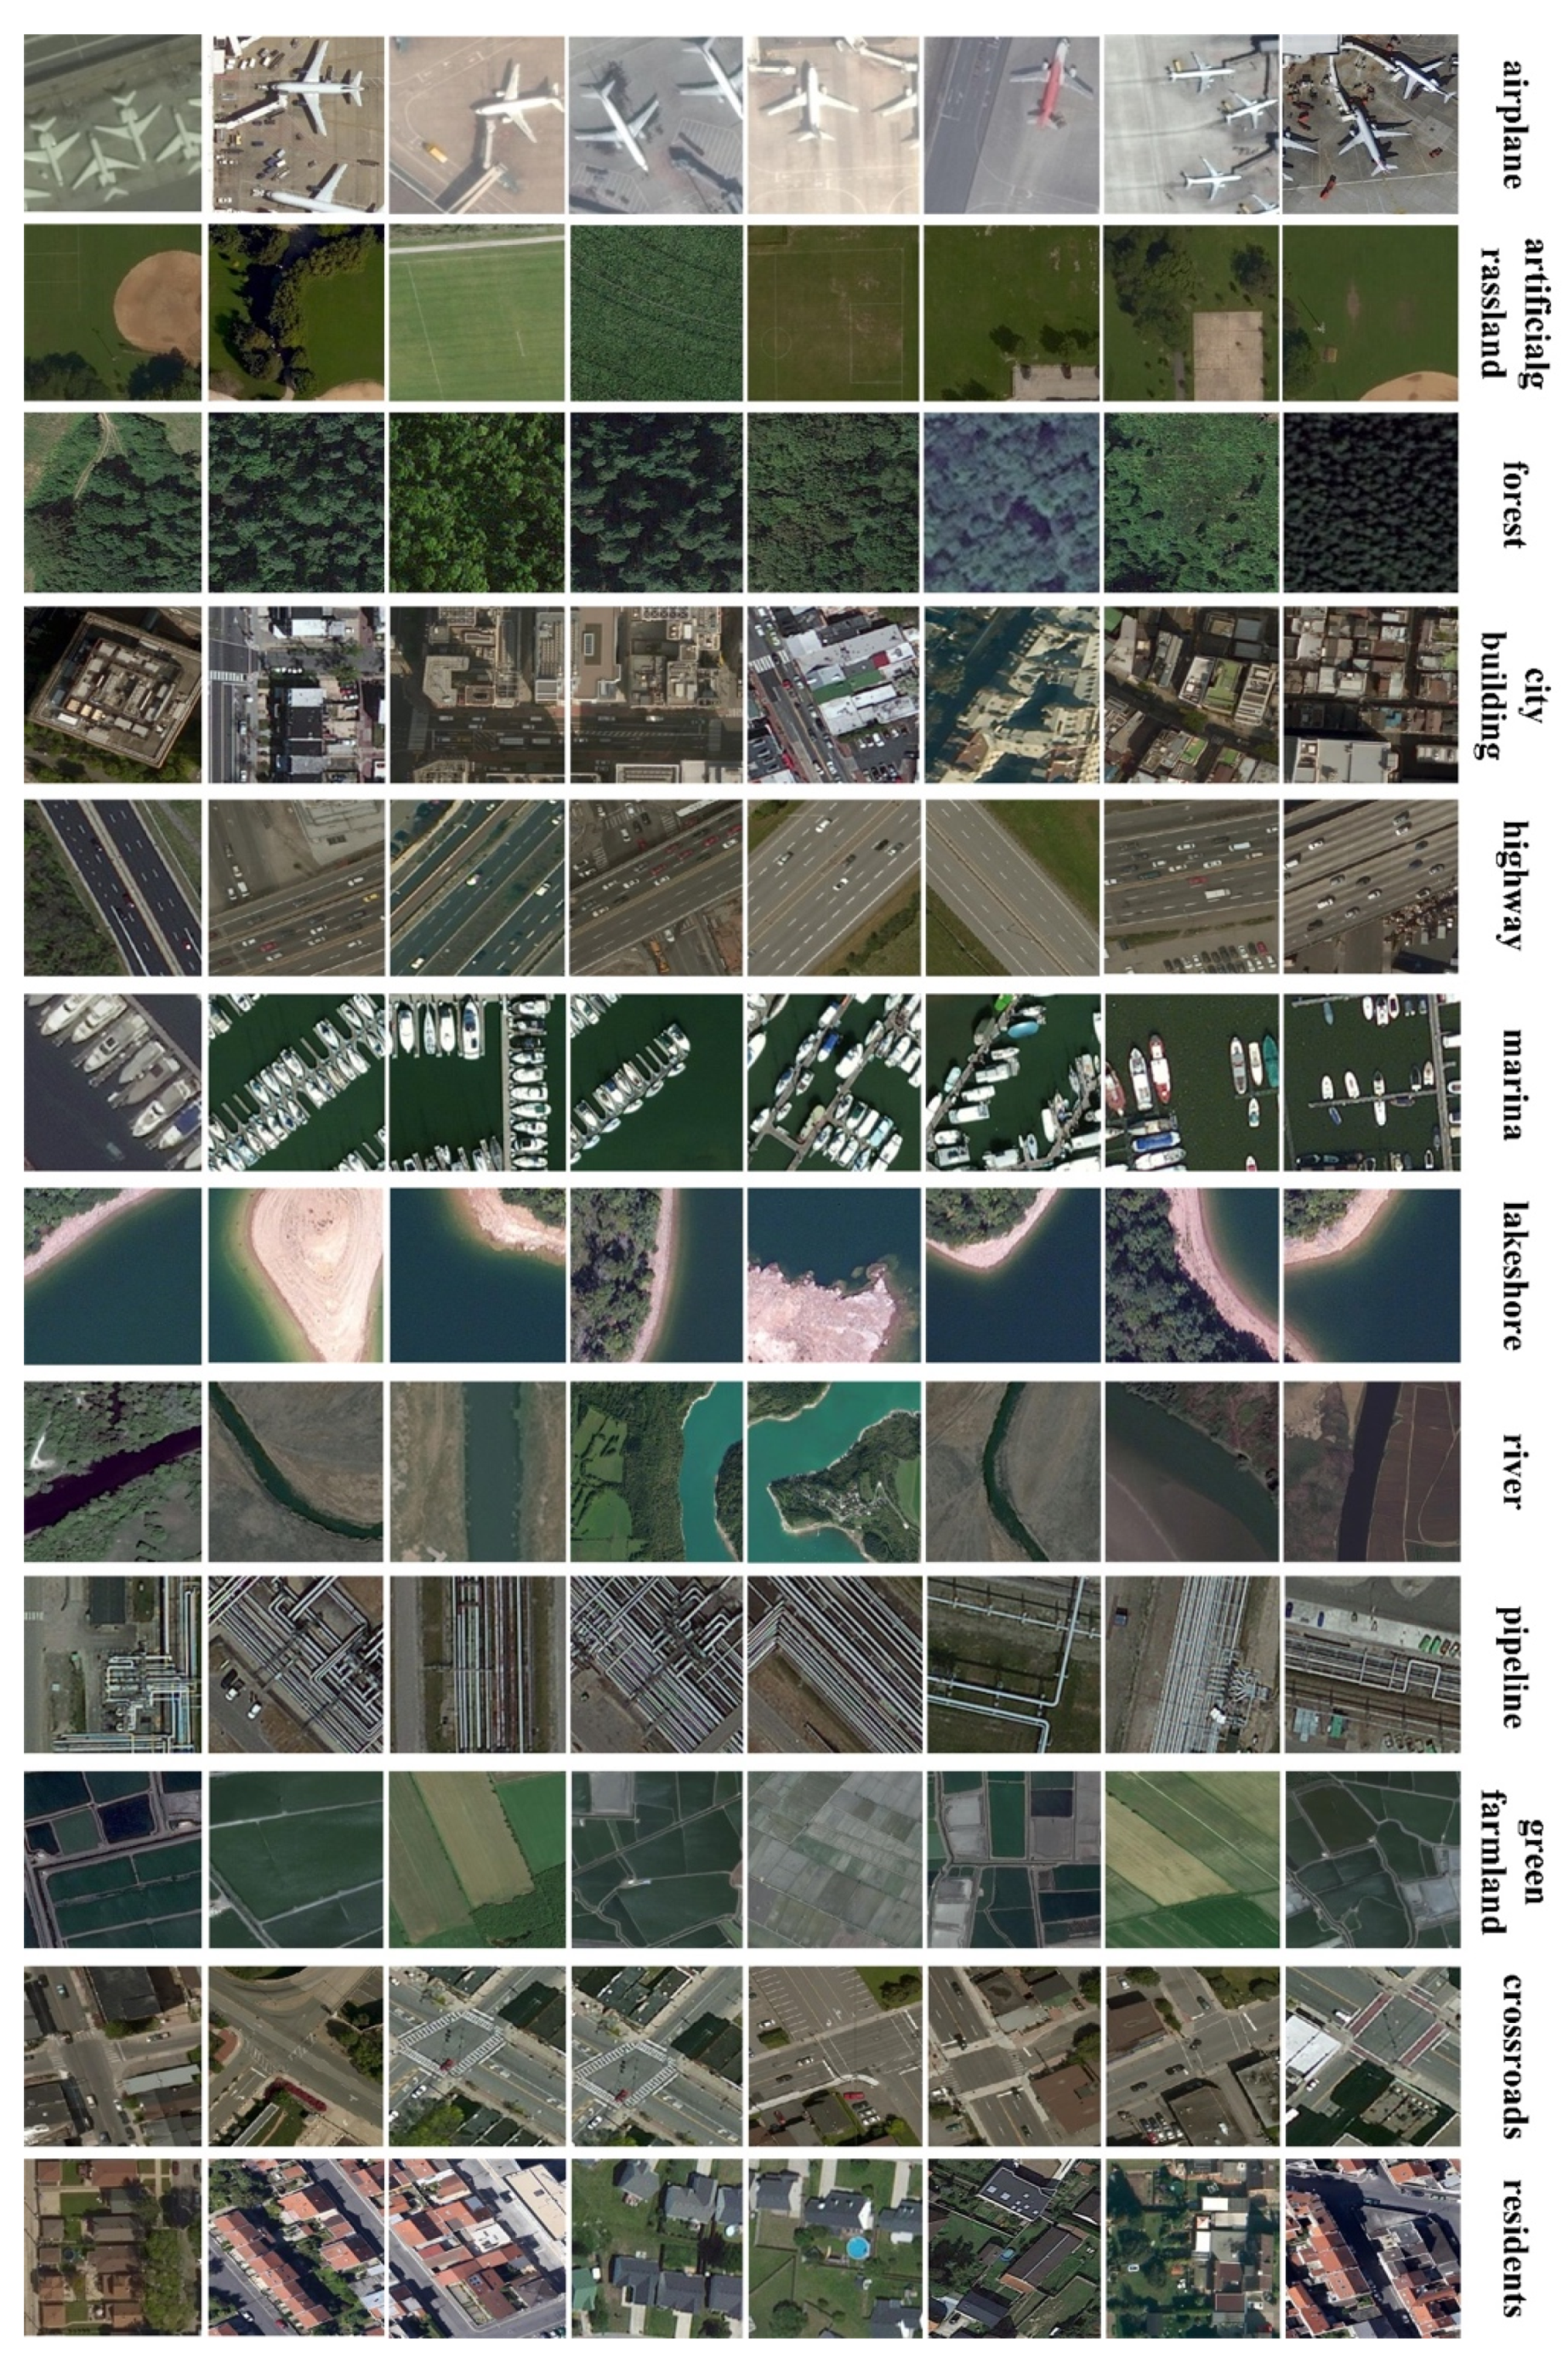
- The method for selecting object categories combines the category system of the Chinese national land-use classification standard and the hierarchy mechanism of ImageNet. The level of each category aims to increase the diversity and comprehensiveness of the benchmark. The data set is arranged in a two-level tree: with 35 leaf nodes (sub-classes) connected to six parent nodes (parent classes).
- The main body of the object must be easy to identify, which can avoid semantic divergence in images.
- Each class has different imaging angles, sizes, shapes, and colors, in order to increase sample diversity, which can improve the model generalization performance and robustness.
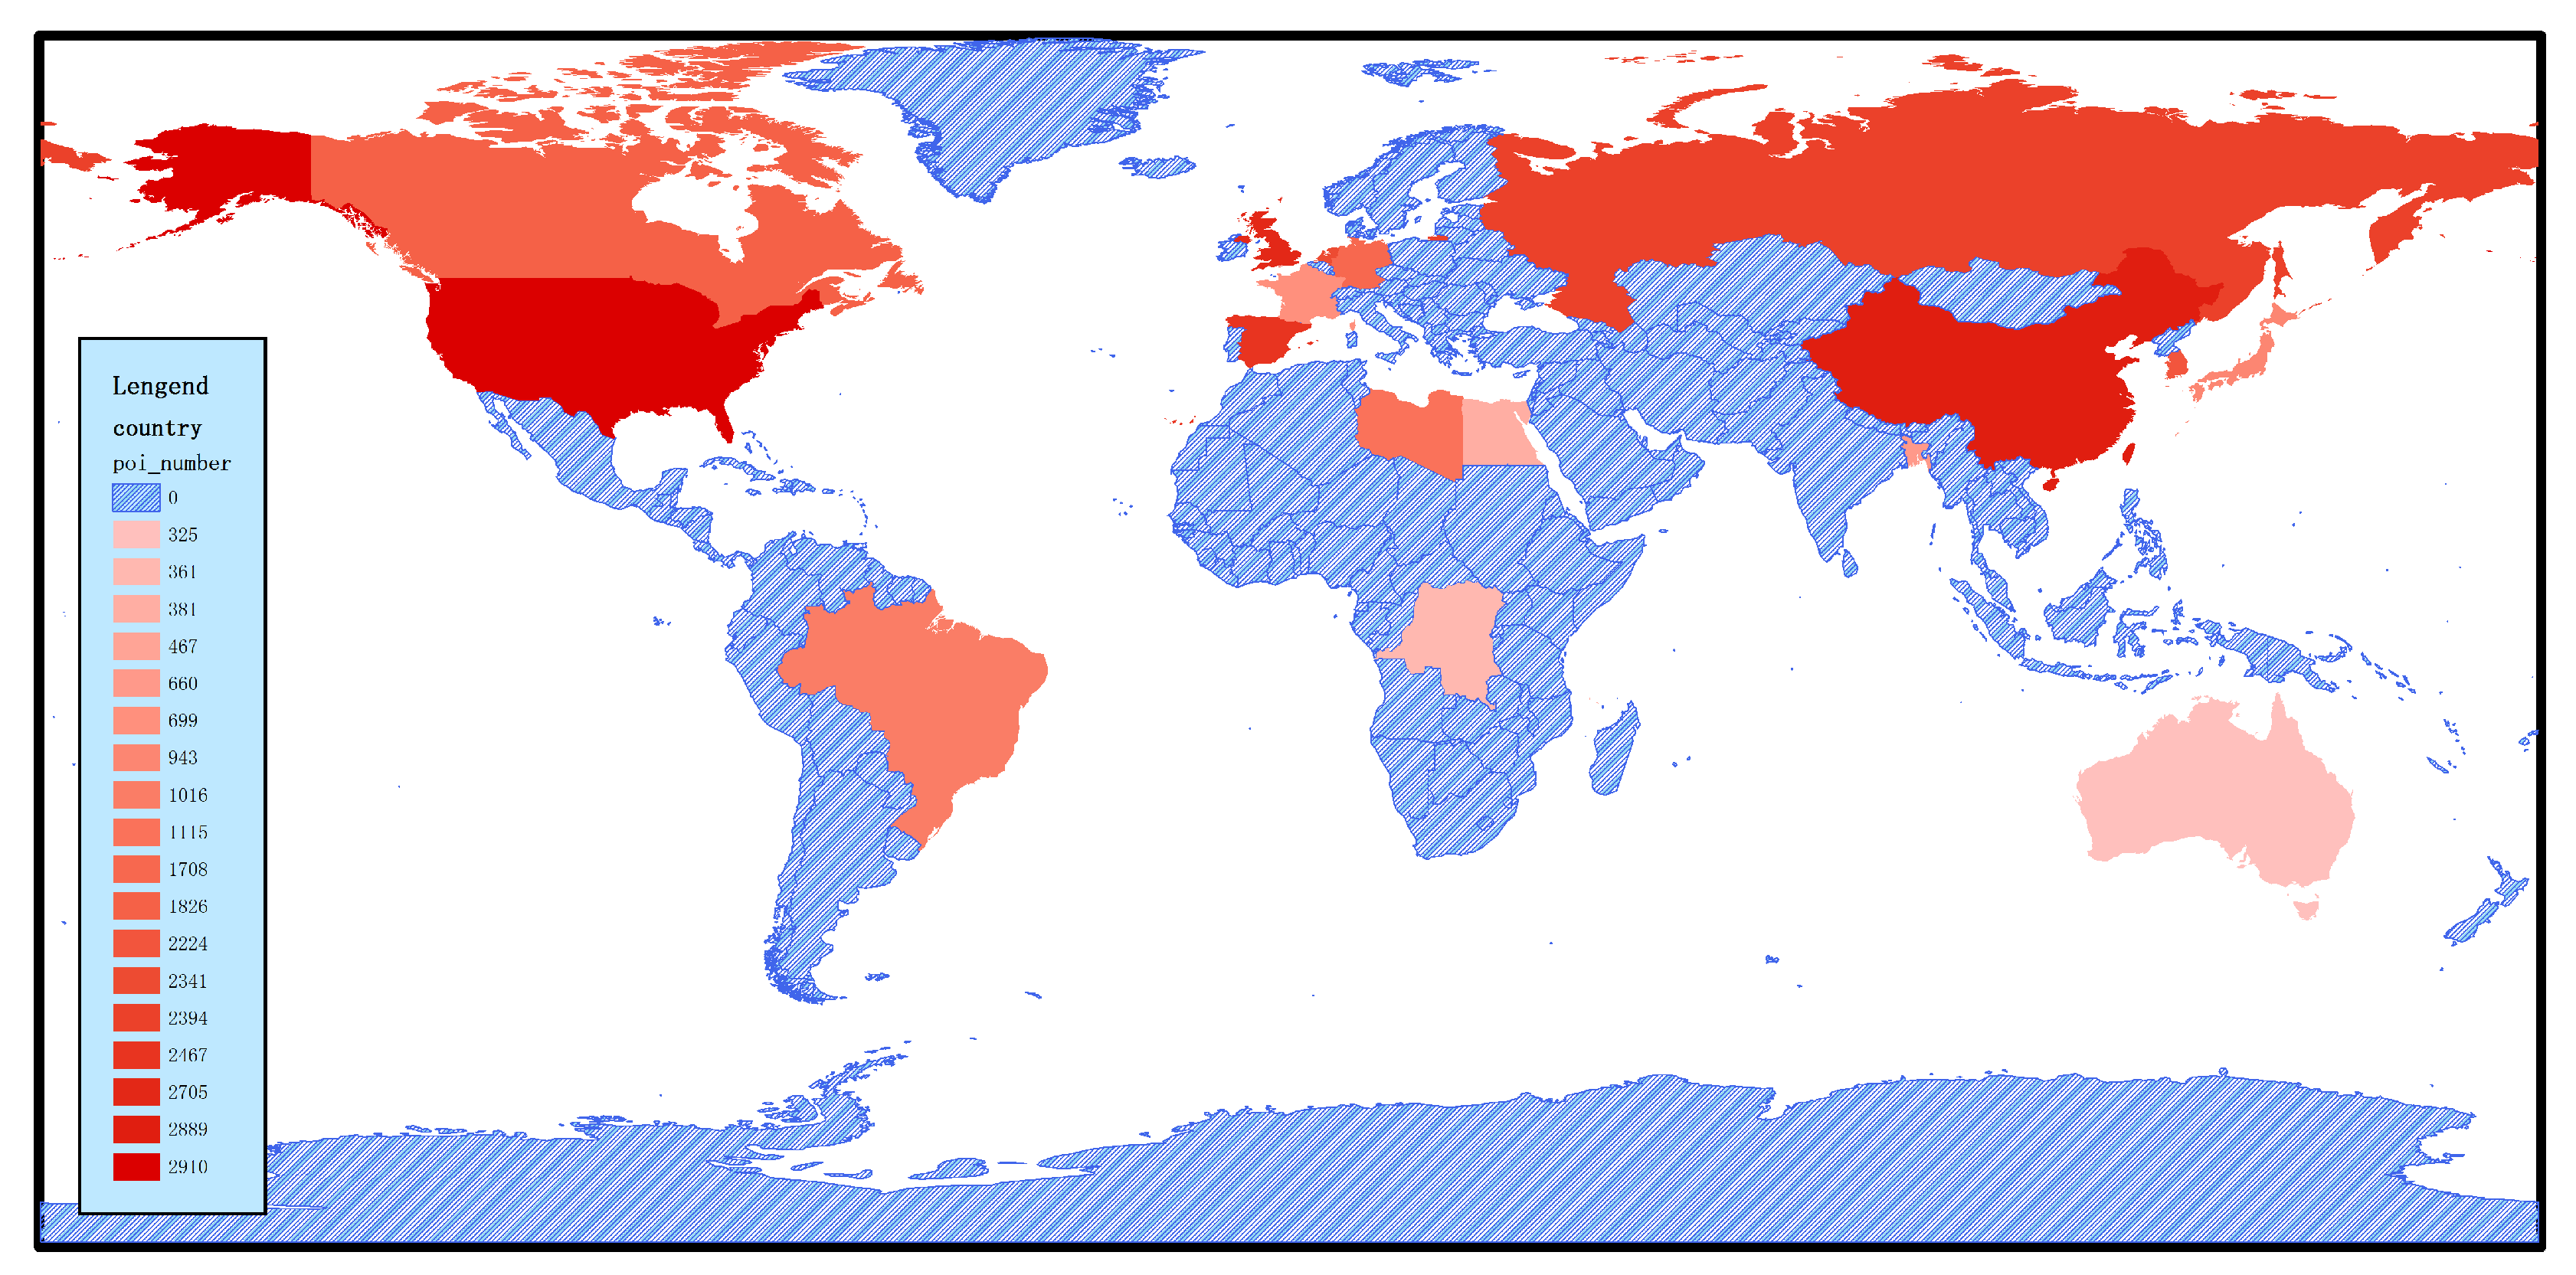
- The RSI-CB selects images that come from major cities worldwide and their surrounding areas, considering the balance of spatial distribution for the selected images.
2.2. Remote Sensing Image Labeling Method Based on Crowdsourced Geographic Data
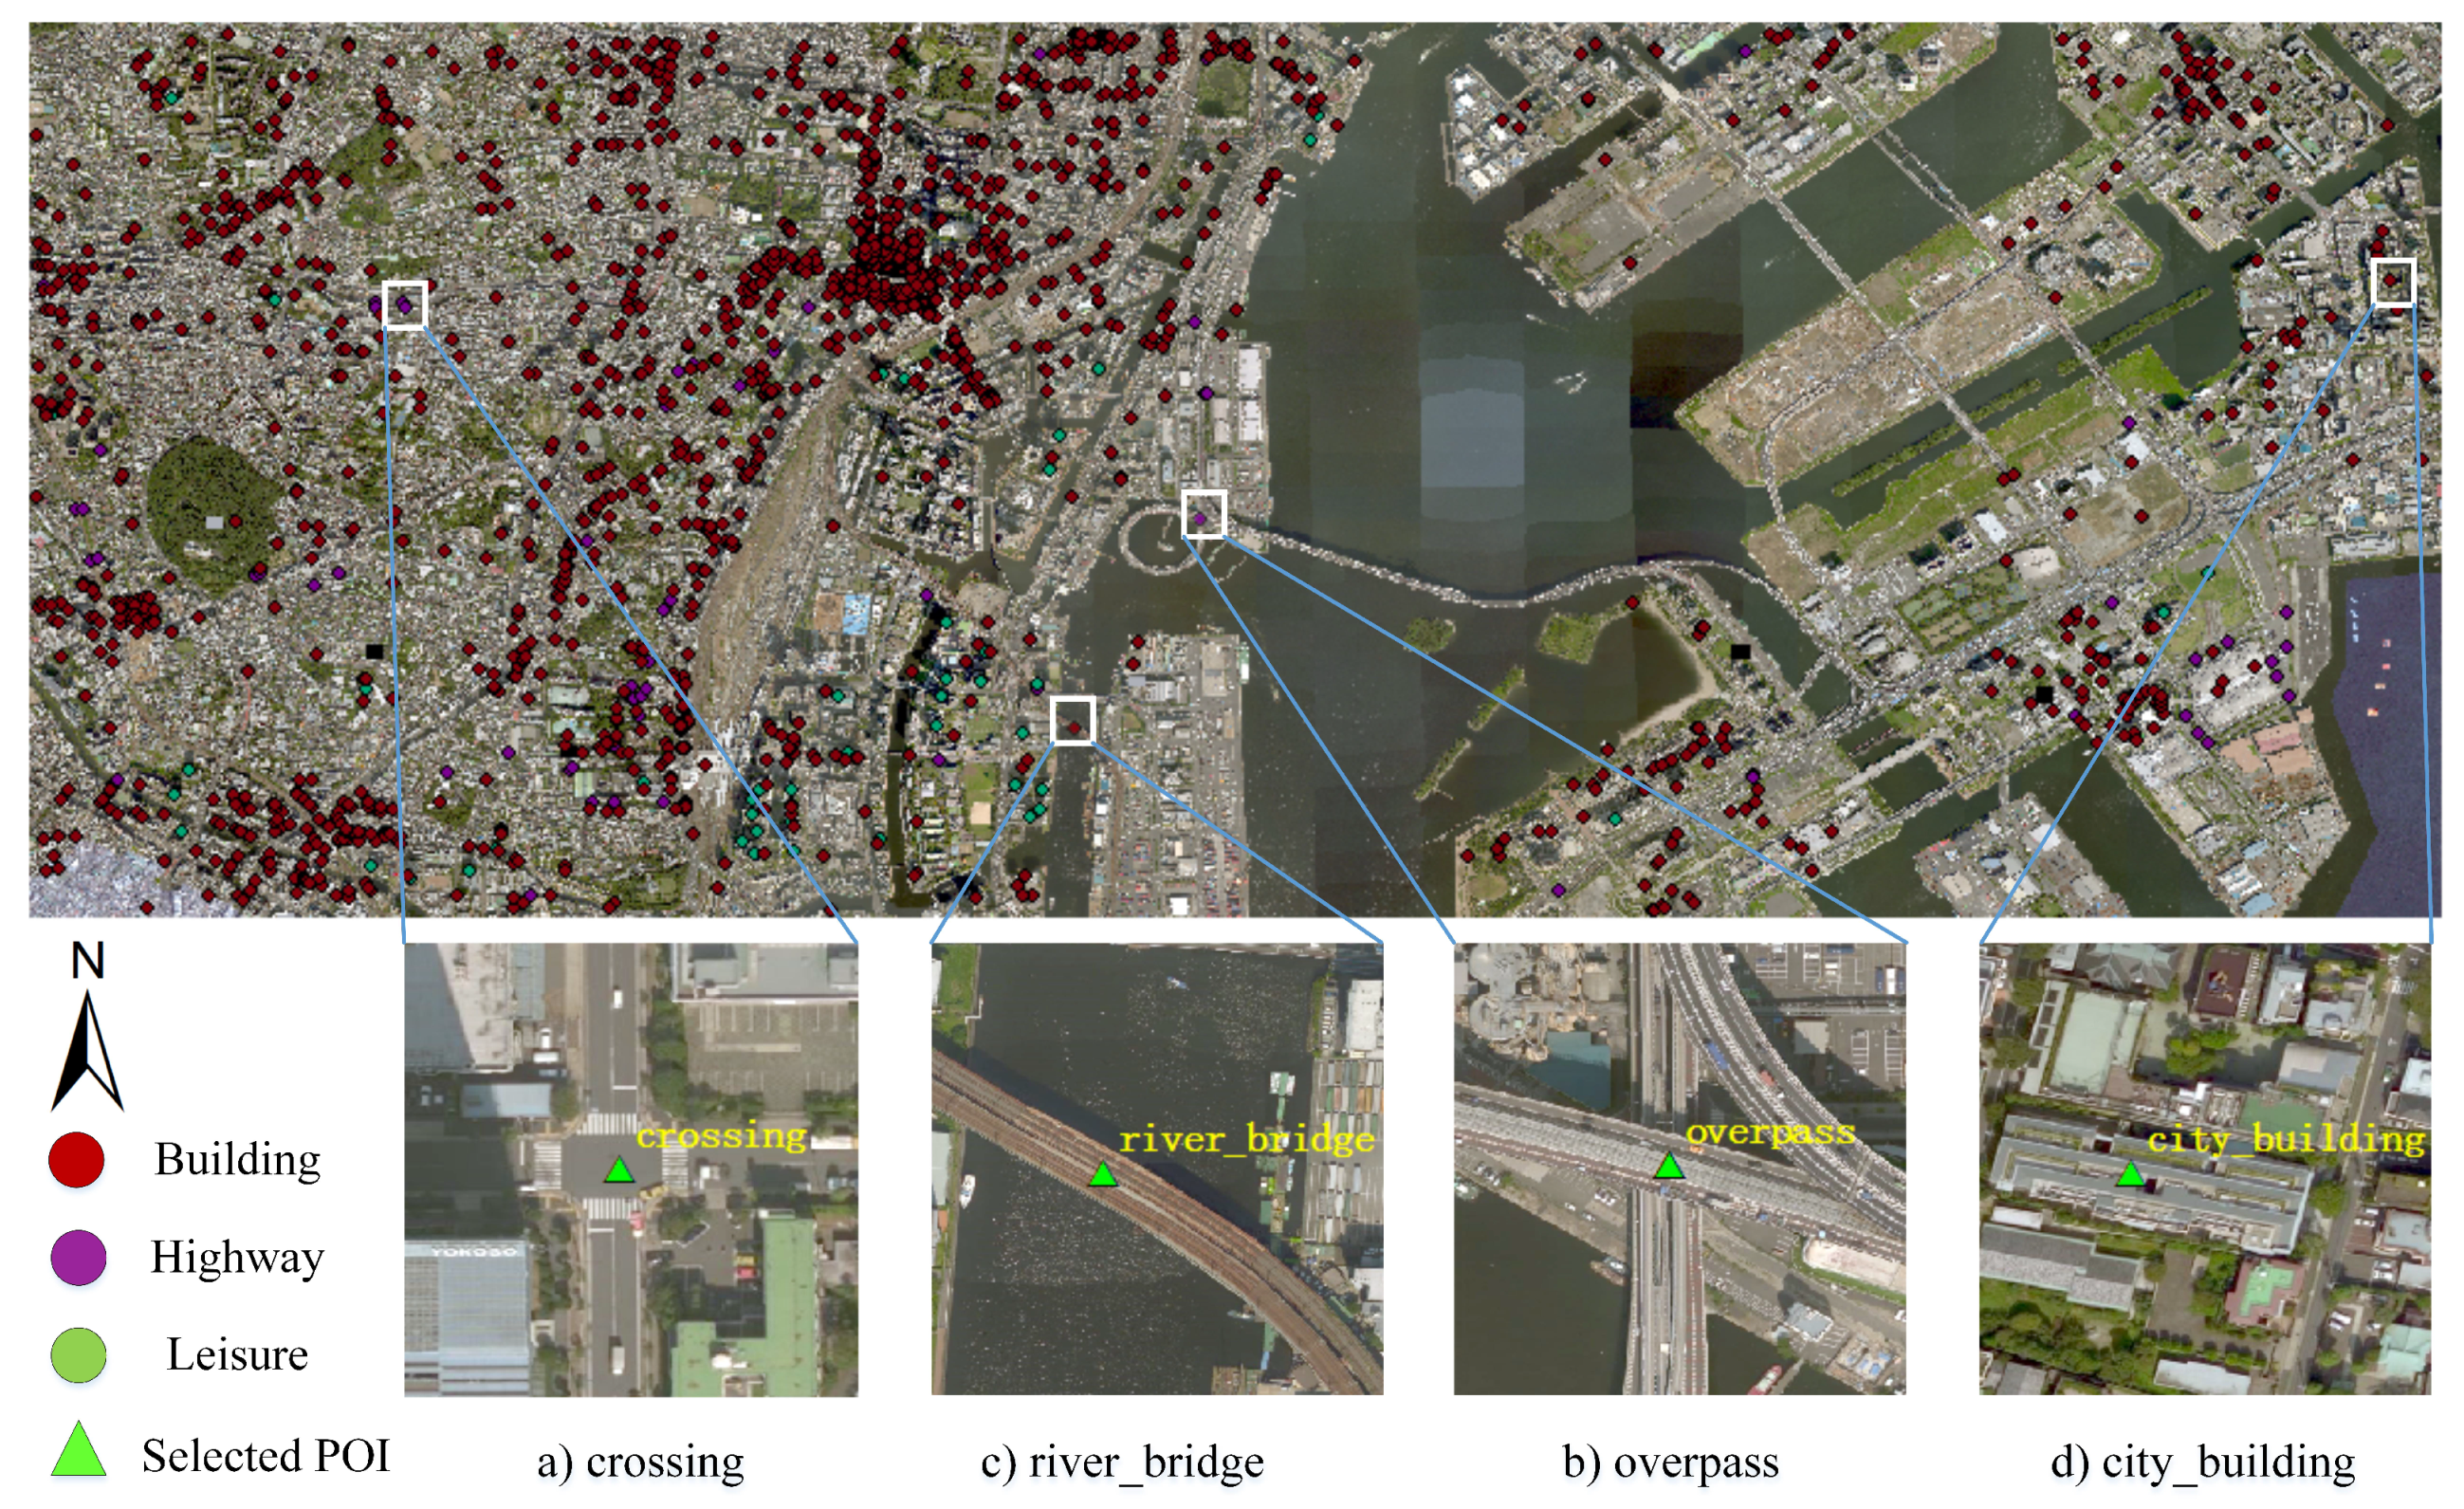
- Construct a registration overlay of high-resolution remote sensing images and POI data, making sure that the actual targets in images correspond correctly with the POI.The superposition effect of POI data and image are shown in Figure 1.
- POI data screening: This screening includes the deletion of wrong annotations, removal of non-conformal objects which indicate no intersection with the Chinese national land-use classification standards (see Section 3.2), and deletion of objects which are not obvious (see below for a detailed discussion).
- Cropping fixed-size remote sensing image blocks according to the POI data, traversing all POI, taking each POI as the center to crop remote sensing images with fixed sizes of pixels, and then integrating the same category of image blocks to build the final benchmark.
- Acquiring raw POI and remote sensing image data.
- Filtering the POI data, according to the intersection of the Chinese land classification standard and POI data.
- Based on the geographical coordinate information of each POI, taking each of POI as a center and cutting the image blocks to a preset size from the remote sensing image.
- Applying the feature type of each POI as the label of the image block.
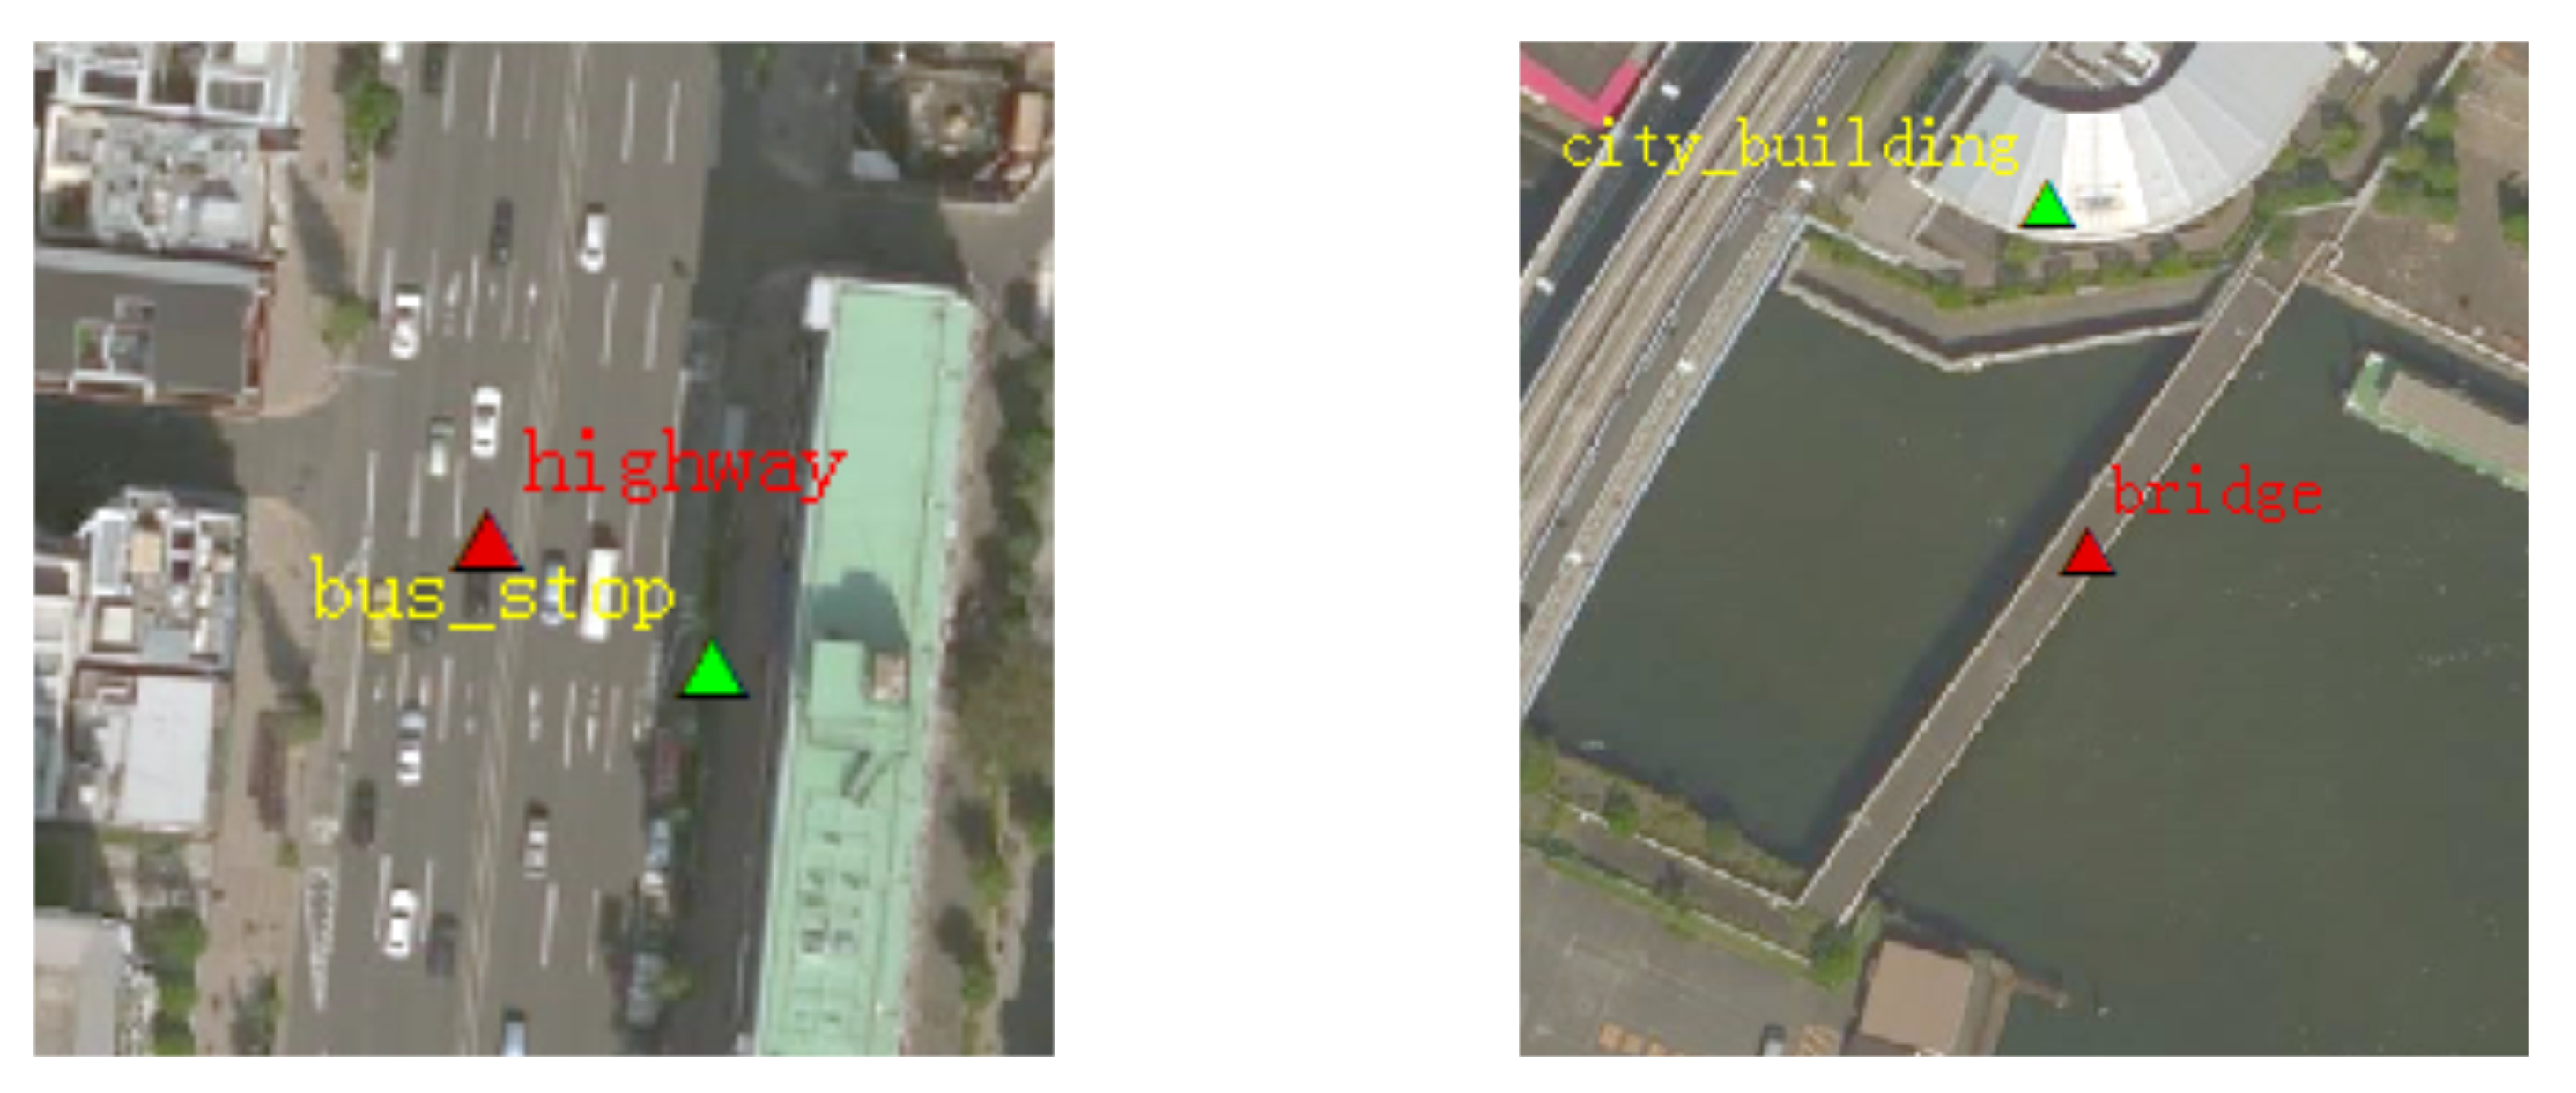
- Several points stacked in a small area, with these points as the centers of image blocks ( pixels) with high overlapping ratios. For this phenomenon, data screening follows the principle that the area of such a category should be dominant and its recognition degree high. ( Figure 2).
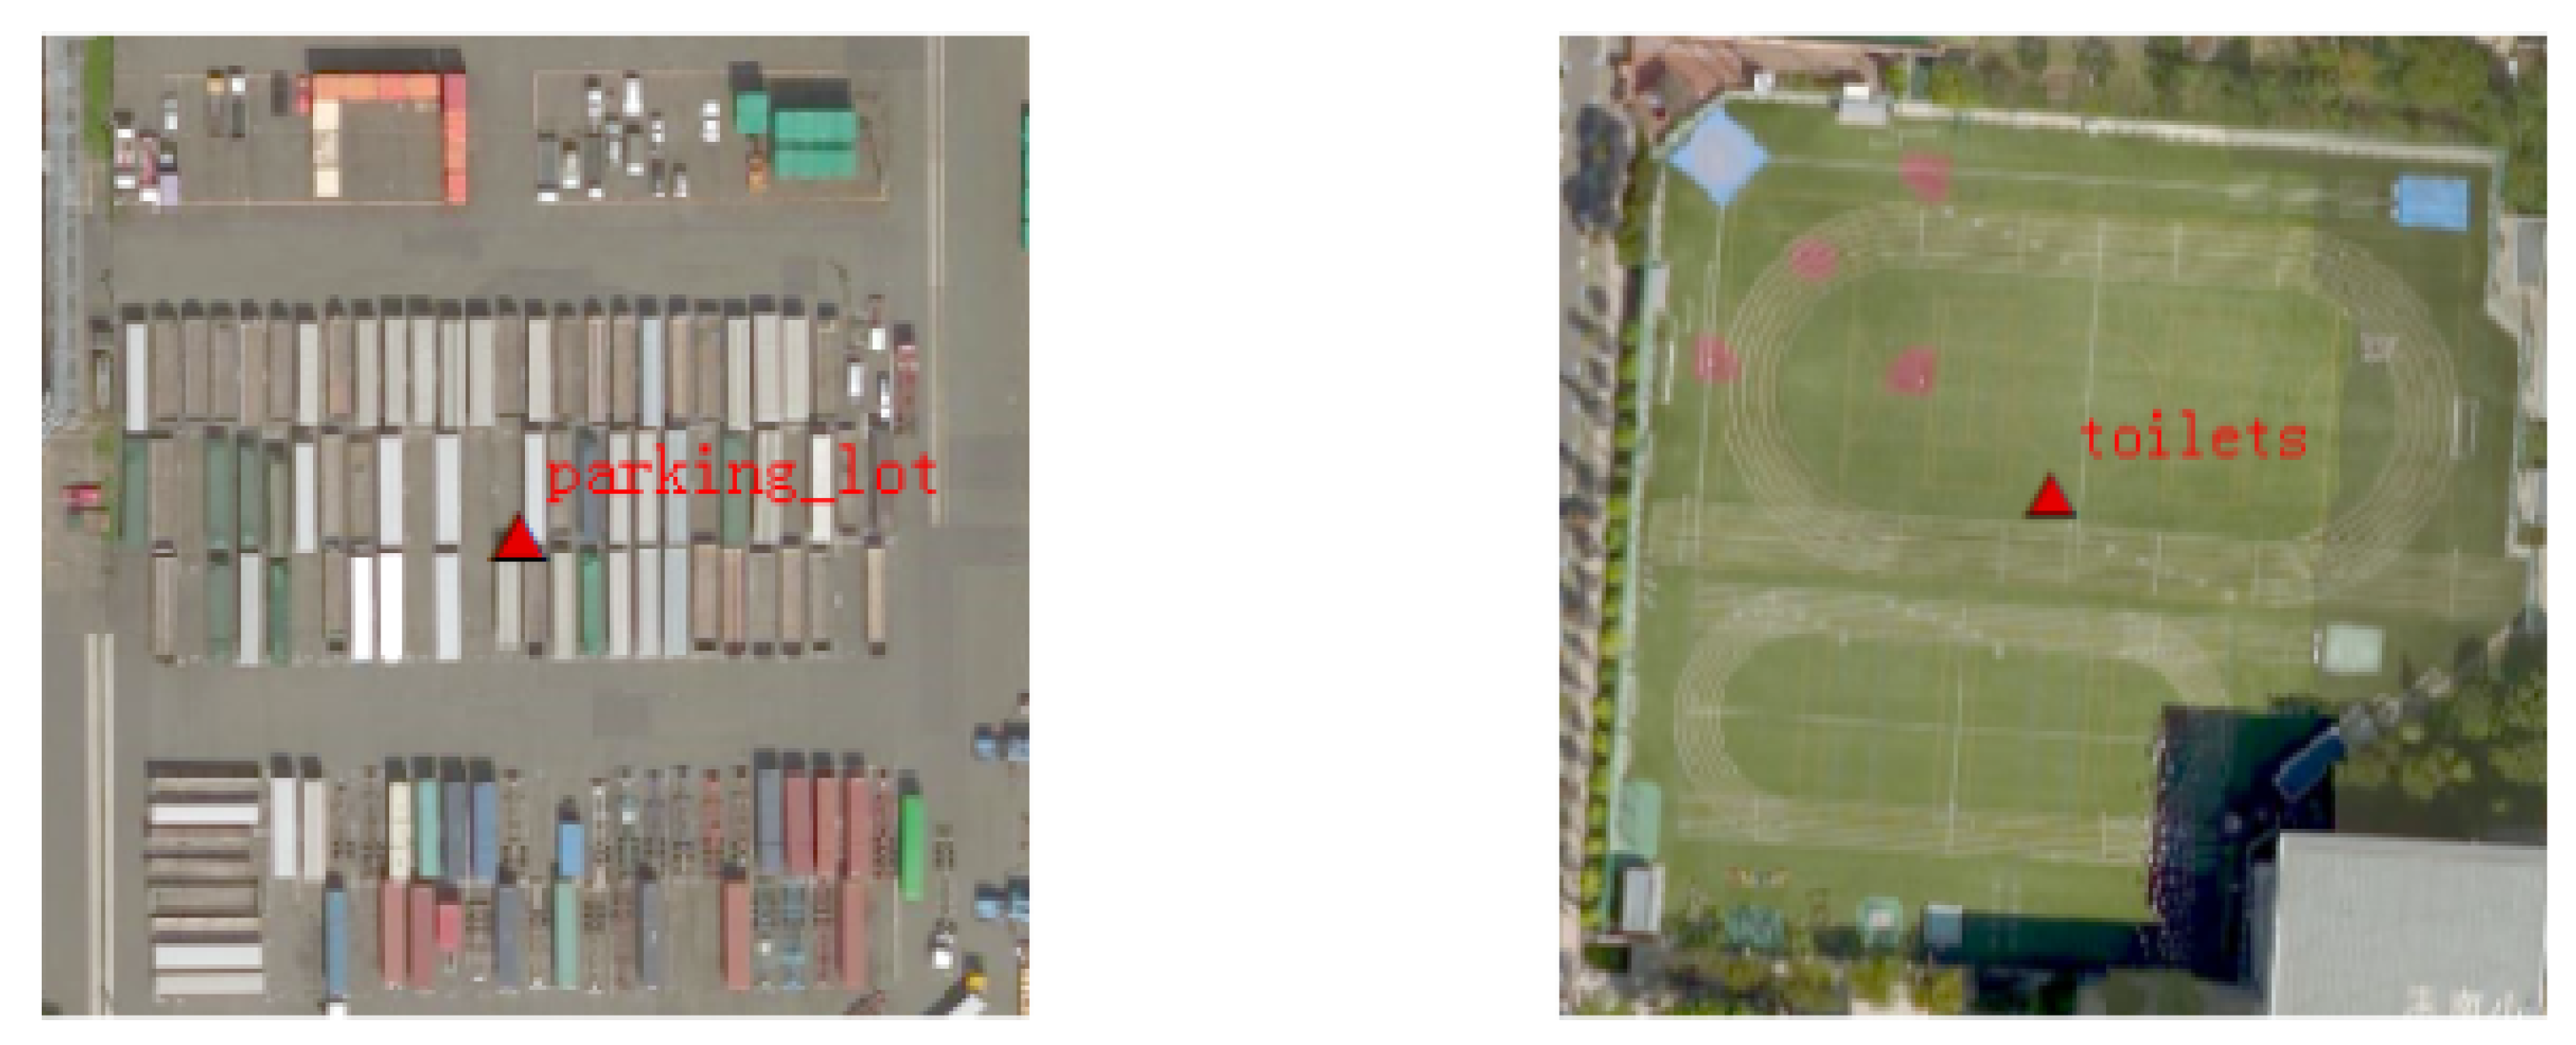
- For some POI data, the names of the objects are not exactly matched with those of the remote sensing image objects. For this phenomenon, we delete the POI data directly. (Figure 3).
3. RSI-CB Statistical Analysis
3.1. Geographical Distribution of RSI-CB
3.2. Hierarchy for RSI-CB Categories
- We analyzed the existing attributes of OSM data and the Chinese classification criteria of land use and selected the common categories among them as our preferred classes.
- We deleted the data that do not meet the basic requirements of the benchmark, as well as the using the principles for constructing the RSI-CB in Section 2.1.
3.3. Distribution Characteristics of RSI-CB
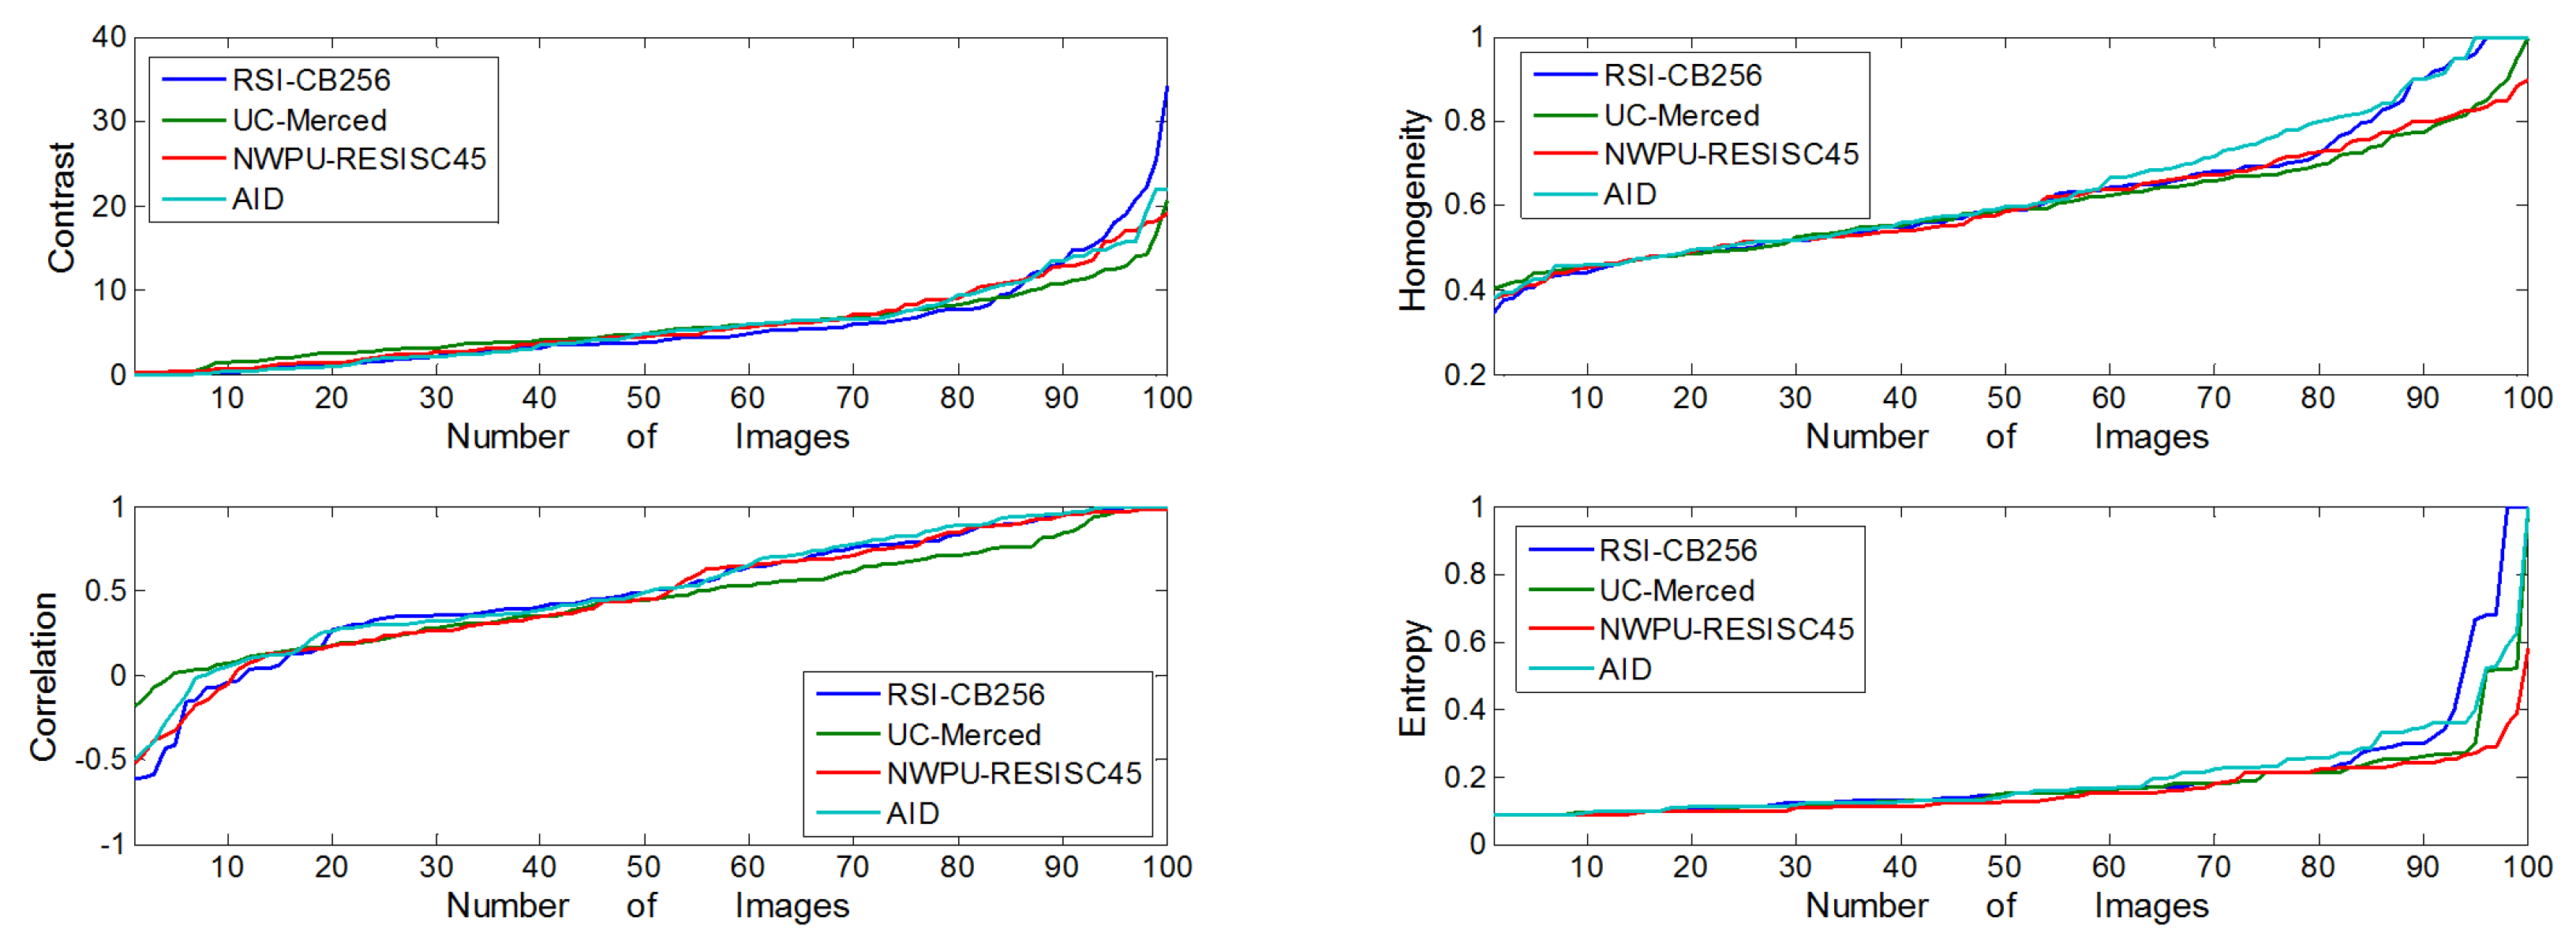
3.4. Comparison of RSI-CB with Some Remote Sensing Data Sets
- (1)
- Spatial resolutionRSI-CB has a higher spatial resolution than other existing data sets, which can be seen clearly from the image memory size: each image in AID is approximately 20–80 kb, with an image size of pixels; and the images of the NWPU-RESISC45 data set are approximately 10–20 kb, with an image size of pixels In this study, each image was almost 193 kb for RSI-CB. This high spatial resolution means more information detail and more comprehensive characteristic object information, which is useful for object recognition.
- (2)
- Scale of benchmarkRSI-CB is a larger-scale benchmark than any of the other databases, having approximately 24,000 images distributed in 35 categories (with approximately 690 images per category); compared to the relatively recent large-scale benchmark AID, in which there are 10,000 images distributed in 30 categories (with about 330 images per category).
- (3)
- Construction modelUnlike the previous database construction model, RSI-CB makes full use of crowdsourced geographic data, which has three main contributions to remote sensing image data set construction. First, we use the crowdsourced data for a high-efficiency and high-quality method to build a remote sensing benchmark, as well as providing the possibility of continued expansion, in terms of the diversity, richness, and scale of the benchmark. Second, we reflect the geographical significance of each geographic entity itself by constructing remote sensing data set with crowdsourced geographical data and making use of the criteria of the Chinese land-use classification in combination with the ImageNet hierarchical grading mechanism. Finally, we can use computers to achieve self-learning and learn the overall characteristics of objects according to massive crowdsourced data in the future, which can assist in automatic labeling and recognition purposes to further understand the images.
- (4)
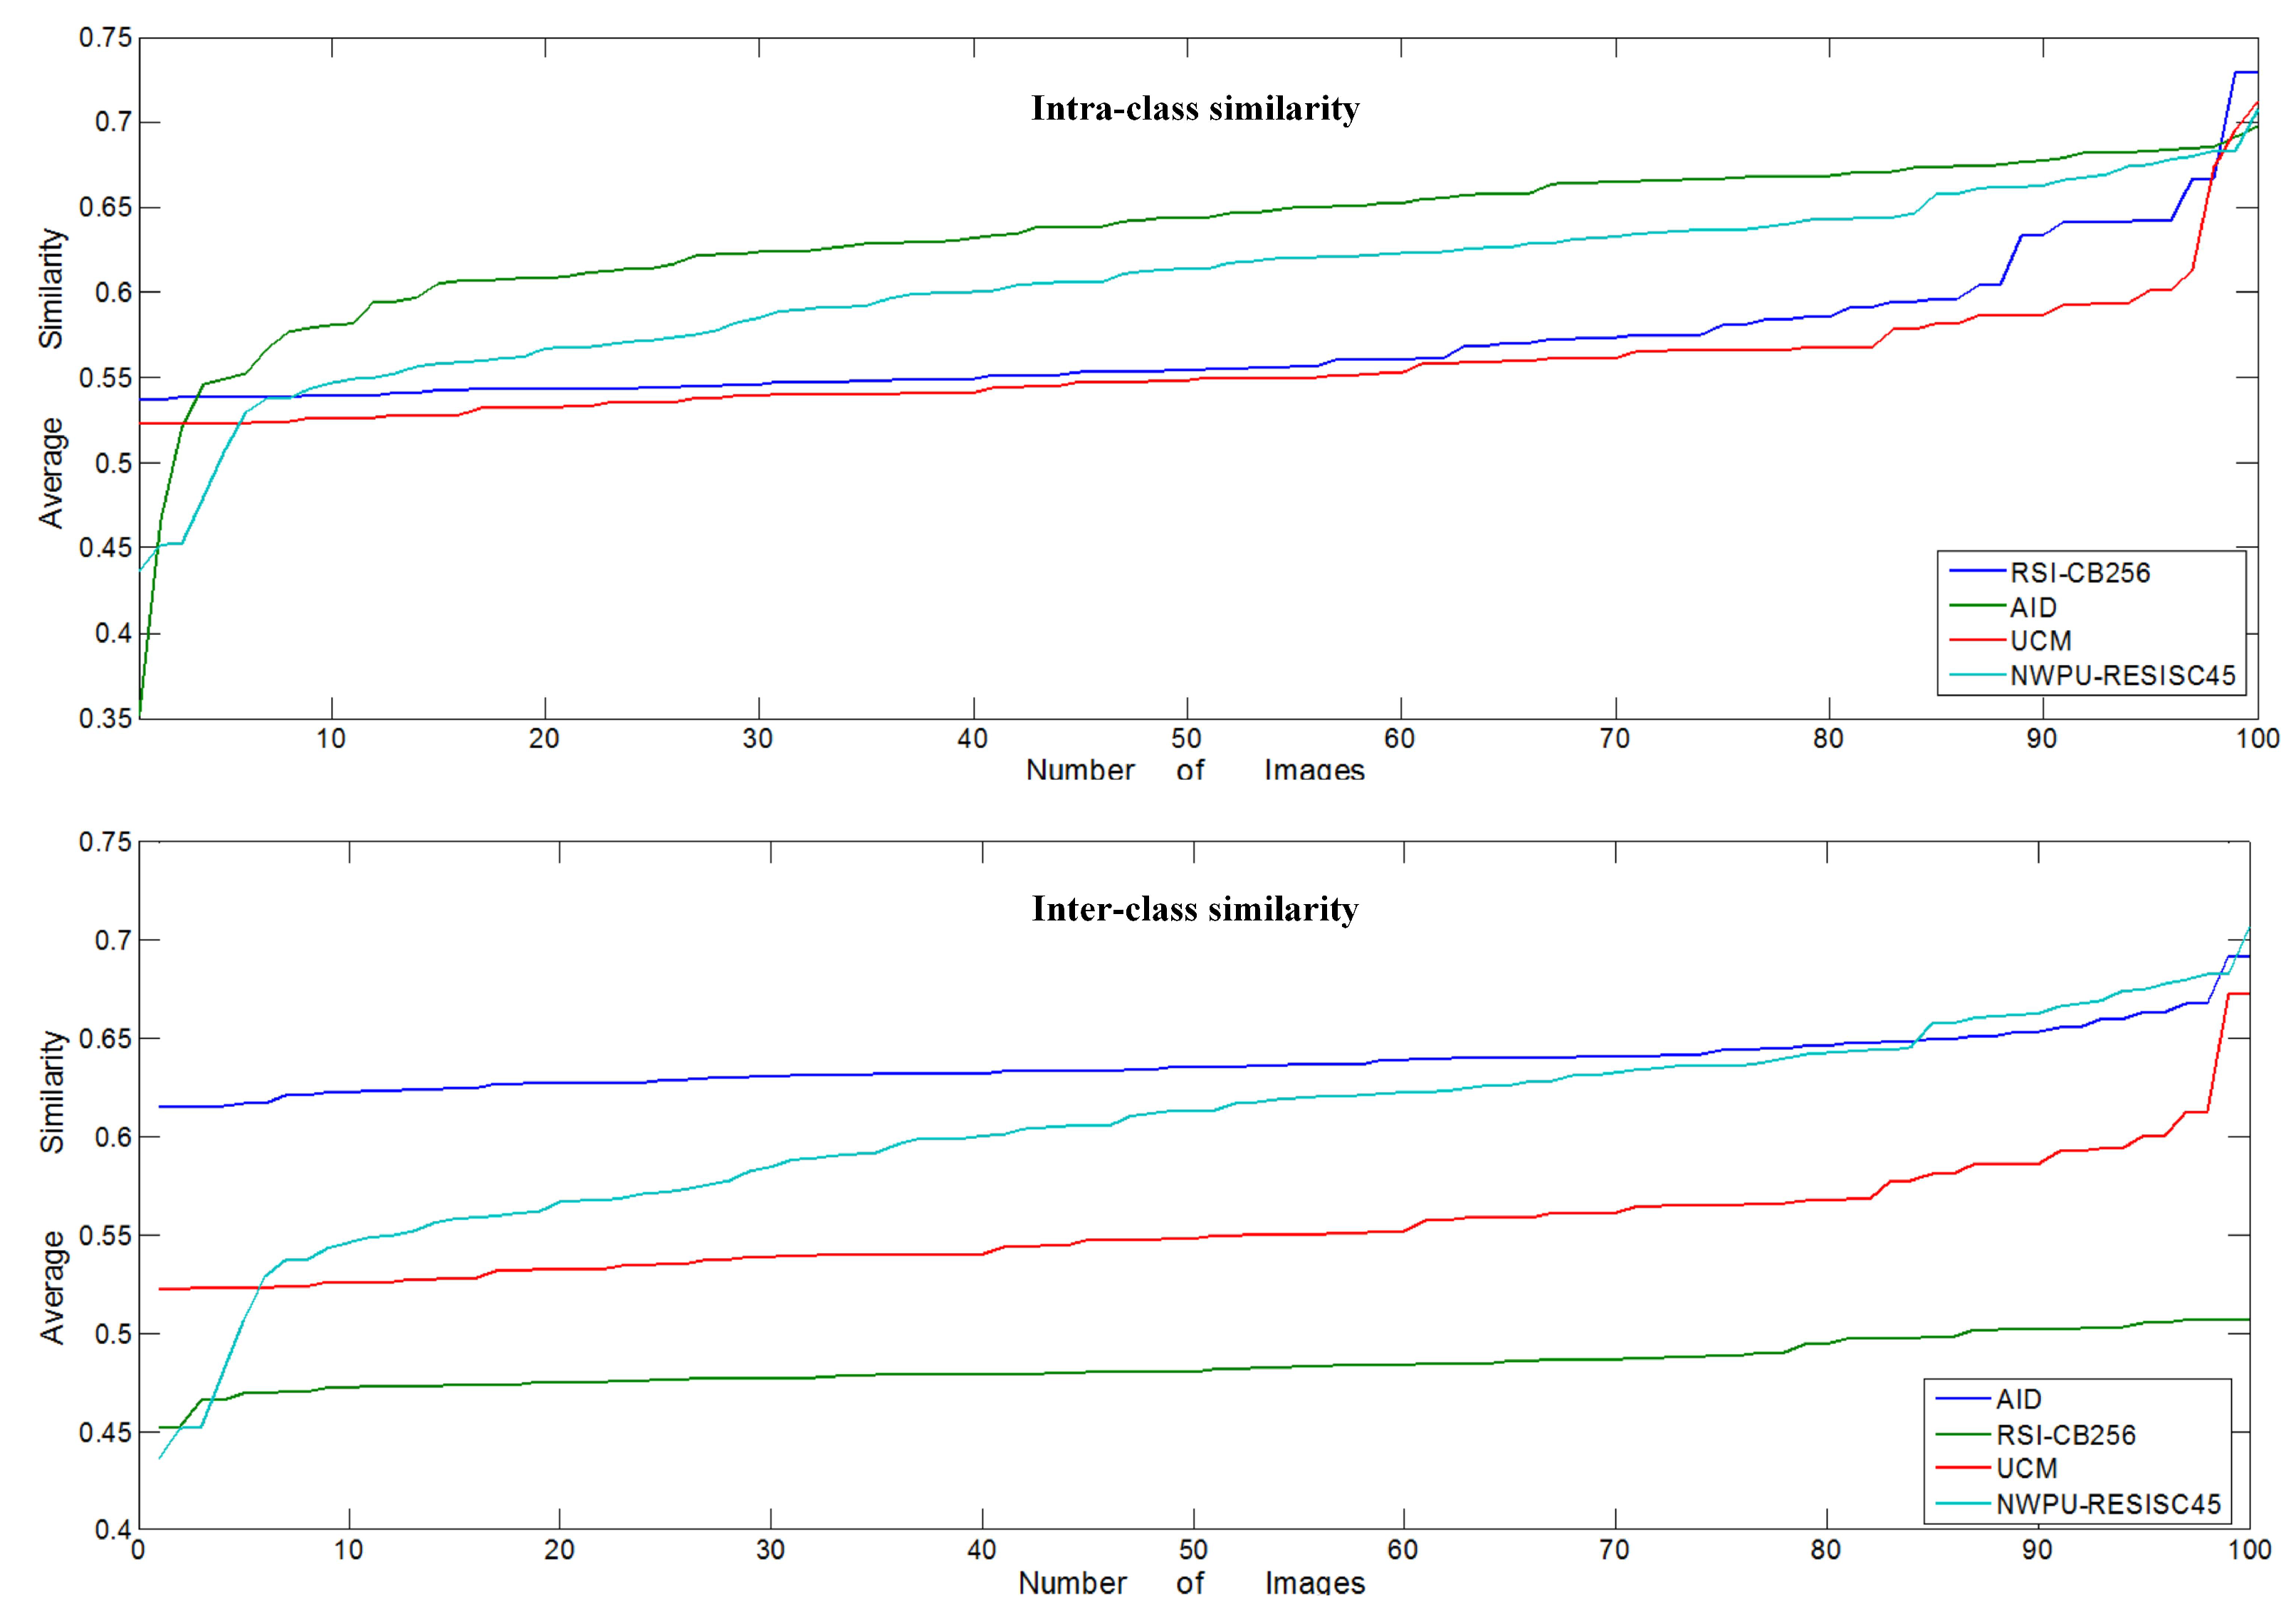
- Diversity of benchmark Database diversity metrics can be divided into intra-class diversity and inter-class diversity. Diversity can be measured by similarity: for the same class, if the similarity is higher, then the diversity is lower, and similarly for intra-class diversity. Therefore, we use the image similarity measure to verify the intensity of the image diversity, using the Bhattacharyya distance [61] to calculate the difference between vectors to reflect the degree of image similarity. In the statistical theory, the Bhattacharyya distance is used to measure the similarity of two discrete or continuous probability distributions as an approximation of the overlap between two statistical samples.
4. Experimental Analysis
4.1. Test Methods
- (1)
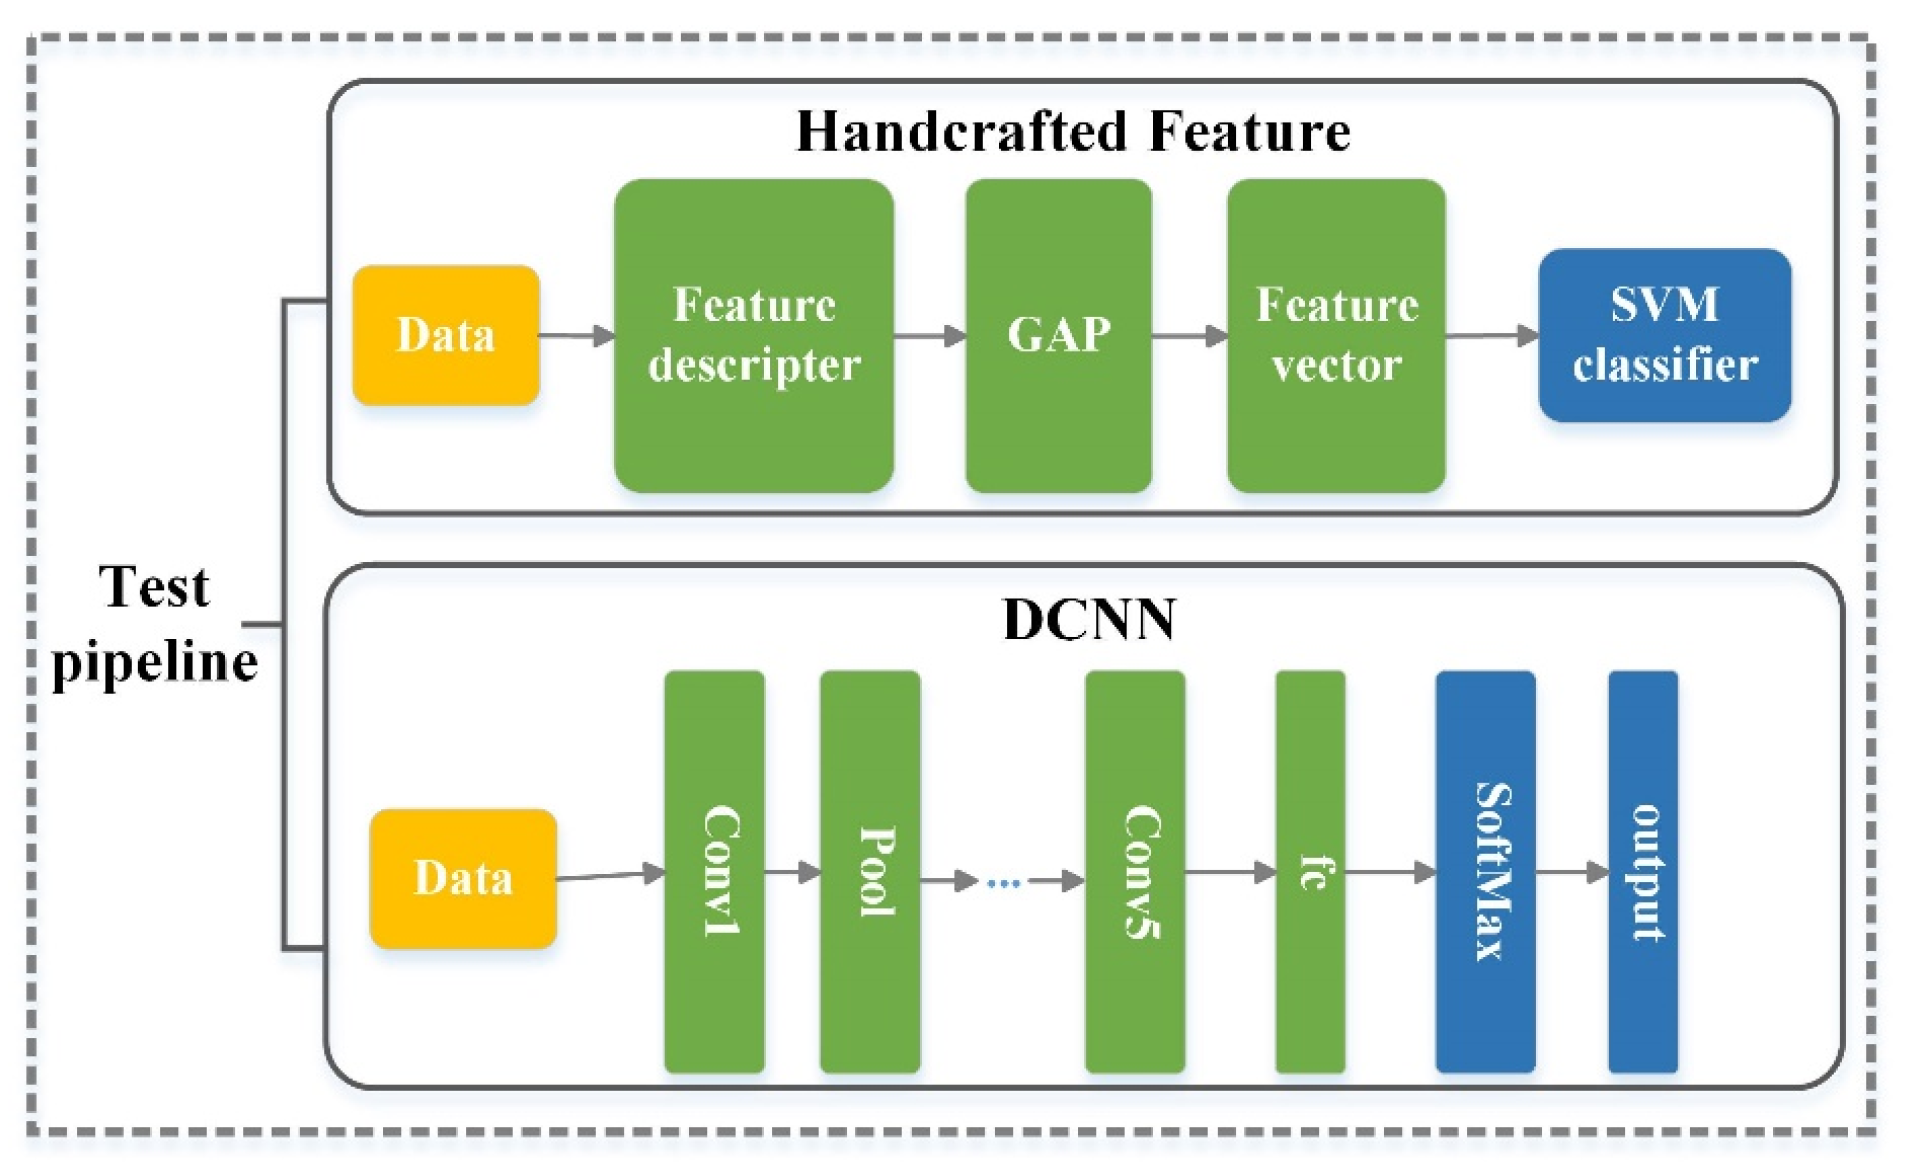
- Model selection: handcrafted feature models versus DCNN (learning feature) modelsWe used traditional handcrafted features and DCNNs based on end-to-end learning features as the test pipeline to test the performance of different methods on RSI-CB. As shown in Figure 10, for handcrafted features, we used SIFT [53], Color Histograms (CH), LBP, and GIST as the description operators and global mean pooling to construct the eigenvectors for these methods. Finally, the SVM model was employed to classify the images. For the end-to-end learning features, we used AlexNet [7], VGG-16 [10], GoogLeNet [57], and ResNet [9] to train RSI-CB. Figure 10 shows the test pipeline for RSI-CB. The top half of the figure introduces the test pipeline with handcrafted features. The bottom half of the figure shows the test pipeline with DCNN.
- (2)
- Training methodsWe trained DCNN models from scratch, rather than fine-tuning them, for the following reasons. First, considering the slight similarity between RSI-CB and ImageNet, the former uses satellite imagery and the latter uses a natural imagery. The second reason is to define our own network structure. Third, the scale of RSI-CB is relatively large. The last reason is that it is convenient for small-scale remote sensing image data sets to fine-tune.
- (3)
- Testing for model transfer performanceTransfer performance testing was based on the RSI-CB training model, which tests the model’s ability to identify other databases. We selected UC-Merced for the test database. We chose the lighter AlexNet-Conv3 model, considering the small scale of UC-Merced.
4.2. Data Organization
- Selecting data randomly: The training, validation, and test sets are randomly selected according to a certain proportion, and we disrupt labeling to further reflect the randomness of the data and objectivity.
- Data augmentation: We expand all RSI-CB data for each image by cutting a fixed-size patch from the center and upper-left, upper-right, lower-left, and lower-right corners of each image, and then flip them before using as input to the DCNN. Thus, the original data is expanded 10-fold.
- Data organization for model transfer performance: We test whether the RSI-CB training model can transfer to other data sets and the strength of its ability to transfer. We selected 13 categories which were common to UC-Merced and RSI-CB as experimental data. The size of these two types of data was pixels, as UC-Merced has only 100 images in each class. We selected 1300 images for RSI-CB and UC-Merced as the test set.
4.3. Parameter Settings
- (1)
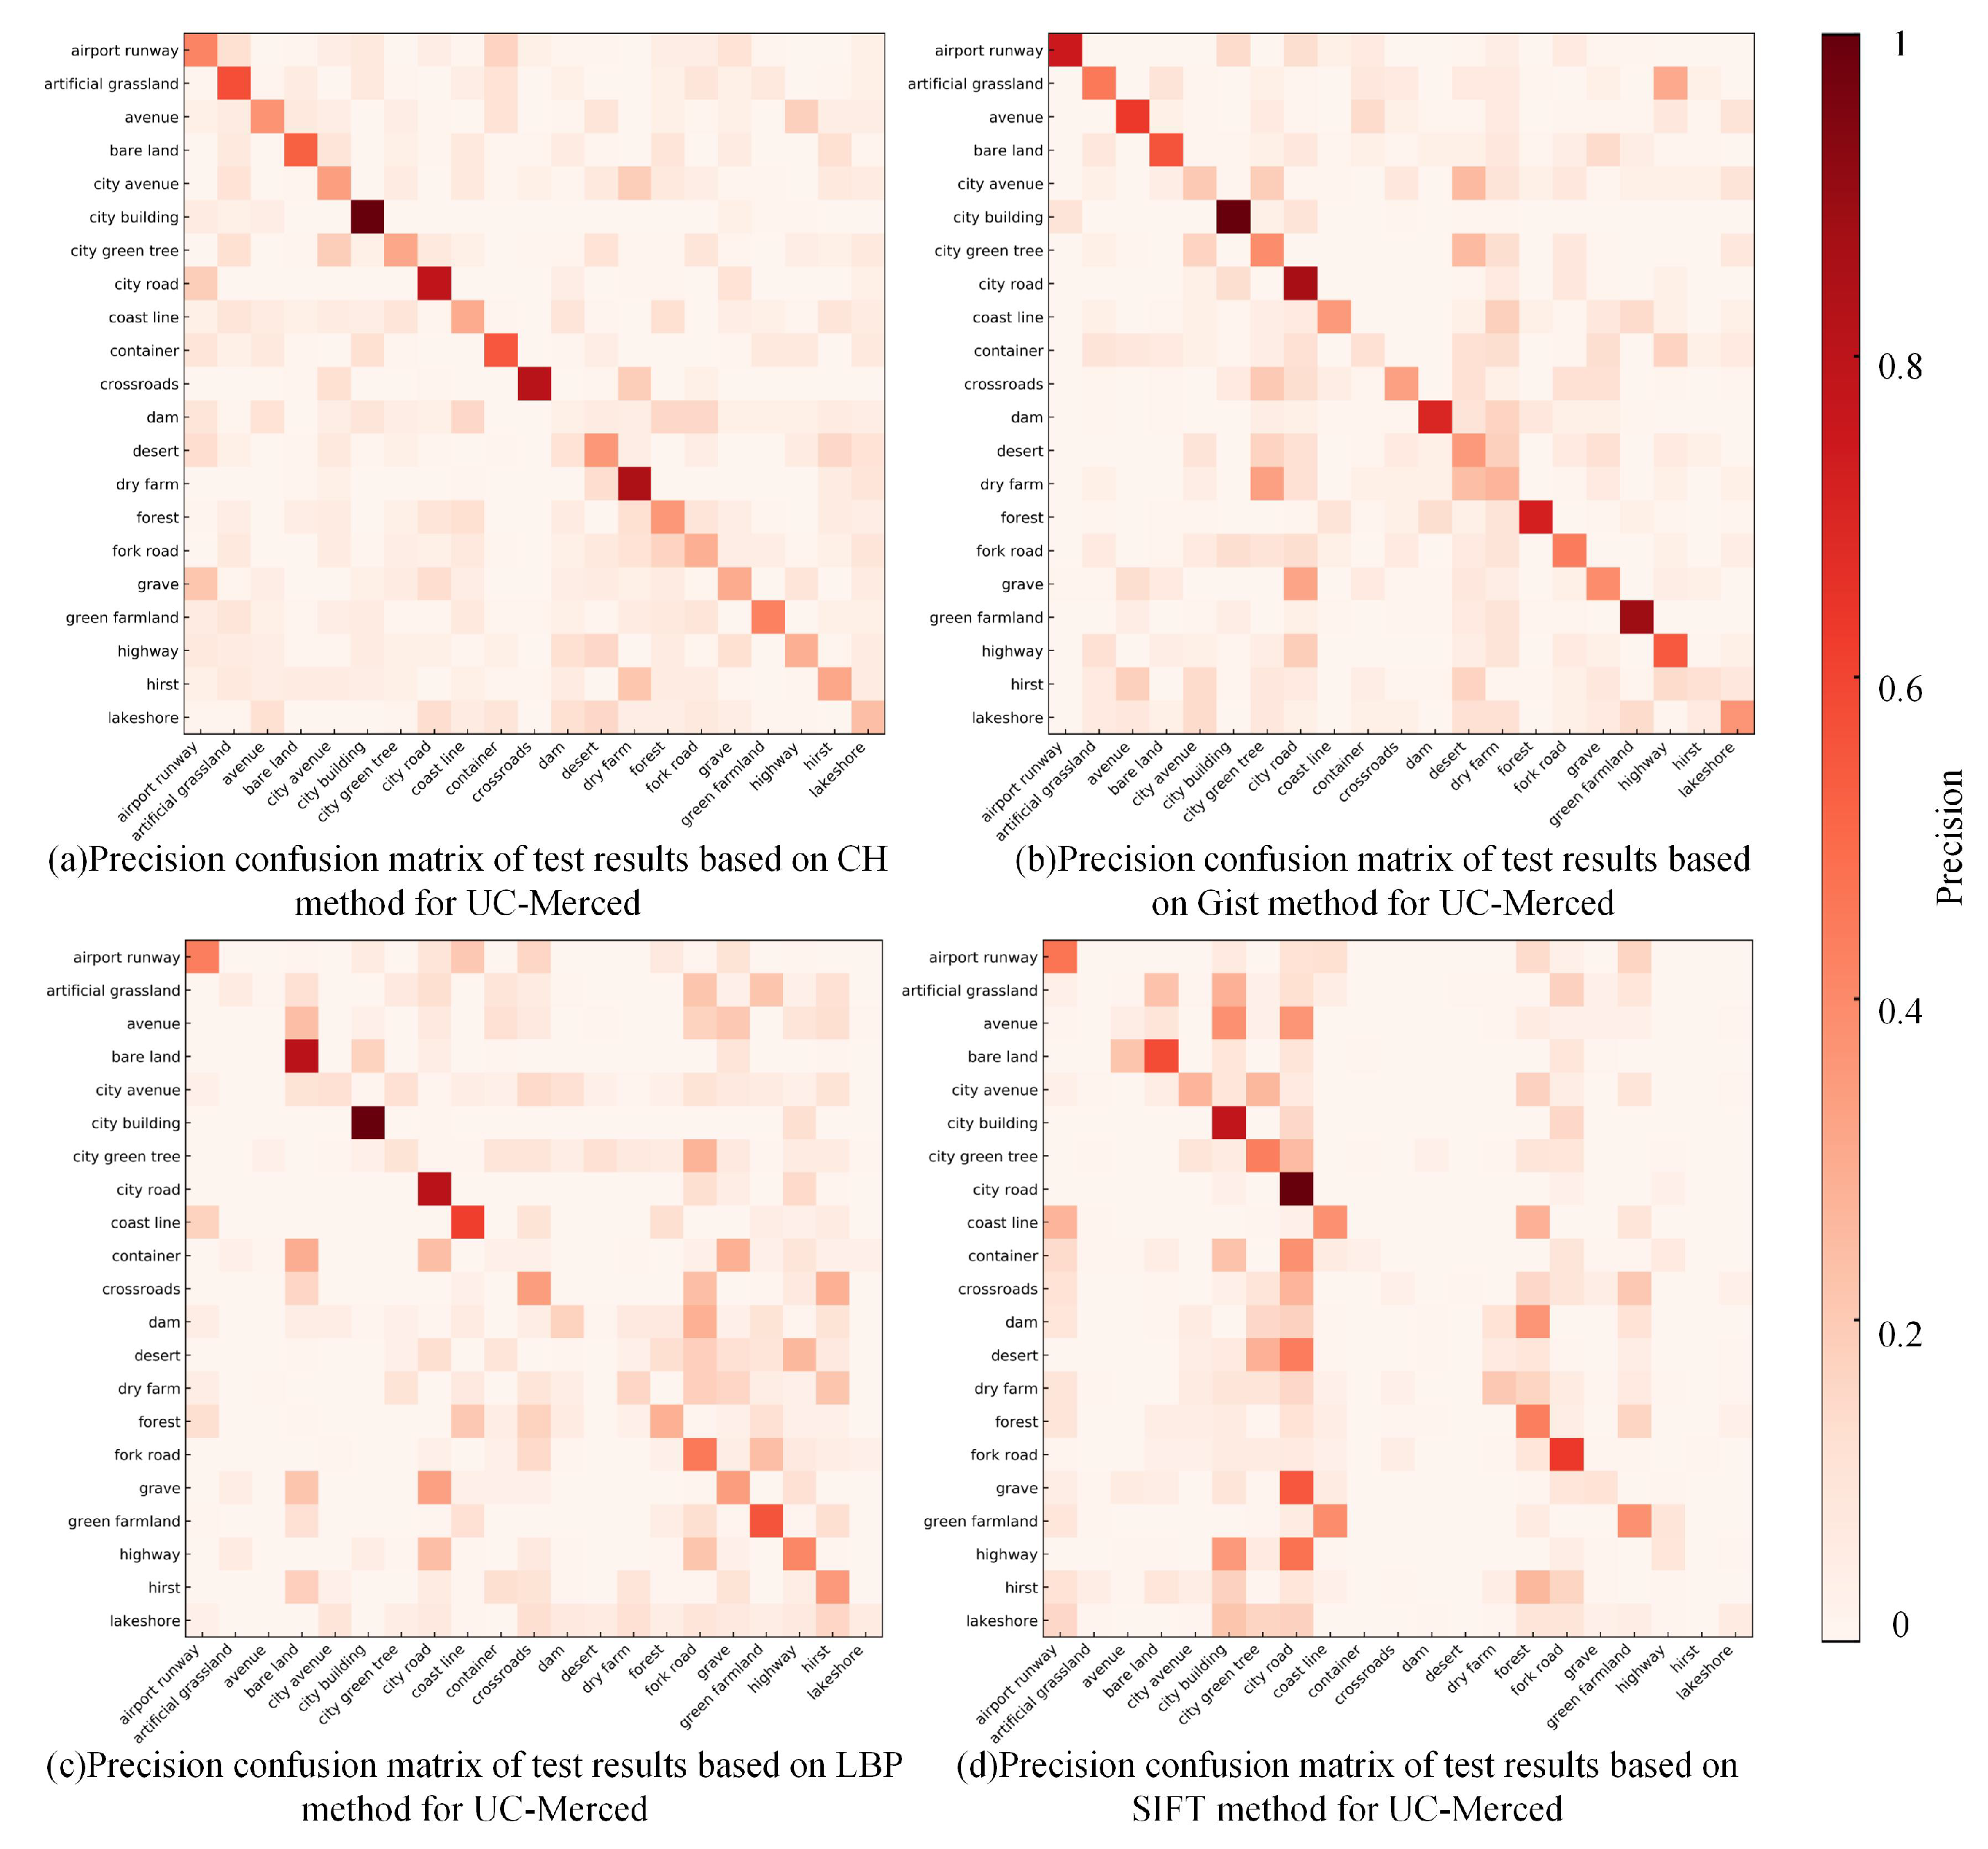
- Handcrafted featuresWe refer to the method of Reference [48], which used four low-level features—namely, SIFT, LBP, CH, and GIST—as feature description operators. For the SIFT descriptor operator, we used a fixed-size grids with a step of eight pixels to extract all descriptive operators in the gray image. Each dimension describing the operator used the average pooling method to finally obtain the 128-dimensional image feature. For LBP, we used the usual eight directions to obtain the binary value and converted the 8-bit binary value to a decimal value for each pixel in the grayscale image. Finally, we obtained the LBP feature by calculating the frequencies of the 256 gray levels. For CH, we used the RGB color space directly and quantized each channel into 32 bins. Therefore, we obtained the features of images by connecting the statistical histogram in each channel. For GIST, we used the original parameter settings from Reference [56] directly, using four scales, eight directions, and a spatial grid for pooling. Finally, we obtained a 512 () dimensional eigenvector.
- (2)
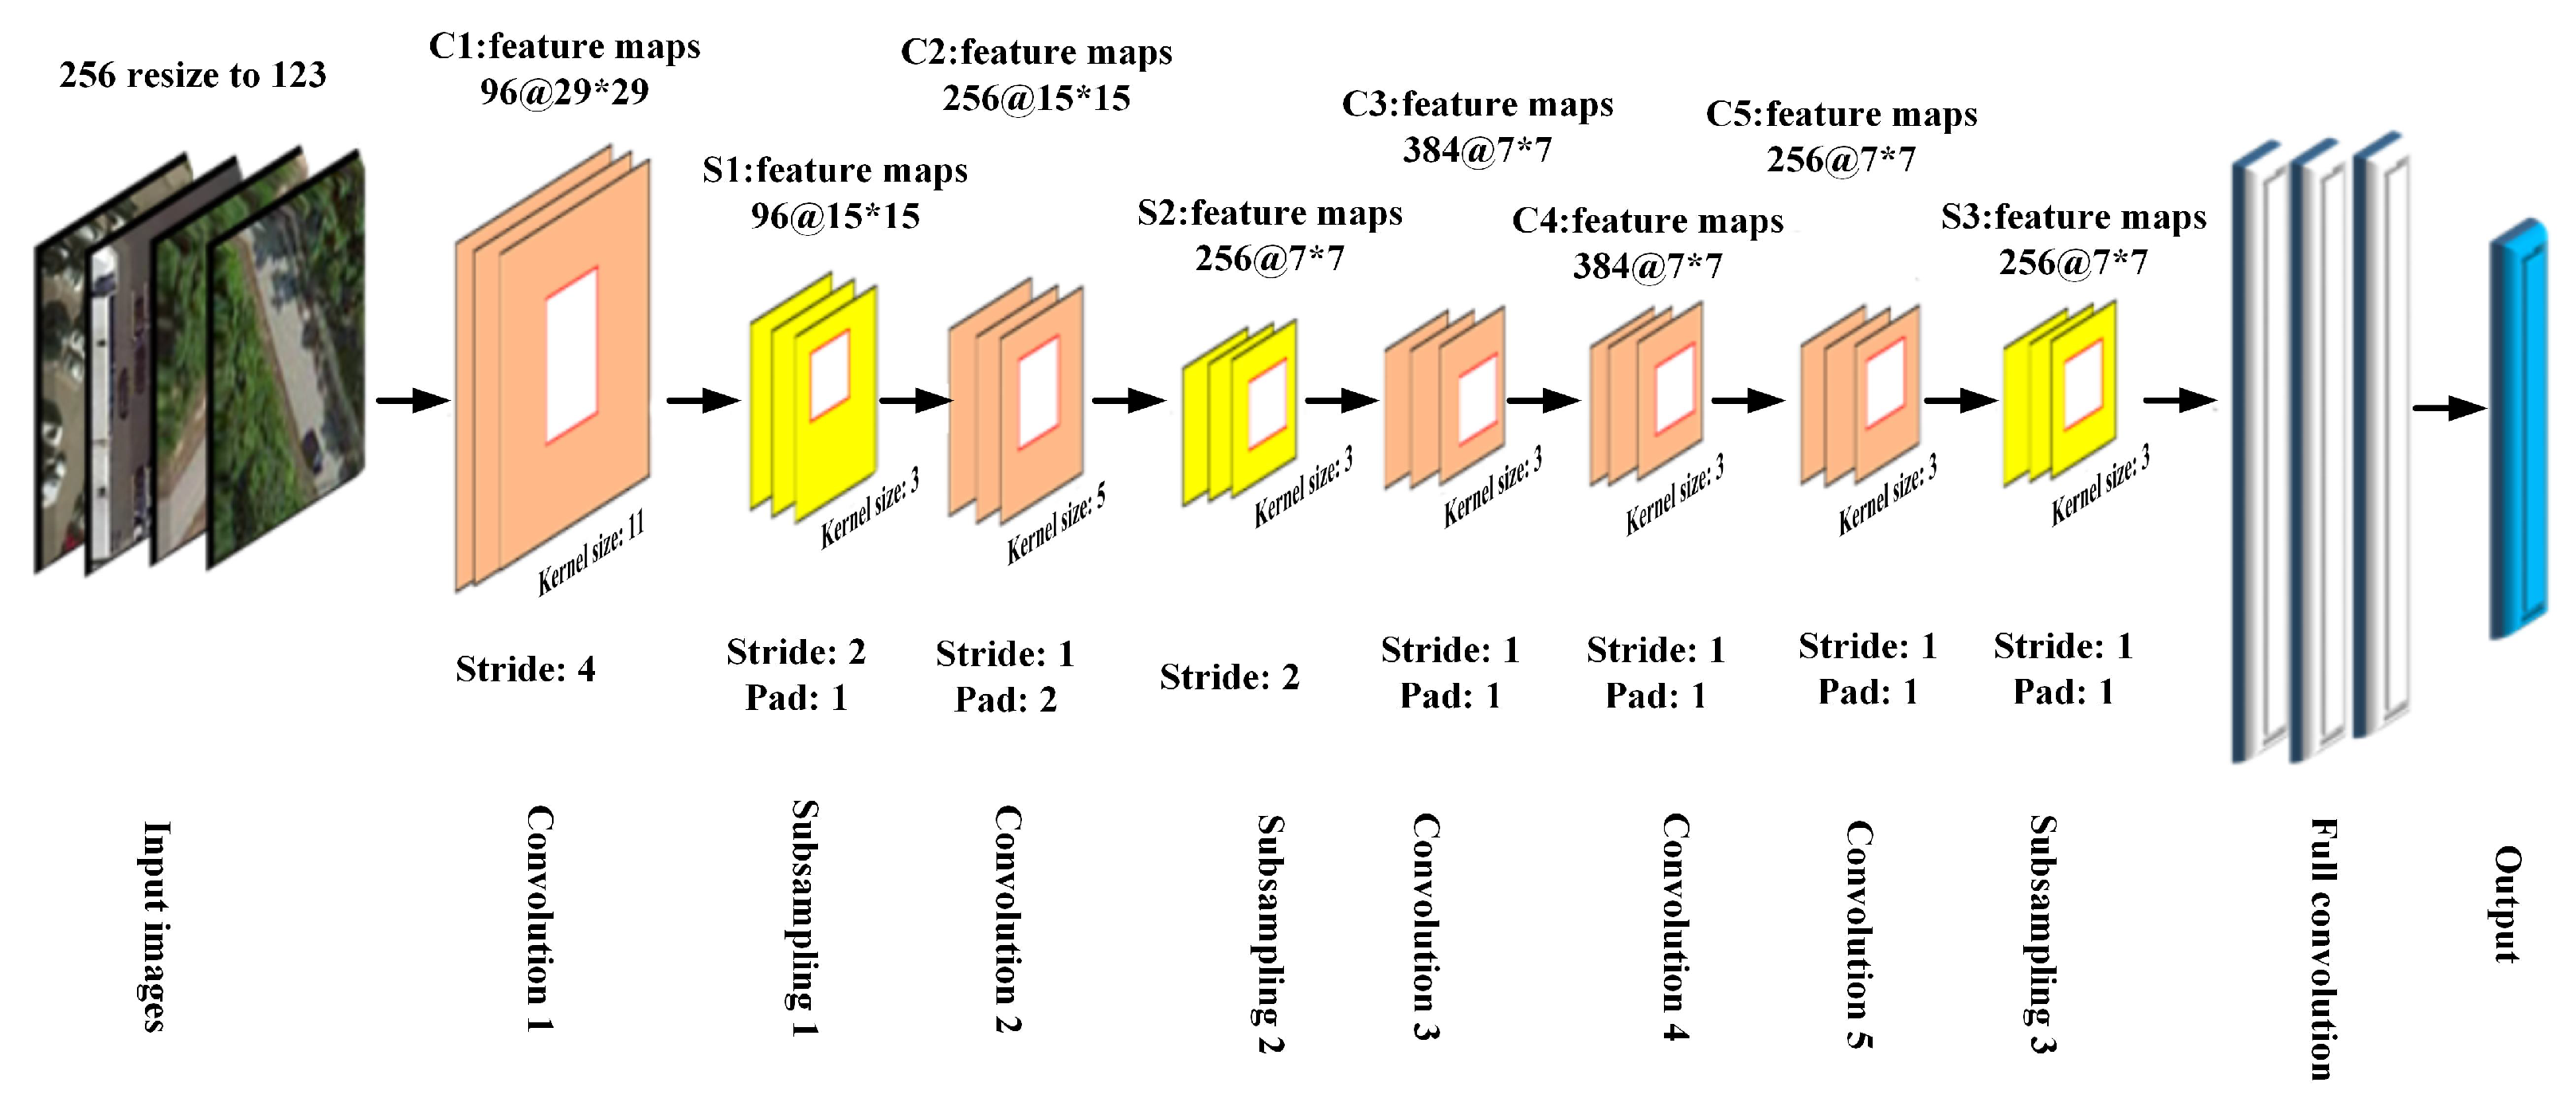
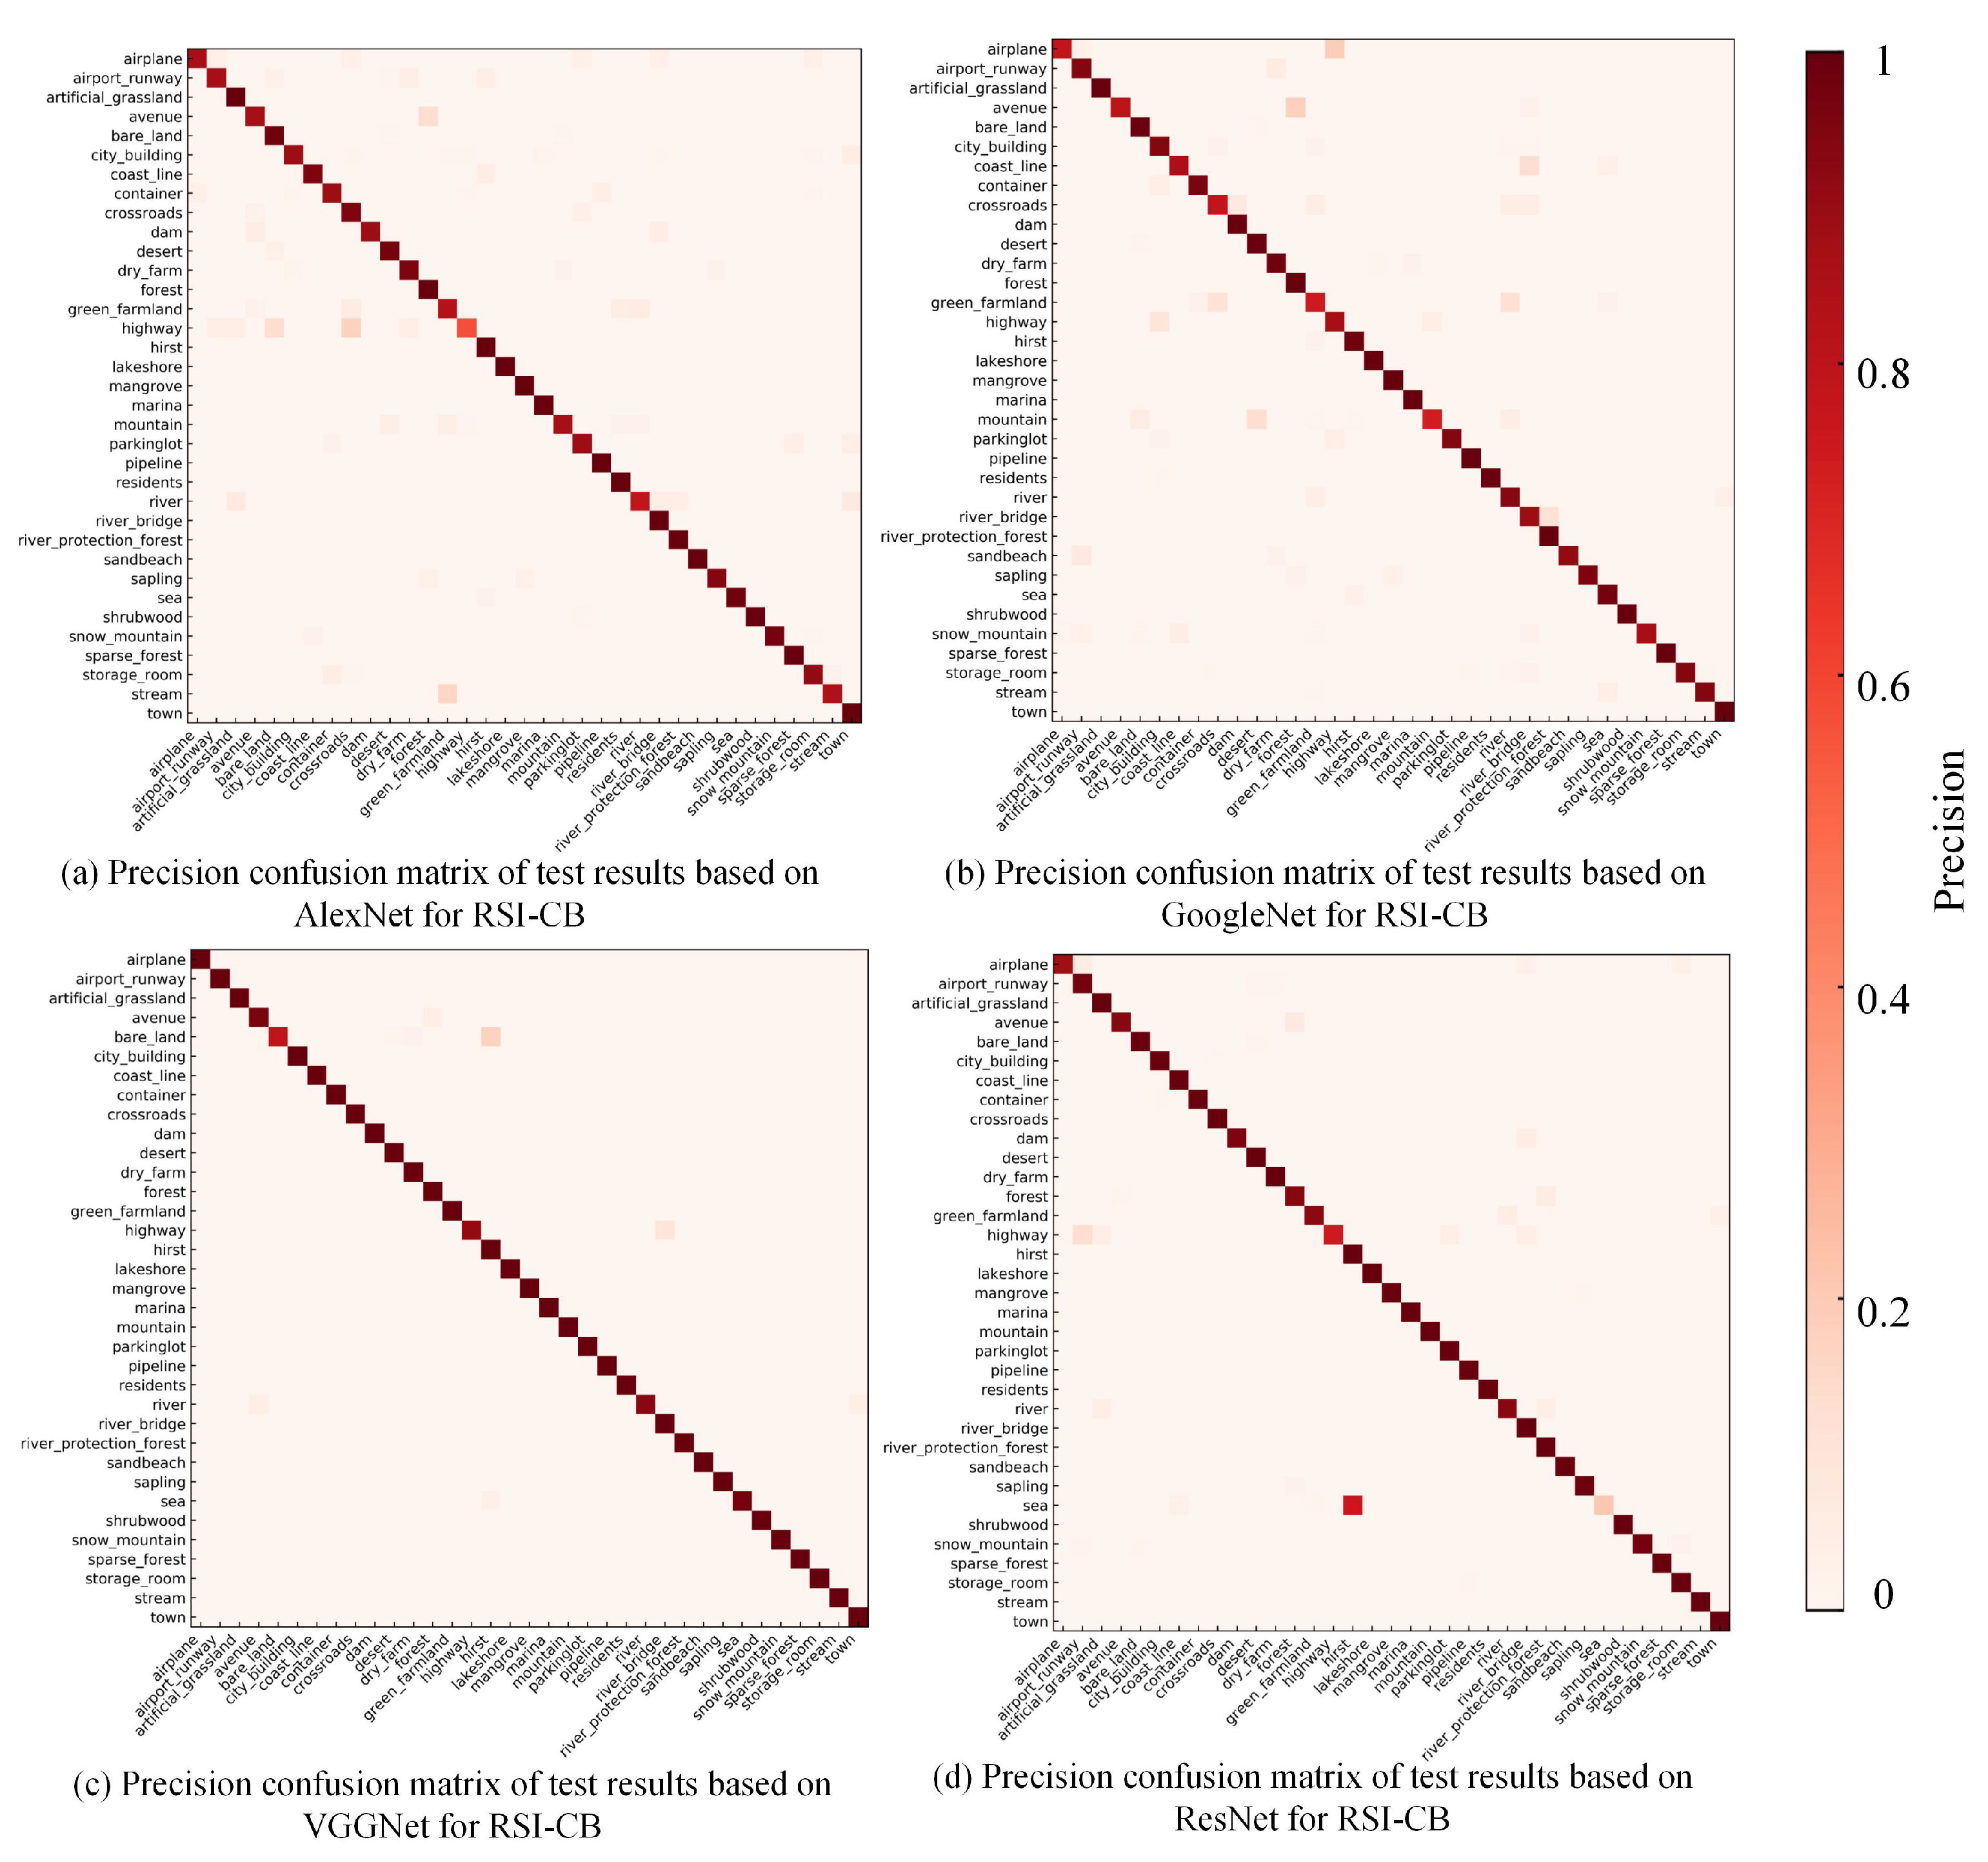
- DCNN modelsWe retained most of the default parameters to train the DCNN and fine-tune the learning rate and batch size. Our model converged better, although we made concessions in terms of the computational time and convergence rate. In addition, the vibration of the loss function value was smaller, which was beneficial in improving the performance of our model. In the RSI-CB test, we implemented a slight adjustment in the network due to the input size constraints of the network and adjusted the padding for the convolution and pooling layers. We did not warp images, as this affects the real information of the images, to some extent. Figure 11 shows the AlexNet model parameter settings in RSI-CB.
4.4. Evaluation Methods
- OA refers to the ratio of the number of categories that are correctly classified to the total number of categories. The OA value can provide a good characterization of the overall classification accuracy. However, when the categories are extremely imbalanced, the OA value is greatly affected by categories with more images.
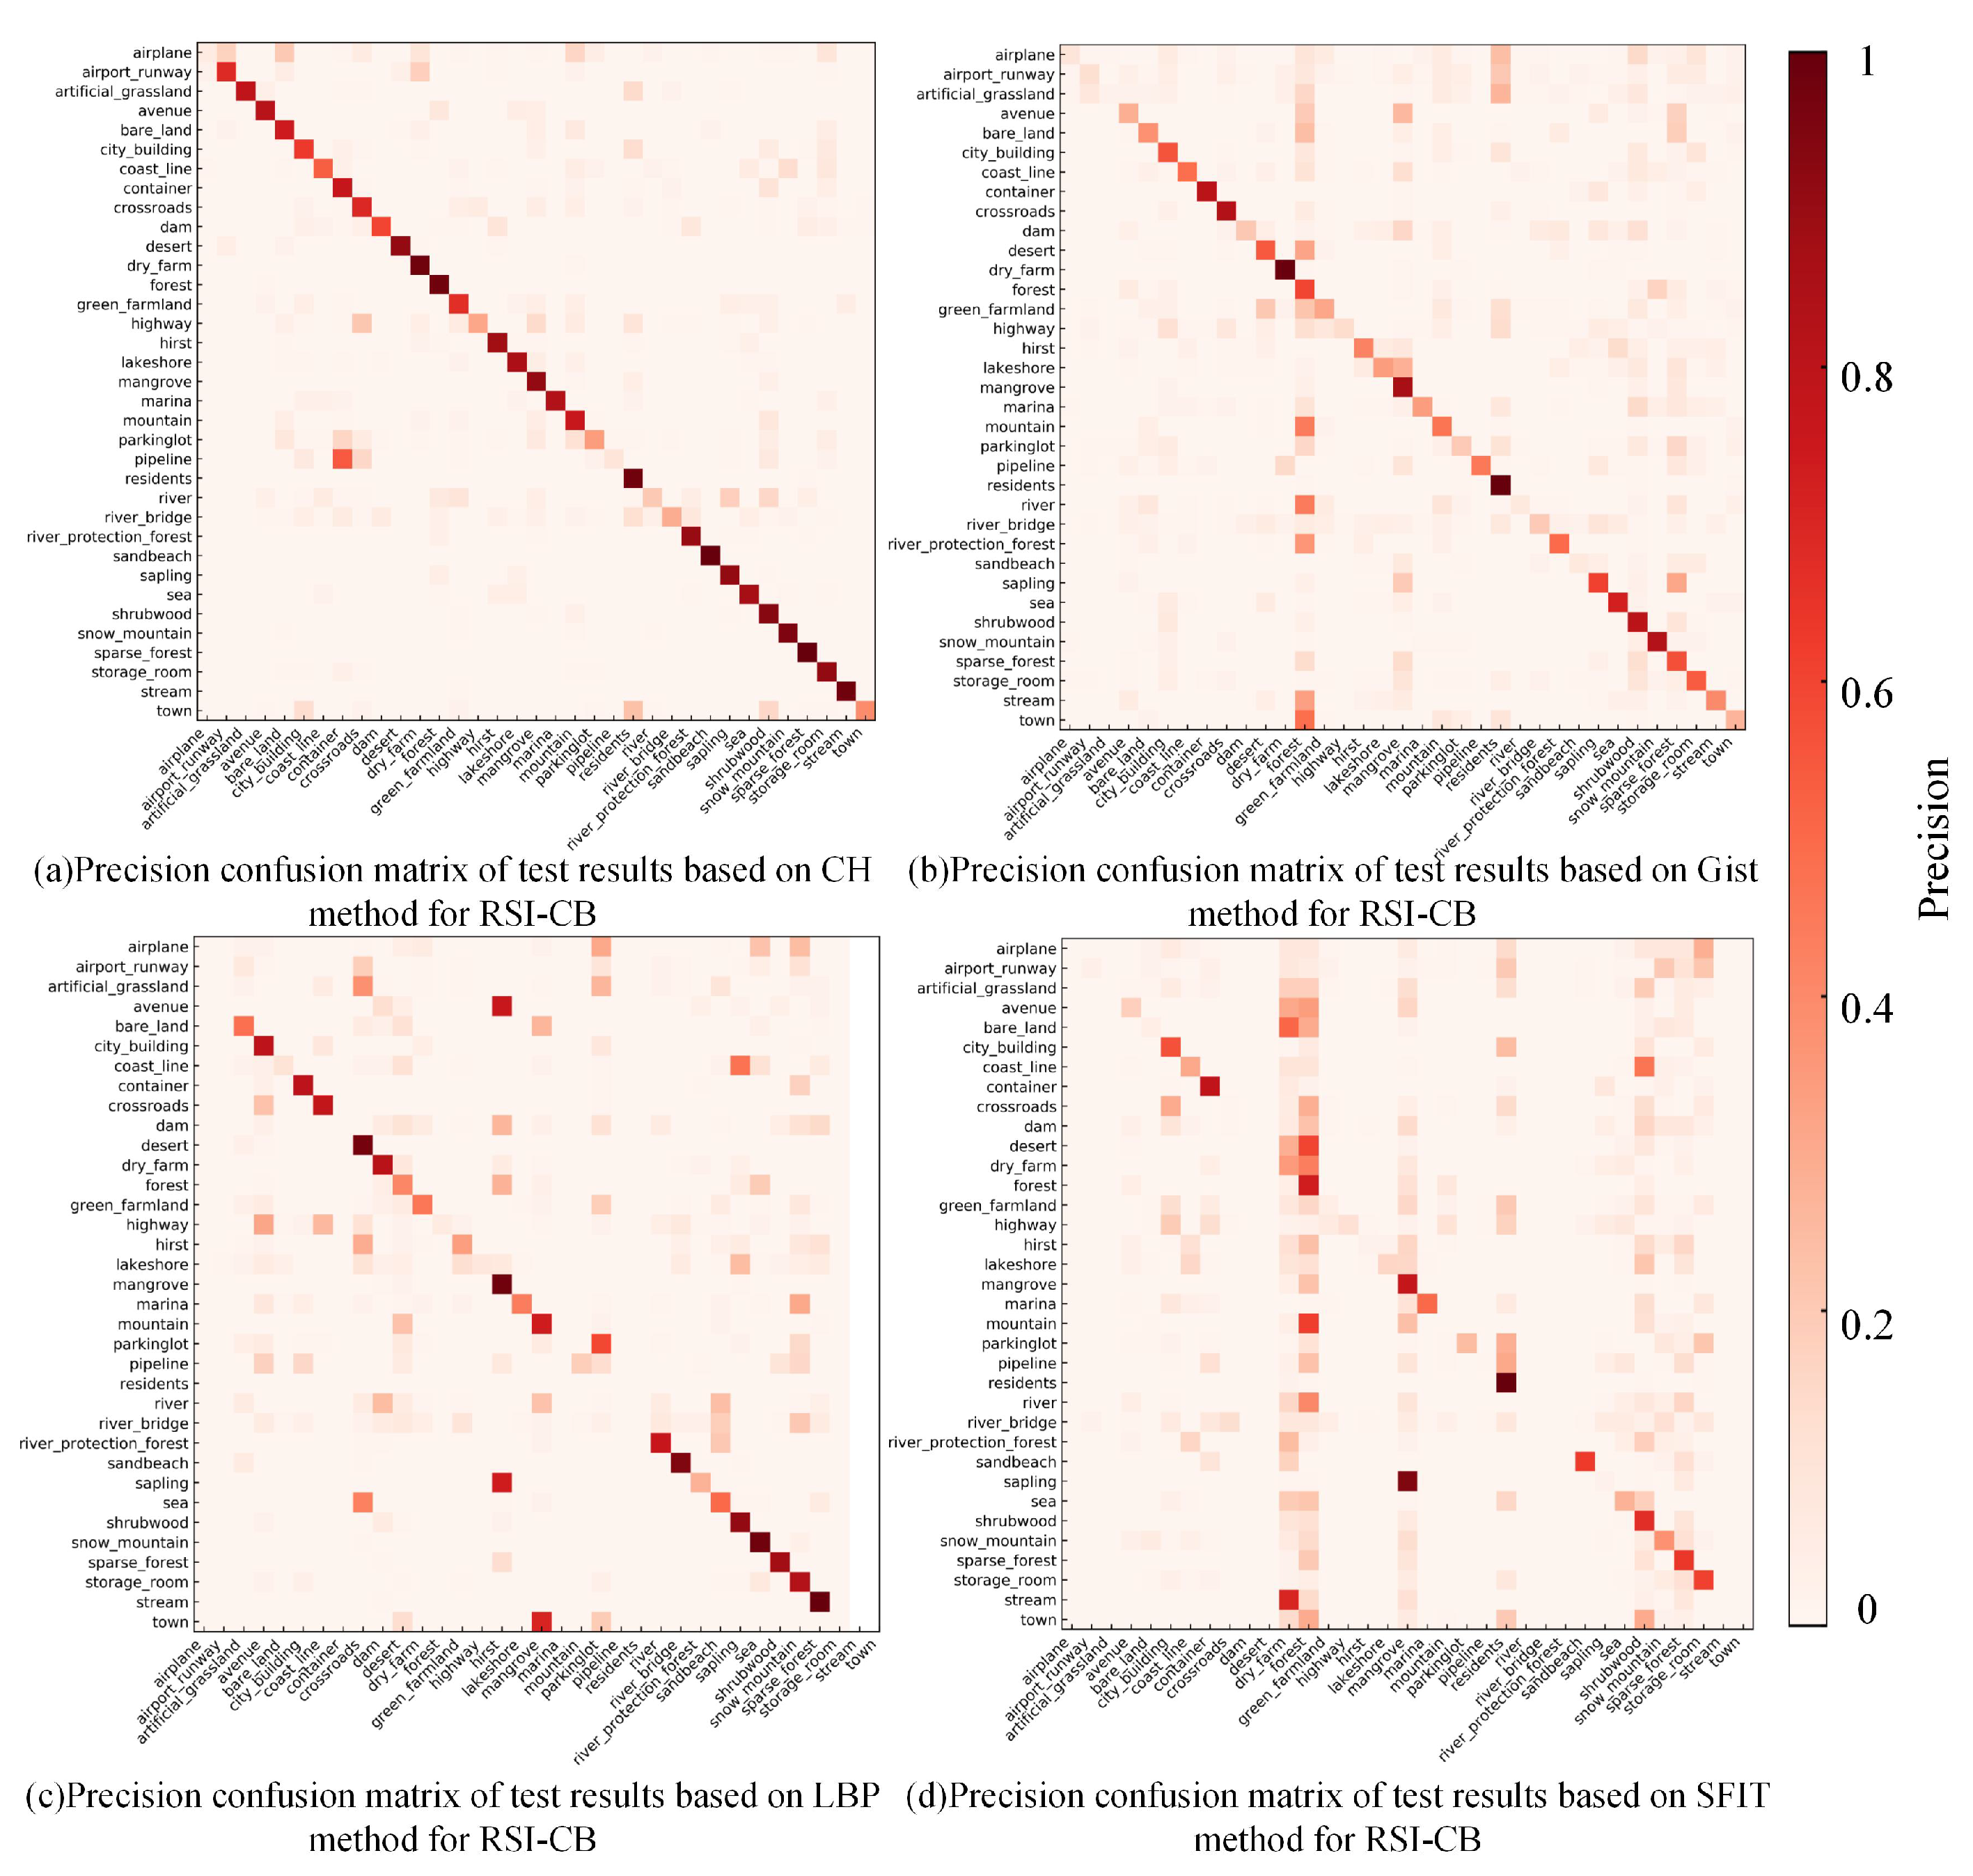
- The confusion matrix can visually reflect the classification accuracy of each type of object. We can clearly determine the correct and wrong classifications in each category of each row. For better visualization, we use a thermodynamic chart to display the confusion matrix.
4.5. Experimental Results
4.5.1. Classification Results Based on Handcrafted Features
4.5.2. Classification Results Based on DCNN
4.5.3. Evaluation of Model Transfer Capability
5. Conclusions and Future Works
Author Contributions
Funding
Conflicts of Interest
References
- Cheng, G.; Han, J.; Guo, L.; Liu, Z.; Bu, S.; Ren, J. Effective and efficient midlevel visual elements-oriented land-use classification using VHR remote sensing images. IEEE Trans. Geosci. Remote Sens. 2015, 53, 4238–4249. [Google Scholar] [CrossRef]
- Cheng, G.; Han, J.; Zhou, P.; Guo, L. Multi-class geospatial object detection and geographic image classification based on collection of part detectors. ISPRS J. Photogramm Remote Sens. 2014, 98, 119–132. [Google Scholar] [CrossRef]
- Cheng, G.; Han, J.; Lu, X. Remote Sensing Image Scene Classification: Benchmark and State of the Art. Proc. IEEE 2017, 10, 1865–1883. [Google Scholar]
- Han, J.; Zhang, D.; Cheng, G.; Guo, L.; Ren, J. Object detection in optical remote sensing images based on weakly supervised learning and high-level feature learning. IEEE Trans. Geosci. Remote Sens. 2014, 53, 3325–3337. [Google Scholar] [CrossRef]
- Yao, X.; Han, J.; Cheng, G.; Qian, X.; Guo, L. Semantic annotation of high-resolution satellite images via weakly supervised learning. IEEE Trans. Geosci. Remote Sens. 2016, 54, 3660–3671. [Google Scholar] [CrossRef]
- Yao, X.; Han, J.; Zhang, D.; Nie, F. Revisiting co-saliency detection: A novel approach based on two-stage multi-view spectral rotation co-clustering. IEEE Trans. Image Process. 2017, 26, 3196–3209. [Google Scholar] [CrossRef] [PubMed]
- Krizhevsky, A.; Sutskever, I.; Hinton, G.E. Imagenet classification with deep convolutional neural networks. Adv. Neural Inf. Process. Syst. 2012, 1097–1105. [Google Scholar] [CrossRef]
- Deng, J.; Dong, W.; Socher, R.; Li, L.J.; Li, F.F. ImageNet: A Large-Scale Hierarchical Image Database. In Proceedings of the IEEE Computer Society Conference on Computer Vision and Pattern Recognition (CVPR 2009), Miami, FL, USA, 20–25 June 2009. [Google Scholar]
- He, K.; Zhang, X.; Ren, S.; Sun, J. Delving deep into rectifiers: Surpassing human-level performance on imagenet classification. In Proceedings of the IEEE International Conference on Computer Vision, Las Condes, Chile, 11–18 December2015; pp. 1026–1034. [Google Scholar]
- Simonyan, K.; Zisserman, A. Very deep convolutional networks for large-scale image recognition. arXiv 2014, arXiv:1409.1556. [Google Scholar]
- Zhou, B.; Khosla, A.; Lapedriza, A.; Oliva, A.; Torralba, A. Learning deep features for discriminative localization. In Proceedings of the IEEE Conference on Computer Vision and Pattern Recognition, Las Vegas, NV, USA, 26–30 June 2016; pp. 2921–2929. [Google Scholar]
- Sun, Y.; Wang, X.; Tang, X. Hybrid deep learning for face verification. In Proceedings of the IEEE International Conference on Computer Vision, Sydney, Australia, 1–8 December 2013; pp. 1489–1496. [Google Scholar]
- Sun, Y.; Chen, Y.; Wang, X.; Tang, X. Deep learning face representation by joint identification-verification. arXiv 2014, arXiv:1406.4773. [Google Scholar]
- Sun, Y.; Wang, X.; Tang, X. Deep learning face representation from predicting 10,000 classes. In Proceedings of the IEEE Conference on Computer Vision and Pattern Recognition, Columbus, OH, USA, 24–27 June 2014; pp. 1891–1898. [Google Scholar]
- Sun, Y.; Wang, X.; Tang, X. Deeply learned face representations are sparse, selective, and robust. In Proceedings of the IEEE Conference on Computer Vision and Pattern Recognition, Boston, MA, USA, 7–12 June 2015; pp. 2892–2900. [Google Scholar]
- Taigman, Y.; Yang, M.; Ranzato, M.; Wolf, L. Deepface: Closing the gap to human-level performance in face verification. In Proceedings of the IEEE Conference on Computer Vision and Pattern Recognition, Columbus, OH, USA, 24–27 June 2014; pp. 1701–1708. [Google Scholar]
- Donahue, J.; Hendricks, L.A.; Rohrbach, M.; Venugopalan, S.; Guadarrama, S.; Saenko, K.; Darrell, T. Long-term Recurrent Convolutional Networks for Visual Recognition and Description. IEEE Trans. Pattern Anal. Mach. Intell. 2014, 39, 677–691. [Google Scholar] [CrossRef]
- Ji, S.; Xu, W.; Yang, M.; Yu, K. 3D convolutional neural networks for human action recognition. IEEE Trans. Pattern Anal. Mach. Intell. 2012, 35, 221–231. [Google Scholar] [CrossRef]
- Simonyan, K.; Zisserman, A. Two-stream convolutional networks for action recognition in videos. arXiv 2014, arXiv:1406.2199. [Google Scholar]
- Yan, X.; Chang, H.; Shan, S.; Chen, X. Modeling video dynamics with deep dynencoder. In Proceedings of the European Conference on Computer Vision, Zurich, Switzerland, 6–12 September 2014; Springer: Berlin, Germany, 2014; pp. 215–230. [Google Scholar]
- Girshick, R. Fast R-CNN. In Proceedings of the IEEE International Conference on Computer Vision, Las Condes, Chile, 11–18 December 2015; pp. 1440–1448. [Google Scholar]
- Girshick, R.; Donahue, J.; Darrell, T.; Malik, J. Rich feature hierarchies for accurate object detection and semantic segmentation. In Proceedings of the IEEE Conference on Computer Vision and Pattern Recognition, Columbus, OH, USA, 24–27 June 2014; pp. 580–587. [Google Scholar]
- Liu, Y.; Zhang, Y.M.; Zhang, X.Y.; Liu, C.L. Adaptive spatial pooling for image classification. Pattern Recognit. 2016, 55, 58–67. [Google Scholar] [CrossRef]
- Redmon, J.; Divvala, S.; Girshick, R.; Farhadi, A. You only look once: Unified, real-time object detection. In Proceedings of the IEEE Conference on Computer Vision and Pattern Recognition, Las Vegas, NV, USA, 27–30 June 2016; pp. 779–788. [Google Scholar]
- Ren, S.; He, K.; Girshick, R.; Sun, J. Faster r-cnn: Towards real-time object detection with region proposal networks. arXiv 2015, arXiv:1506.01497. [Google Scholar] [CrossRef] [PubMed]
- Zeng, X.; Ouyang, W.; Yang, B.; Yan, J.; Wang, X. Gated bi-directional cnn for object detection. In Proceedings of the European Conference on Computer Vision, Amsterdam, The Netherlands, 8–16 October 2016; Springer: Berlin, Germany, 2016; pp. 354–369. [Google Scholar]
- He, K.; Zhang, X.; Ren, S.; Sun, J. Deep residual learning for image recognition. In Proceedings of the IEEE Conference on Computer Vision and Pattern Recognition, Las Vegas, NV, USA, 26–30 June 2016; pp. 770–778. [Google Scholar]
- Hu, F.; Xia, G.S.; Hu, J.; Zhang, L. Transferring deep convolutional neural networks for the scene classification of high-resolution remote sensing imagery. Remote Sens. 2015, 7, 14680–14707. [Google Scholar] [CrossRef]
- Nogueira, K.; Penatti, O.A.; dos Santos, J.A. Towards better exploiting convolutional neural networks for remote sensing scene classification. Pattern Recognit. 2017, 61, 539–556. [Google Scholar] [CrossRef]
- Penatti, O.A.; Nogueira, K.; Dos Santos, J.A. Do deep features generalize from everyday objects to remote sensing and aerial scenes domains? In Proceedings of the IEEE Conference on Computer Vision and Pattern Recognition Workshops, Boston, MA, USA, 7–12 June 2015; pp. 44–51. [Google Scholar]
- Salberg, A.B. Detection of seals in remote sensing images using features extracted from deep convolutional neural networks. In Proceedings of the 2015 IEEE International Geoscience and Remote Sensing Symposium (IGARSS), Milan, Italy, 26–31 July 2015; pp. 1893–1896. [Google Scholar]
- Chen, Y.; Lin, Z.; Zhao, X.; Wang, G.; Gu, Y. Deep Learning-Based Classification of Hyperspectral Data. IEEE J. Sel. Top. Appl. Earth Obs. Remote Sens. 2014, 7, 2094–2107. [Google Scholar] [CrossRef]
- Jin, S.; Yang, L.; Danielson, P.; Dewitz, J.; Homer, C.; Xian, G.Z. Overall Method Design for NLCD 2016: 2001–2016 Land Cover and Land Cover Change. In AGU Fall Meeting Abstracts; AGU: Washington, DC, USA, 2018. [Google Scholar]
- Vogelmann, J.E.; Howard, S.M.; Yang, L.; Larson, C.R.; Wylie, B.K.; Van Driel, N. Completion of the 1990s National Land Cover Data Set for the conterminous United States from Landsat Thematic Mapper data and ancillary data sources. Photogramm. Eng. Remote Sens. 2001, 67. [Google Scholar] [CrossRef]
- Homer, C.; Dewitz, J.; Fry, J.; Coan, M.; Hossain, N.; Larson, C.; Herold, N.; McKerrow, A.; VanDriel, J.N.; Wickham, J. Completion of the 2001 national land cover database for the counterminous United States. Photogramm. Eng. Remote Sens. 2007, 73, 337. [Google Scholar]
- Fry, J.A.; Xian, G.; Jin, S.; Dewitz, J.A.; Homer, C.G.; Yang, L.; Barnes, C.A.; Herold, N.D.; Wickham, J.D. Completion of the 2006 national land cover database for the conterminous United States. PE&RS Photogramm. Eng. Remote Sens. 2011, 77, 858–864. [Google Scholar]
- Xian, G.Z.; Homer, C.G.; Dewitz, J.; Fry, J.; Hossain, N.; Wickham, J. Change of impervious surface area between 2001 and 2006 in the conterminous United States. Photogramm. Eng. Remote Sens. 2011, 77, 758–762. [Google Scholar]
- Homer, C.; Dewitz, J.; Yang, L.; Jin, S.; Danielson, P.; Xian, G.; Coulston, J.; Herold, N.; Wickham, J.; Megown, K. Completion of the 2011 National Land Cover Database for the conterminous United States—Representing a decade of land cover change information. Photogramm. Eng. Remote Sens. 2015, 81, 345–354. [Google Scholar]
- Yang, Y.; Newsam, S. Bag-of-visual-words and spatial extensions for land-use classification. In Proceedings of the 18th SIGSPATIAL International Conference on Advances in Geographic Information Systems, San Jose, CA, USA, 2–5 November 2010; ACM: New York, NY, USA, 2010; pp. 270–279. [Google Scholar]
- Cui, S. Comparison of approximation methods to Kullback–Leibler divergence between Gaussian mixture models for satellite image retrieval. Remote Sens. Lett. 2015, 7, 651–660. [Google Scholar] [CrossRef]
- Liu, W.; Anguelov, D.; Erhan, D.; Szegedy, C.; Reed, S.; Fu, C.Y.; Berg, A.C. Ssd: Single shot multibox detector. In Proceedings of the European Conference on Computer Vision, Amsterdam, The Netherlands, 11–14 October 2016; Springer: Berlin, Germany, 2016; pp. 21–37. [Google Scholar]
- Wu, H.; Liu, B.; Su, W.; Zhang, W.; Sun, J. Hierarchical coding vectors for scene level land-use classification. Remote Sens. 2016, 8, 436. [Google Scholar] [CrossRef]
- Zhao, B.; Zhong, Y.; Xia, G.S.; Zhang, L. Dirichlet-derived multiple topic scene classification model for high spatial resolution remote sensing imagery. IEEE Trans. Geosci. Remote Sens. 2015, 54, 2108–2123. [Google Scholar] [CrossRef]
- Zhao, B.; Zhong, Y.; Zhang, L.; Huang, B. The Fisher kernel coding framework for high spatial resolution scene classification. Remote Sens. 2016, 8, 157. [Google Scholar] [CrossRef]
- Zhu, Q.; Zhong, Y.; Zhao, B.; Xia, G.S.; Zhang, L. Bag-of-visual-words scene classifier with local and global features for high spatial resolution remote sensing imagery. IEEE Geosci. Remote Sens. Lett. 2016, 13, 747–751. [Google Scholar] [CrossRef]
- Basu, S.; Ganguly, S.; Mukhopadhyay, S.; DiBiano, R.; Karki, M.; Nemani, R. Deepsat: A learning framework for satellite imagery. In Proceedings of the 23rd SIGSPATIAL International Conference on Advances in Geographic Information Systems, Seattle, WA, USA, 3–6 November 2015; ACM: New York, NY, USA, 2015; p. 37. [Google Scholar]
- Levin, G.; Newbury, D.; McDonald, K.; Alvarado, I.; Tiwari, A.; Zaheer, M. Terrapattern: Open-Ended, Visual Query-by-Example for Satellite Imagery Using Deep Learning. 2016. Available online: http://terrapattern.com (accessed on 10 March 2020).
- Xia, G.S.; Hu, J.; Hu, F.; Shi, B.; Bai, X.; Zhong, Y.; Zhang, L.; Lu, X. AID: A benchmark data set for performance evaluation of aerial scene classification. IEEE Trans. Geosci. Remote Sens. 2017, 55, 3965–3981. [Google Scholar] [CrossRef]
- Heipke, C. Crowdsourcing geospatial data. ISPRS J. Photogramm. Remote Sens. 2010, 65, 550–557. [Google Scholar] [CrossRef]
- Rice, M.T.; Paez, F.I.; Mulhollen, A.P.; Shore, B.M.; Caldwell, D.R. Crowdsourced Geospatial Data: A Report on the Emerging Phenomena of Crowdsourced and User-Generated Geospatial Data; Technical Report; George Mason University: Fairfax VA, USA, 2012. [Google Scholar]
- Haklay, M.; Weber, P. Openstreetmap: User-generated street maps. IEEE Pervasive Comput. 2008, 7, 12–18. [Google Scholar] [CrossRef]
- Chen, B.M.; Zhou, X.P. Explanation of Current Land Use Condition Classification for National Standard of the People’s Republic of China. J. Natural Res. 2007. [Google Scholar] [CrossRef]
- Lowe, D.G. Distinctive image features from scale-invariant keypoints. Int. J. Comput. Vis. 2004, 60, 91–110. [Google Scholar] [CrossRef]
- Swain, M.J.; Ballard, D.H. Color indexing. Int. J. Comput. Vis. 1991, 7, 11–32. [Google Scholar] [CrossRef]
- Ojala, T.; Pietikainen, M.; Maenpaa, T. Multiresolution gray-scale and rotation invariant texture classification with local binary patterns. IEEE Trans. Pattern Anal. Mach. Intell. 2002, 24, 971–987. [Google Scholar] [CrossRef]
- Oliva, A.; Torralba, A. Modeling the shape of the scene: A holistic representation of the spatial envelope. Int. J. Comput. Vis 2001, 42, 145–175. [Google Scholar] [CrossRef]
- Szegedy, C.; Liu, W.; Jia, Y.; Sermanet, P.; Reed, S.; Anguelov, D.; Erhan, D.; Vanhoucke, V.; Rabinovich, A. Going deeper with convolutions. In Proceedings of the IEEE Computer Vision and Pattern Recognition, Boston, MA, USA, 7–12 June 2015; pp. 1–9. [Google Scholar]
- Dorigo, M.; Birattari, M. Ant Colony Optimization; Springer: Berlin, Germany, 2010. [Google Scholar]
- Haklay, M. How good is volunteered geographical information? A comparative study of OpenStreetMap and Ordnance Survey datasets. Environ. Plan. B Plan. Des. 2010, 37, 682–703. [Google Scholar] [CrossRef]
- Melgani, F.; Bruzzone, L. Classification of hyperspectral remote sensing images with support vector machines. IEEE Trans. Geosci. Remote Sens. 2004, 42, 1778–1790. [Google Scholar] [CrossRef]
- Guorong, X.; Peiqi, C.; Minhui, W. Bhattacharyya distance feature selection. In Proceedings of the 13th IEEE International Conference on Pattern Recognition, Vienna, Austria, 25–29 August 1996; Volume 2, pp. 195–199. [Google Scholar]
- Congalton, R.G. A review of assessing the accuracy of classifications of remotely sensed data. Remote Sens. Environ. 1991, 37, 35–46. [Google Scholar] [CrossRef]
- Tao, C.; Qi, J.; Li, Y.; Wang, H.; Li, H. Spatial information inference net: Road extraction using road-specific contextual information. ISPRS J. Photogramm. Remote Sens. 2019, 158, 155–166. [Google Scholar] [CrossRef]
- Zhao, L.; Song, Y.; Zhang, C.; Liu, Y.; Wang, P.; Lin, T.; Deng, M.; Li, H. T-GCN: A Temporal Graph Convolutional Network for Traffic Prediction. IEEE trans. Intell. Transp. Syst. 2019. [Google Scholar] [CrossRef]


| amenity | arts center, atm, bank, bar, bench, bicycle parking, bicycle rental, fountain... |
| barrier | bollard, gate, block... |
| building | apartments, building, hotel, house... |
| emergency | fire hydrant, defibrillator, ambulance_station, eemergency_ward_entrance... |
| highway | bus stop, crossing, motorway junction...... |
| historic | memorial, monument... |
| landuse | commercial, industrial, farmland, forest, meadow... |
| leisure | park, picnic table, playground, swimming pool... |
| man made | antenna, flagpole, monitoring station, tower... |
| natural | peak, tree, grassland, tree... |
| office | accountant, company, government, adoption_agency... |
| public transport | platform, station, stop_area, stop_position... |
| railway | station, subway entrance, ventilation shaft... |
| shop | alcohol, antiques, art, books, clothes, convenience, hairdresser... |
| sport | gym, yoga... |
| tourism | artwork, gallery, hotel, museum... |
| Land Classification | Residential | Commercial | Industrial, Manufacturing | Social, Institution, Infrastructure | Transportation | Leisure | Natural Resources Related | No Human Activity or Unclassifiable | Mass Assembly of People | |
|---|---|---|---|---|---|---|---|---|---|---|
| OSM attributes | ||||||||||
| amenity | √ | √ | ||||||||
| barrier | ||||||||||
| building | √ | √ | ||||||||
| emergency | √ | |||||||||
| highway | √ | |||||||||
| historic | √ | |||||||||
| landuse | √ | √ | ||||||||
| leisure | √ | |||||||||
| man_made | √ | |||||||||
| natural | √ | |||||||||
| office | √ | |||||||||
| public_transport | √ | |||||||||
| railway | √ | |||||||||
| shop | √ | |||||||||
| sport | √ | |||||||||
| tourism | √ | √ | ||||||||
| Large Class | Subclass |
|---|---|
| Agricultural land | green_farmland, dry_farm, bare_land |
| Woodland | artificial_grassland, sparse_forest, forest, mangrove, river_protection_forest, shrubwood, sapling |
| Transportation and facility | airport_runway, avenue, highway, marina, parking lot, crossroads, bridge, airplane |
| Water area and facility | coastline, dam, hirst, lakeshore, river, sea, stream |
| Construction land and facility | city_building, container, residents, storage_room, pipeline, town |
| Other land | desert, snow_mountain, mountain, sandbeach |
| Categories | Number | Categories | Number | Categories | Number |
|---|---|---|---|---|---|
| airplane | 351 | dry_farm | 1309 | river | 539 |
| airport_runway | 678 | forest | 1082 | river_protection_forest | 524 |
| artificial_grassland | 283 | green_farmland | 644 | sandbeach | 536 |
| avenue | 544 | highway | 223 | sapling | 879 |
| bare_land | 864 | hirst | 628 | sea | 1028 |
| bridge | 469 | lakeshore | 438 | shrubwood | 1331 |
| city_building | 1014 | mangrove | 1049 | snow_mountain | 1153 |
| coast_line | 459 | marina | 366 | sparse_forest | 1110 |
| container | 660 | mountain | 812 | storage_room | 1307 |
| crossroads | 553 | parking lot | 467 | stream | 688 |
| dam | 324 | pipeline | 198 | town | 355 |
| desert | 1092 | residents | 810 |
| Database | Images | Categories | Average Per Category | Spatial Resolution (m) | Image Size (Pixels) |
|---|---|---|---|---|---|
| UC Merced | 2100 | 21 | 100 | 0.3 | |
| SAT-4 | 500,000 | 6 | 83333 | – | |
| SAT-6 | 405,000 | 6 | 67500 | – | |
| NLCD | – | 16 | – | 30 | – |
| AID | 10,000 | 30 | 333 | 0.5–8 | |
| NWPU RESISC45 | 31,500 | 45 | 700 | 0.2–30 | |
| RSI-CB | 24,747 | 35 | 690 | 0.22–3 |
| Methods | Our Data Set (50%) | Our Data Set (80%) | UC-Merced (50%) | UC-Merced (80%) |
|---|---|---|---|---|
| SIFT | ||||
| LBP | ||||
| CH | ||||
| Gist |
| Methods | RSI CB | UC-Merced | SAT6 |
|---|---|---|---|
| AlexNet-3ConV | – | 78.69%/70.00% | 98+%/97.53% |
| AlexNet | 96+%/94.78% | 74.82/65.53% | – |
| VGG-16 | 98+%/95.13% | – | – |
| GoogLeNet | 98+%/94.07% | 76.58%/67.62% | – |
| ResNet | 98+%/95.02% | – | – |
| Data Set | Train | Test |
|---|---|---|
| RSI-CB-13 | 90%+ | 86.32% |
| UC-Merced-13 | – | 74.13% |
© 2020 by the authors. Licensee MDPI, Basel, Switzerland. This article is an open access article distributed under the terms and conditions of the Creative Commons Attribution (CC BY) license (http://creativecommons.org/licenses/by/4.0/).
Share and Cite
Li, H.; Dou, X.; Tao, C.; Wu, Z.; Chen, J.; Peng, J.; Deng, M.; Zhao, L. RSI-CB: A Large-Scale Remote Sensing Image Classification Benchmark Using Crowdsourced Data. Sensors 2020, 20, 1594. https://doi.org/10.3390/s20061594
Li H, Dou X, Tao C, Wu Z, Chen J, Peng J, Deng M, Zhao L. RSI-CB: A Large-Scale Remote Sensing Image Classification Benchmark Using Crowdsourced Data. Sensors. 2020; 20(6):1594. https://doi.org/10.3390/s20061594
Chicago/Turabian StyleLi, Haifeng, Xin Dou, Chao Tao, Zhixiang Wu, Jie Chen, Jian Peng, Min Deng, and Ling Zhao. 2020. "RSI-CB: A Large-Scale Remote Sensing Image Classification Benchmark Using Crowdsourced Data" Sensors 20, no. 6: 1594. https://doi.org/10.3390/s20061594
APA StyleLi, H., Dou, X., Tao, C., Wu, Z., Chen, J., Peng, J., Deng, M., & Zhao, L. (2020). RSI-CB: A Large-Scale Remote Sensing Image Classification Benchmark Using Crowdsourced Data. Sensors, 20(6), 1594. https://doi.org/10.3390/s20061594