Visible Light-Driven p-Type Semiconductor Gas Sensors Based on CaFe2O4 Nanoparticles †

 , , , , , and
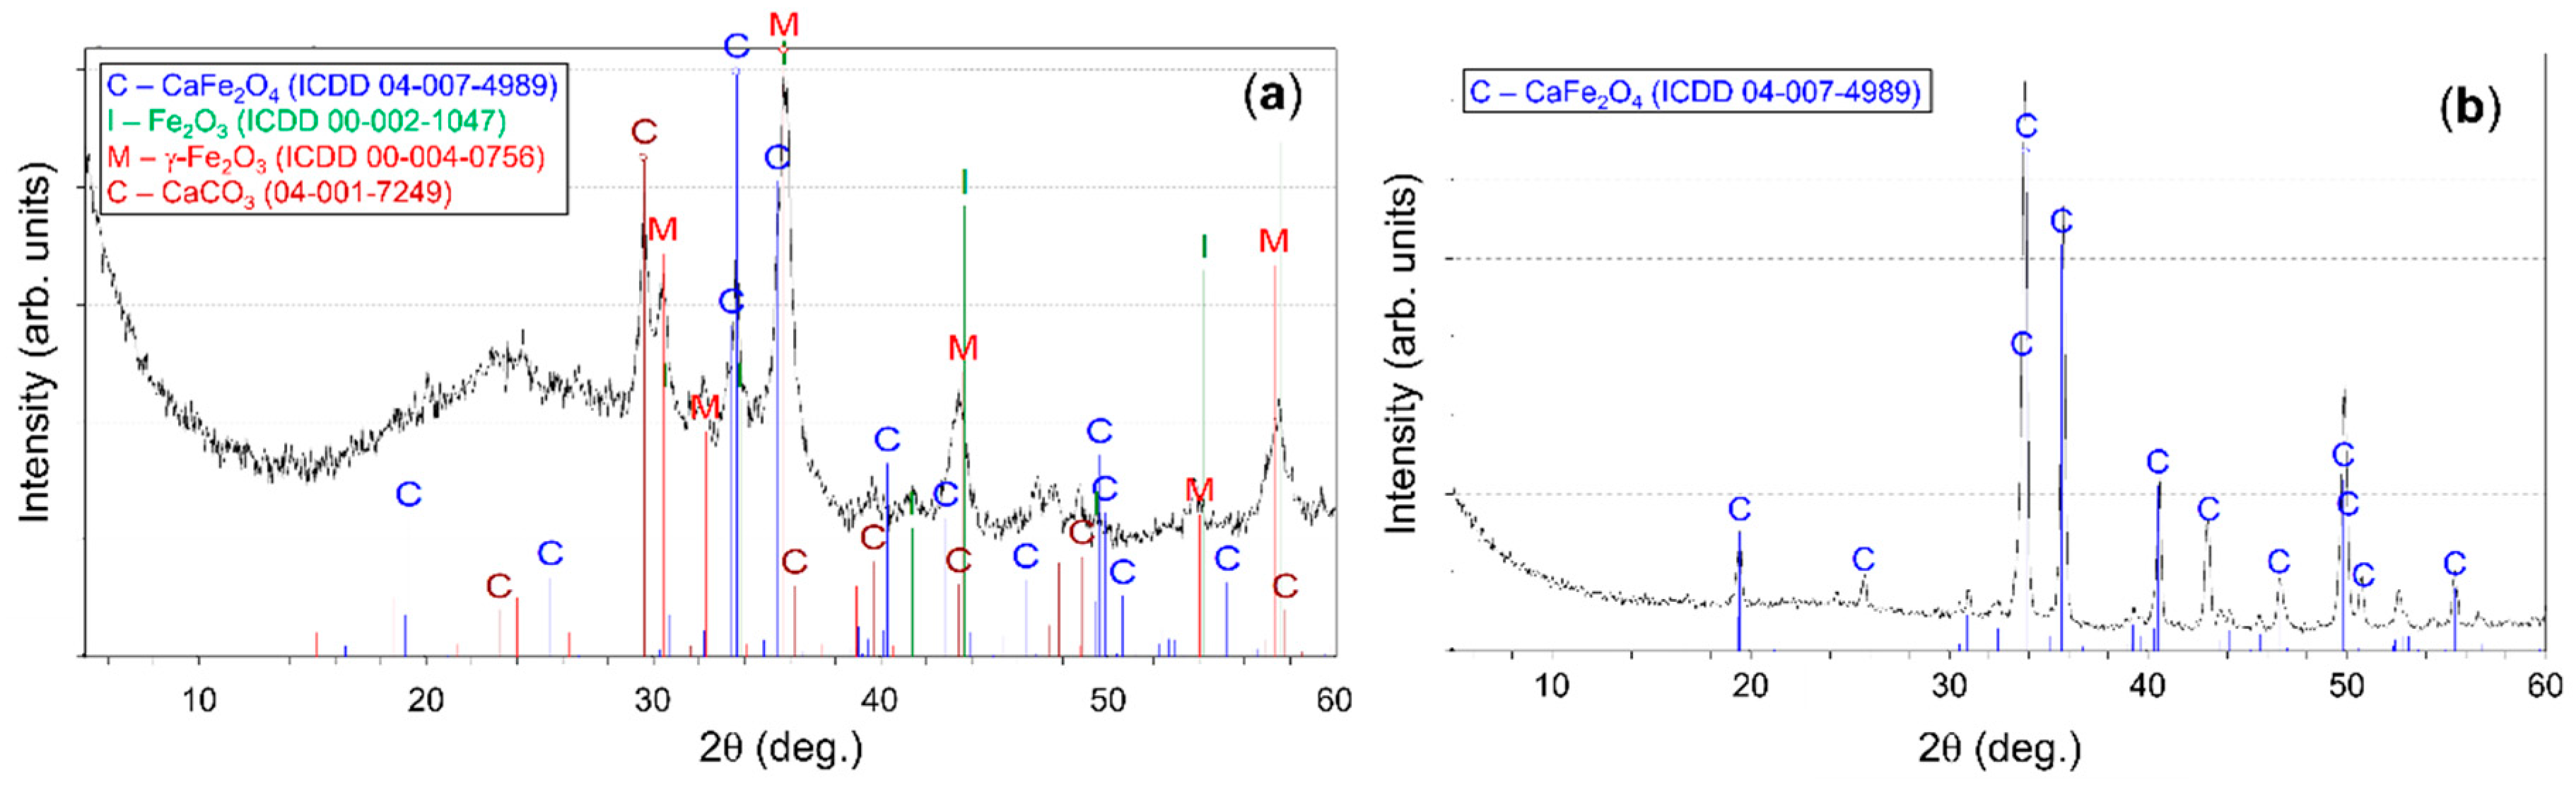
Abstract
1. Introduction
2. Materials and Methods
2.1. Materials
2.2. Material Characterization
2.3. Sensor Preparation
2.4. Sensor Measurement
3. Results and Discussion
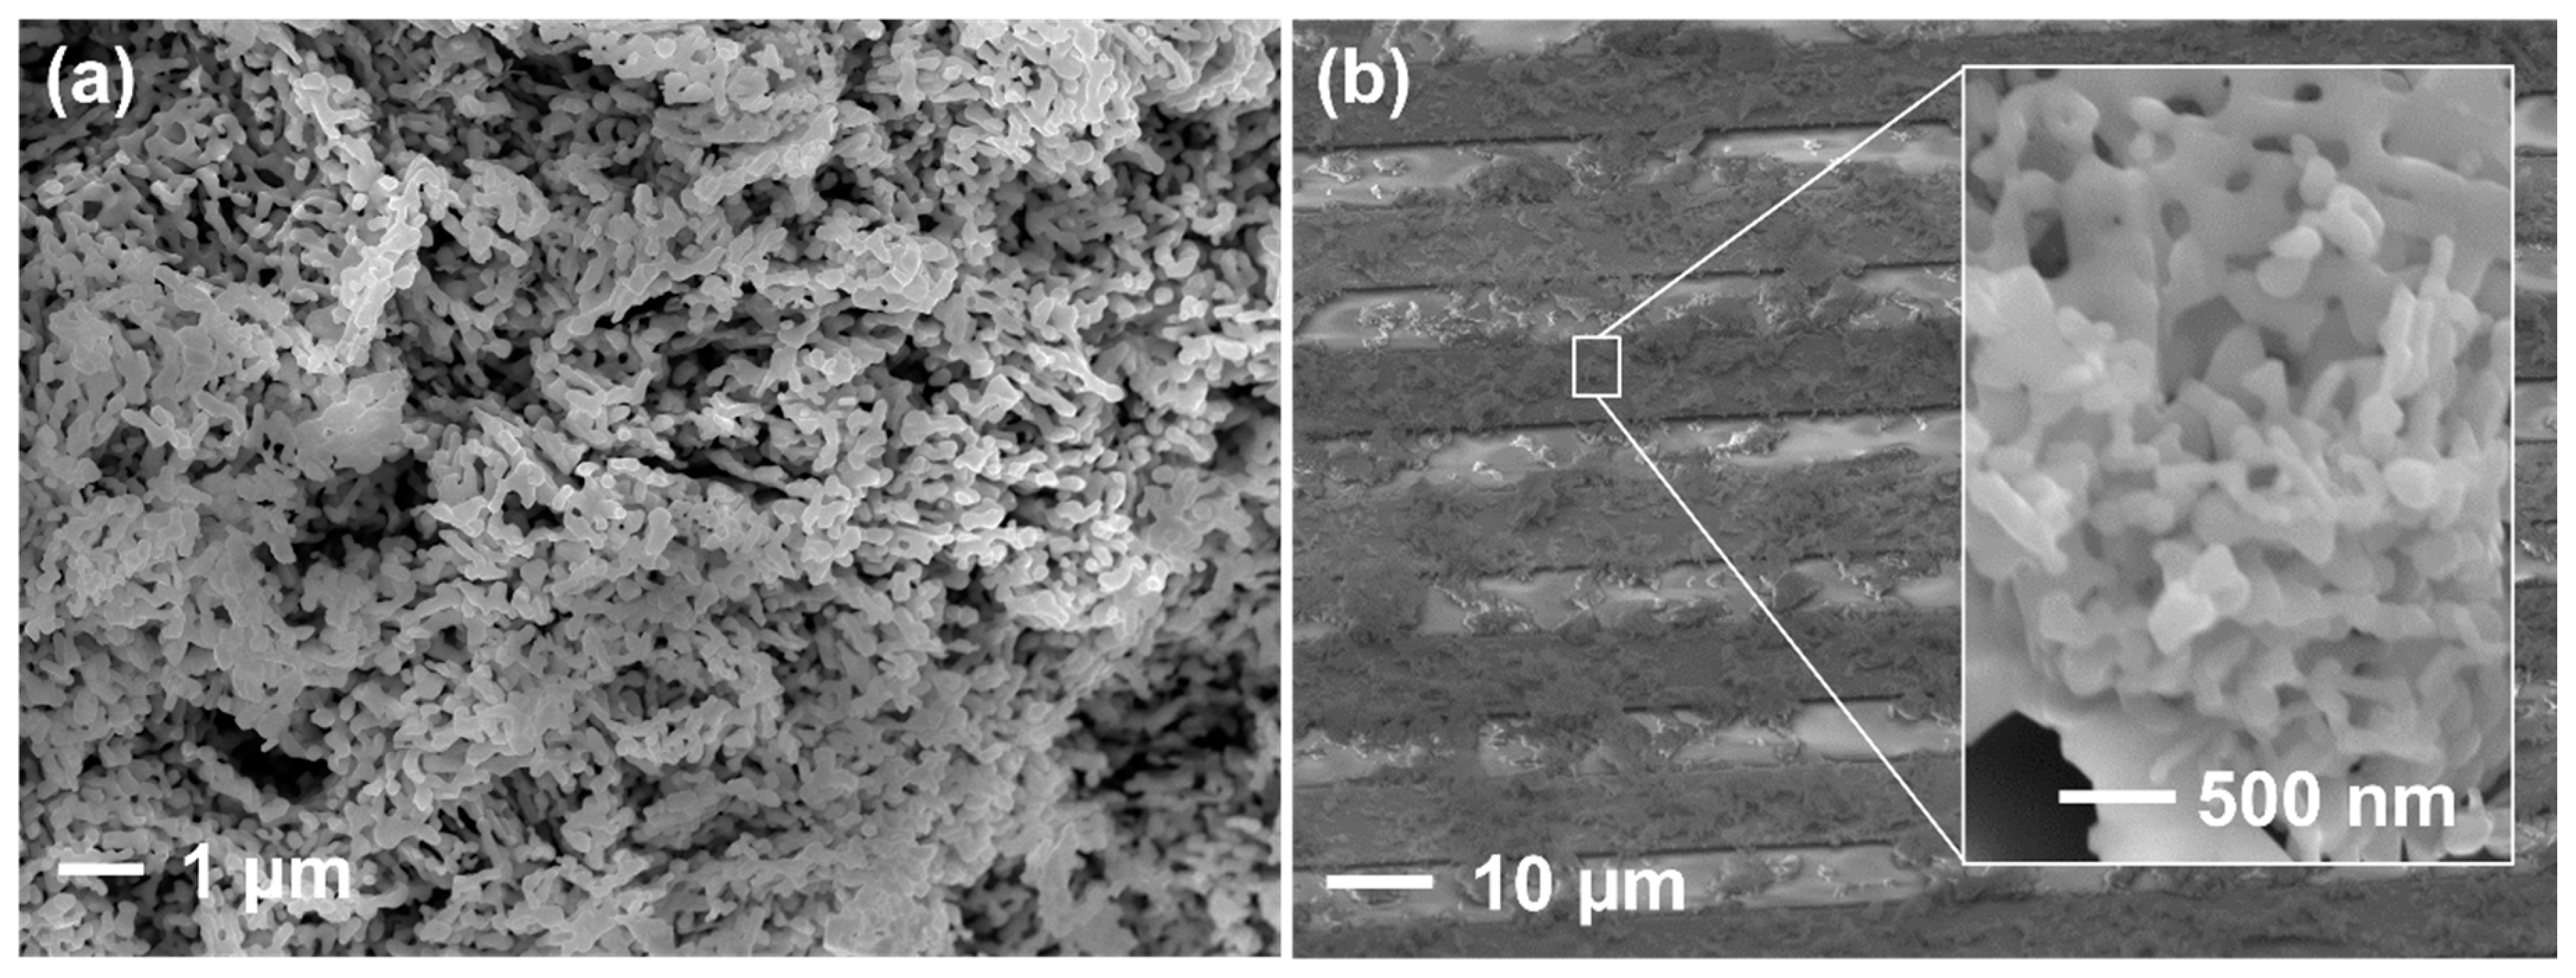
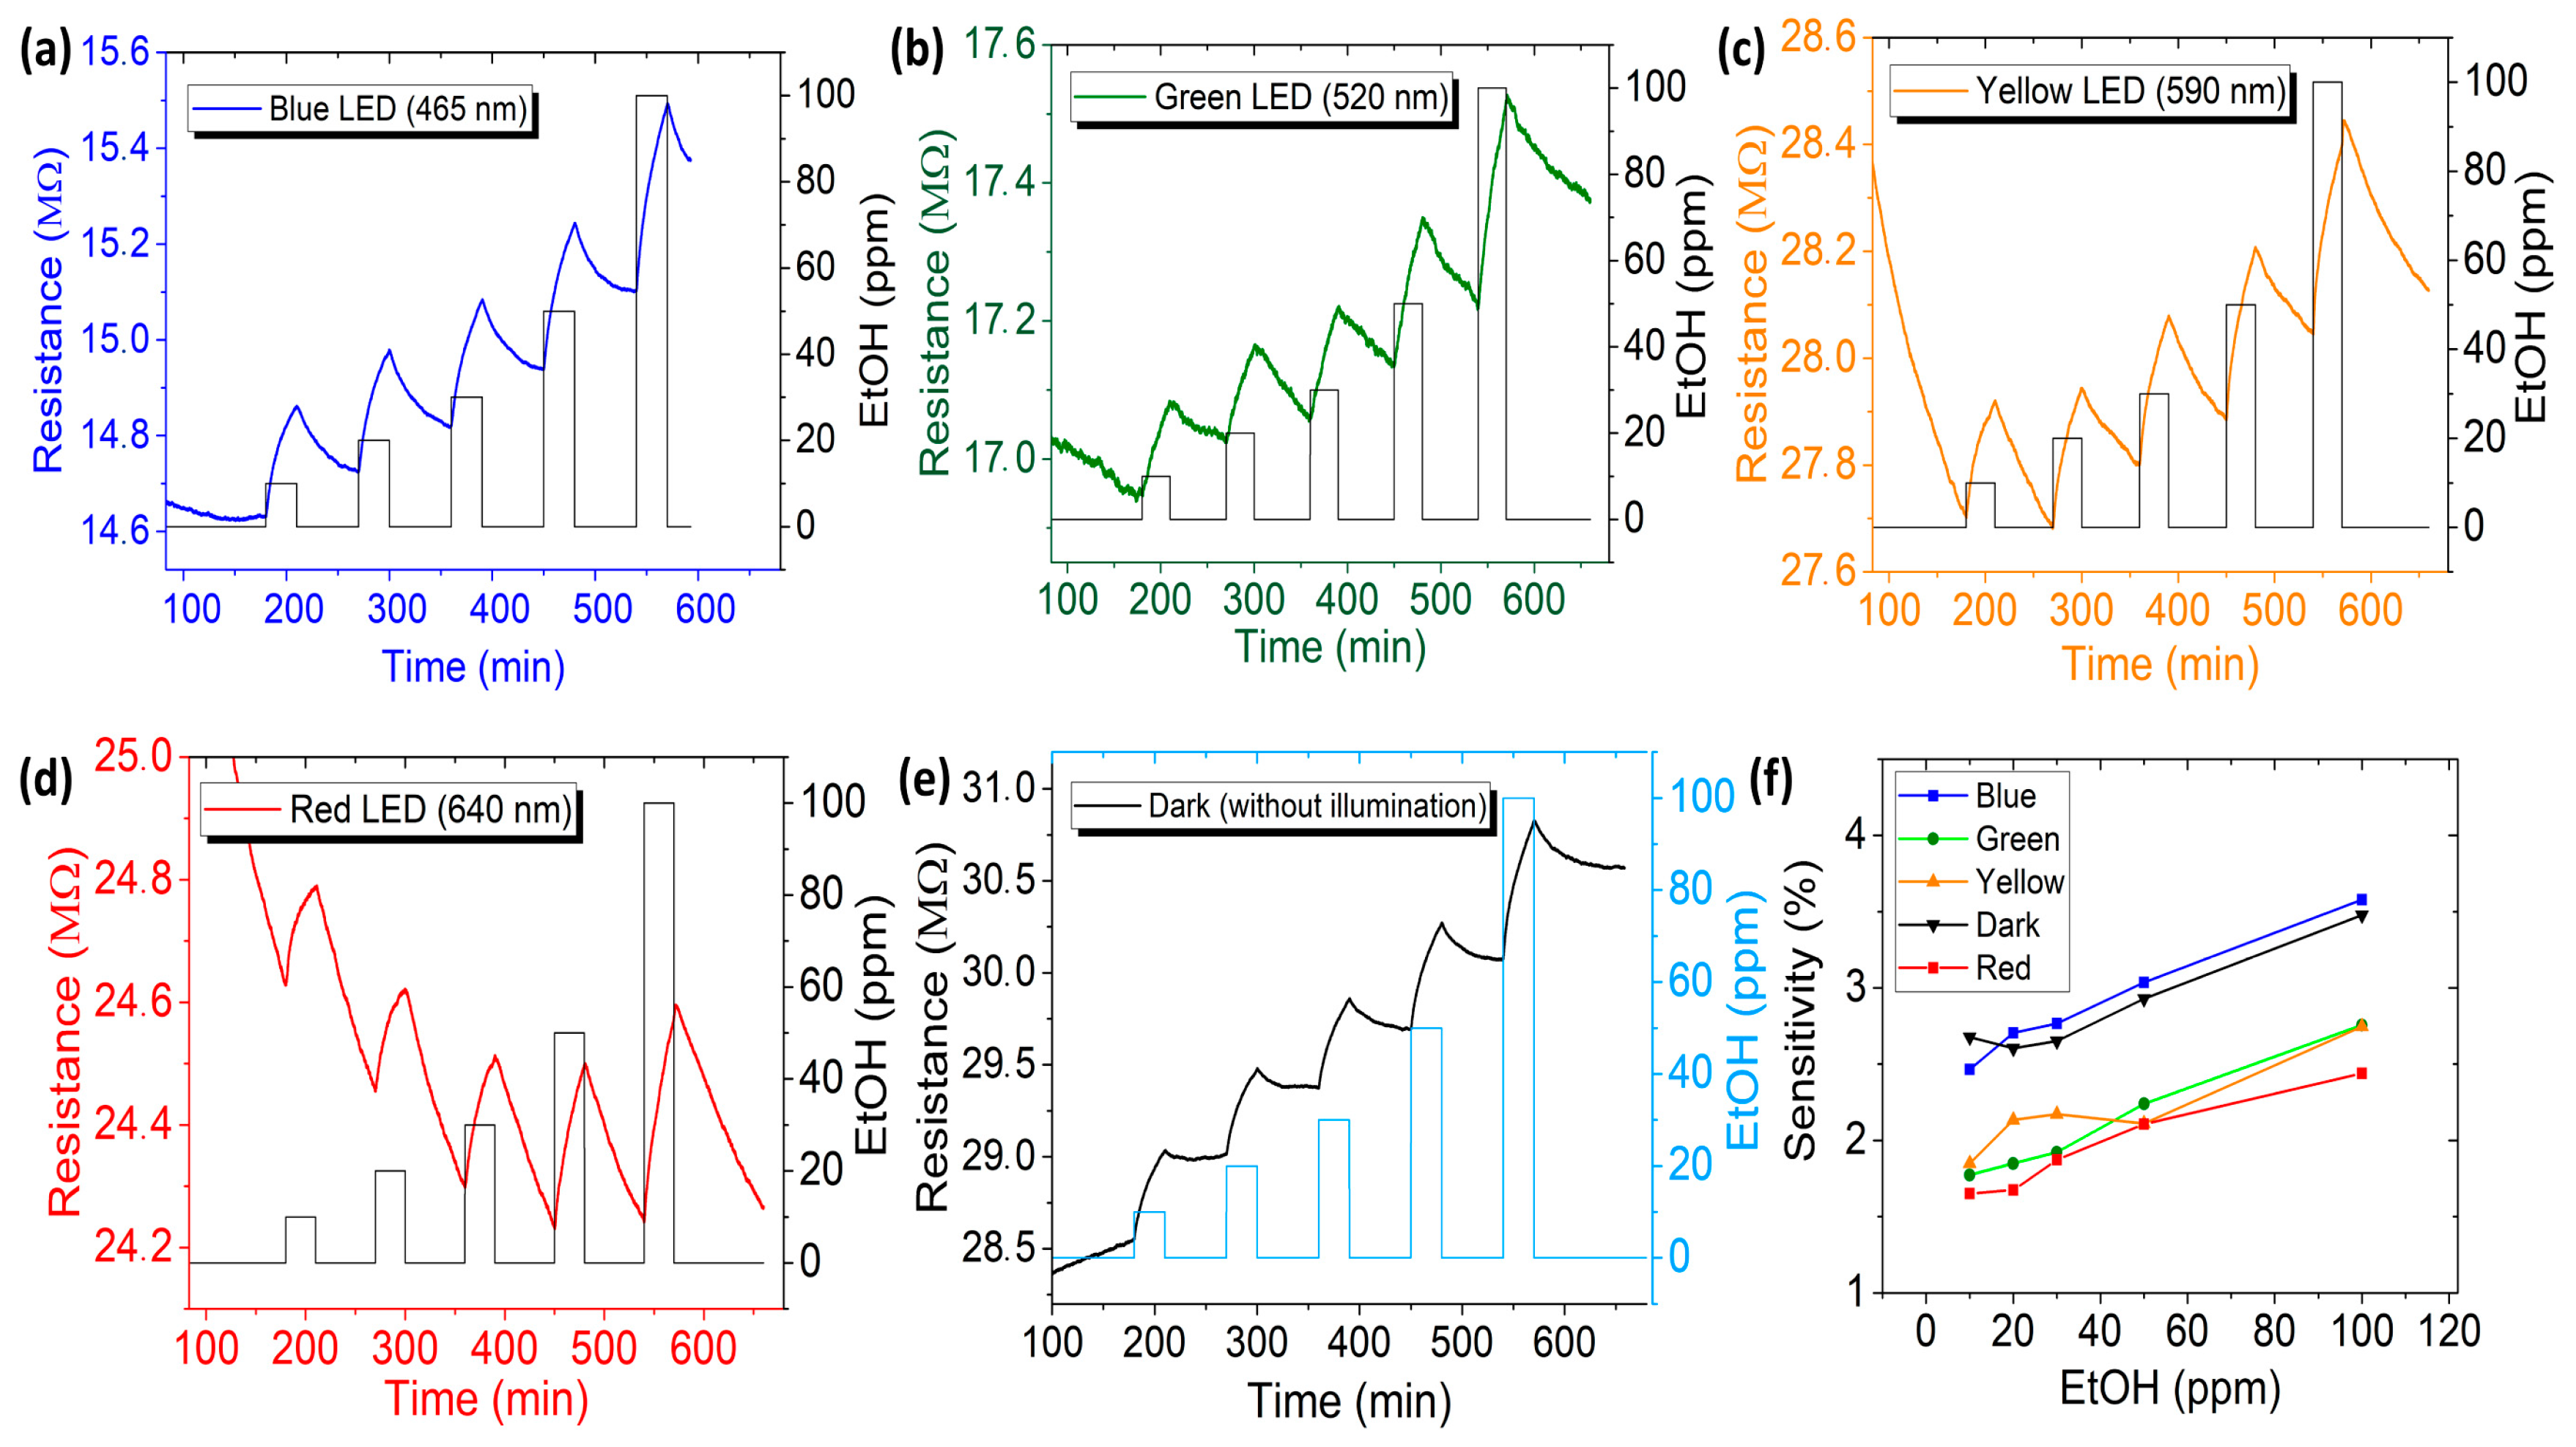
3.1. Sensor Characterization Results
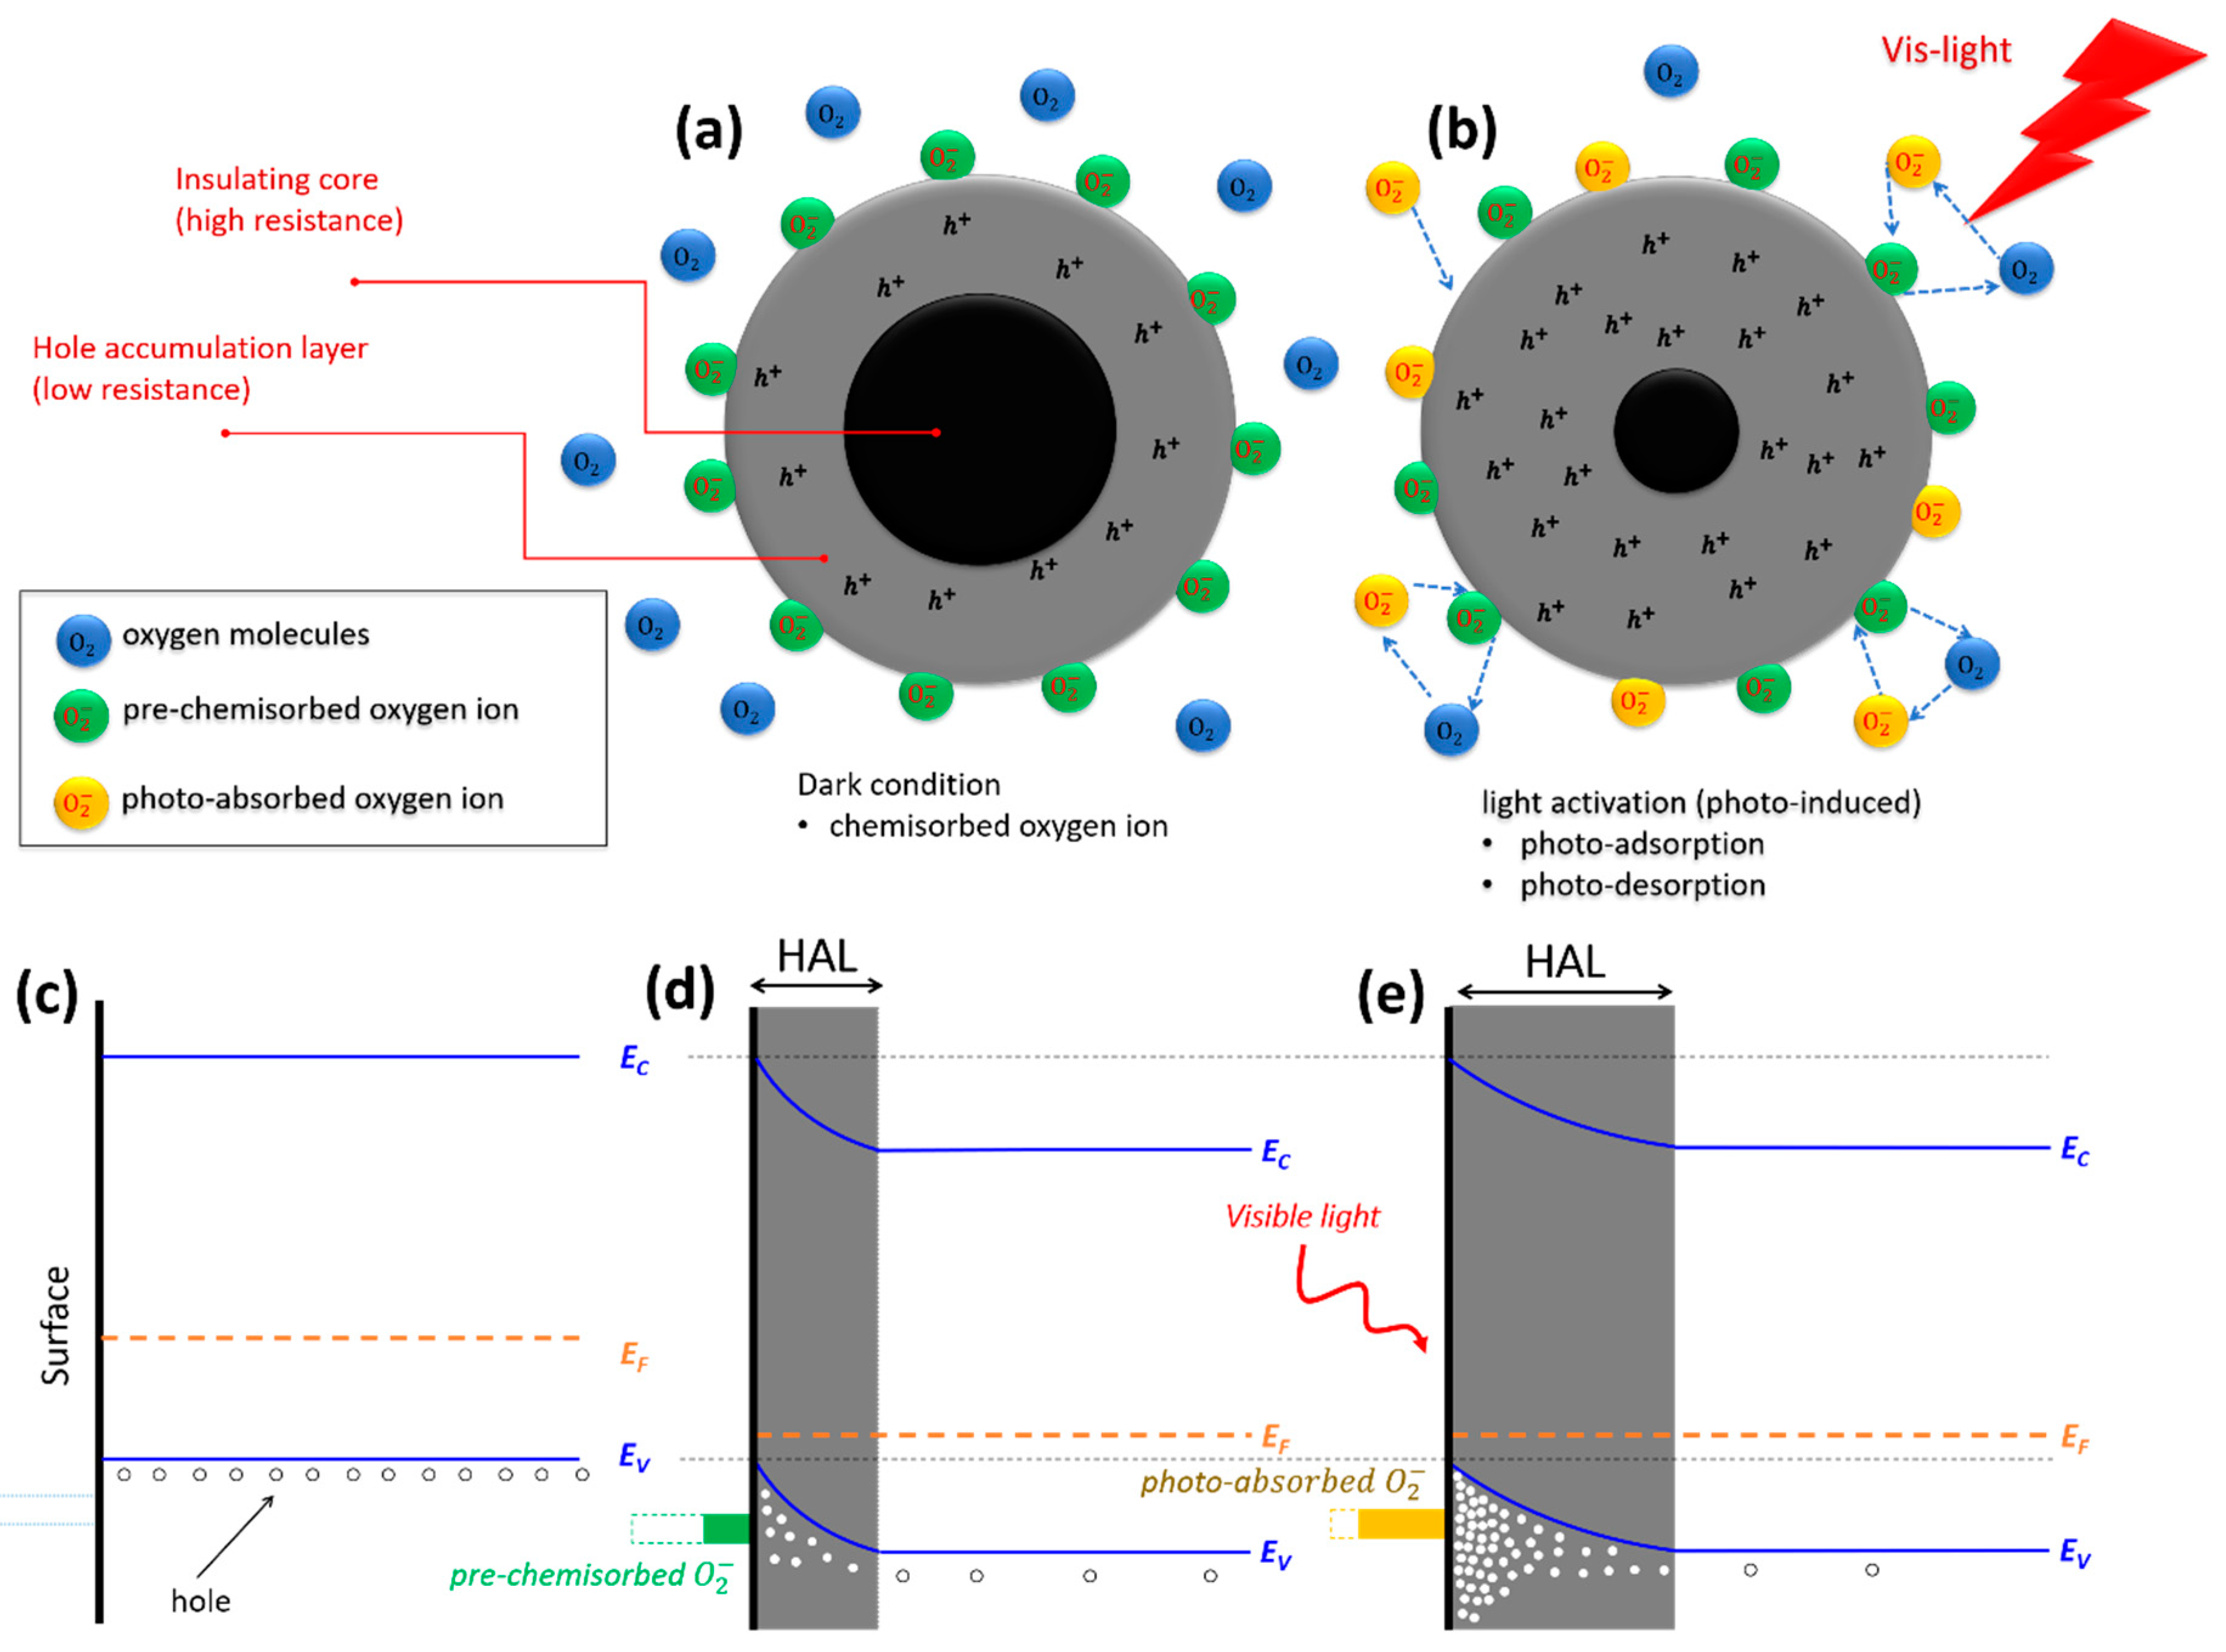
3.2. Sensing Mechanism
4. Conclusions
Supplementary Materials
Author Contributions
Funding
Acknowledgments
Conflicts of Interest
References
- Ivanov, P.; Llobet, E.; Vilanova, X.; Brezmes, J.; Hubalek, J.; Correig, X. Development of high sensitivity ethanol gas sensors based on Pt-doped SnO2 surfaces. Sens. Actuators B Chem. 2004, 99, 201–206. [Google Scholar] [CrossRef]
- Arshak, K.; Gaidan, I. Development of a novel gas sensor based on oxide thick films. Mater. Sci. Eng. B 2005, 118, 44–49. [Google Scholar] [CrossRef]
- Neri, G.; Bonavita, A.; Ipsale, S.; Rizzo, G.; Baratto, C.; Faglia, G.; Sberveglieri, G. Pd- and Ca-doped iron oxide for ethanol vapor sensing. Mater. Sci. Eng. B 2007, 139, 41–47. [Google Scholar] [CrossRef]
- Monereo, O.; Casals, O.; Prades, J.D.; Cirera, A. A low-cost approach to low-power gas sensors based on self-heating effects in large arrays of nanostructures. Procedia Eng. 2015, 120, 787–790. [Google Scholar] [CrossRef][Green Version]
- Zhou, X.; Lee, S.; Xu, Z.; Yoon, J. Recent progress on the development of chemosensors for gases. Chem. Rev. 2015, 115, 7944–8000. [Google Scholar] [CrossRef]
- Mirzaei, A.; Park, S.; Sun, G.-J.; Kheel, H.; Lee, C.; Lee, S. Fe2O3/Co3O4 composite nanoparticle ethanol sensor. J. Korean Phys. Soc. 2016, 69, 373–380. [Google Scholar] [CrossRef]
- Šutka, A.; Kodu, M.; Pärna, R.; Saar, R.; Juhnevica, I.; Jaaniso, R.; Kisand, V. Orthorhombic CaFe2O4: A promising p-type gas sensor. Sens. Actuators B Chem. 2016, 224, 260–265. [Google Scholar] [CrossRef]
- Bhatia, S.; Verma, N.; Bedi, R.K. Ethanol gas sensor based upon ZnO nanoparticles prepared by different techniques. Results. Phys. 2017, 7, 801–806. [Google Scholar] [CrossRef]
- Kim, J.-H.; Mirzaei, A.; Kim, H.W.; Kim, S.S. Low power-consumption CO gas sensors based on Au-functionalized SnO2-ZnO core-shell nanowires. Sens. Actuators B Chem. 2018, 267, 597–607. [Google Scholar] [CrossRef]
- Donarelli, M.; Ottaviano, L. 2D Materials for Gas Sensing Applications: A review on Graphene Oxide, MoS2, WS2 and Phosphorene. Sensors 2018, 18, 3638. [Google Scholar] [CrossRef]
- Prades, J.D.; Jimenez-Diaz, R.; Hernandez-Ramirez, F.; Barth, S.; Cirera, A.; Romano-Rodriguez, A.; Mathur, S.; Morante, J.R. Ultralow power consumption gas sensors based on self-heated individual nanowires. Appl. Phys. Lett. 2008, 93, 123110. [Google Scholar] [CrossRef]
- Prades, J.D.; Jimenez-Diaz, R.; Hernandez-Ramirez, F.; Barth, S.; Cirera, A.; Romano-Rodriguez, A.; Mathur, S.; Morante, J.R. Equivalence between thermal and room temperature UV light-modulated responses of gas sensors based on individual SnO2 nanowires. Sens. Actuators B Chem. 2009, 140, 337–341. [Google Scholar] [CrossRef]
- Prades, J.D.; Jimenez-Diaz, R.; Manzanares, M.; Hernandez-Ramirez, F.; Cirera, A.; Romano-Rodriguez, A.; Mathur, S.; Morante, J.R. A model for the response towards oxidizing gases of photoactivated sensors based on individual SnO2 nanowires. Phys. Chem. Chem. Phys. 2009, 11, 10881–10889. [Google Scholar] [CrossRef] [PubMed]
- Brunelli, D.; Rossi, M. CH4 Monitoring with Ultra-Low Power Wireless Sensor Network. In Applications in Electronics Pervading Industry, Environment and Society; De Gloria, A., Ed.; Springer International Publishing: Cham, Switzerland, 2014; Volume 289, pp. 13–25. ISBN 978-3-319-04369-2. [Google Scholar]
- Hoffmann, M.W.G.; Casals, O.; Gad, A.E.; Mayrhofer, L.; Fàbrega, C.; Caccamo, L.; Hernández-Ramírez, F.; Lilienkamp, G.; Daum, W.; Moseler, M.; et al. Novel approaches towards highly selective self-powered gas sensors. Procedia Eng. 2015, 120, 623–627. [Google Scholar] [CrossRef]
- Gad, A.; Hoffmann, M.W.G.; Casals, O.; Mayrhofer, L.; Fàbrega, C.; Caccamo, L.; Hernández-Ramírez, F.; Mohajerani, M.S.; Moseler, M.; Shen, H.; et al. Integrated strategy toward self-powering and selectivity tuning of semiconductor gas sensors. ACS Sens. 2016, 1, 1256–1264. [Google Scholar] [CrossRef]
- Fàbrega, C.; Casals, O.; Hernández-Ramírez, F.; Prades, J.D. A review on efficient self-heating in nanowire sensors: Prospects for very-low power devices. Sens. Actuators B Chem. 2018, 256, 797–811. [Google Scholar] [CrossRef]
- Fu, Y.; Zang, W.; Wang, P.; Xing, L.; Xue, X.; Zhang, Y. Portable room-temperature self-powered/active H2 sensor driven by human motion through piezoelectric screening effect. Nano Energy 2014, 8, 34–43. [Google Scholar] [CrossRef]
- Uddin, A.S.M.I.; Chung, G.-S. A self-powered active hydrogen gas sensor with fast response at room temperature based on triboelectric effect. Sens. Actuators B Chem. 2016, 231, 601–608. [Google Scholar] [CrossRef]
- Fan, S.-W.; Srivastava, A.K.; Dravid, V.P. UV-activated room-temperature gas sensing mechanism of polycrystalline ZnO. Appl. Phys. Lett. 2009, 95, 142106. [Google Scholar] [CrossRef]
- Lu, G.; Xu, J.; Sun, J.; Yu, Y.; Zhang, Y.; Liu, F. UV-enhanced room temperature NO2 sensor using ZnO nanorods modified with SnO2 nanoparticles. Sens. Actuators B Chem. 2012, 162, 82–88. [Google Scholar] [CrossRef]
- Gui, Y.; Li, S.; Xu, J.; Li, C. Study on TiO2-doped ZnO thick film gas sensors enhanced by UV light at room temperature. Microelectron. J. 2008, 39, 1120–1125. [Google Scholar] [CrossRef]
- Mishra, S.; Ghanshyam, C.; Ram, N.; Bajpai, R.P.; Bedi, R.K. Detection mechanism of metal oxide gas sensor under UV radiation. Sens. Actuators B Chem. 2004, 97, 387–390. [Google Scholar] [CrossRef]
- Gonzalez, O.; Welearegay, T.; Llobet, E.; Vilanova, X. Pulsed UV Light Activated Gas Sensing in Tungsten Oxide Nanowires. Procedia Eng. 2016, 168, 351–354. [Google Scholar] [CrossRef]
- Hsu, C.-L.; Chang, L.-F.; Hsueh, T.-J. Light-activated humidity and gas sensing by ZnO nanowires grown on LED at room temperature. Sens. Actuators B Chem. 2017, 249, 265–277. [Google Scholar] [CrossRef]
- Zheng, Z.Q.; Yao, J.D.; Wang, B.; Yang, G.W. Light-controlling, flexible and transparent ethanol gas sensor based on ZnO nanoparticles for wearable devices. Sci. Rep. 2015, 5, 11070. [Google Scholar] [CrossRef]
- Hien, V.X.; Heo, Y.-W. Effects of violet-, green-, and red-laser illumination on gas-sensing properties of SnO thin film. Sens. Actuators B Chem. 2016, 228, 185–191. [Google Scholar] [CrossRef]
- Qomaruddin; Fàbrega, C.; Waag, A.; Šutka, A.; Casals, O.; Wasisto, H.S.; Prades, J.D. Visible Light Activated Room Temperature Gas Sensors Based on CaFe2O4 Nanopowders. Proceedings 2018, 2, 834. [Google Scholar] [CrossRef]
- Mariana, S.; Gülink, J.; Hamdana, G.; Yu, F.; Strempel, K.; Spende, H.; Yulianto, N.; Granz, T.; Prades, J.D.; Peiner, E.; et al. Vertical GaN nanowires and nanoscale light-emitting-diode arrays for lighting and sensing applications. ACS Appl. Nano Mater. 2019, 2, 4133–4142. [Google Scholar] [CrossRef]
- Bornemann, S.; Yulianto, N.; Spende, H.; Herbani, Y.; Prades, J.D.; Wasisto, H.S.; Waag, A. Femtosecond laser lift-off with sub-band gap excitation for production of free-standing GaN LED chips. Adv. Eng. Mater. 2019, 1901192. [Google Scholar] [CrossRef]
- Casals, O.; Markiewicz, N.; Fabrega, C.; Gràcia, I.; Cané, C.; Wasisto, H.S.; Waag, A.; Prades, J.D. A parts per billion (ppb) sensor for NO2 with microwatt (μW) power requirements based on micro light plates. ACS Sens. 2019, 4, 822–826. [Google Scholar] [CrossRef]
- Markiewicz, N.; Casals, O.; Fabrega, C.; Gràcia, I.; Cané, C.; Wasisto, H.S.; Waag, A.; Prades, J.D. Micro light plates for low-power photoactivated (gas) sensors. Appl. Phys. Lett. 2019, 114, 053508. [Google Scholar] [CrossRef]
- Xu, J.; Bertke, M.; Wasisto, H.S.; Peiner, E. Piezoresistive microcantilevers for humidity sensing. J. Micromech. Microeng. 2019, 29, 053003. [Google Scholar] [CrossRef]
- Setiono, A.; Xu, J.; Fahrbach, M.; Bertke, M.; Nyang’au, W.O.; Wasisto, H.S.; Peiner, E. Real-time frequency tracking of an electro-thermal piezoresistive cantilever resonator with ZnO nanorods for chemical sensing. Chemosensors 2019, 7, 2. [Google Scholar] [CrossRef]
- Setiono, A.; Fahrbach, M.; Xu, J.; Bertke, M.; Nyang’au, W.O.; Hamdana, G.; Wasisto, H.S.; Peiner, E. Phase optimization of thermally actuated piezoresistive resonant MEMS cantilever sensors. J. Sens. Sens. Syst. 2019, 8, 37–48. [Google Scholar] [CrossRef]
- Bertke, M.; Hamdana, G.; Wu, W.; Wasisto, H.S.; Uhde, E.; Peiner, E. Analysis of asymmetric resonance response of thermally excited silicon micro-cantilevers for mass-sensitive nanoparticle detection. J. Micromech. Microeng. 2017, 27, 064001. [Google Scholar] [CrossRef]
- Wasisto, H.S.; Uhde, E.; Peiner, E. Enhanced performance of pocket-sized nanoparticle exposure monitor for healthy indoor environment. Build. Environ. 2016, 95, 13–20. [Google Scholar] [CrossRef]
- Wasisto, H.S.; Merzsch, S.; Uhde, E.; Waag, A.; Peiner, E. Handheld personal airborne nanoparticle detector based on microelectromechanical silicon resonant cantilever. Microelectron. Eng. 2015, 145, 96–103. [Google Scholar] [CrossRef]
- Wasisto, H.S.; Merzsch, S.; Uhde, E.; Waag, A.; Peiner, E. Partially integrated cantilever-based airborne nanoparticle detector for continuous carbon aerosol mass concentration monitoring. J.Sens. Sens. Syst. 2015, 4, 111–123. [Google Scholar] [CrossRef]
- Wasisto, H.S.; Merzsch, S.; Stranz, A.; Waag, A.; Uhde, E.; Salthammer, T.; Peiner, E. Silicon resonant nanopillar sensors for airborne titanium dioxide engineered nanoparticle mass detection. Sens. Actuators B Chem. 2013, 189, 146–156. [Google Scholar] [CrossRef]
- Wasisto, H.S.; Merzsch, S.; Stranz, A.; Waag, A.; Uhde, E.; Salthammer, T.; Peiner, E. Silicon Nanowire Resonators: Aerosol Nanoparticle Mass Sensing in the Workplace. IEEE Nanatechnol. Mag. 2013, 7, 18–23. [Google Scholar] [CrossRef]
- Stranz, A.; Peiner, E.; Wasisto, H.S.; Waag, A.; Uhde, E.; Merzsch, S.; Salthammer, T. Femtogram aerosol nanoparticle mass sensing utilising vertical silicon nanowire resonators. Micro Nano Lett. 2013, 8, 554–558. [Google Scholar]
- Wang, C.; Yin, L.; Zhang, L.; Xiang, D.; Gao, R. Metal oxide gas sensors: Sensitivity and influencing factors. Sensors 2010, 10, 2088–2106. [Google Scholar] [CrossRef] [PubMed]
- Chinh, N.D.; Quang, N.D.; Lee, H.; Thi Hien, T.; Hieu, N.M.; Kim, D.; Kim, C.; Kim, D. NO gas sensing kinetics at room temperature under UV light irradiation of In2O3 nanostructures. Sci. Rep. 2016, 6, 35066. [Google Scholar] [CrossRef] [PubMed]
- Wongrat, E.; Chanlek, N.; Chueaiarrom, C.; Samransuksamer, B.; Hongsith, N.; Choopun, S. Low temperature ethanol response enhancement of ZnO nanostructures sensor decorated with gold nanoparticles exposed to UV illumination. Sens. Actuators A Phys. 2016, 251, 188–197. [Google Scholar] [CrossRef]
- Wang, Z.; Peng, X.; Huang, C.; Chen, X.; Dai, W.; Fu, X. CO gas sensitivity and its oxidation over TiO2 modified by PANI under UV irradiation at room temperature. Appl. Catal. B Environ. 2017, 219, 379–390. [Google Scholar] [CrossRef]
- Espid, E.; Taghipour, F. UV-LED Photo-activated Chemical Gas Sensors: A Review. Crit. Rev. Solid State Mater. Sci. 2017, 42, 416–432. [Google Scholar] [CrossRef]
- Wu, T.; Wang, Z.; Tian, M.; Miao, J.; Zhang, H.; Sun, J. UV excitation NO2 gas sensor sensitized by ZnO quantum dots at room temperature. Sens. Actuators B Chem. 2018, 259, 526–531. [Google Scholar] [CrossRef]
- Kim, H.-J.; Lee, J.-H. Highly sensitive and selective gas sensors using p-type oxide semiconductors: Overview. Sens. Actuators B Chem. 2014, 192, 607–627. [Google Scholar] [CrossRef]
- Choi, S.-W.; Katoch, A.; Kim, J.-H.; Kim, S.S. Remarkable Improvement of Gas-Sensing Abilities in p-type Oxide Nanowires by Local Modification of the Hole-Accumulation Layer. ACS Appl. Mater. Interfaces 2015, 7, 647–652. [Google Scholar] [CrossRef]
- Cho, N.G.; Woo, H.-S.; Lee, J.-H.; Kim, I.-D. Thin-walled NiO tubes functionalized with catalytic Pt for highly selective C252OH sensors using electrospun fibers as a sacrificial template. Chem. Commun. 2011, 47, 11300. [Google Scholar] [CrossRef]
- Yoon, J.-W.; Choi, J.-K.; Lee, J.-H. Design of a highly sensitive and selective C2H5OH sensor using p-type Co3O4 nanofibers. Sens. Actuators B Chem. 2012, 161, 570–577. [Google Scholar] [CrossRef]
- Wang, J.; Yang, P.; Wei, X. High-Performance, Room-Temperature, and No-Humidity-Impact Ammonia Sensor Based on Heterogeneous Nickel Oxide and Zinc Oxide Nanocrystals. ACS Appl. Mater. Interfaces 2015, 7, 3816–3824. [Google Scholar] [CrossRef] [PubMed]
- Liu, X.; Jiang, J.; Jia, Y.; Jin, A.; Chen, X.; Zhang, F.; Han, H. p-Type CaFe2O4 semiconductor nanorods controllably synthesized by molten salt method. J. Energy Chem. 2016, 25, 381–386. [Google Scholar] [CrossRef]
- Manohar, A.; Krishnamoorthi, C. Structural, optical, dielectric and magnetic properties of CaFe2O4 nanocrystals prepared by solvothermal reflux method. J. Alloys Compd. 2017, 722, 818–827. [Google Scholar] [CrossRef]
- Zhang, Z.; Wang, W. Solution combustion synthesis of CaFe2O4 nanocrystal as a magnetically separable photocatalyst. Mater. Lett. 2014, 133, 212–215. [Google Scholar] [CrossRef]
- Barsan, N.; Weimar, U. Conduction Model of Metal Oxide Gas Sensors. J. Electroceram. 2001, 7, 143–167. [Google Scholar] [CrossRef]
- Xu, F.; Lv, H.-F.; Wu, S.-Y.; Ho, H.-P. Light-activated gas sensing activity of ZnO nanotetrapods enhanced by plasmonic resonant energy from Au nanoparticles. Sens. Actuators B Chem. 2018, 259, 709–716. [Google Scholar] [CrossRef]
- Barsan, N.; Simion, C.; Heine, T.; Pokhrel, S.; Weimar, U. Modeling of sensing and transduction for p-type semiconducting metal oxide-based gas sensors. J. Electroceram. 2010, 25, 11–19. [Google Scholar] [CrossRef]
- Geng, Q.; He, Z.; Chen, X.; Dai, W.; Wang, X. Gas sensing property of ZnO under visible light irradiation at room temperature. Sens. Actuators B Chem. 2013, 188, 293–297. [Google Scholar] [CrossRef]


© 2020 by the authors. Licensee MDPI, Basel, Switzerland. This article is an open access article distributed under the terms and conditions of the Creative Commons Attribution (CC BY) license (http://creativecommons.org/licenses/by/4.0/).
Share and Cite
Qomaruddin; Casals, O.; Šutka, A.; Granz, T.; Waag, A.; Wasisto, H.S.; Daniel Prades, J.; Fàbrega, C. Visible Light-Driven p-Type Semiconductor Gas Sensors Based on CaFe2O4 Nanoparticles. Sensors 2020, 20, 850. https://doi.org/10.3390/s20030850
Qomaruddin, Casals O, Šutka A, Granz T, Waag A, Wasisto HS, Daniel Prades J, Fàbrega C. Visible Light-Driven p-Type Semiconductor Gas Sensors Based on CaFe2O4 Nanoparticles. Sensors. 2020; 20(3):850. https://doi.org/10.3390/s20030850
Chicago/Turabian StyleQomaruddin, Olga Casals, Andris Šutka, Tony Granz, Andreas Waag, Hutomo Suryo Wasisto, Joan Daniel Prades, and Cristian Fàbrega. 2020. "Visible Light-Driven p-Type Semiconductor Gas Sensors Based on CaFe2O4 Nanoparticles" Sensors 20, no. 3: 850. https://doi.org/10.3390/s20030850
APA StyleQomaruddin, Casals, O., Šutka, A., Granz, T., Waag, A., Wasisto, H. S., Daniel Prades, J., & Fàbrega, C. (2020). Visible Light-Driven p-Type Semiconductor Gas Sensors Based on CaFe2O4 Nanoparticles. Sensors, 20(3), 850. https://doi.org/10.3390/s20030850