Concurrent Validity and Reliability of Three Ultra-Portable Vertical Jump Assessment Technologies


Abstract
1. Introduction
2. Materials and Methods
2.1. Experimental Design
2.2. Subjects
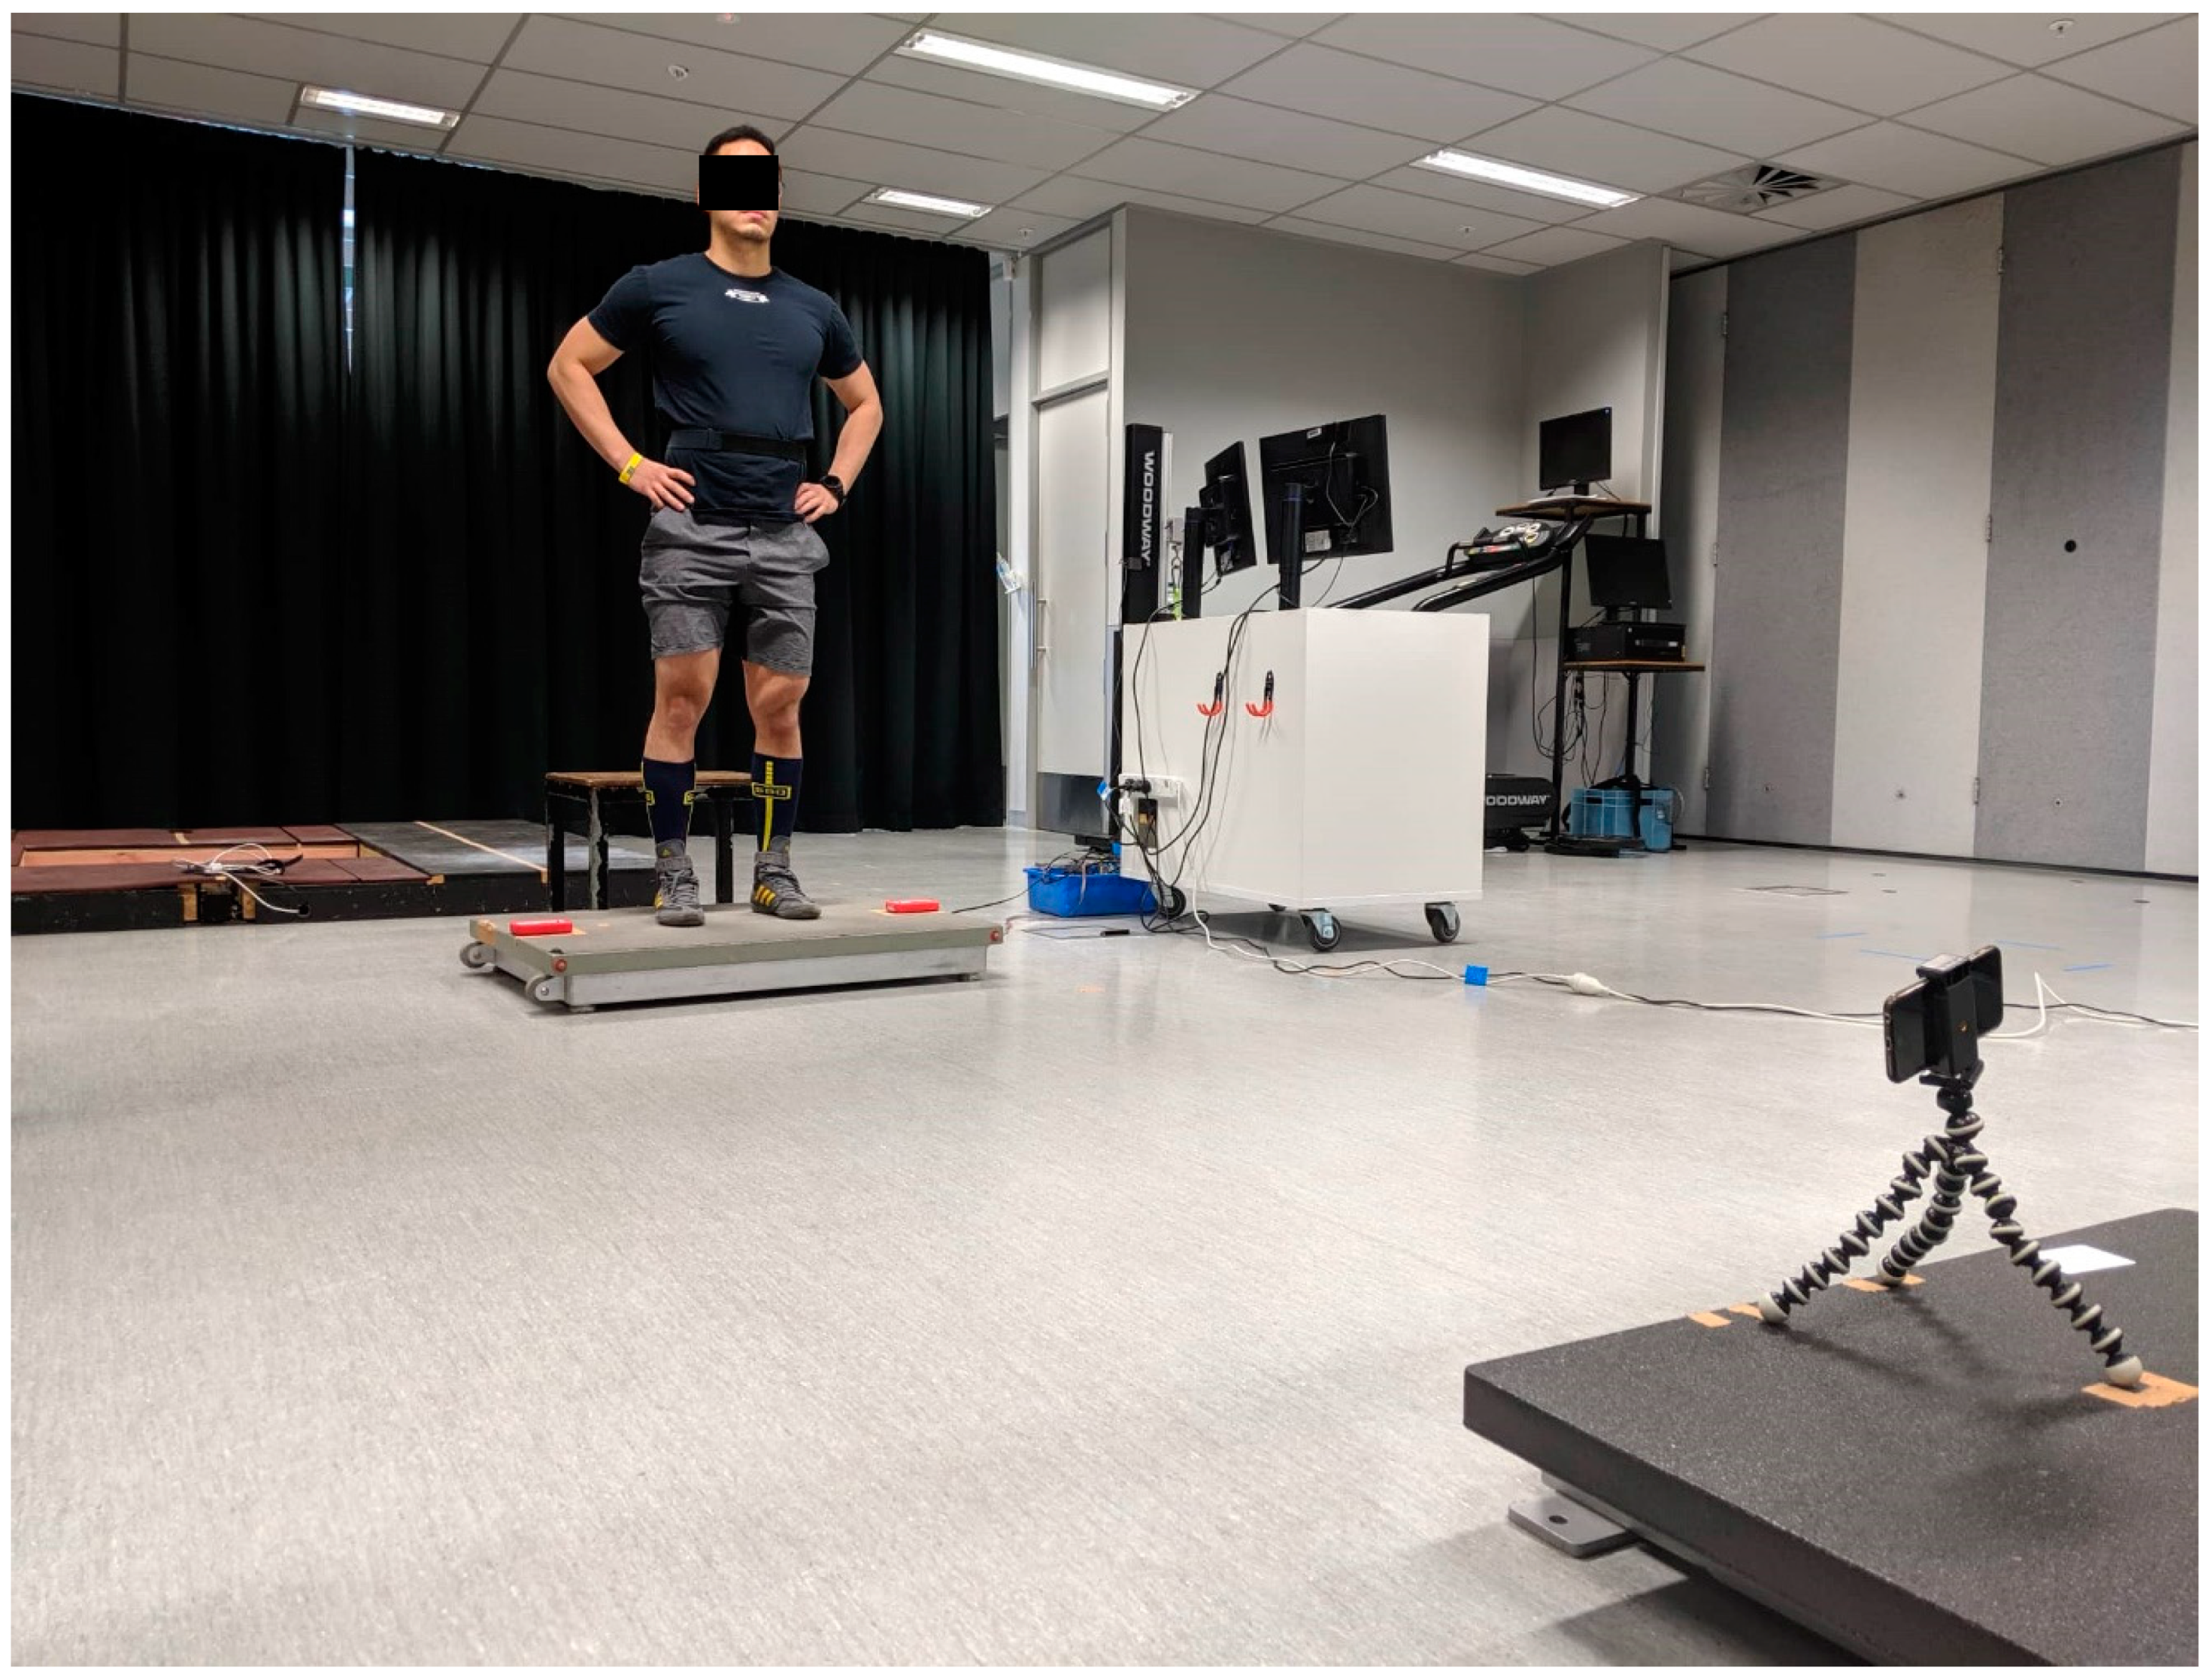
2.3. Testing Procedures
2.4. Data Processing and Analysis
2.5. Statistical Analysis
3. Results
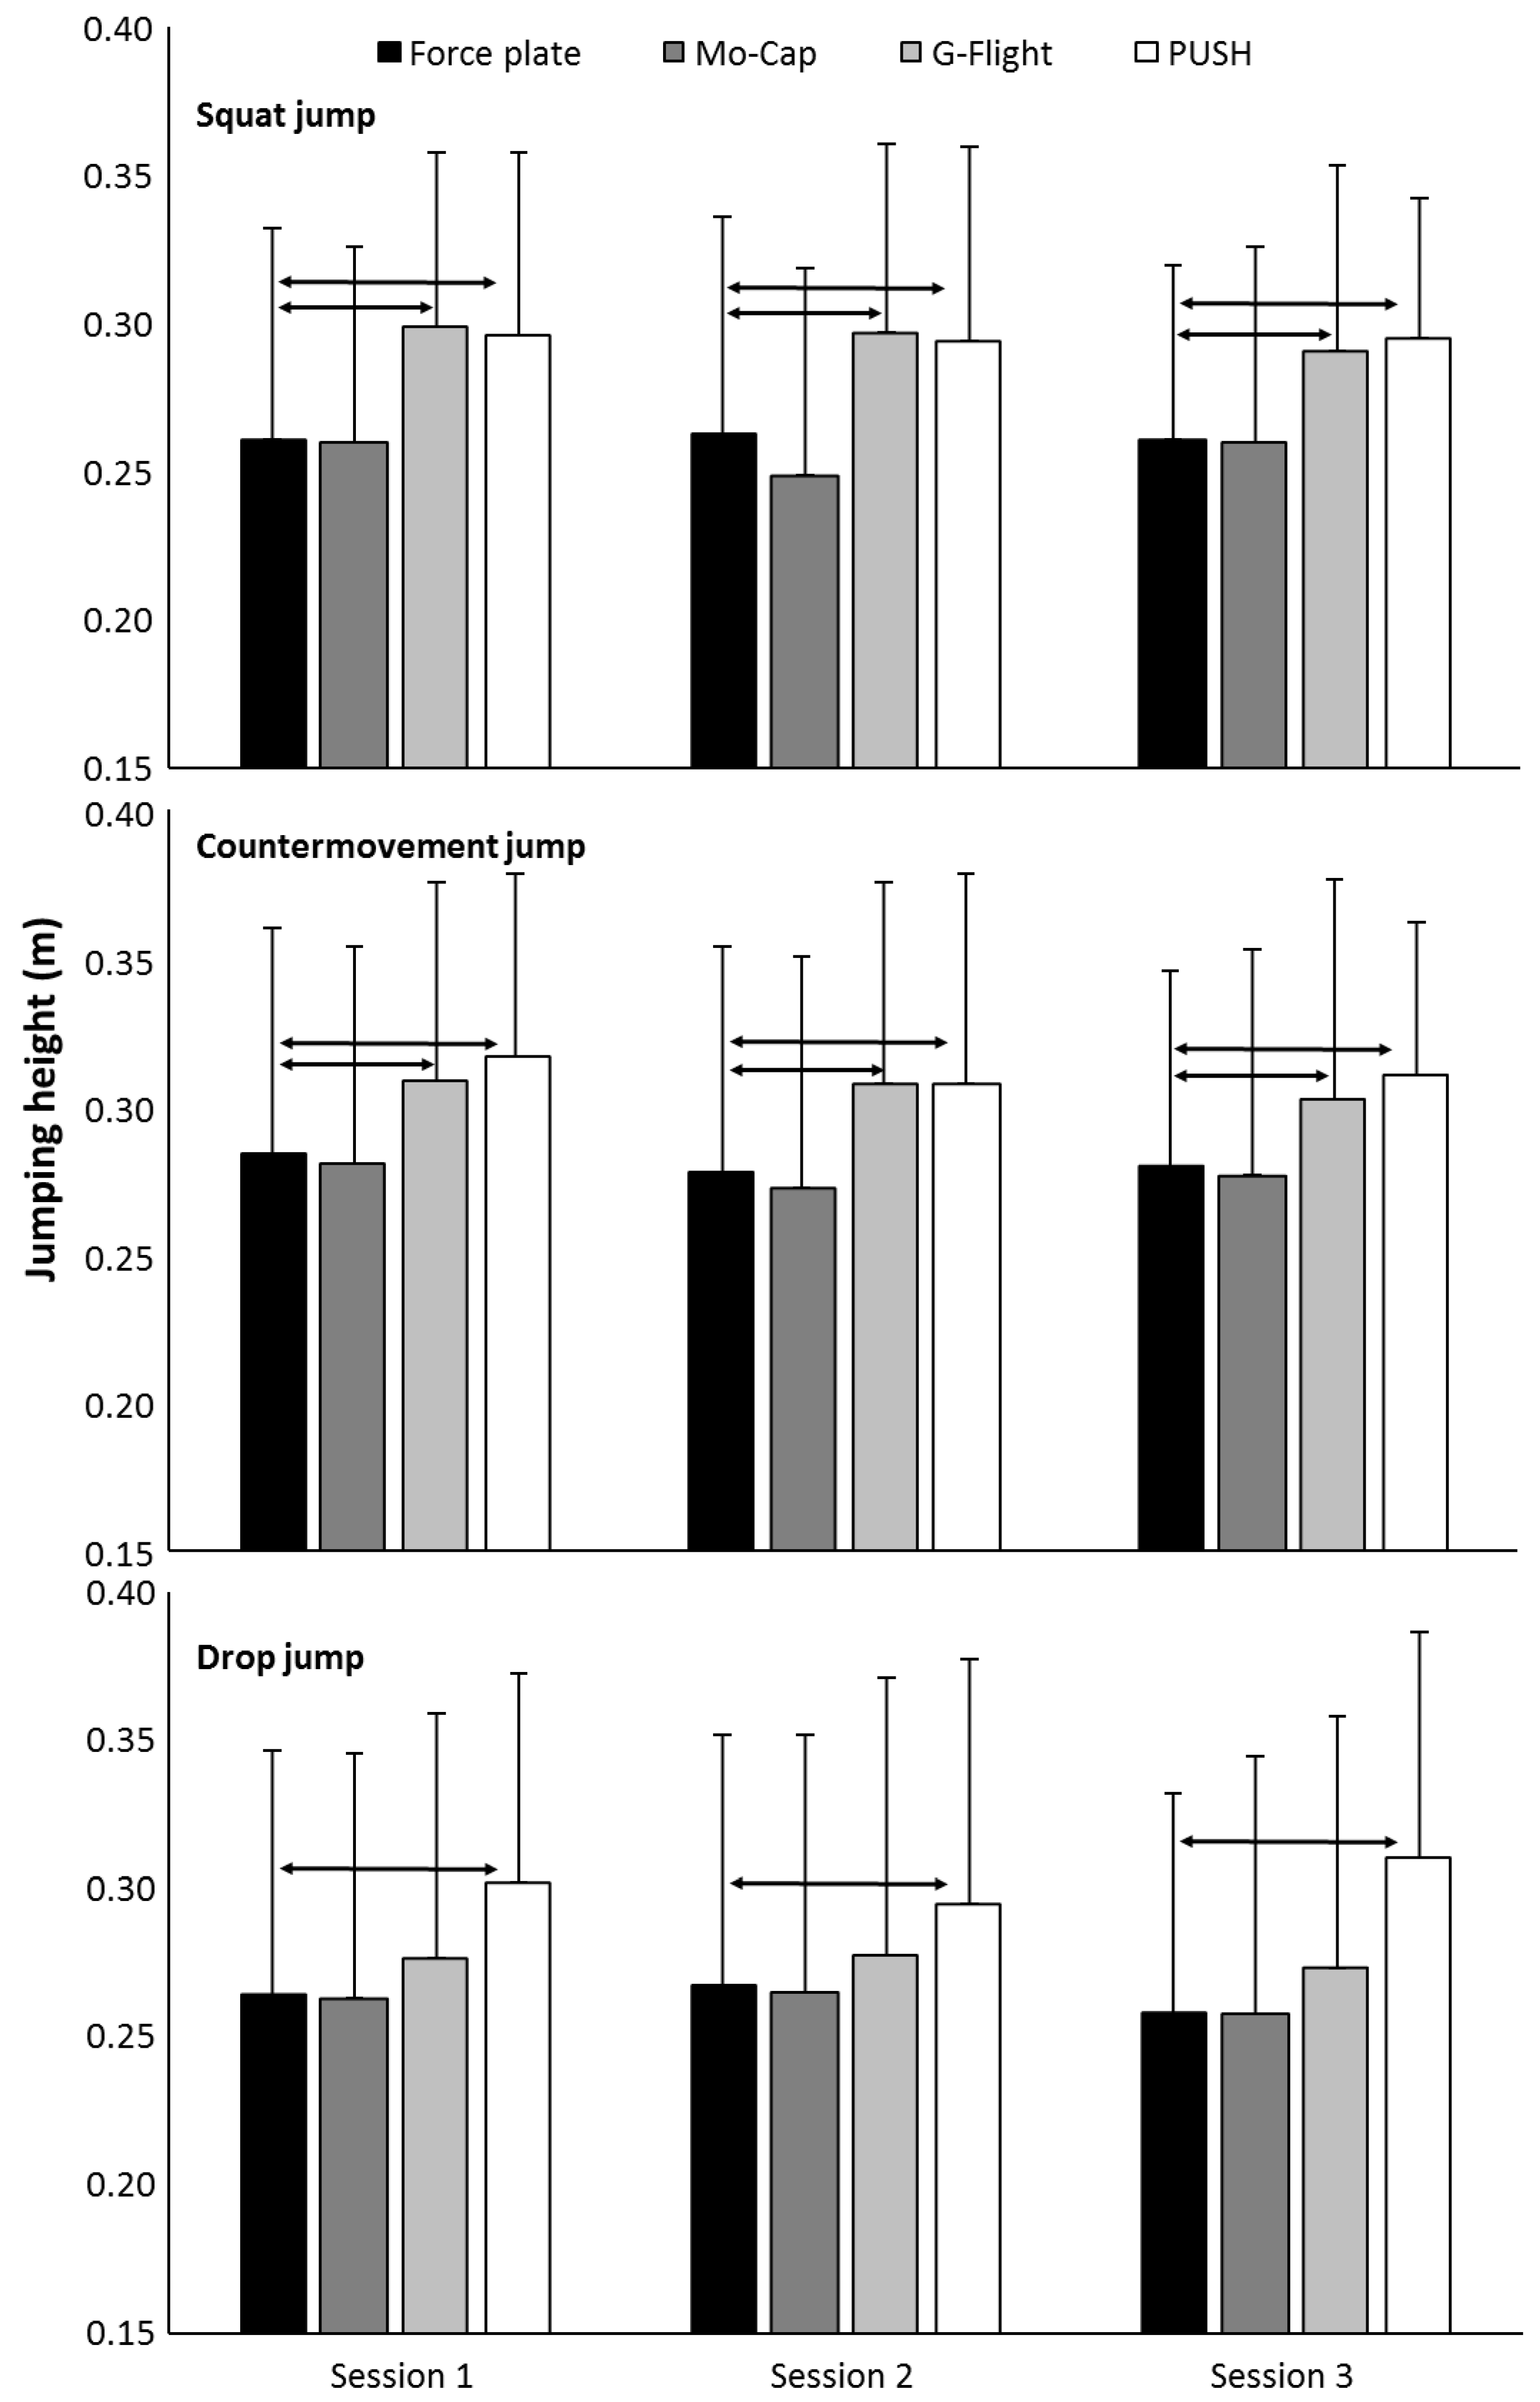
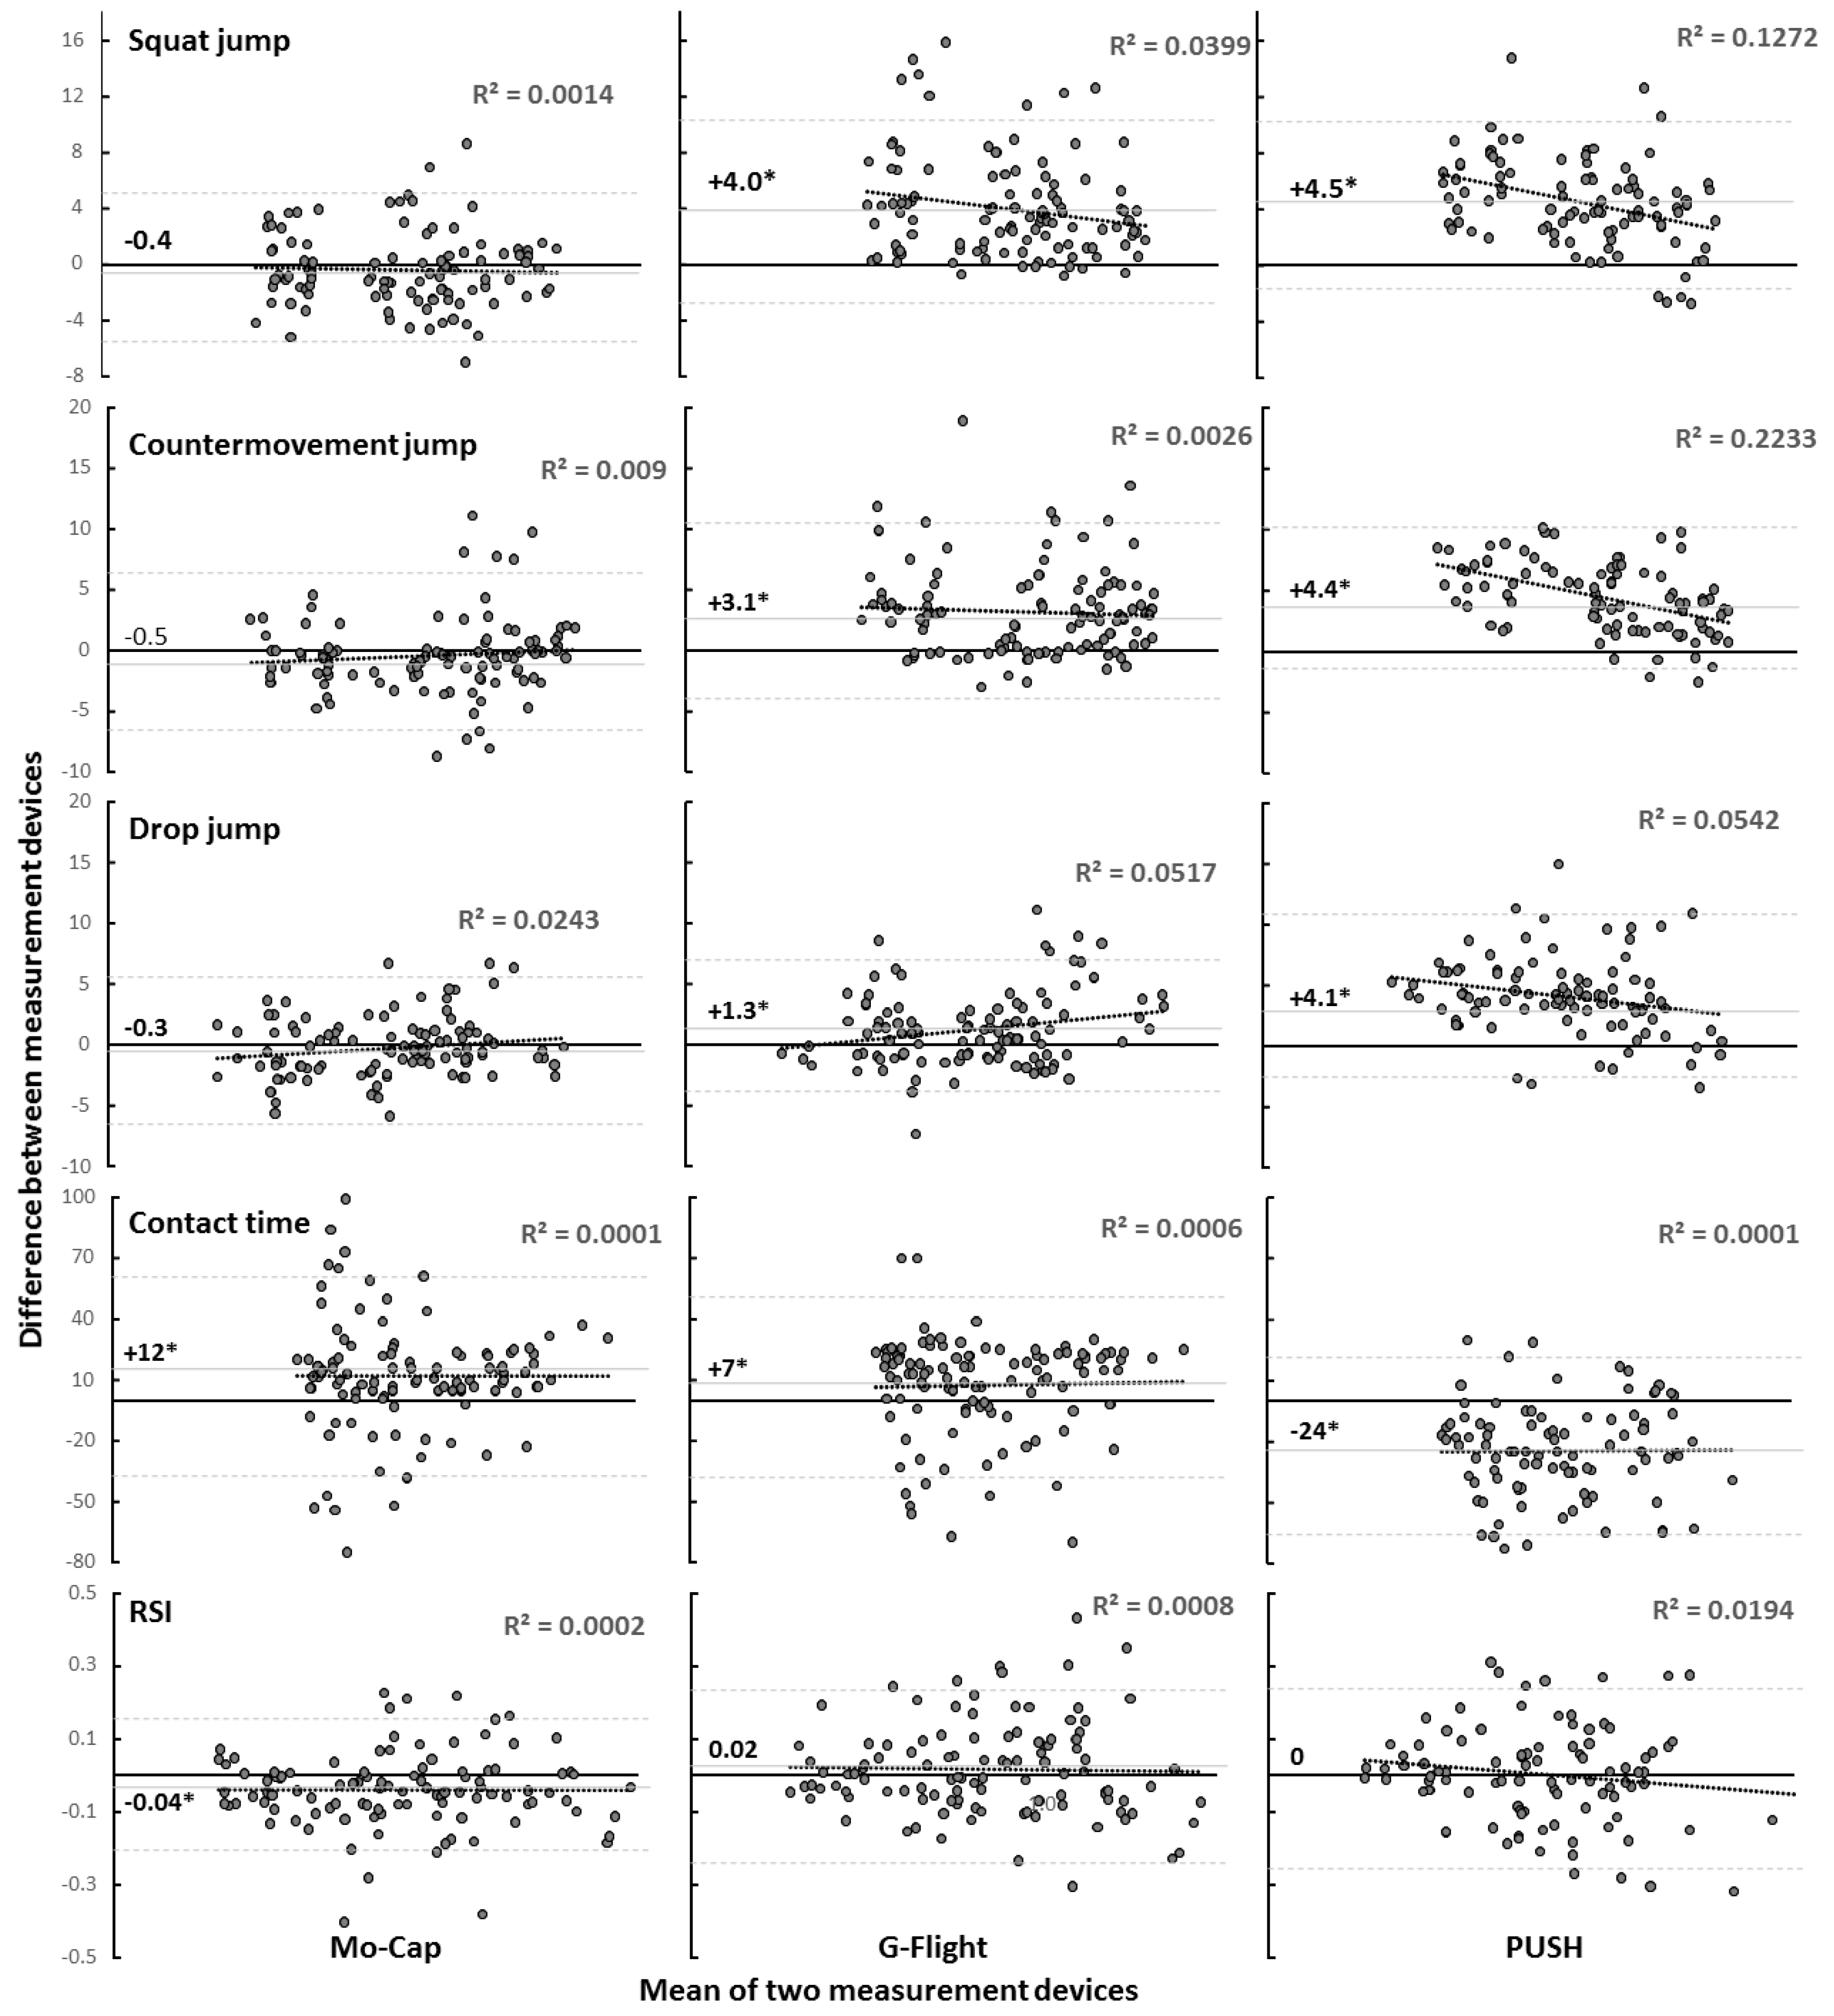
3.1. Validity
3.2. Reliability
4. Discussion
5. Conclusions
Author Contributions
Funding
Conflicts of Interest
References
- Watkins, C.M.; Barillas, S.R.; Wong, M.A.; Archer, D.C.; Dobbs, I.J.; Lockie, R.G.; Coburn, J.W.; Tran, T.T.; Brown, L.E. Determination of vertical jump as a measure of neuromuscular readiness and fatigue. J. Strength Cond. Res. 2017, 31, 3305–3310. [Google Scholar] [CrossRef]
- Oranchuk, D.J.; Mannerberg, J.M.; Robinson, T.L.; Nelson, M.C. Eight weeks of strength and power training improves club head speed in collegiate golfers. J. Strength Cond. Res. 2020, 34, 2205–2213. [Google Scholar] [CrossRef]
- Loturco, I.; Suchomel, T.J.; Bishop, C.; Kobal, R.; Pereira, L.A.; McGuigan, M. One-repetition-maximum measures or maximum bar-power output: Which is more related to sport performance? Int. J. Sports Physiol. Perform. 2018, 14, 33–37. [Google Scholar] [CrossRef]
- Pauli, C.A.; Keller, M.; Ammann, F.; Hubner, K.; Lindorfer, J.; Taylor, W.R.; Lorenzetti, S. Kinematics and kinetics of squats, drop jumps and imitation jumps of ski jumpers. J. Strength Cond. Res. 2016, 30, 643–652. [Google Scholar] [CrossRef]
- Moran, K.A.; Wallace, E.S. Eccentric loading and range of knee joint motion effects on performance enhancement in vertical jumping. Hum. Mov. Sci. 2007, 26, 824–840. [Google Scholar] [CrossRef]
- Muehlbauer, T.; Pabst, J.; Granacher, U.; Busch, D. Validity of the jump-and-reach test in subelite adolescent handball players. J. Strength Cond. Res. 2017, 31, 1282–1289. [Google Scholar] [CrossRef]
- Buckthorpe, M.; Morris, J.; Folland, J.P. Validity of vertical jump measurement devices. J. Sports Sci. 2012, 30, 63–69. [Google Scholar] [CrossRef]
- Wee, J.F.; Lum, D.; Lee, M.; Roman, Q.; Ee, I.; Suppiah, H. Validity and reliability of portable gym devices and an iPhone app to measure vertical jump performance. Sports Perform. Sci. Rep. 2019, 44, 1–5. [Google Scholar]
- Moir, G.L. Three different methods of calculating vertical jump height from force platform data in men and women. Meas. Phys. Educ. Exerc. Sci. 2008, 12, 207–218. [Google Scholar] [CrossRef]
- Balsalobre-Fernández, C.; Glaister, M.; Lockey, R.A. The validity and reliability of an iPhone app for measuring vertical jump performance. J. Sports Sci. 2015, 33, 1574–1579. [Google Scholar] [CrossRef]
- Picerno, P.; Camomilla, V.; Capranica, L. Countermovement jump performance assessment using a wearable 3D inertial measurement unit. J. Sports Sci. 2011, 29, 139–146. [Google Scholar] [CrossRef]
- Yamashita, D.; Murata, M.; Inaba, Y. Effect of landing posture on jump height calculated from flight time. Appl. Sci. 2020, 10, 776. [Google Scholar] [CrossRef]
- Monnet, T.; Decatoire, A.; Lacouture, P. Comparison of algorithms to determine jump height and flight time from body mounted accelerometers. Sports Eng. 2014, 17, 249–259. [Google Scholar] [CrossRef]
- Ruben, R.; Saffel, H.; McCrory, J.; Cormie, P.; Haff, G. Comparison of accelerometer based vertical jump assessments to a linear position transducer plus force plate system. J. Strength Cond. Res. 2011, 25, S37. [Google Scholar] [CrossRef]
- Aragón, L.F. Evaluation of four vertical jump tests: Methodology, reliability, validity, and accuracy. Meas. Phys. Educ. Exerc. Sci. 2000, 4, 215–228. [Google Scholar] [CrossRef]
- Flanagan, E.P.; Ebben, W.P.; Jensen, R.L. Reliability of the reactive strength index and time to stabilization during depth jumps. J. Strength Cond. Res. 2008, 11, 1677–1682. [Google Scholar] [CrossRef]
- Prescott, R.J. Editorial: Avoid being tripped up by statistics: Statistical guidance for a successful research paper. Gait Posture 2019, 72, 240–249. [Google Scholar] [CrossRef]
- Hopkins, W.G. Measures of reliability in sports medicine and science. Sports Med. 2000, 30, 1–15. [Google Scholar] [CrossRef]
- Weir, J.P. Quantifying test-retest reliability using the intraclass correlation coefficient and the SEM. J. Strength Cond. Res. 2005, 19, 231–240. [Google Scholar]
- Balsalobre-Fernández, C.; Tejero-González, C.M.; del Campo-Vecino, J.; Bavaresco, N. The concurrent validity and reliability of a low-cost, high-speed camera-based method for measuring the flight time of vertical jumps. J. Strength Cond. Res. 2014, 28, 528–533. [Google Scholar] [CrossRef]
- Oranchuk, D.J.; Drinkwater, E.J.; Lindsay, R.S.; Helms, E.R.; Harbour, E.T.; Storey, A.G. Improvement of kinetic, kinematic, and qualitative performance variables of the power clean with the hook grip. Int. J. Sports Physiol. Perform. 2019, 14, 378–384. [Google Scholar] [CrossRef]
- Oranchuk, D.J.; Robinson, T.L.; Switaj, Z.J.; Drinkwater, E.J. Comparison of the hang high-pull and loaded jump squat for the development of vertical jump and isometric force-time characteristics. J. Strength Cond. Res. 2019, 33, 17–24. [Google Scholar] [CrossRef]
- Bosco, C.; Luhtanen, P.; Komi, P.V. A simple method for measurement of mechanical power in jumping. Eur. J. Appl. Physiol. 1983, 50, 273–282. [Google Scholar] [CrossRef]
- Lakens, D. Calculating and reporting effect sizes to facilitate cumulative science: A practical primer for t-tests and ANOVAs. Front. Psychol. 2013, 4, 1–12. [Google Scholar] [CrossRef]
- Fritz, C.O.; Morris, P.E.; Richler, J.J. Effect size estimates: Current use, calculations, and interpretation. J. Exp. Psychol. Gen. 2012, 141, 2. [Google Scholar] [CrossRef]
- Bland, J.M.; Altman, D.G. Statistical methods for assessing agreement between two methods of clinical measurement. Lancet 1986, 1, 307–310. [Google Scholar] [CrossRef]
- van den Tillaar, R.; Ball, N. Validity and Reliability of Kinematics Measured with PUSH Band vs. Linear Encoder in Bench Press and Push-Ups. Sports 2019, 7, 207. [Google Scholar] [CrossRef]
- Lenetsky, S.; Brughelli, M.; Nates, R.J.; Cross, M.R.; Lormier, A.V. Validity and reliability of punching impact kinetics in untrained participants and experienced boxers. J. Strength Cond. Res. 2018, 32, 1838–1842. [Google Scholar] [CrossRef]
- Oranchuk, D.J.; Storey, A.G.; Nelson, A.R.; Neville, J.G.; Cronin, J.B. Variability of multiangle isometric force-time characteristics in trained men. J. Strength Cond. Res. 2019. Ahead of print. [Google Scholar] [CrossRef]
- Oranchuk, D.J.; Neville, J.G.; Nelson, A.R.; Storey, A.G.; Cronin, J.B. Variability of concentric angle-specific isokinetic torque and impulse assessments of the knee extensors. Physiol. Meas. 2020, 41, 01NT02. [Google Scholar] [CrossRef]


| Variable | Mean | SD | Minimum | Maximum | %Δ vs. Force-Place | Effect Size (95% CI) vs. Force-Plate |
|---|---|---|---|---|---|---|
| Force-plate | ||||||
| SJ height (cm) | 28.4 | 8.0 | 13.8 | 42.4 | N/A | N/A |
| CMJ height (cm) | 30.6 | 8.5 | 12.1 | 43.3 | N/A | N/A |
| DJ height (cm) | 26.3 | 7.9 | 9.4 | 43.3 | N/A | N/A |
| DJ contact-time (ms) | 332 | 86.9 | 201 | 553 | N/A | N/A |
| RSI | 0.84 | 0.30 | 0.27 | 1.50 | N/A | N/A |
| Mo-Cap | ||||||
| SJ height (cm) | 27.7 | 7.9 | 12.2 | 42.8 | −2.5% | −0.09 (−0.19, 0.37) |
| CMJ height (cm) | 30.2 | 8.8 | 13.9 | 44.7 | −1.3% | −0.05 (−0.32, 0.23) |
| DJ height (cm) | 26.2 | 8.3 | 8.9 | 42.7 | −0.4% | −0.01 (−0.29, 0.27) |
| DJ contact-time (ms) | 346 | 87.5 | 205 | 584 | +4.2% | 0.16 (−0.12, 0.44) |
| RSI | 0.80 | 0.30 | 0.28 | 1.46 | −4.8% | −0.13 (−0.41, 0.14) |
| G-Flight | ||||||
| SJ height (cm) | 32.5 | 7.3 | 18.0 | 45.6 | +14.4% | 0.53 (−0.25, 0.82) |
| CMJ height (cm) | 33.8 | 8.1 | 17.8 | 48.5 | +10.6% | 0.38 (−0.11, 0.67) |
| DJ height (cm) | 27.6 | 8.4 | 8.7 | 46.8 | +4.9% | 0.16 (−0.12, 0.44) |
| DJ contact-time (ms) | 339 | 87.0 | 224 | 578 | +2.1% | 0.08 (−0.20, 0.36) |
| RSI | 0.85 | 0.29 | 0.26 | 1.42 | +1.2% | 0.03 (−0.24, 0.31) |
| PUSH | ||||||
| SJ height (cm) | 32.4 | 6.9 | 19.3 | 44.8 | +14.1% | 0.53 (−0.25, 0.82) |
| CMJ height (cm) | 34.4 | 7.2 | 19.8 | 45.3 | +12.4% | 0.48 (−0.20, 0.76) |
| DJ height (cm) | 30.2 | 7.4 | 14.7 | 45.8 | +14.8% | 0.51 (−0.23, 0.79) |
| DJ contact-time (ms) | 322 | 84.8 | 191 | 514 | −3.0% | −0.12 (−0.39, 0.16) |
| RSI | 0.78 | 0.24 | 0.27 | 1.38 | −7.1% | −0.22 (−0.50, 0.06) |
| Variable | ICC | 95% CI | TEM Session 1 | TEM Session 2 | TEM Session 3 | CV Session 1 | CV Session 2 | CV Session 3 |
|---|---|---|---|---|---|---|---|---|
| Force-plate | ||||||||
| SJ height | 0.994 | 0.990–0.997 | 1.4 ± 0.9 | 1.0 ± 0.5 | 1.4 ± 0.7 | 4.8 ± 2.8 | 3.8 ± 2.1 | 5.0 ± 2.8 |
| CMJ height | 0.994 | 0.989–0.997 | 1.2 ± 0.8 | 1.0 ± 0.6 | 1.3 ± 0.6 | 3.9 ± 2.6 | 3.4 ± 1.9 | 4.1 ± 2.0 |
| DJ height | 0.991 | 0.984–0.995 | 1.0 ± 0.6 | 1.2 ± 0.4 | 1.8 ± 0.8 | 4.3 ± 2.7 | 5.1 ± 3.2 | 7.8 ± 5.0 |
| DJ contact-time | 0.984 | 0.973–0.991 | 21.0 ± 9 | 22.1 ± 15 | 16.0 ± 9 | 6.2 ± 3.0 | 6.7 ± 4.3 | 5.0 ± 2.5 |
| RSI | 0.914 | 0.851–0.953 | 0.05 ± 0.03 | 0.06 ± 0.04 | 0.07 ± 0.04 | 7.0 ± 3.5 | 7.6 ± 6.3 | 9.7 ± 6.0 |
| Mo-Cap | ||||||||
| SJ height | 0.99 | 0.982–0.995 | 1.1 ± 0.7 | 1.4 ± 0.9 | 1.1 ± 0.8 | 4.0 ± 2.4 | 6.1 ± 5.4 | 3.9 ± 2.7 |
| CMJ height | 0.979 | 0.963–0.989 | 1.6 ± 1.1 * | 1.6 ± 1.2 | 2.2 ± 1.7 | 5.2 ± 3.0 | 5.5 ± 3.2 * | 7.1 ± 4.5 |
| DJ height | 0.985 | 0.974–0.992 | 1.2 ± 0.5 | 1.6 ± 1.0 | 1.8 ± 1.0 | 5.2 ± 3.3 | 7.9 ± 6.9 | 8.3 ± 6.4 |
| DJ contact-time | 0.979 | 0.963–0.989 | 21 ± 9 | 19 ± 9 | 23 ± 13 | 5.7 ± 1.9 | 5.6 ± 2.1 | 7.2 ± 3.5 |
| RSI | 0.980 | 0.965–0.989 | 0.06 ± 0.03 | 0.06 ± 0.03 | 0.08 ± 0.05 | 9.0 ± 4.5 | 9.0 ± 5.9 | 11.1 ± 7.6 |
| G-Flight | ||||||||
| SJ height | 0.983 | 0.970–0.991 | 1.7 ± 0.8 | 1.4 ± 1.1 | 1.6 ± 0.6 | 5.6 ± 3.3 | 4.6 ± 3.8 | 5.0 ± 1.7 |
| CMJ height | 0.958 | 0.928–0.977 | 2.6 ± 1.4 * | 2.7 ± 2.0 * | 2.0 ± 0.9 * | 8.1 ± 4.8 * | 9.0 ± 7.8 * | 5.9 ± 1.8 * |
| DJ height | 0.978 | 0.962–0.988 | 1.8 ± 1.2 * | 2.1 ± 1.3 * | 1.8 ± 1.0 | 7.3 ± 5.7 * | 8.9 ± 6.4 * | 7.6 ± 6.6 |
| DJ contact-time | 0.974 | 0.954–0.986 | 21 ± 12 | 23 ± 11 | 23 ± 13 | 5.8 ± 3.6 | 6.9 ± 2.8 | 7.1 ± 4.3 |
| RSI | 0.961 | 0.932–0.979 | 0.08 ± 0.04 * | 0.09 ± 0.05 | 0.10 ± 0.04 | 10.6 ± 4.3 * | 11.0 ± 6.3 * | 12.6 ± 6.8 |
| PUSH | ||||||||
| SJ height | 0.982 | 0.967–0.991 | 1.2 ± 1.0 | 1.3 ± 0.9 | 1.8 ± 0.9 | 3.6 ± 2.7 | 3.9 ± 2.5 | 5.6 ± 2.8 |
| CMJ height | 0.986 | 0.975–0.993 | 1.4 ± 0.7 | 1.4 ± 0.8 * | 1.1 ± 0.5 | 4.0 ± 1.8 | 4.1 ± 2.5 | 3.1 ± 1.3 |
| DJ height | 0.980 | 0.963–0.990 | 1.6 ± 1.1 * | 1.4 ± 0.4 | 2.2 ± 0.9 | 5.4 ± 3.8 | 5.1 ± 2.2 | 7.5 ± 3.3 |
| DJ contact-time | 0.974 | 0.953–0.987 | 21 ± 13 | 16 ± 8 | 23 ± 17 | 6.1 ± 2.8 | 5.3 ± 2.5 | 7.6 ± 5.8 |
| RSI | 0.963 | 0.932–0.981 | 0.06 ± 0.03 | 0.05 ± 0.04 | 0.10 ± 0.06 | 9.0 ± 4.4 | 6.9 ± 4.9 | 13.5 ± 8.8 |
Publisher’s Note: MDPI stays neutral with regard to jurisdictional claims in published maps and institutional affiliations. |
© 2020 by the authors. Licensee MDPI, Basel, Switzerland. This article is an open access article distributed under the terms and conditions of the Creative Commons Attribution (CC BY) license (http://creativecommons.org/licenses/by/4.0/).
Share and Cite
Watkins, C.M.; Maunder, E.; Tillaar, R.v.d.; Oranchuk, D.J. Concurrent Validity and Reliability of Three Ultra-Portable Vertical Jump Assessment Technologies. Sensors 2020, 20, 7240. https://doi.org/10.3390/s20247240
Watkins CM, Maunder E, Tillaar Rvd, Oranchuk DJ. Concurrent Validity and Reliability of Three Ultra-Portable Vertical Jump Assessment Technologies. Sensors. 2020; 20(24):7240. https://doi.org/10.3390/s20247240
Chicago/Turabian StyleWatkins, Casey M., Ed Maunder, Roland van den Tillaar, and Dustin J. Oranchuk. 2020. "Concurrent Validity and Reliability of Three Ultra-Portable Vertical Jump Assessment Technologies" Sensors 20, no. 24: 7240. https://doi.org/10.3390/s20247240
APA StyleWatkins, C. M., Maunder, E., Tillaar, R. v. d., & Oranchuk, D. J. (2020). Concurrent Validity and Reliability of Three Ultra-Portable Vertical Jump Assessment Technologies. Sensors, 20(24), 7240. https://doi.org/10.3390/s20247240