Article

Characterization and Neural Modeling of a Microwave Gas Sensor for Oxygen Detection Aimed at Healthcare Applications †

by
Zlatica Marinković
1,
Giovanni Gugliandolo
2,
Mariangela Latino
2,
Giuseppe Campobello
3,
Giovanni Crupi
4,* and
Nicola Donato
3
1
Faculty of Electronic Engineering, University of Niš, Aleksandra Medvedeva 14, 18000 Niš, Serbia
2
MIFT Department, University of Messina, Viale F. Stagno d’Alcontres 31, 98166 Messina, Italy
3
Department of Engineering, University of Messina, Contrada di Dio, S. Agata, 98166 Messina, Italy
4
BIOMORF Department, University of Messina, Via Consolare Valeria, 98100 Messina, Italy
*
Author to whom correspondence should be addressed.
This manuscript is an extension version of the conference papers: Gugliandolo, G.; Latino, M.; Campobello, G; Marinkovic, Z.; Crupi, G.; Donato, N. On the gas sensing properties of microwave transducers. In Proceedings of the IEEE International Scientific Conference on Information, Communication and Energy Systems and Technologies (ICEST), Niš, Serbia, 10–12 September 2020. Marinkovic, Z.; Gugliandolo, G.; Latino, M.; Campobello, G.; Crupi, G.; Donato, N. Artificial Neural network modeling of interdigital capacitor sensor for oxygen detection. In Proceedings of the IEEE International Scientific Conference on Information, Communication and Energy Systems and Technologies (ICEST), Niš, Serbia, 10–12 September 2020.
Sensors 2020, 20(24), 7150; https://doi.org/10.3390/s20247150
Submission received: 11 November 2020 / Revised: 7 December 2020 / Accepted: 10 December 2020 / Published: 13 December 2020
(This article belongs to the Special Issue Chemical Sensors for Measurement Systems)

Abstract

:
The studied sensor consists of a microstrip interdigital capacitor covered by a gas sensing layer made of titanium dioxide (TiO2). To explore the gas sensing properties of the developed sensor, oxygen detection is considered as a case study. The sensor is electrically characterized using the complex scattering parameters measured with a vector network analyzer (VNA). The experimental investigation is performed over a frequency range of 1.5 GHz to 2.9 GHz by placing the sensor inside a polytetrafluoroethylene (PTFE) test chamber with a binary gas mixture composed of oxygen and nitrogen. The frequency-dependent response of the sensor is investigated in detail and further modelled using an artificial neural network (ANN) approach. The proposed modelling procedure allows mimicking the measured sensor performance over the whole range of oxygen concentration, going from 0% to 100%, and predicting the behavior of the resonant frequencies that can be used as sensing parameters.

Graphical Abstract

1. Introduction

The recent development of the ambient-assisted living concept and the extraordinary progress of bioengineering and healthcare applications have enforced the development of a wide range of sensors aimed at sensing different environmental and biomedical parameters [1,2,3,4,5]. Sensing gas presence is very important not only for ensuring a safe living environment without dangerous gases, but also for being of help in the diagnosis of certain illnesses, such as diabetes, cancer, etc. [6,7,8,9,10,11,12,13], as well as in therapeutic applications [14,15]. In recent years, various sensors based on microwave devices have been developed to be used for gas sensing purposes [16,17,18,19,20,21,22,23,24,25,26,27,28,29,30,31,32,33,34,35,36,37,38]. Compared to their conventional counterparts based on resistive, capacitive, and amperometric effects [18], sensors based on microwave transducers show better performance, i.e., they have lower power consumption, a shorter response time, and a lower operating temperature [16,18,19,20,21,22]. A low-cost electronic interface can be developed for such sensors with an accurate resonant frequency estimation [39,40,41,42]. Moreover, they can be easily integrated into antennas, thereby being compatible with wireless technologies [25,26,43]. It is worthy of note that, through integration with microfluidic channels, microwave sensors can also allow dielectric characterization of biological liquids [44,45,46,47,48]. In recent years, many efforts have been devoted to the development of the materials, design, and applications of miniature devices for gas sensing [49,50]. Among the many applications, gas sensors used for oxygen detection are particularly notable because of their use in monitoring pollution emissions from various sources (e.g., motor vehicles and industrial combustions) [50,51].
A microwave transducer consists of a microwave device, acting as an electromagnetic wave propagative structure, which is covered with a sensing layer, as illustrated in Figure 1. When exposed to the target gas, the sensing layer material interacts with the gas molecules and, consequently, the dielectric properties and the device electrical response are changed. Therefore, the changes in the target gas concentration influence the changes in the electrical response of the sensor. Often, the propagative structure is realized in the microstrip technology, such as microstrip patch antennas [24,25,26], microwave resonators [20,27,28,29,30,31,32], and other microstrip structures [35,36]. Among the various exploited structures, sensors based on the use of interdigital capacitors (IDCs) as propagative structures have been proposed [30,37]. The gas sensor considered in this work is a two-port IDC fabricated in microstrip technology and covered with a thick layer of titania (TiO2), as a sensitive layer. TiO2 is widely known in scientific literature as a sensing material, such as the resistive gas sensors developed by employing Pt-TiO2/MWCNTs (multi-walled carbon nanotubes) hybrid composites [52] and TiO2 coated carbon nanotubes prepared by atomic layer deposition (ALD) [53]. Furthermore, the sensing properties and photochromism of Ag-TiO2 nanoheterostructures were also evaluated [54]. The TiO2 metal oxide is suitable for the present purpose since the O2 molecules absorbed on its surface can be easily desorbed, even at room temperature [33,54]. The developed prototype is used as a probe for oxygen (O2) sensing. A possible application for this device is in oxygen therapy, where the O2 concentration is usually greater than 85%. The device could be also useful in spacecraft oxygen level detection; in these cases, the O2 concentration is above 60% [55].
The main aim of this paper is to develop and exploit a model able to mimic accurately the electrical response in a frequency range spanning from 1.5 GHz to 2.9 GHz, and for different concentrations of O2, ranging from 0% to 100% v/v at a room temperature. To develop the model, artificial neural networks (ANNs) have been chosen as the modelling tool. Owing to their ability to learn the relationship between an input–output set of data, ANNs have found a variety of applications in different research fields, such as microwave device modelling [56,57,58,59,60,61,62,63,64,65,66] and gas sensing purposes [67,68,69,70,71,72,73,74,75]. As far as microwave device modelling is concerned, the ANNs have often been applied to model the device’s electrical characteristics versus different operating and ambient conditions, as well as versus device dimensions making the model scalable. In the gas sensing applications, the ANNs are, typically, exploited for gas concentration sensing, gas classification, and modelling of the gas sensor characteristics. In the present case, an ANN model is developed to reproduce faithfully the device’s electrical characteristics. The admittance (Y−) parameter representation is adopted, and particular attention is given to the shift in the resonant frequencies of Y11, which can be used as sensing parameters for detecting the concentration of the gas that the sensor is exposed to. To model the sensor behavior under different gas concentrations, the ANNs are exploited. Namely, the developed model relates the Y11 real and imaginary parts of the sensor with the frequency and O2 concentration by using a two-step hierarchical prior-knowledge-input (PKI) neural approach. This study extends the previous findings reported in [37,38], focusing on a thorough investigation of the neural modelling approach for mimicking the shift in the resonant frequencies with the changes of the gas concentration variations, as well as their sensitivity-based analysis. The learning and generalization capabilities of the neural-based approach are exploited for modelling the resonant frequencies, in order to strengthen their possible usage as gas concentration sensing markers.
The paper is organized as follows. The studied sensor, experimental set-up, and a brief analysis of the measured electrical characteristics are given in Section 2. Section 3 contains a description of the developed ANN-based model. The most illustrative results, followed by a corresponding discussion, are presented in Section 4. Finally, Section 5 contains the main concluding remarks.

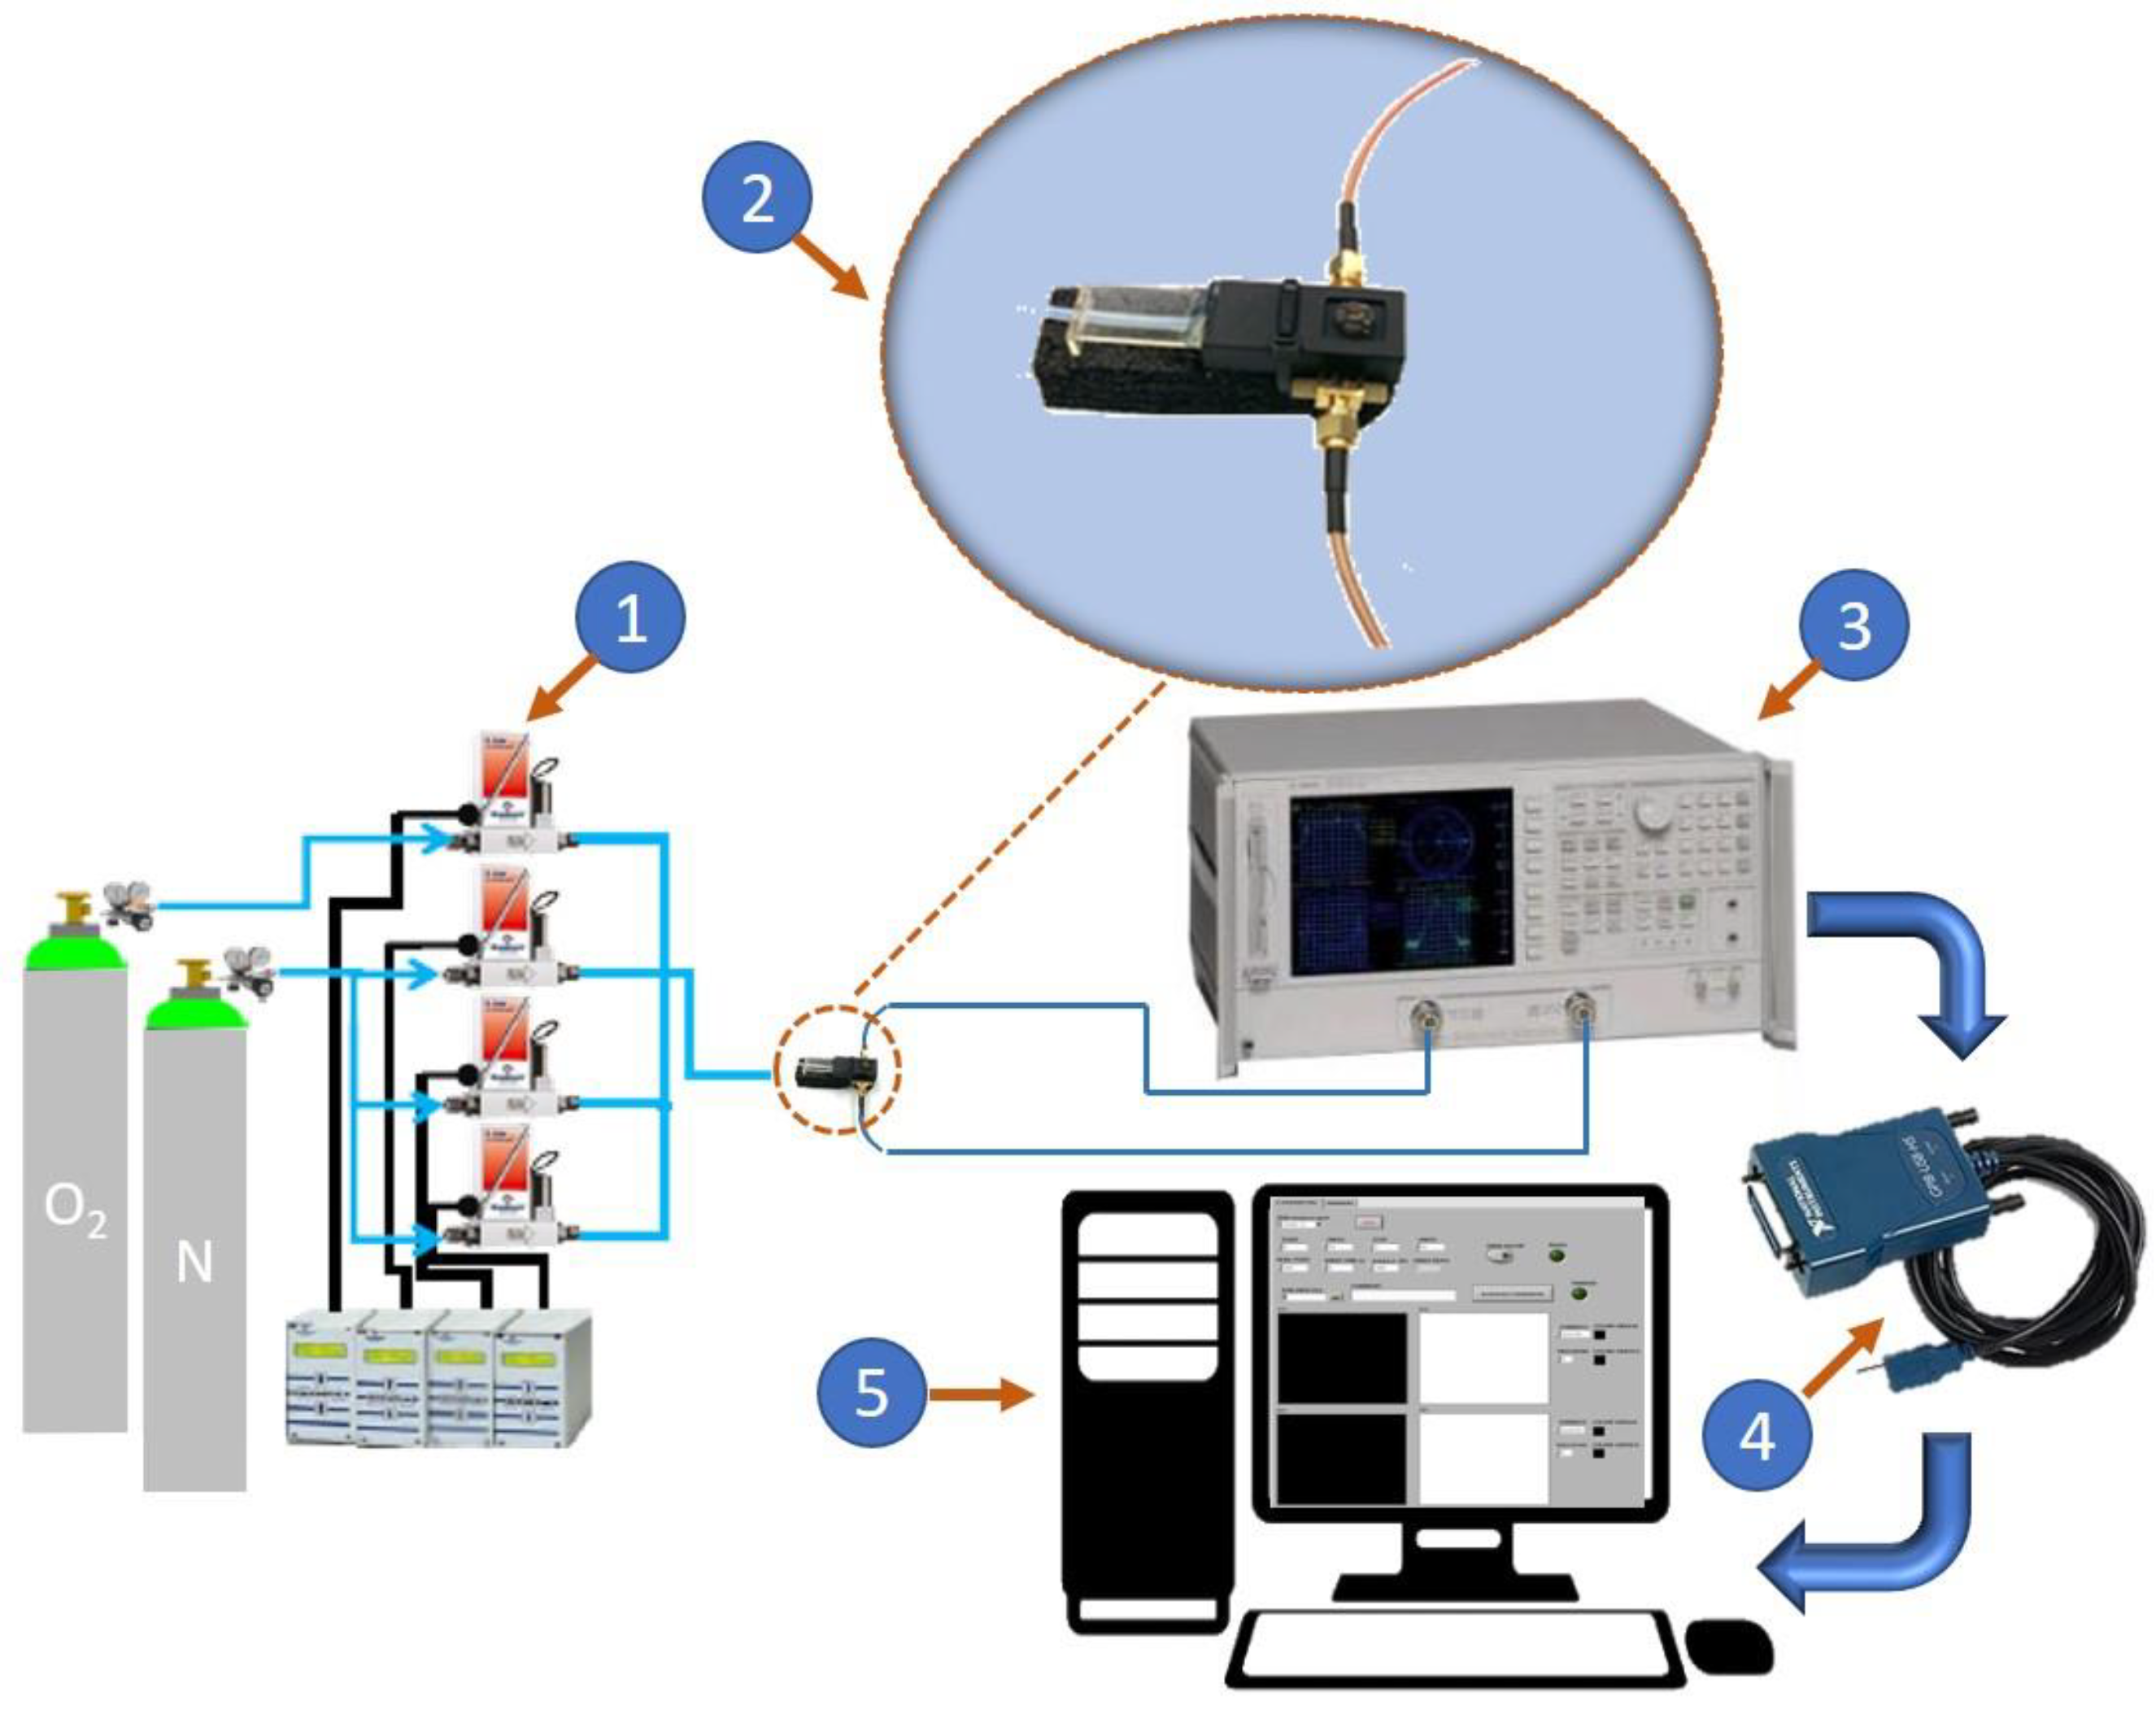
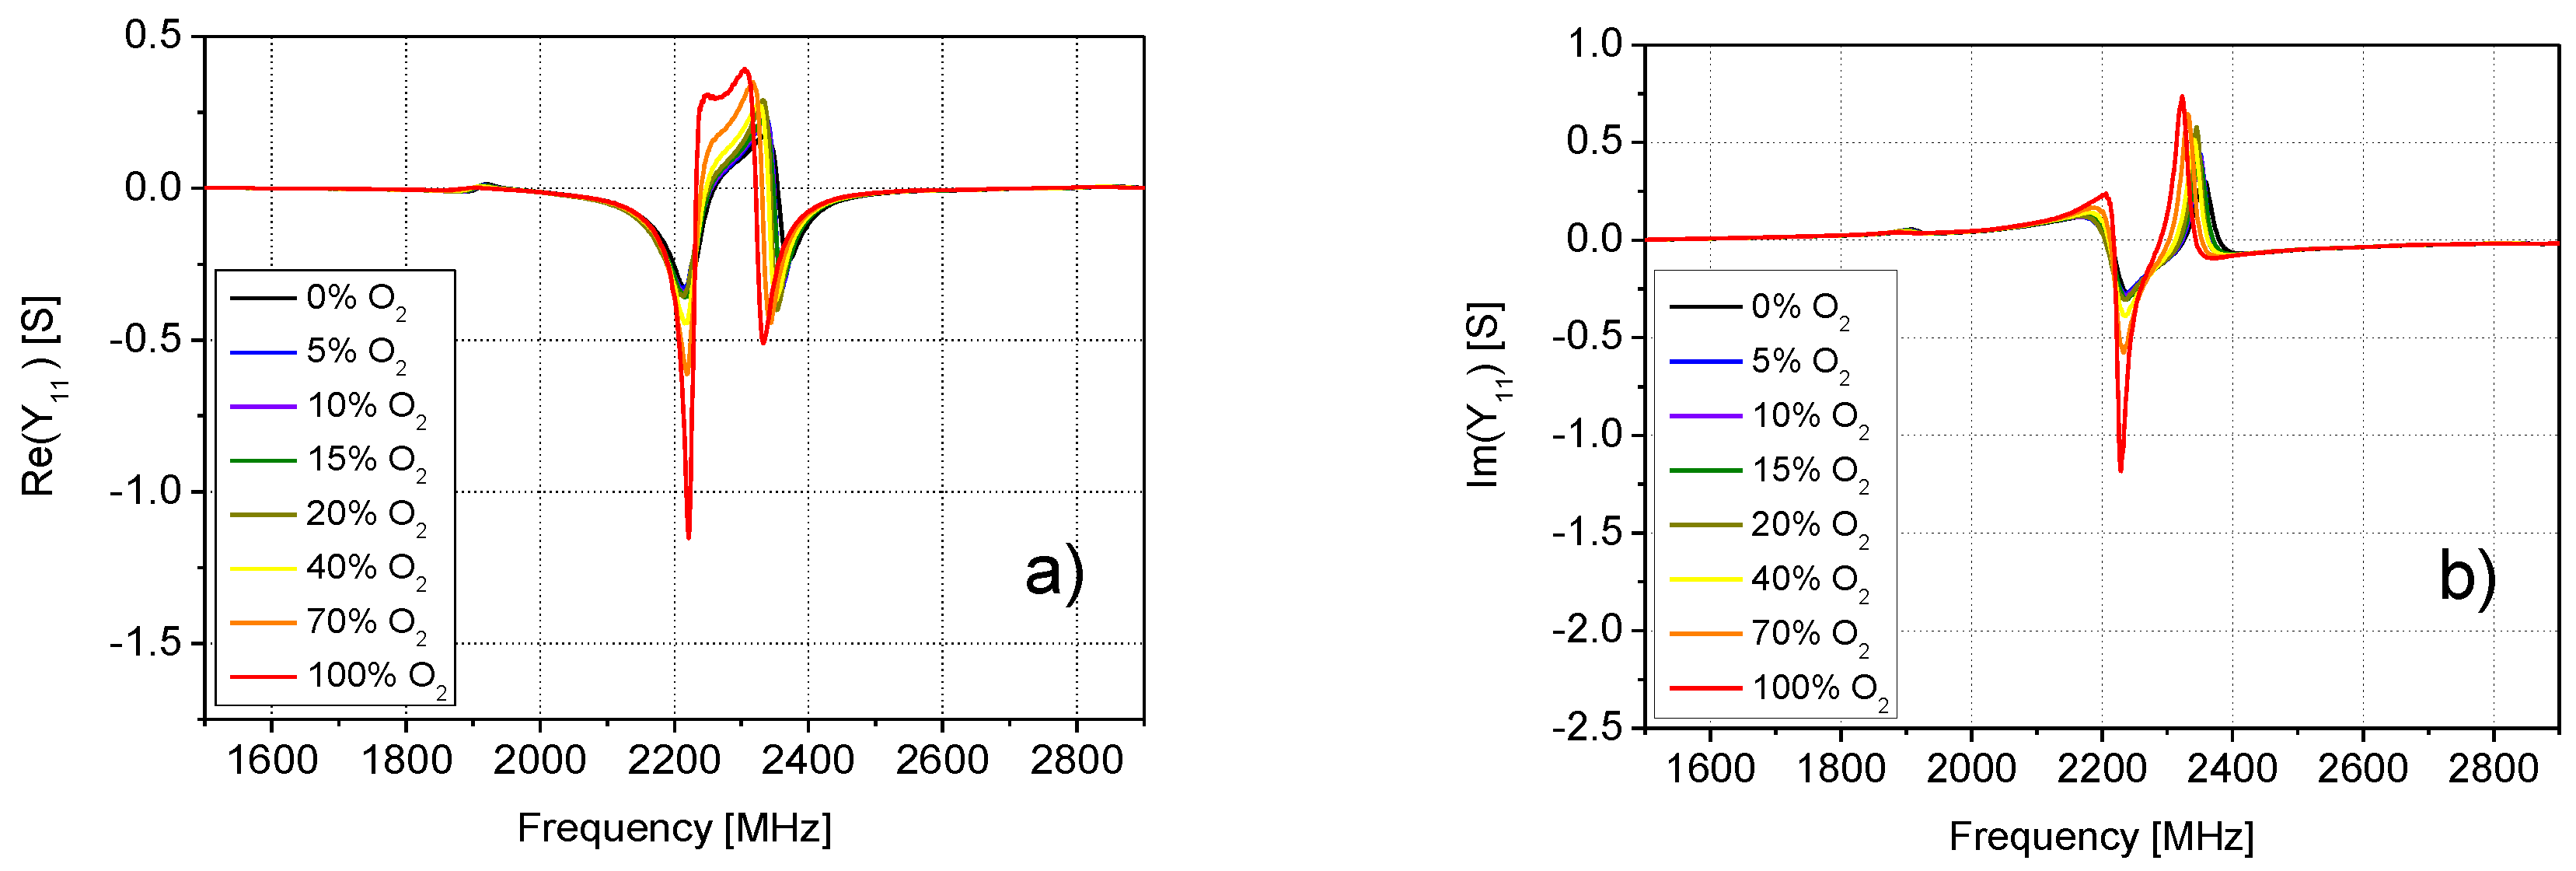
2. Studied Sensor and Experimental Set-up
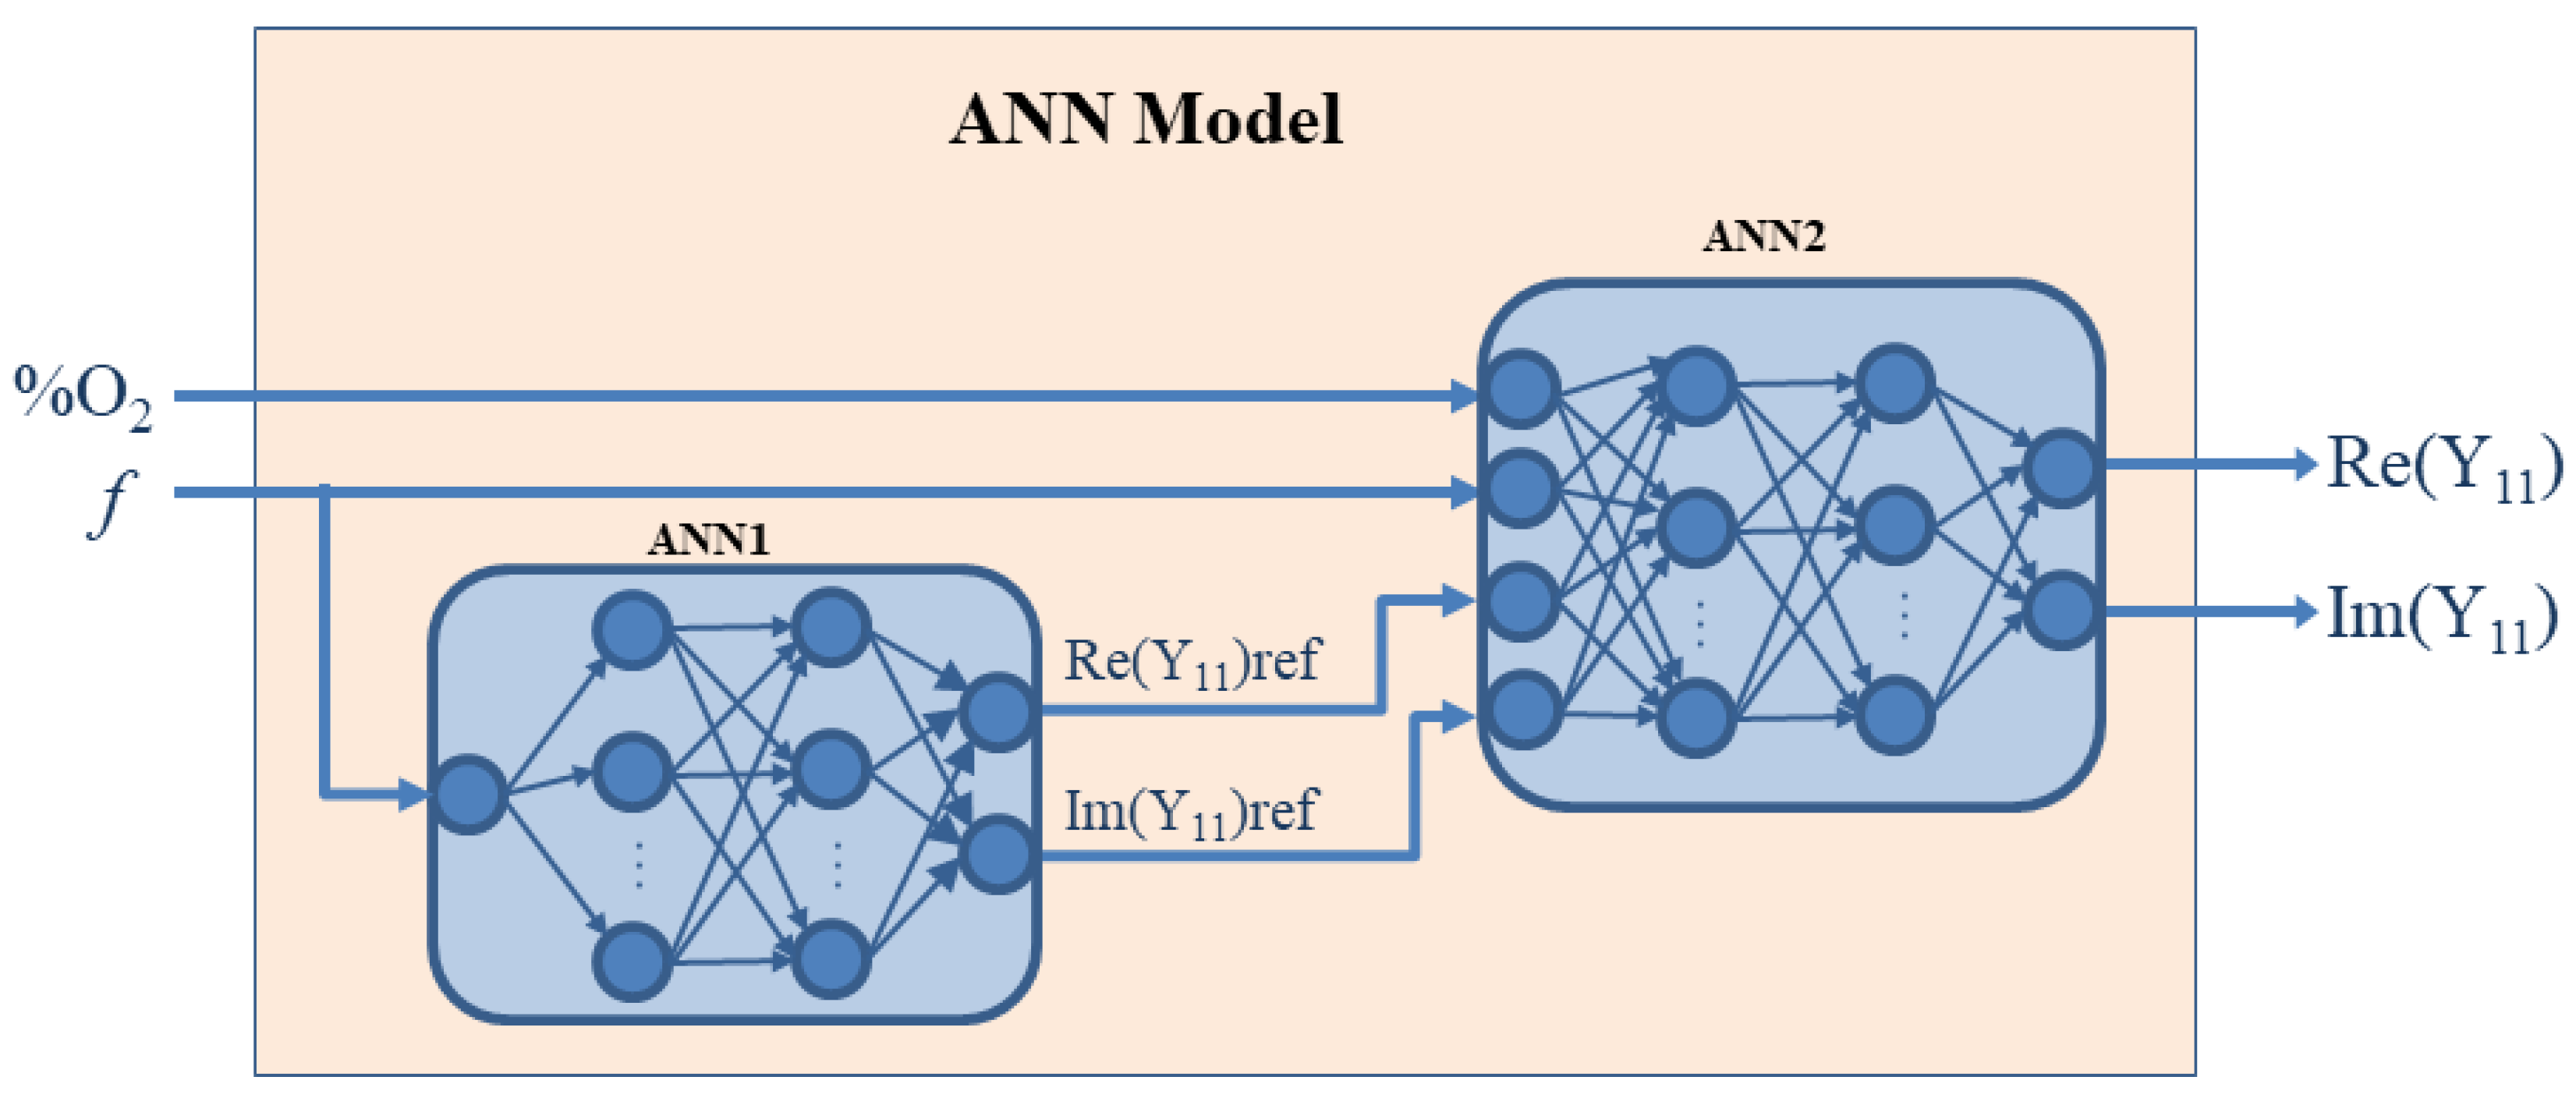
As mentioned in the introductory section, a two-port IDC structure covered by a gas sensing layer is employed as a microwave transducer for oxygen sensing (see Figure 2). The studied device is made of six fingers with the following dimensions: a length (Lf) of 15 mm, a width (Wf) of 0.36 mm, and a spacing (S) of 0.36 mm. Microstrip lines with the input impedance of 50 Ω are connected at the SMA connectors at the input and output ports of the device. The structure is fabricated on a 1.6-mm FR4 substrate by using the LPKF Protomat S103 PCB milling machine. The dielectric constant (εr) and the loss tangent (tanδ) of the substrate are 4.2 and 0.015, respectively. The board dimensions are relatively small (i.e., 20 mm × 30 mm × 1.6 mm). A picture of the fabricated device is shown in Figure 3a. As a sensitive layer, a thick layer of TiO2 is deposited by screen printing at the top of the fabricated IDC. The employed TiO2 is composed of 56.5% anatase, 19.8% rutile, and 23.6% brookite [54]. To reduce the humidity content, the device with the deposited sensing layer is placed inside an oven at 60 °C for two hours. A picture of the device with the deposited sensing layer is reported in Figure 3b.
An illustration of the experimental set-up is shown in Figure 4. It is a fully automated gas control system consisting of certified gas bottles and mass flow controllers, in order to set the preferred gas mixture inside the testing chamber and create a controlled atmosphere. Therefore, it is possible to select the gas mixture, set the concentration value for each gas, and control/monitor the gas flow. The sensor under test (SUT), which is being characterized, is placed inside a polytetrafluoroethylene (PTFE) test chamber. The small chamber volume (5 cm3) allows for the setting or purging of the gas content in a short time. The device is exposed to a binary gas mixture composed of oxygen and nitrogen (N2). The O2 concentration is varied from 0% (pure N2 inside the chamber) to 100% (no N2 inside the chamber). The gas flow, set to 100 cm3/min, is maintained constant for the whole measurement session. The SUT is connected to the Agilent 8753ES vector network analyzer (VNA) that is used to perform the frequency-dependent measurements. The measured data are transferred via the USB/GPIB interface to a personal computer, where they are stored. The sensor electrical response is determined by measuring the scattering (S−) parameters under different conditions of O2 concentration. The S-parameters are complex and frequency-dependent quantities that allow for full characterization of the electrical behaviorbehavior of linear devices. However, as discussed below, instead of the S-parameters, it is more suitable to carry out the investigation using the impedance (Z−) or admittance (Y−) parameters, which are equivalent representations that can be straightforwardly calculated from the measured S-parameters by means of the well-known conversion formulas [76,77]. As an illustrative example, we report here the conversion formulas from S- and Z- parameters to the Y-parameters:
[ Y 11               Y 12 Y 21               Y 22 ] = [ Z 22 Z 11 Z 22 Z 12 Z 21           Z 12 Z 11 Z 22 Z 12 Z 21 Z 21 Z 11 Z 22 Z 12 Z 21         Z 11 Z 11 Z 22 Z 12 Z 21 ] = [ Y 0 ( 1 S 11 ) ( 1 + S 22 ) + S 12 S 21 ( 1 + S 11 ) ( 1 + S 22 ) S 12 S 21                 Y 0 2 S 12 ( 1 + S 11 ) ( 1 + S 22 ) S 12 S 21 Y 0 2 S 21 ( 1 + S 11 ) ( 1 + S 22 ) S 12 S 21         Y 0 ( 1 + S 11 ) ( 1 S 22 ) + S 12 S 21 ( 1 + S 11 ) ( 1 + S 22 ) S 12 S 21 ]
where Y0 is the characteristic admittance (normally 20 mS).
The analysis of the Z− and Y− parameters at all studied O2 concentrations showed that the impedance parameters of the SUT quite closely satisfy the condition Z11 = Z22 = −Z12 = −Z21, and, analogously, the admittance parameters are quite close to the condition Y11 = Y22 = Y12 = Y21. As an illustrative example of the validity of these approximations, Figure 5, Figure 6 and Figure 7 report the frequency dependence of the Z− and Y− parameters at 70% of O2 concentration. Therefore, Y11 has been selected for further investigation and modelling, since it is enough to study the behavior of only one parameter versus the frequency and O2 concentrations. This made the analysis simpler and faster.
By analyzing the admittance parameter Y11 for all considered concentrations of O2 (see Figure 8), it was concluded that a substantial variation of the admittance parameter was observed in the frequency range from 2.0 GHz to 2.5 GHz. Particular attention has then been devoted to this frequency range.

3. ANN-Based Model

A modelling approach based on multilayer perceptron ANNs is proposed to model the behavior of the admittance parameters versus the frequency and the O2 concentration, as shown in Figure 9 [38]. Since the admittance parameters closely satisfy the condition Y11 = Y22 = Y12 = Y21, it is enough to develop a model only for the parameter Y11. For that purpose, an ANN having two outputs referring to the real and imaginary parts of Y11 should be trained by using the values of the measured Y11. The ANN has two input neurons corresponding to the O2 concentration and frequency (see ANN2 in Figure 9). Moreover, the proposed ANN has, besides the two mentioned inputs, two additional inputs referring to the real and imaginary parts of Y11 at a reference concentration. Namely, in order to ensure the modelling accuracy, a so-called prior-knowledge-input neural modelling approach is adopted [56]. The PKI approach assumes that the ANN has additional inputs, which are correlated in a certain way to the ANN outputs, with the aim of more easily achieving the desired accuracy with the available set of data. As the prior-knowledge, Y11 at a chosen reference O2 concentration is exploited, since the shape of the frequency-dependent behavior of Y11 is roughly similar for all concentrations. For determining Y11 at the chosen reference frequency, an additional ANN is considered, namely ANN1 in Figure 9. It has one input and two output neurons. Both ANNs can have one or two layers of hidden neurons. The number of hidden neurons is determined during the ANN training process, as it is not possible to determine it a priori. Namely, for each ANN, ANN structures with a different number of hidden neurons are trained and then, after comparing their accuracy, the best one is chosen as the final model.
The procedure of the model development is as follows. As the first step, the ANN1 is trained using the values of the measured Y11 at the chosen reference concentration and in the considered frequency range. As the next step, the training dataset for ANN2 development is built. Namely, the measured frequency-dependent behavior of the real and imaginary parts of Y11 for different O2 concentrations is accompanied by the values of Y11 at the reference concentration calculated from ANN1 for the same frequency. Once the ANN2 is trained, the two ANNs form the model that can be further used. It is noteworthy that the ANNs can be described with the equivalent mathematical expressions, which can be straightforwardly implemented in a circuit simulator or any math-based environment. In particular, the proposed ANN model can be integrated with a simulator and used for accurate modelling of gas sensors. Such a model might reduce both processing time and analytical complexity, resulting in a simpler computation process.
In the present case, the values of Y11, calculated from the measured S-parameters, were available at the following O2 concentrations: 0%, 5%, 10%, 15%, 20%, 40%, 70% and 100%. Upon analysis of the behavior of Y11 at these concentrations, 70% was selected as the reference concentration of O2. Therefore, ANN1 was trained with the data of Y11 referring to this concentration. The best ANN was the one with two hidden layers having five hidden neurons each. This ANN accurately mimics the real and imaginary parts of Y11, as can be seen in Figure 10.
Afterwards, ANN2 was trained. From the available measurements, the data referring to the concentrations of 5% and 15% were left for the model verification, whereas the rest of the data was used for training purposes. As mentioned above, each measurement sample was accompanied by the corresponding values of Y11 that were calculated by using ANN1 for the same frequency, in order to be used as the ANN2 PKI inputs. After the training of several ANNs with a different number of hidden neurons, the ANN which gave the best compromise between the learning (i.e., the accuracy of predicting the training data) and the generalization (i.e., the accuracy of predicting the data not used for the ANN training) was chosen as the final model. This ANN model had two hidden layers consisting of 15 and 12 neurons, respectively. The ANNs were trained by applying the Levenberg–Marquardt training algorithm [56], which belongs to the backpropagation type of training algorithms. To illustrate the achieved learning and generalization accuracy, Figure 11 illustrates the real and imaginary parts of Y11 at different O2 concentrations. It can be noted that the values obtained by the ANN model (lines) closely match the measured values (symbols), not only for the training values of O2 concentration but also for the test values not used for the ANN training. This signifies that the ANN assimilated the training data and achieved a good generalization in predicting Y11 for the concentration values not considered during the model development.
To quantify further the modelling accuracy, the absolute variation of the real and imaginary parts of Y11 simulated by the ANN model from the corresponding measured values is reported for all considered concentrations in Figure 12. Moreover, in Figure 12, the error distribution histograms are also reported. The histograms show how many of the considered total number of samples (i.e., the data points corresponding to different combinations of the frequency and the O2 concentration) have the value belonging to the range of each histogram bin. From these plots, one can see that the maximum absolute difference, for both real and imaginary parts, is smaller than 0.15 S, but in majority of the cases is even smaller than 0.05 S.

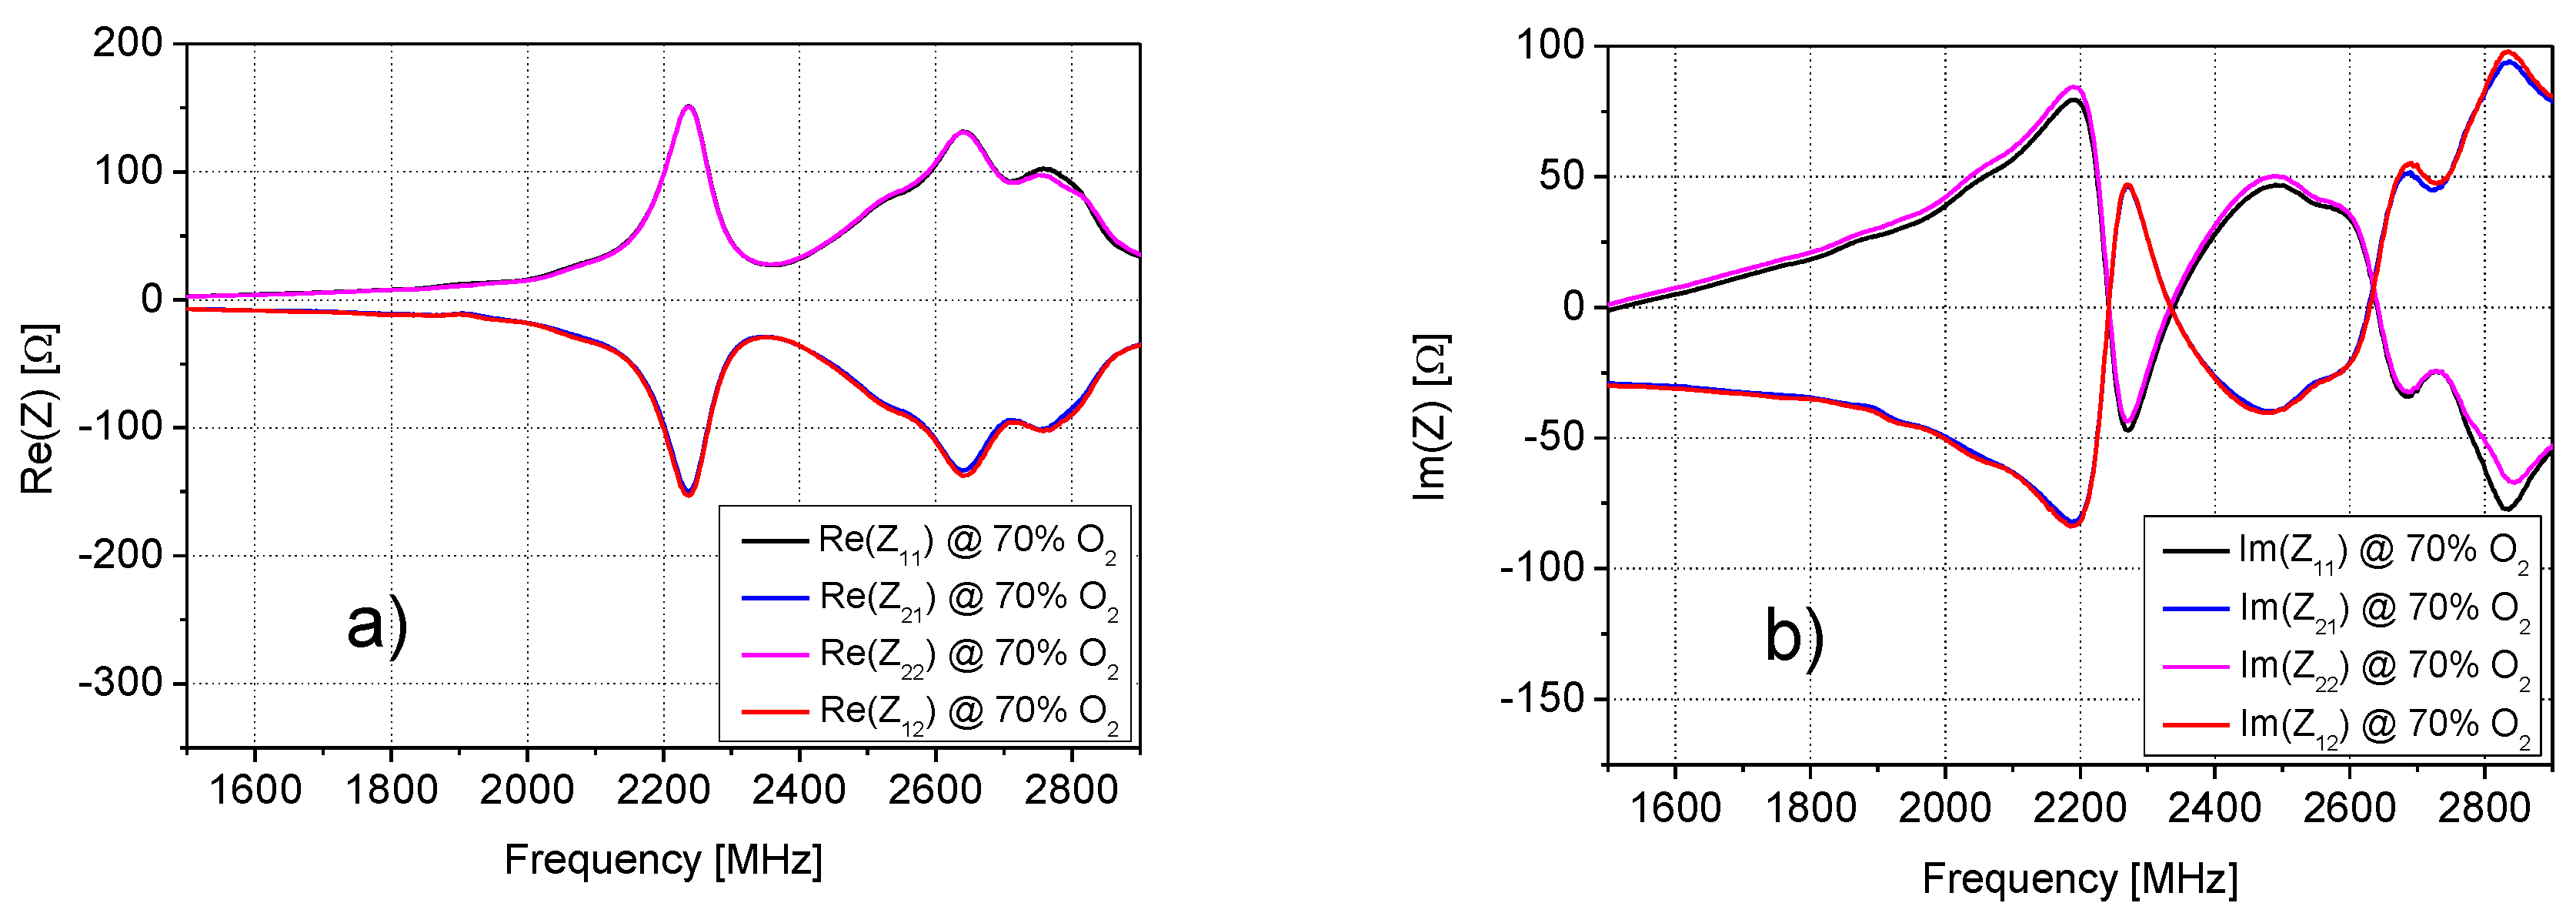
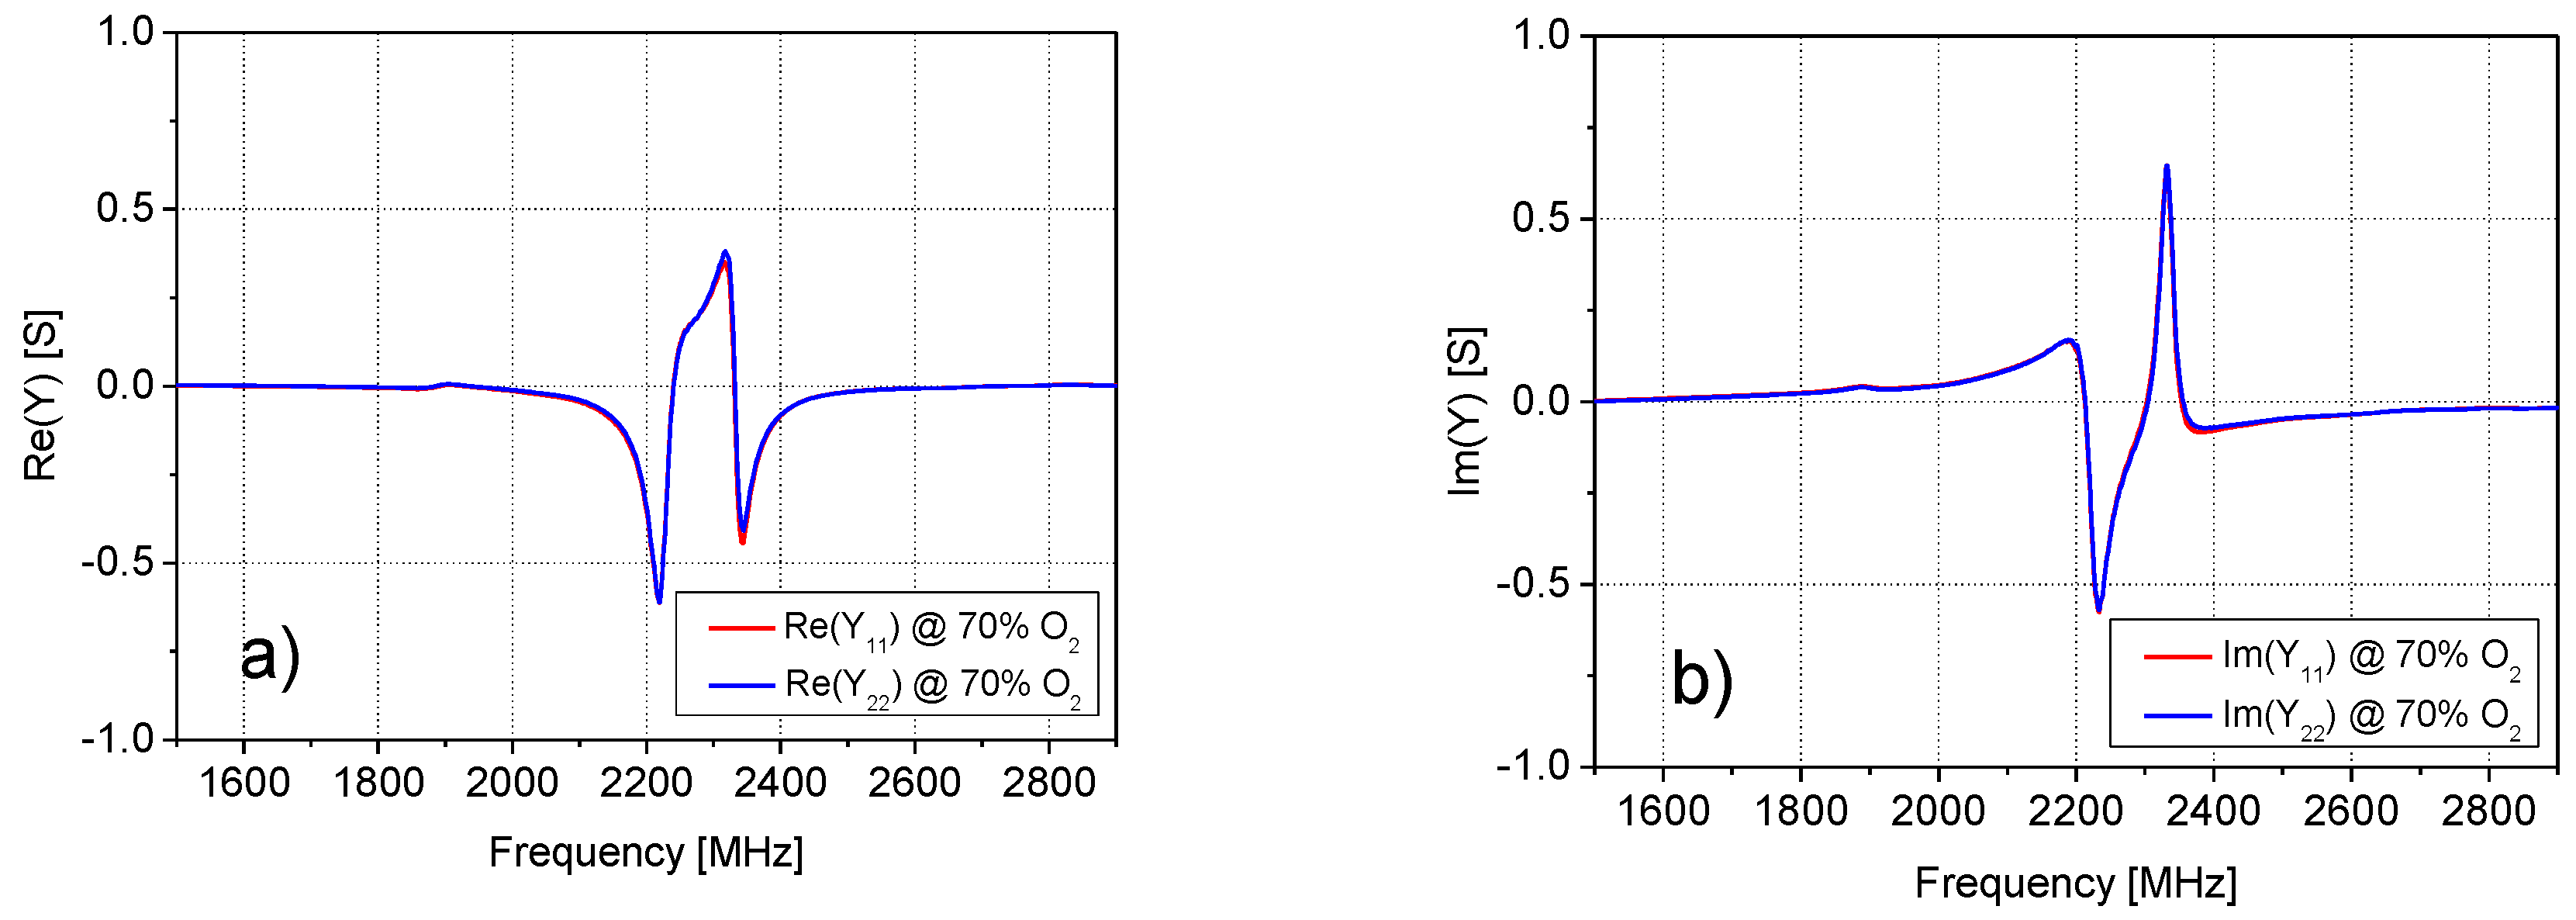
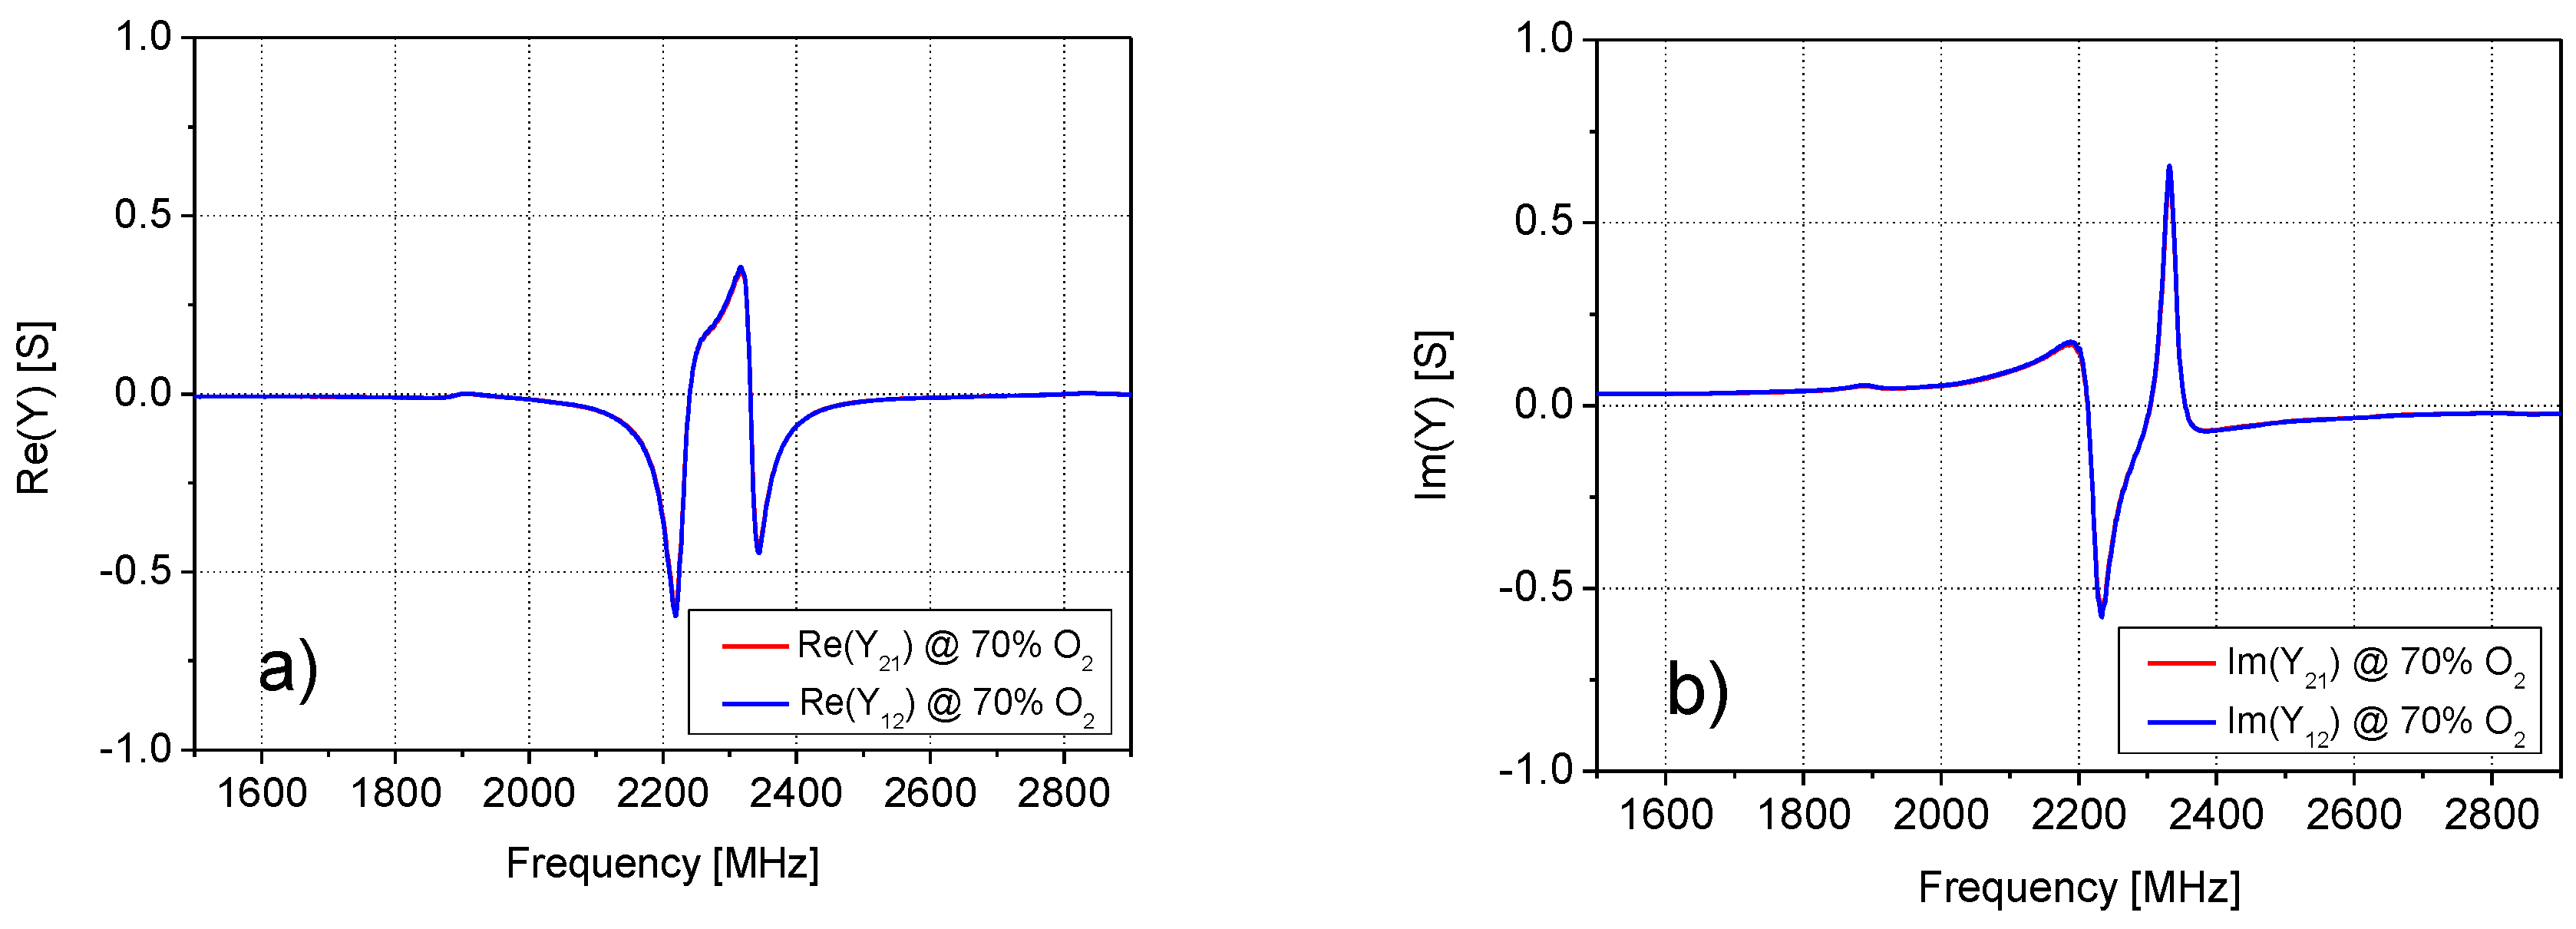
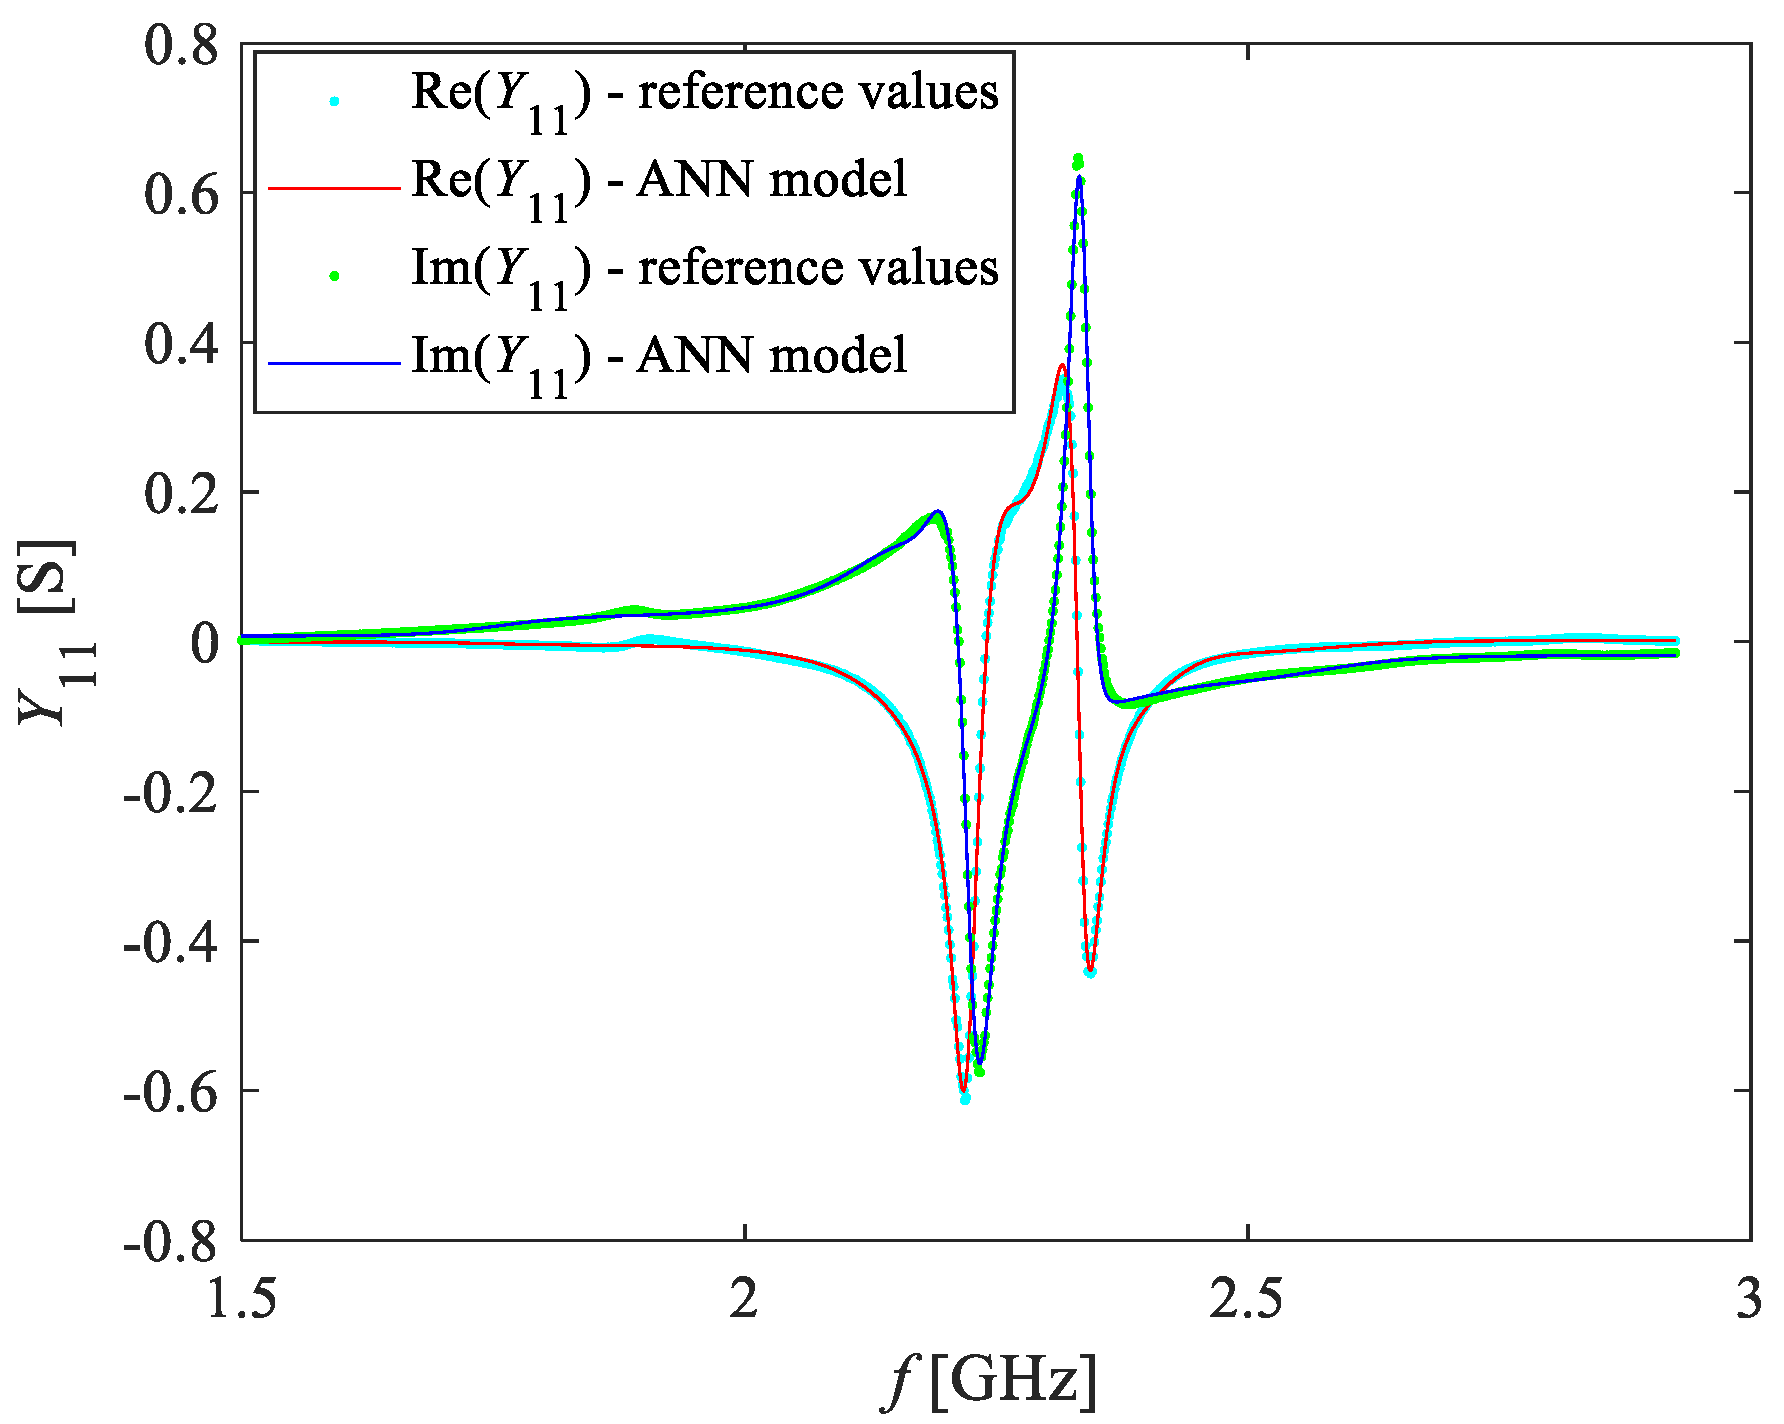
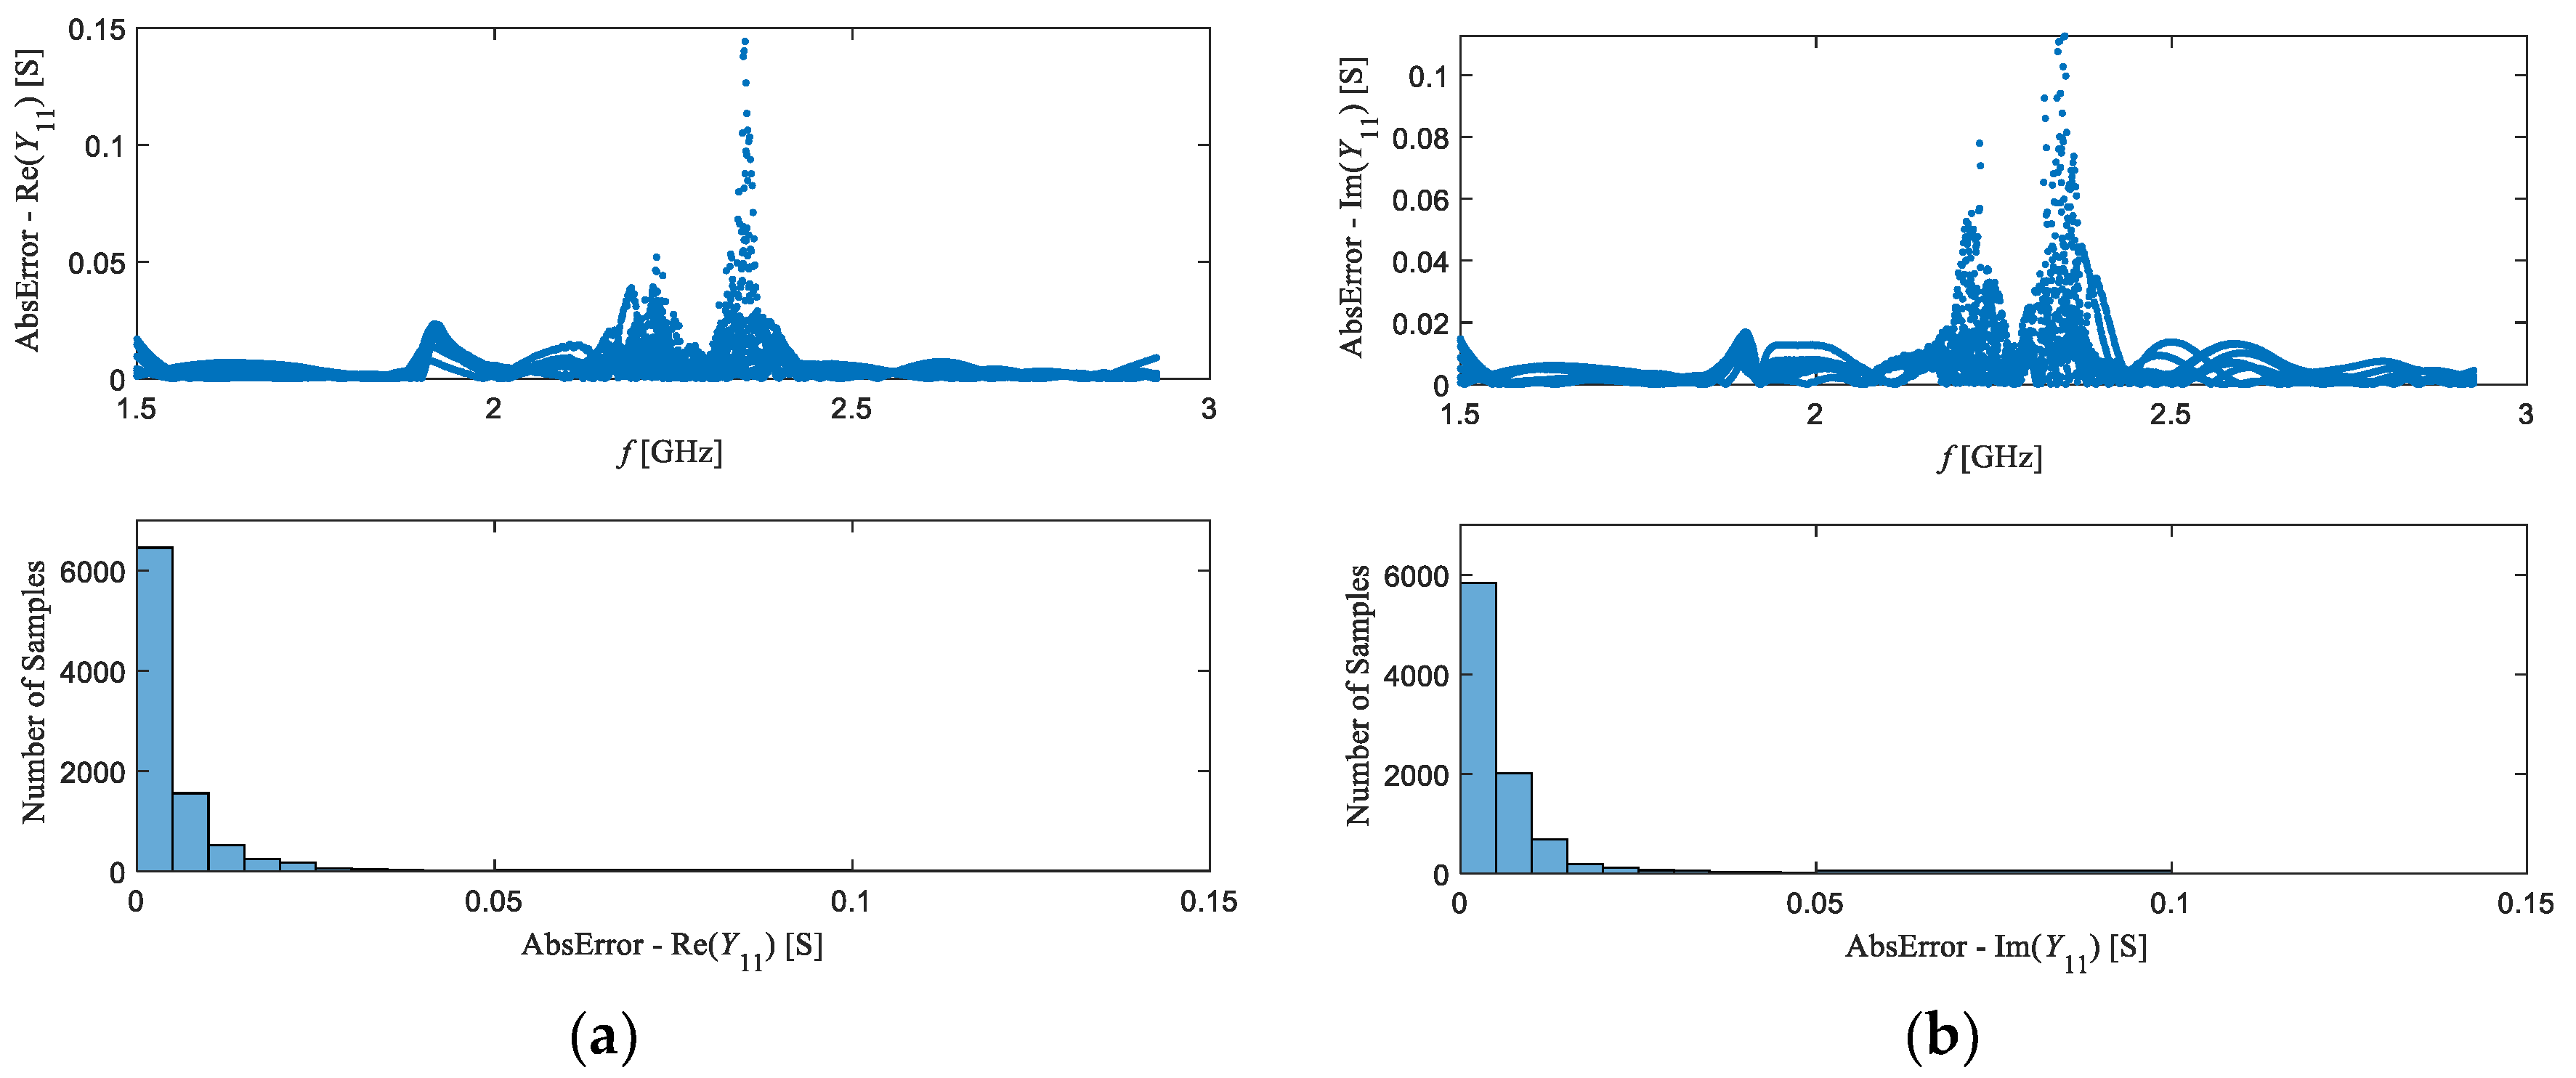
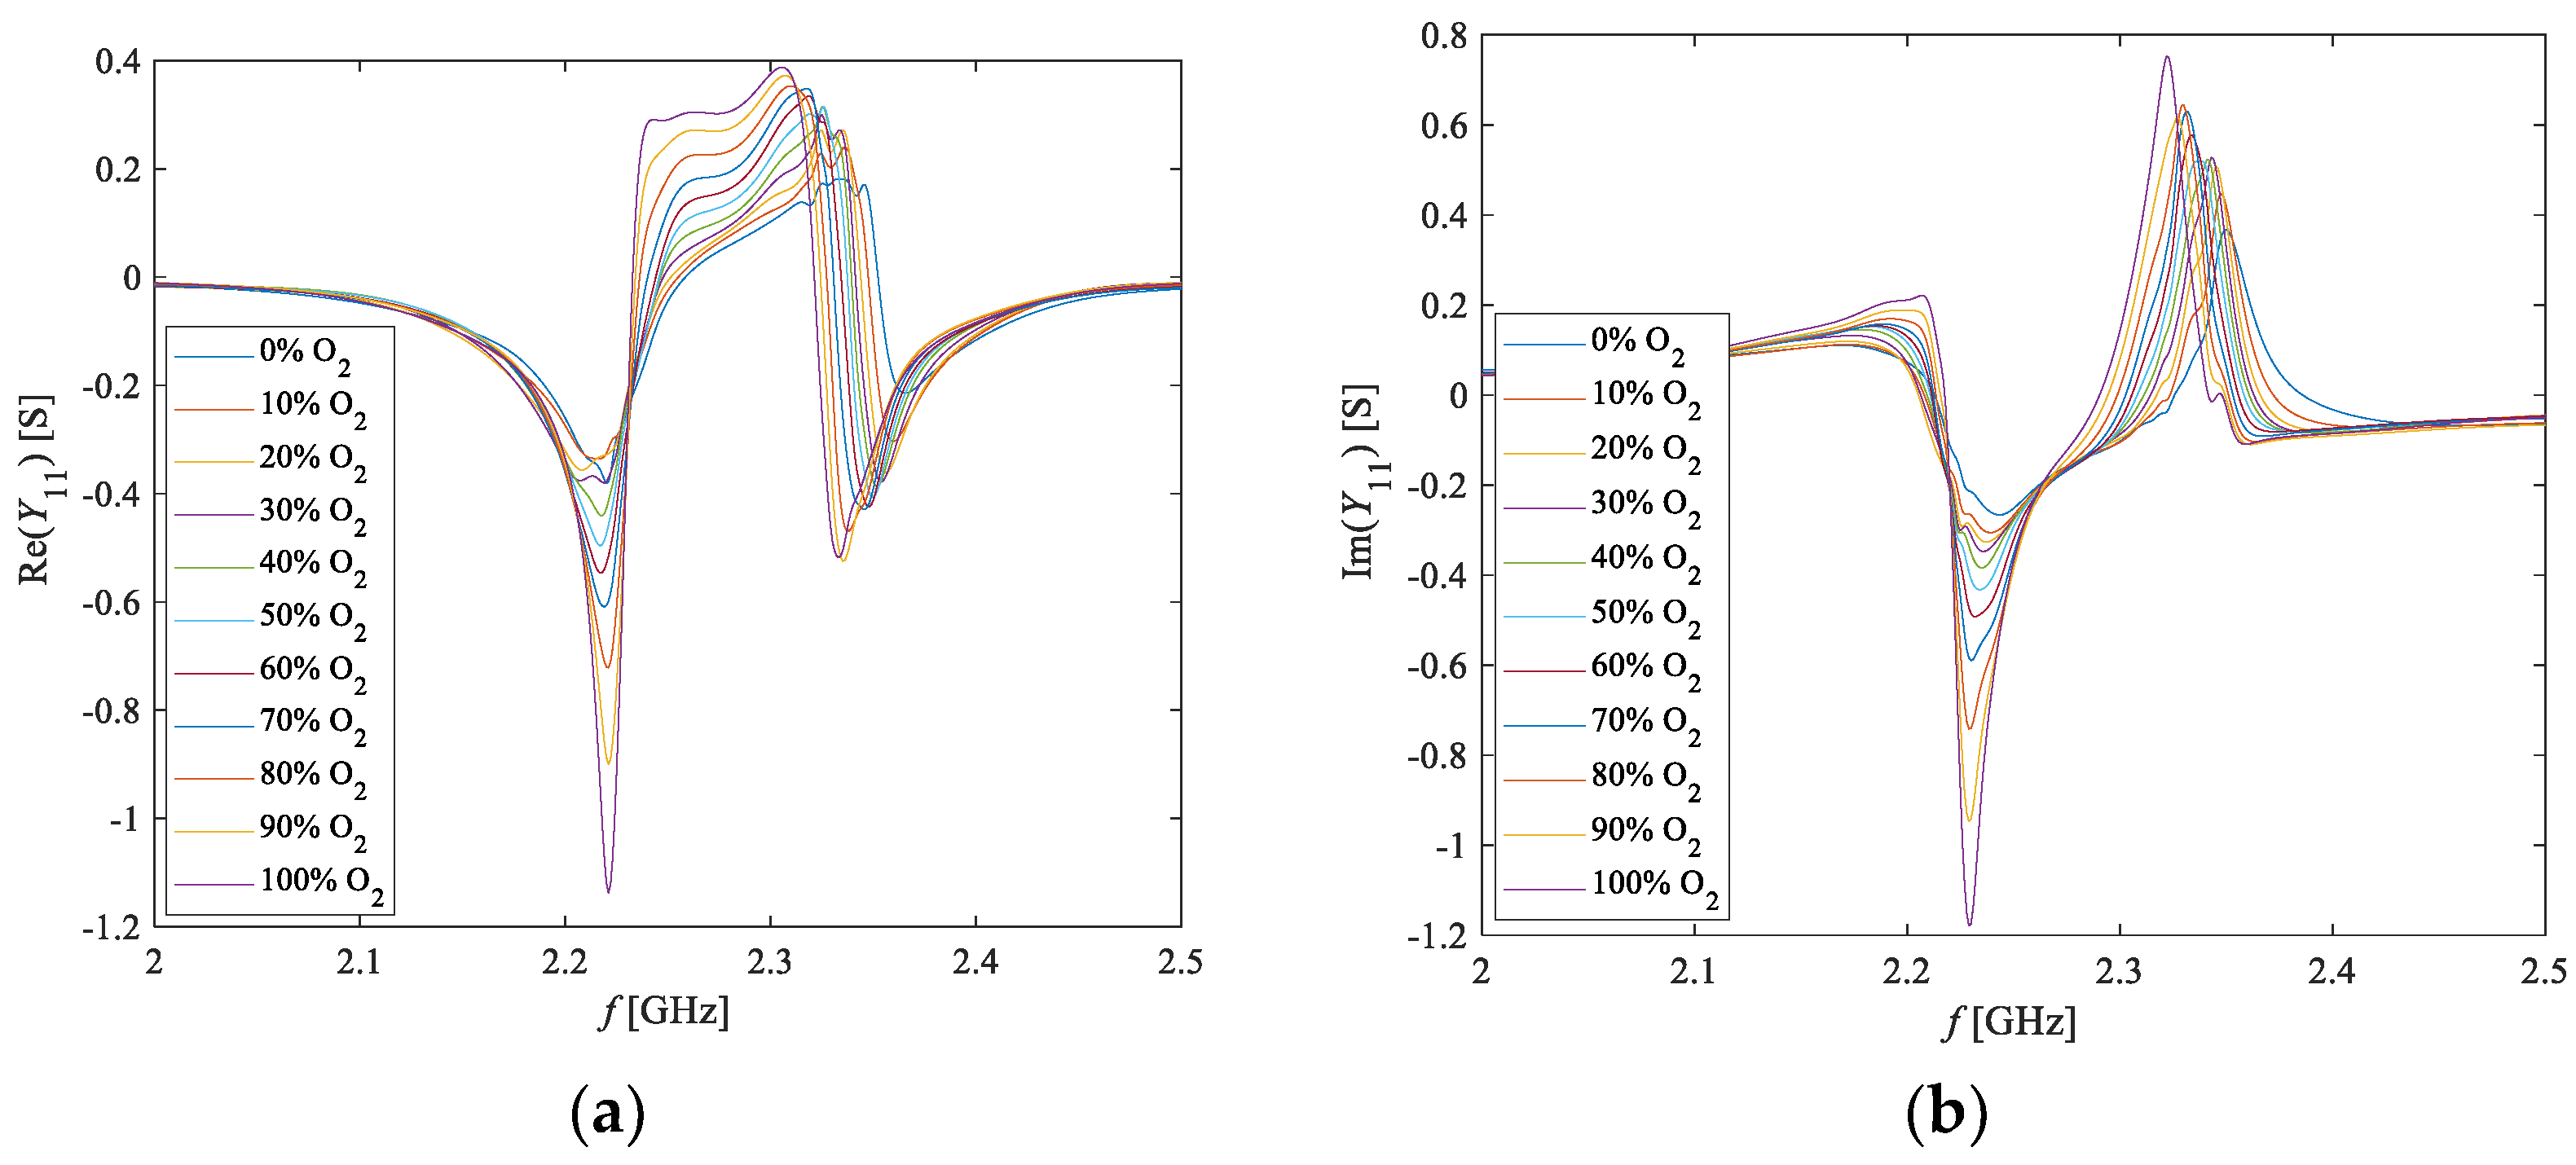
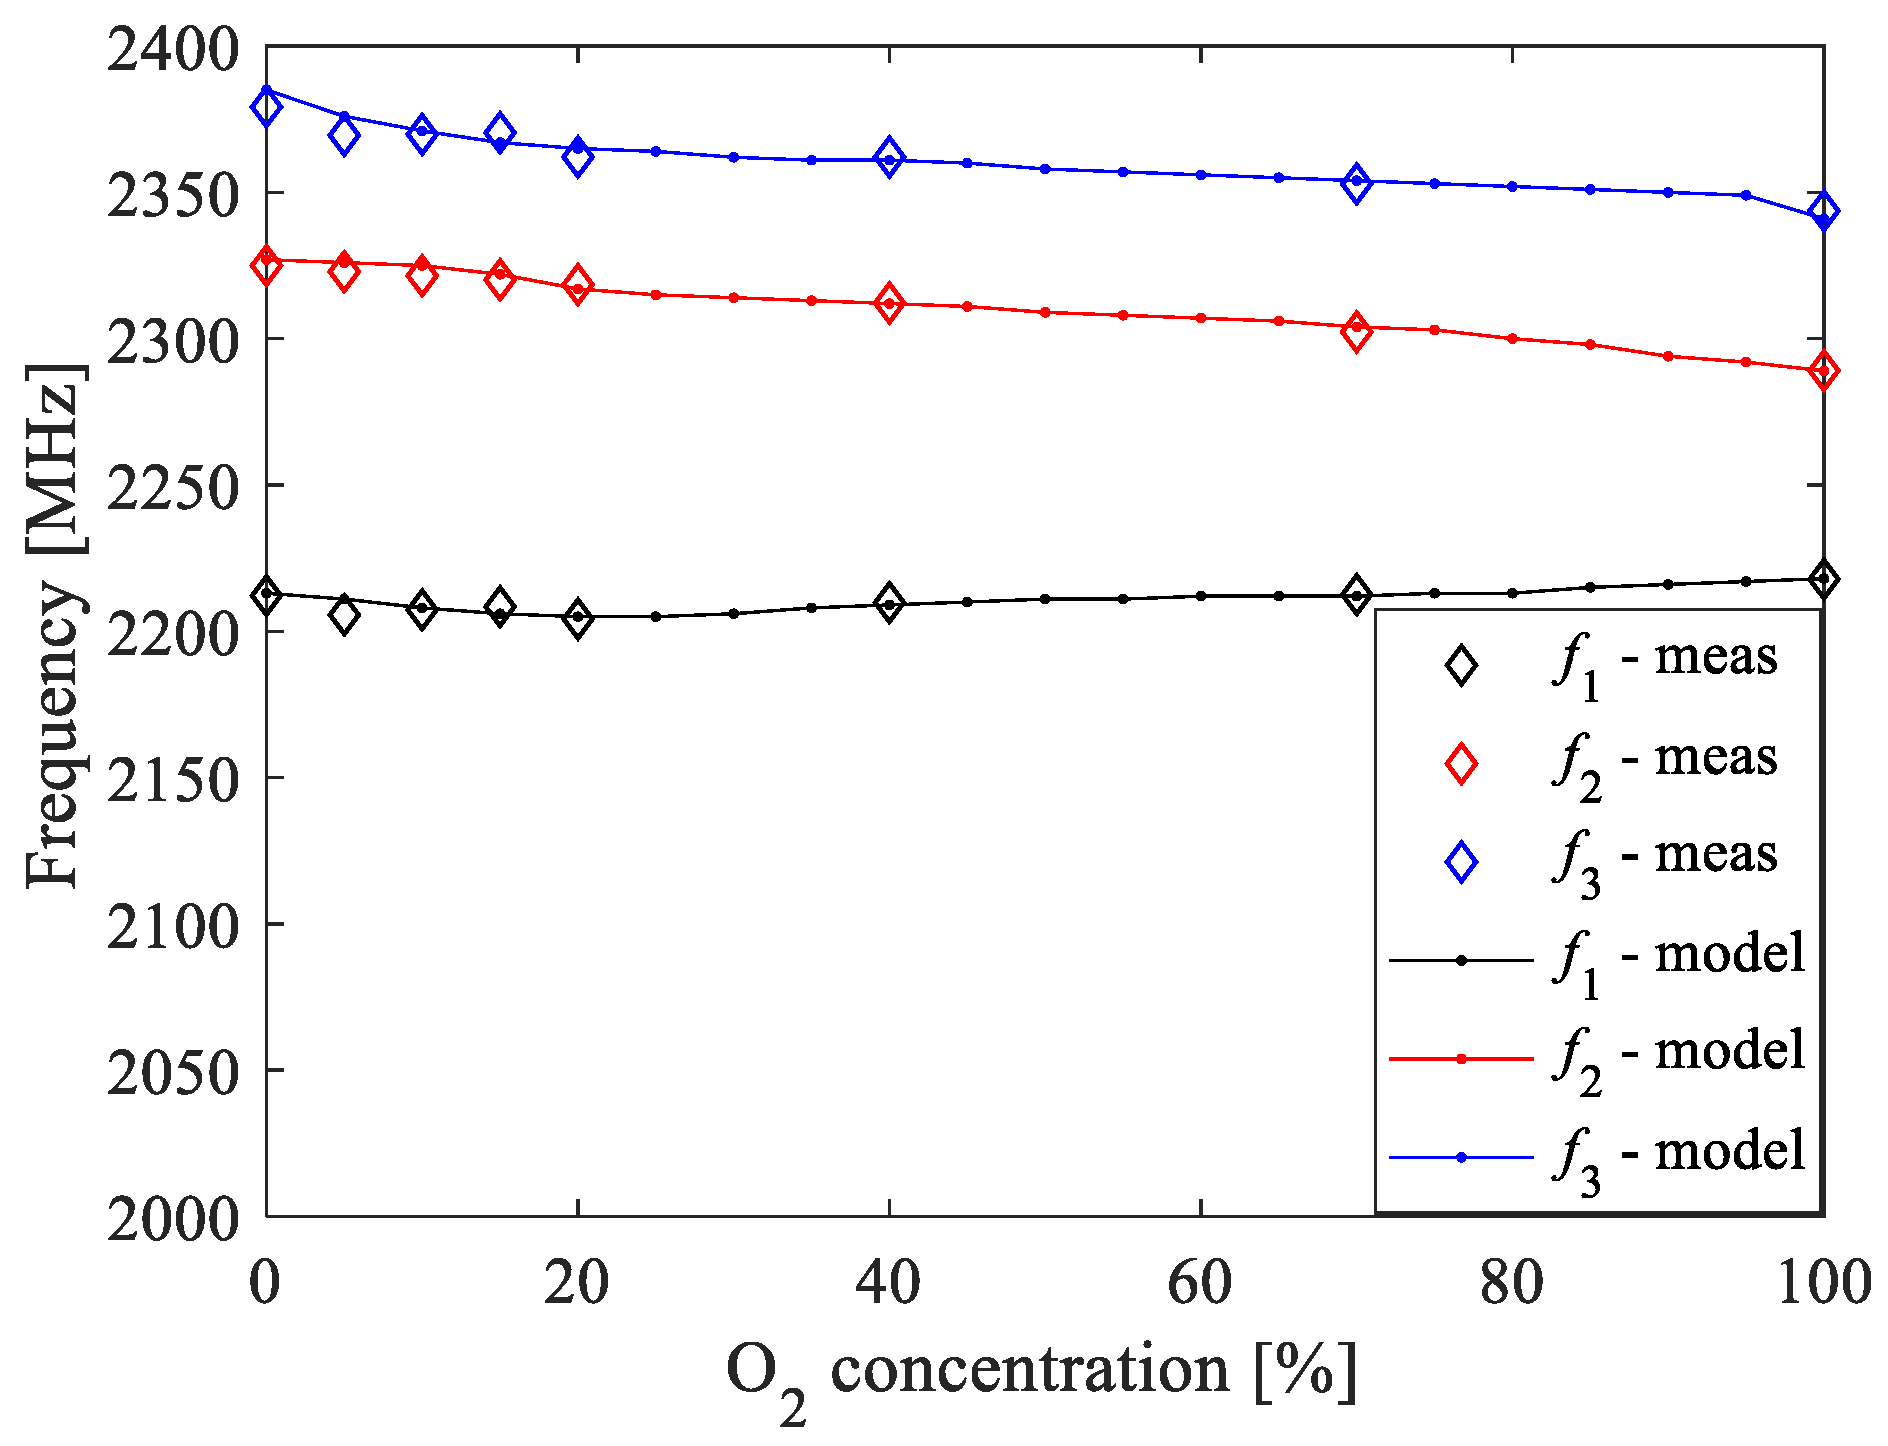
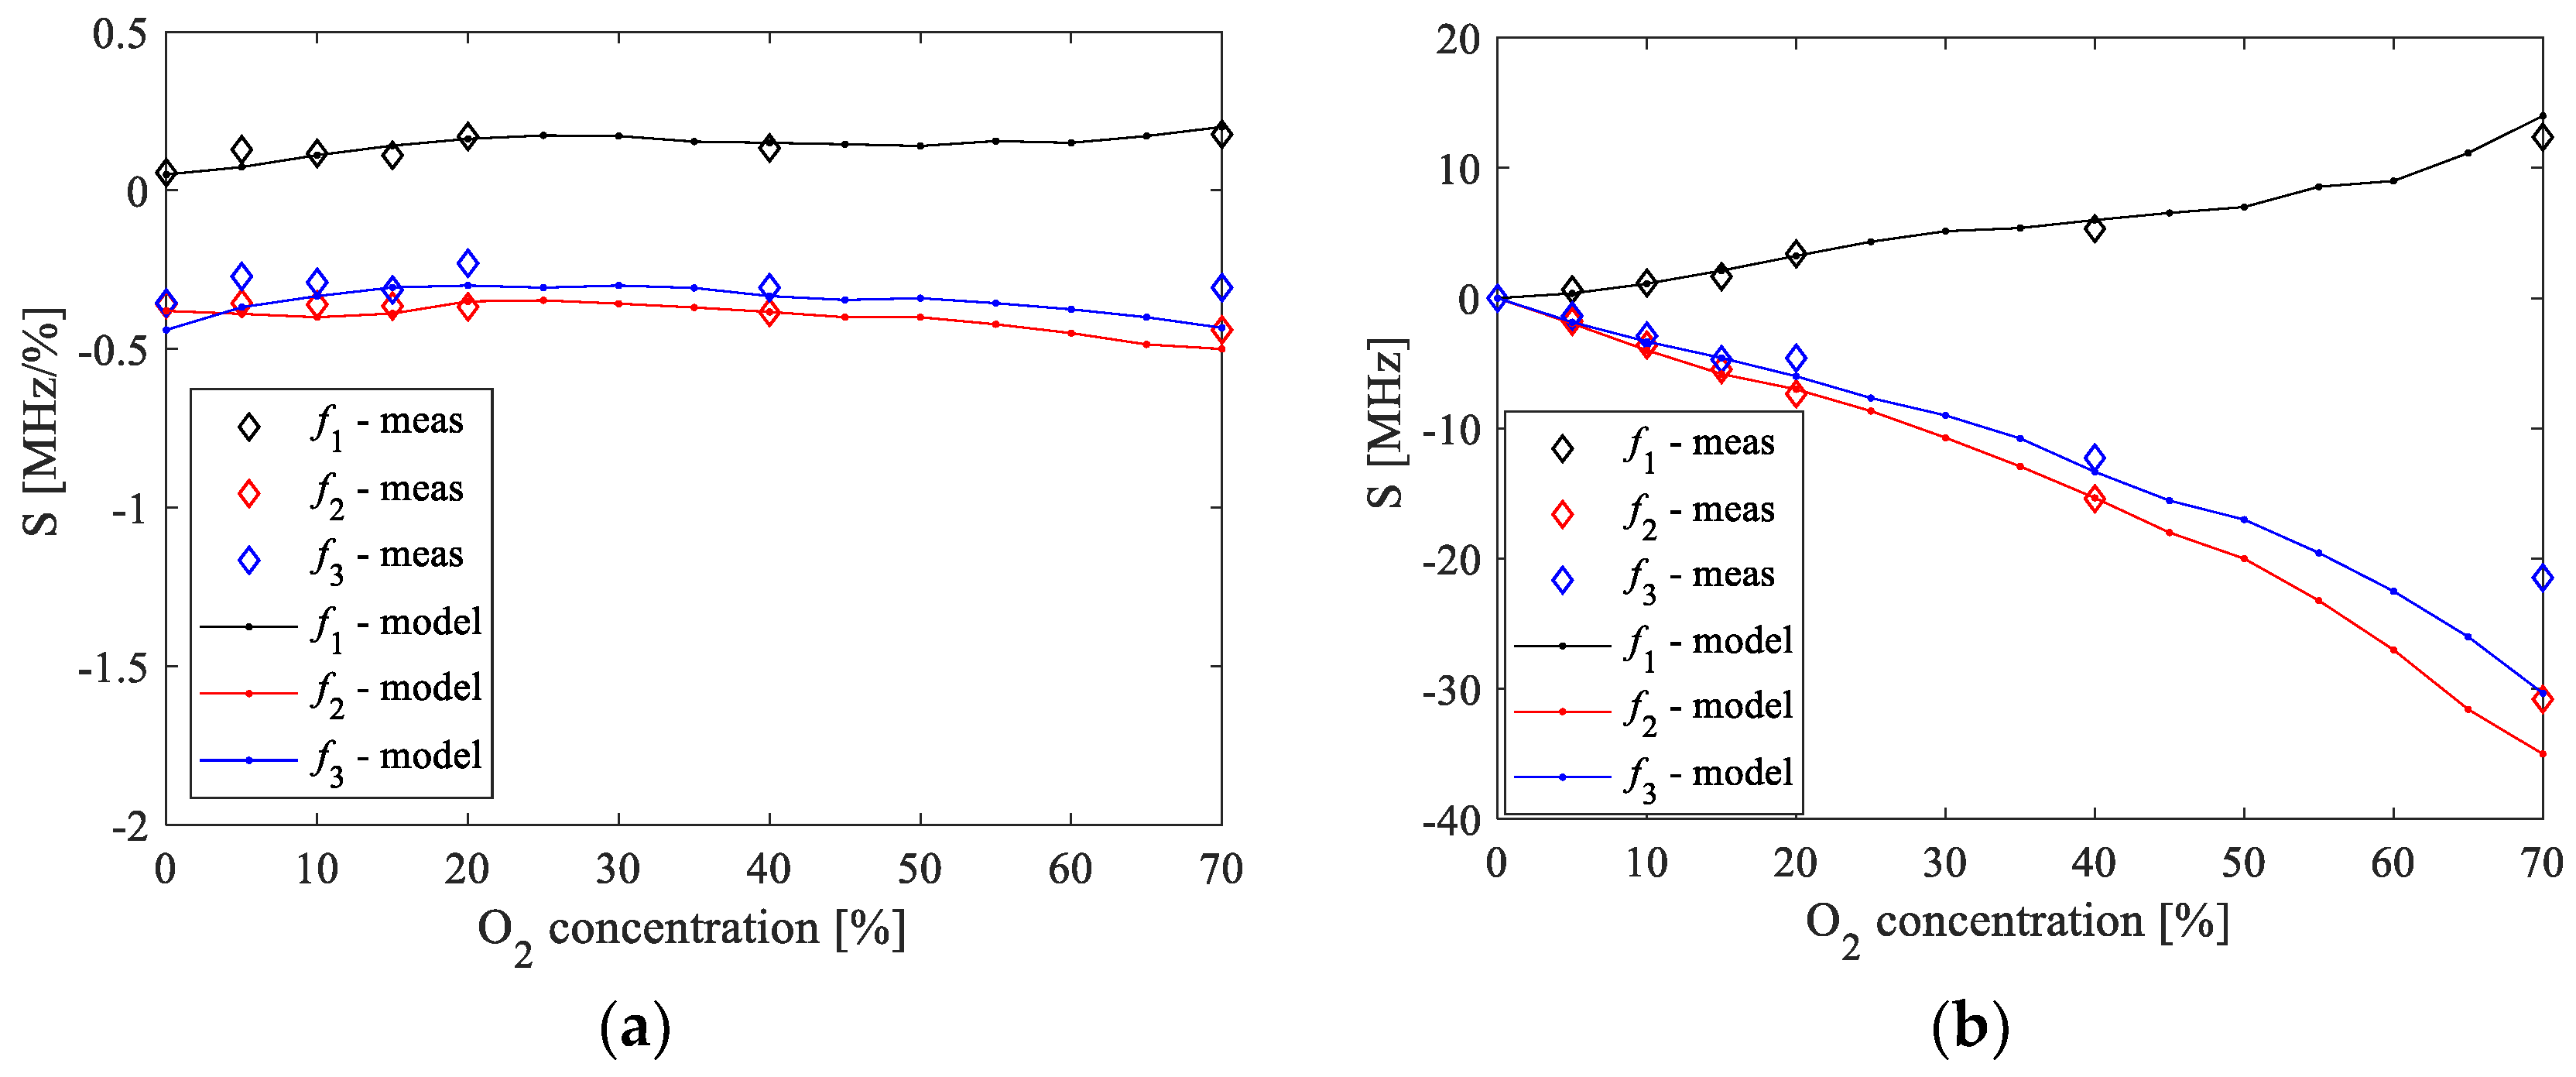
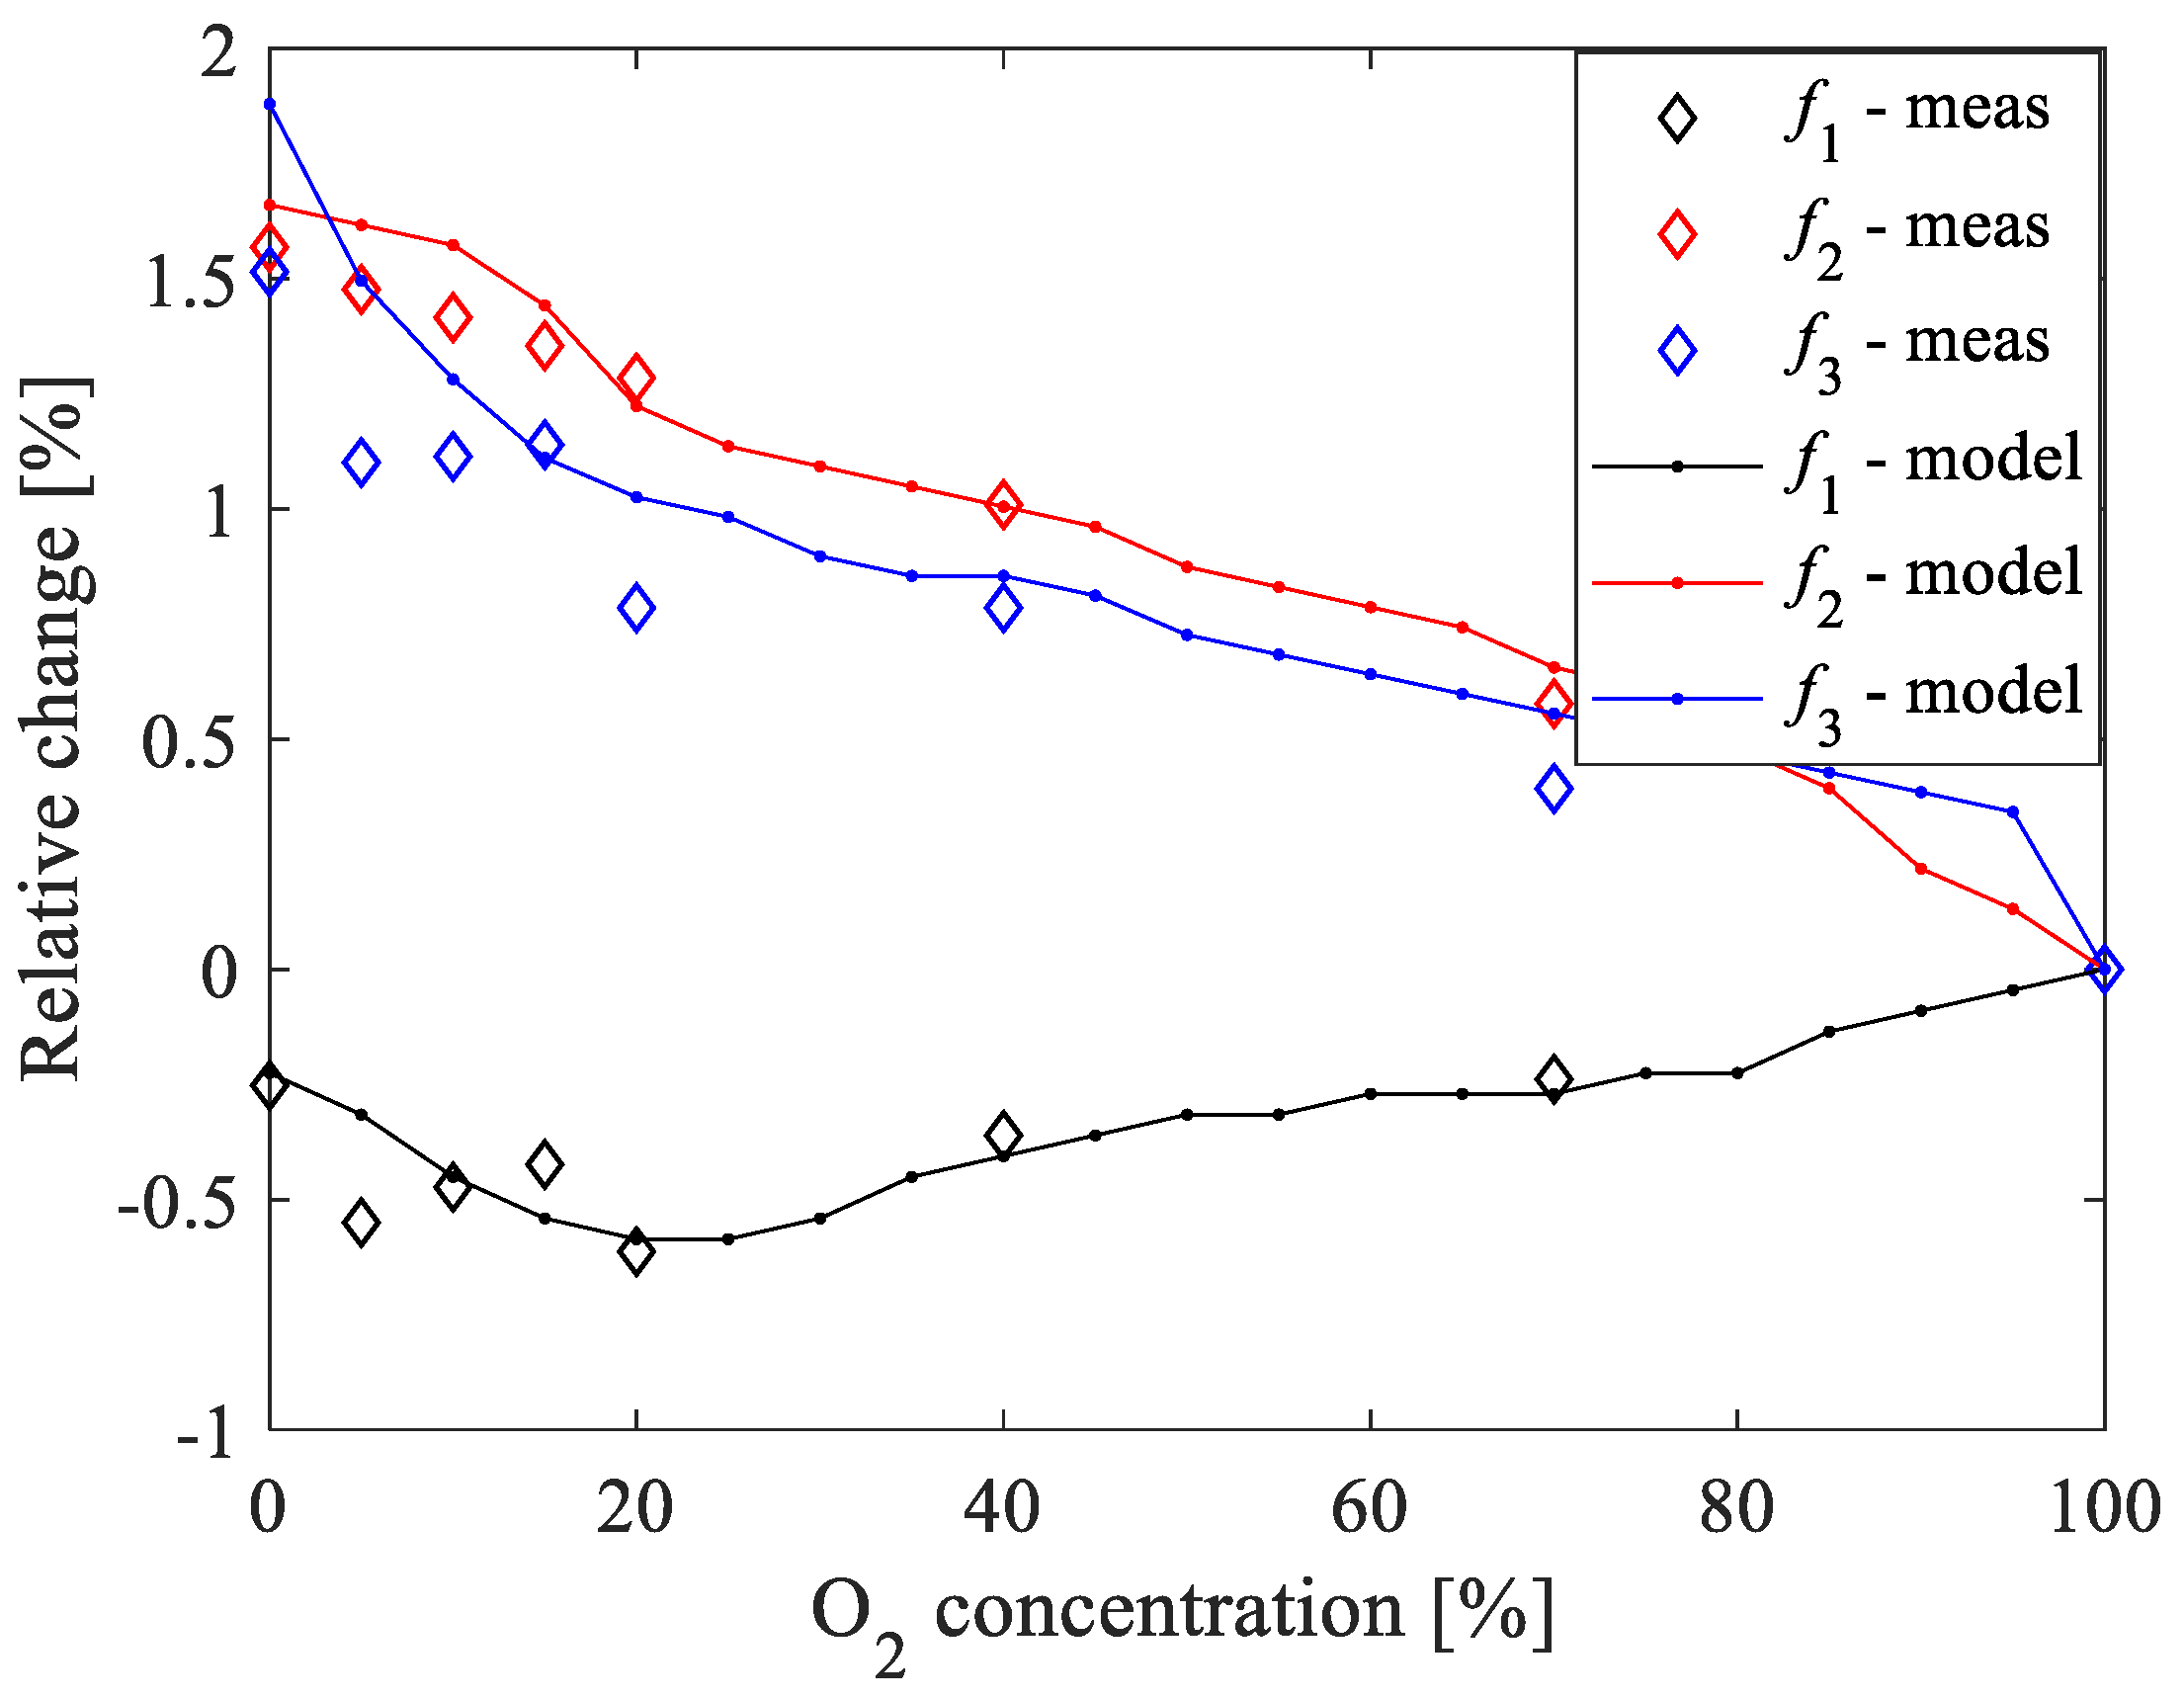
4. Results and Discussion

The developed ANN model can be used to accurately predict the frequency-dependent behavior of Y11 for any O2 concentration value in a range of 0% to 100%. To illustrate this, Figure 13 shows the real and imaginary parts of Y11 at O2 concentrations with a step of 10%. The plots confirm that changes in the O2 concentration are clearly transduced into variations of Y11. In particular, there is a shift of the peaks and dips in the spectrum and there is also a change in their amplitude. At certain frequencies, the imaginary part of Y11 becomes null and thus this parameter is purely real. At these frequencies, the device resonates, and it is possible to relate the change in the resonant frequency to a change in the O2 concentration. Namely, three resonance frequencies can be identified, let them be named f1 (around 2.21 GHz), f2 (around 2.33 GHz), and f3 (around 2.38 GHz).
Based on the analysis of the imaginary part of Y11 at different O2 concentrations, the resonant frequencies were read from the measurements and from the ANN model simulations, which were performed with a step of 5%. The obtained results are reported in Figure 14. It can be seen that the values obtained from the simulations agree very well with the values obtained from the measured Y11 for all considered concentrations. This demonstrates the accuracy of the developed ANN model and its generalization capability, enabling prediction of the resonant frequencies even at O2 concentrations different than the ones used during the experimental characterization.
To investigate the suitability of the resonant frequencies as sensing parameters of the O2 concentrations, the sensitivity and the relative change versus the O2 concentrations are investigated. Figure 15 illustrates the absolute-absolute sensitivity and absolute-relative sensitivity of the resonant frequencies to changes in the O2 concentration by using 100% of O2 concentration as the reference value. The absolute-absolute sensitivity is calculated as S = ( f r x f r 100 ) / ( % O 2 100 ) , whereas the relative-absolute sensitivity is calculated as S = % O 2 ( f r x f r 100 ) / ( % O 2 100 ) . f r x is the considered resonant frequency at a certain % O 2 and f r 100 is the corresponding resonant frequency at 100% of O2 concentration. For the sake of completeness, the relative change of the resonant frequencies, expressed as a percentage, is calculated as 100 ( f r x f r 100 ) / f r 100 and the achieved results are given in Figure 16. It should be highlighted that f1 exhibits positive values for both sensitivities, whereas f2 and f3 have negative sensitivities. Figure 15a shows that the absolute-absolute sensitivity is roughly insensitive to the concentration of O2 for all of the three resonant frequencies. On the other hand, Figure 15b shows that the absolute values of the relative-absolute sensitivity increase linearly with the concentration of O2 for all of the three resonant frequencies. Although the sensitivities of the three resonant frequencies show similar behavior, the highest absolute values are achieved when using f2 and f3. (see Figure 15a,b). Therefore, these two resonant frequencies allow achieving an enhanced sensitivity of the proposed sensor for oxygen sensing. As the discrepancies between measured and simulated data are slightly larger when using f3, it can be concluded that f2 is the resonant frequency to be chosen as the sensing parameter in the present case.

5. Conclusions

A gas sensor has been developed and experimentally characterized, focusing on oxygen sensing as a case study. An ANN modelling approach has been proposed and successfully validated, enabling a faithful reproduction of the measured sensor performance and prediction even at oxygen concentrations not considered during the characterization phase. The assessment of the sensor sensitivity to variations in the oxygen concentration has been accomplished by analyzing the resonant frequencies, which were modelled versus the oxygen concentration by using the developed ANN model. Finally, it should be underlined that the achieved experimental and modelling results can find many practical sensing applications in the healthcare and bioengineering fields.

Author Contributions

Investigation, Z.M., G.G. and M.L.; Methodology, Z.M., G.G. and M.L., Supervision, G.C. (Giuseppe Campobello), G.C. (Giovanni Crupi) and N.D.; writing—original draft, Z.M.; Writing—review and editing, G.C. (Giuseppe Campobello), G.C. (Giovanni Crupi) and N.D. All authors have read and agreed to the published version of the manuscript.

Funding

This research was partly funded by the Ministry of Education, Science and technological Development of the Republic of Serbia.

Conflicts of Interest

The authors declare no conflict of interest. The funders had no role in the design of the study; in the collection, analyses, or interpretation of data; in the writing of the manuscript, or in the decision to publish the results.

References

  1. Martínez Madrid, N.; Martínez Fernández, J.; Seepold, R.; Augusto Wrede, J.C.A. Sensors for ambient assisted living and smart homes. In Autonomous Sensor Networks; Filippini, D., Ed.; Springer: Berlin/Heidelberg, Germany, 2012; pp. 39–71. [Google Scholar] [CrossRef]
  2. Jao, Y.-T.; Yang, P.-K.; Chiu, C.-M.; Lin, Y.-J.; Chen, S.-W.; Choi, D.; Lin, Z.-H. A textile-based triboelectric nanogenerator with humidity-resistant output characteristic and its applications in self-powered healthcare sensors. Nano Energy 2018, 50, 513–520. [Google Scholar] [CrossRef]
  3. Alfian, G.; Syafrudin, M.; Ijaz, M.F.; Syaekhoni, M.A.; Fitriyani, N.L.; Rhee, J. A personalized healthcare monitoring system for diabetic patients by utilizing BLE-based sensors and real-time data processing. Sensors 2018, 18, 2183. [Google Scholar] [CrossRef] [PubMed] [Green Version]
  4. Yao, S.; Swetha, P.; Zhu, Y. Nanomaterial-enabled wearable sensors for healthcare. Adv. Healthc. Mater. 2018, 7, 1700889. [Google Scholar] [CrossRef] [PubMed]
  5. Kumar, S.; Bukkitgar, S.D.; Singh, S.; Pratibha; Singh, V.; Reddy, K.R.; Shetti, N.P.; Reddy, C.V.; Sadhu, V.; Naveen, S. Electrochemical sensors and biosensors based on graphene functionalized with metal oxide nanostructures for healthcare applications. Chem. Sel. 2019, 14, 5322–5337. [Google Scholar] [CrossRef]
  6. Hu, W.; Wan, L.; Jian, Y.; Ren, C.; Jin, K.; Su, X.; Bai, X.; Haick, H.; Yao, M.; Wu, W. Electronic noses: From advanced materials to sensors aided with data processing. Adv. Mater. Technol. 2019, 4, 1800488. [Google Scholar] [CrossRef] [Green Version]
  7. Hatamie, A.; Angizi, S.; Kumar, S.; Mouli Pandey, C.; Simchi, A.; Willander, M.; Malhotra, B.D. Review—Textile based chemical and physical sensors for healthcare monitoring. J. Electrochem. Soc. 2020, 167, 037546. [Google Scholar] [CrossRef]
  8. Jalal, A.H.; Alam, F.; Roychoudhury, S.; Umasankar, Y.; Pala, N.; Bhansali, S. Prospects and challenges of volatile organic compound sensors in human healthcare. ACS Sens. 2018, 3, 1246–1263. [Google Scholar] [CrossRef]
  9. Xu, W.; Ravichandran, D.; Jambhulkar, S.; Franklin, R.; Zhu, Y.; Song, K. Bioinspired, mechanically robust chemiresistor for inline volatile organic compounds sensing. Adv. Mater. Technol. 2020, 5, 2000440. [Google Scholar] [CrossRef]
  10. Yoon, I.; Eom, G.; Lee, S.; Kyeong Kim, B.; Kyung Kim, S.; Lee, H.J. A capacitive micromachined ultrasonic transducer-based resonant sensor array for portable volatile organic compound detection with wireless systems. Sensors 2019, 19, 1401. [Google Scholar] [CrossRef] [Green Version]
  11. Gasparri, R.; Sedda, G.; Spaggiari, L. The Electronic nose’s emerging role in respiratory medicine. Sensors 2018, 18, 3029. [Google Scholar] [CrossRef] [Green Version]
  12. Gaggiotti, S.; Della Pelle, F.; Mascini, M.; Cichelli, A.; Compagnone, D. Peptides DNA and MIPs in gas sensing. from the realization of the sensors to sample analysis. Sensors 2020, 20, 4433. [Google Scholar] [CrossRef] [PubMed]
  13. Hurot, C.; Scaramozzino, N.; Buhot, A.; Hou, Y. Bio-inspired strategies for improving the selectivity and sensitivity of artificial noses: A review. Sensors 2020, 20, 1803. [Google Scholar] [CrossRef] [Green Version]
  14. Kaushik, A.; Kumar, R.; Jayant, R.; Nair, M. Nanostructured gas sensors for health care: An overview. J Pers. Nanomed. 2015, 1, 10–23. [Google Scholar] [PubMed]
  15. Lu, K.; Aung, T.; Guo, N.; Weichselbaum, R.R.; Lin, W. Nanoscale metal–organic frameworks for therapeutic, imaging, and sensing applications. Adv. Mater. 2018, 30, 1707634. [Google Scholar] [CrossRef] [PubMed]
  16. Petani, L.; Koker, L.; Herrmann, J.; Hagenmeyer, V.; Gengenbach, U.; Pylatiuk, C. Recent developments in ozone sensor technology for medical applications. Micromachines 2020, 11, 624. [Google Scholar] [CrossRef]
  17. Bogner, A.; Steiner, C.; Walter, S.; Kita, J.; Hagen, G.; Moos, R. Planar microstrip ring resonators for microwave-based gas sensing: Design aspects and initial transducers for humidity and ammonia sensing. Sensors 2017, 17, 2422. [Google Scholar] [CrossRef]
  18. Comini, E.; Faglia, G.; Sberveglieri, G. (Eds.) Solid State Gas Sensing; Springer: Boston, MA, USA, 2009. [Google Scholar]
  19. Barochi, G.; Rossignol, J.; Bouvet, M. Development of microwave gas sensors. Sens. Actuators B Chem. 2011, 157, 374–379. [Google Scholar] [CrossRef]
  20. Rossignol, J.; Barochi, G.; de Fonseca, B.; Brunet, J.; Bouvet, M.; Pauly, A.; Markey, L. Microwave-based gas sensor with phthalocyanine film at room temperature. Sens. Actuators B Chem. 2013, 189, 213–216. [Google Scholar] [CrossRef]
  21. Rydosz, A.; Maciak, E.; Wincza, K.; Gruszczynski, S. Microwave-based sensors with phthalocyanine films for acetone, ethanol and methanol detection. Sens. Actuators B Chem. 2016, 237, 876–886. [Google Scholar] [CrossRef]
  22. Kim, B.-H.; Lee, Y.-J.; Lee, H.-J.; Hong, Y.; Yook, J.-G.; Chung, M.H.; Cho, W.; Choi, H.H. A gas sensor using double split-ring resonator coated with conducting polymer at microwave frequencies. In Proceedings of the SENSORS, 2014 IEEE, Valencia, Spain, 2–5 November 2014; pp. 1815–1818. [Google Scholar] [CrossRef]
  23. Gugliandolo, G.; Aloisio, D.; Leonardi, S.G.; Campobello, G.; Donato, N. Resonant devices and gas sensing: From low frequencies to microwave range. In Proceedings of the 2019 14th International Conference on Advanced Technologies, Systems and Services in Telecommunications (TELSIKS), Nis, Serbia, 23–25 October 2019; pp. 21–28. [Google Scholar] [CrossRef]
  24. Wu, B.; Zhang, X.; Huang, B.; Zhao, Y.; Cheng, C.; Chen, H. High-performance wireless ammonia gas sensors based on reduced graphene oxide and nano-silver ink hybrid material loaded on a patch antenna. Sensors 2017, 17, 2070. [Google Scholar] [CrossRef]
  25. Lee, H.; Shaker, G.; Naishadham, K.; Song, X.; McKinley, M.; Wagner, B.; Tentzeris, M. Carbon-nanotube loaded antenna-based ammonia gas sensor. IEEE Trans. Microw. Theory Tech. 2011, 59, 2665–2673. [Google Scholar] [CrossRef] [Green Version]
  26. Gugliandolo, G.; Naishadham, K.; Donato, N.; Neri, G.; Fernicola, V. Sensor-integrated aperture coupled patch antenna. In Proceedings of the 2019 IEEE International Symposium on Measurements & Networking (M&N), Catania, Italy, 8–10 July 2019; pp. 1–5. [Google Scholar] [CrossRef]
  27. Chopra, S.; Natarajan, S.; Rao, A.M. Gas sensing using carbon nanotube-based resonator. In Proceedings of the SENSORS, 2004 IEEE, Vienna, Austria, 24–27 October 2004; pp. 399–402. [Google Scholar] [CrossRef]
  28. Aloisio, D.; Donato, N. Development of gas sensors on microstrip disk resonators. Procedia Eng. 2014, 87, 1083–1086. [Google Scholar] [CrossRef]
  29. Bailly, G.; Harrabi, A.; Rossignol, J.; Michel, M.; Stuerga, D.; Pribetich, P. Microstrip spiral resonator for microwave-based gas sensing. IEEE Sens. Lett. 2017, 1, 1–4. [Google Scholar] [CrossRef]
  30. Bailly, G.; Harrabi, A.; Rossignol, J.; Domenichini, B.; Bellat, J.P.; Bezverkhyy, I.; Pribetich, P.; Stuerga, D. Influence of the design in microwave-based gas sensors: Ammonia detection with titania nanoparticles. Procedia Eng. 2016, 168, 264–267. [Google Scholar] [CrossRef]
  31. Gugliandolo, G.; Mirzaei, A.; Bonyani, M.; Neri, G.; Latino, M.; Donato, N. Electrical characterization of microstrip resonators based on nanostructured sensing materials. In Sensors and Microsystems; Springer: Cham, Switzerland, 2018; Volume 457, pp. 29–34. [Google Scholar] [CrossRef]
  32. Walter, S.; Bogner, A.; Hagen, G.; Moos, R. Novel radio-frequency-based gas sensor with integrated heater. J. Sens. Sens. Syst. 2019, 8, 49–56. [Google Scholar] [CrossRef]
  33. Bailly, G.; Harrabi, A.; Rossignol, J.; Stuerga, D.; Pribetich, P. Microwave gas sensing with a microstrip interDigital capacitor: Detection of NH3 with TiO2 nanoparticles. Sens. Actuators B Chem. 2016, 236, 554–564. [Google Scholar] [CrossRef]
  34. Wang, H.; Yao, Y.; Wu, G.; Sun, Q.; Wang, M.; Chen, X.; Wang, J. A room temperature oxygen gas sensor based on hierarchical TiO2. In Proceedings of the 2016 IEEE International Conference on Manipulation, Manufacturing and Measurement on the Nanoscale (3M-NANO), Chongqing, China, 18–22 July 2016; pp. 199–202. [Google Scholar] [CrossRef]
  35. Sorocki, J.; Rydosz, A.; Staszek, K. Wideband microwave multiport-based system for low gas concentration sensing and its application for acetone detection. Sens. Actuators B Chem. 2020, 323, 128710. [Google Scholar] [CrossRef]
  36. Li, F.; Zheng, Y.; Hua, C.; Jian, J. Gas sensing by microwave transduction: Review of progress and challenges. Front. Mater. 2019, 6. [Google Scholar] [CrossRef]
  37. Gugliandolo, G.; Latino, M.; Campobello, G.; Marinkovic, Z.; Crupi, G.; Donato, N. On the gas sensing properties of microwave transducers. In Proceedings of the IEEE International Scientific Conference on Information, Communication and Energy Systems and Technologies (ICEST), Niš, Serbia, 10–12 September 2020; pp. 191–194. [Google Scholar] [CrossRef]
  38. Marinkovic, Z.; Gugliandolo, G.; Latino, M.; Campobello, G.; Crupi, G.; Donato, N. Artificial neural network modeling of interdigital capacitor sensor for oxygen detection. In Proceedings of the IEEE International Scientific Conference on Information, Communication and Energy Systems and Technologies (ICEST), Niš, Serbia, 10–12 September 2020; pp. 195–198. [Google Scholar] [CrossRef]
  39. Campobello, G.; Cannatà, G.; Donato, N.; Famulari, A.; Serrano, S. A novel low-complex and low-memory method for accurate single-tone frequency estimation. In Proceedings of the 4th International Symposium on Communications, Control and Signal Processing, ISCCSP 2010, Limassol, Cyprus, 3–5 March 2010. [Google Scholar] [CrossRef]
  40. Campobello, G.; Cannatà, G.; Donato, N.; Galeano, M.; Serrano, S. An accurate and simple frequency estimation method for sensor applications. In Sensors and Microsystems. Lecture Notes in Electrical Engineering; D’Amico, A., Di Natale, C., Mosiello, L., Zappa, G., Eds.; Springer: Boston, MA, USA, 2012; Volume 109. [Google Scholar]
  41. Campobello, G.; Segreto, A.; Donato, N. A new frequency estimation algorithm for IoT applications and low-cost instrumentation. In Proceedings of the 2020 IEEE International Instrumentation and Measurement Technology Conference (I2MTC), Dubrovnik, Croatia, 25–28 May 2020; pp. 1–5. [Google Scholar] [CrossRef]
  42. Campobello, G.; Castano, M.; Fucile, A.; Segreto, A. WEVA: A complete solution for industrial Internet of Things. In Ad-hoc, Mobile, and Wireless Networks. ADHOC-NOW 2017. Lecture Notes in Computer Science; Puliafito, A., Bruneo, D., Distefano, S., Longo, F., Eds.; Springer: Cham, Switzerland, 2017; p. 10517. [Google Scholar] [CrossRef]
  43. Torun, H.; Cagri Top, F.; Dundar, G.; Yalcinkaya, A.D. An antenna-coupled split-ring resonator for biosensing. J. Appl. Phys. 2014, 116, 124701. [Google Scholar] [CrossRef]
  44. Grenier, K.; Dubuc, D.; Poleni, P.-E.; Kumemura, M.; Toshiyoshi, H.; Fujii, T.; Fujita, H. Integrated broadband microwave and microfluidic sensor dedicated to bioengineering. IEEE Trans. Microw. Theory Tech. 2009, 57, 3246–3253. [Google Scholar] [CrossRef]
  45. Bao, X.; Ocket, I.; Crupi, G.; Schreurs, D.M.M.-P.; Bao, J.; Kil, D.; Puers, B.; Nauwelaers, B. A planar one-port microwave microfluidic sensor for microliter liquids characterization. IEEE J. Electromagn. RF Microw. Med. Biol. 2018, 2, 10–17. [Google Scholar] [CrossRef]
  46. Crupi, G.; Bao, X.; Babarinde, O.J.; Schreurs, D.M.M.-P.; Nauwelaers, B. Biosensor using a one-port interdigital capacitor: A resonance-based investigation of the permittivity sensitivity for microfluidic broadband bioelectronics applications. Electronics 2020, 9, 340. [Google Scholar] [CrossRef] [Green Version]
  47. Bao, J.; Maenhout, G.; Markovic, T.; Ocket, I.; Nauwelaers, B. A microwave platform for reliable and instant interconnecting combined with microwave-microfluidic interdigital capacitor chips for sensing applications. Sensors 2020, 20, 1687. [Google Scholar] [CrossRef] [PubMed] [Green Version]
  48. Bao, X.; Crupi, G.; Ocket, I.; Bao, J.; Ceyssens, F.; Kraft, M.; Nauwelaers, B.; Schreurs, D.M.M.-P. Numerical modeling of two microwave sensors for biomedical applications. Int. J. Numer. Model. Electron. Netw. Devices Fields 2020, e2810. [Google Scholar] [CrossRef]
  49. Borecki, M.; Gęca, M.; Duk, M.; Korwin-Pawlowski, M.L. Miniature gas sensors heads and gas sensing devices for environmental working conditions—A review. J. Electron. Commun. Eng. Res. 2017, 1, 1–11. [Google Scholar]
  50. Ramamoorthy, R.; Dutta, P.K.; Akbar, S.A. Oxygen sensors: Materials, methods, designs and applications. J. Mat. Sci. 2003, 38, 4271–4282. [Google Scholar] [CrossRef]
  51. Schwank, J.; DiBattista, M. Oxygen sensors: Materials and applications. MRS Bull. 1999, 24, 44–48. [Google Scholar] [CrossRef]
  52. Trocino, S.; Donato, A.; Latino, M.; Donato, N.; Leonardi, S.G.; Neri, G. Pt-TiO2/MWCNTs hybrid composites for monitoring low hydrogen concentrations in air. Sensors 2012, 12, 12361–12373. [Google Scholar] [CrossRef]
  53. Marichy, C.; Donato, N.; Latino, M.; Willinger, M.G.; Tessonnier, J.-P.; Neri, G.; Pinna, N. Gas sensing properties and p-type response of ALD TiO2 coated carbon nanotubes. Nanotechnology 2014, 26, 024004. [Google Scholar] [CrossRef] [Green Version]
  54. Tobaldi, D.M.; Leonardi, S.G.; Pullar, R.C.; Seabra, M.P.; Neri, G.; Labrincha, J.A. Sensing properties and photochromism of Ag–TiO2 nano-heterostructures. J. Mater. Chem. A 2016, 4, 9600–9613. [Google Scholar] [CrossRef]
  55. Cortright, E.M. Apollo Expeditions to the Moon; Government Printing Office: Washington, DC, USA, 1975.
  56. Zhang, Q.J.; Gupta, K.C. Neural Networks for RF and Microwave Design; Artech House: Boston, MA, USA, 2000. [Google Scholar]
  57. Koziel, S.; Bandler, J.W. Modeling of microwave devices with space mapping and radial basis functions. Int. J. Numer. Model. Electron. Netw. Devices Fields 2007, 21, 187–203. [Google Scholar] [CrossRef]
  58. Kabir, H.; Zhang, L.; Yu, M.; Aaen, P.H.; Wood, J.; Zhang, Q.-J. Smart modeling of microwave devices. IEEE Microw. Mag. 2010, 11, 105–118. [Google Scholar] [CrossRef] [Green Version]
  59. Schreurs, D.; O’Droma, M.; Goacher, A.A.; Gadringer, M. RF Power Amplifier Behavioral Modeling; Cambridge University: New York, NY, USA, 2008. [Google Scholar]
  60. Marinković, Z.; Crupi, G.; Schreurs, D.; Caddemi, A.; Marković, V. Microwave. FinFET modeling based on artificial neural networks including lossy silicon substrate. Microelectron. Eng. 2011, 88, 3158–3163. [Google Scholar] [CrossRef]
  61. Marinković, Z.; Crupi, G.; Schreurs, D.; Caddemi, A.; Marković, V. Microwave neural modeling for silicon FinFET varactor. Int. J. Numer. Model. Electron. Netw. Devices Fields 2014, 27, 834–845. [Google Scholar] [CrossRef]
  62. Marinković, Z.; Crupi, G.; Caddemi, A.; Avolio, G.; Raffo, A.; Marković, V.; Vannini, G.; Schreurs, D. Neural approach for temperature dependent modeling of GaN HEMTs. Int. J. Numer. Model. Electron. Netw. Devices Fields 2015, 28, 359–370. [Google Scholar] [CrossRef]
  63. Ćirić, T.; Dhuri, R.; Marinković, Z.; Pronić-Rančić, O.; Marković, V.; Vietzorreck, L. Neural based lumped element model of capacitive RF MEMS switches. Frequenz 2018, 72, 539–546. [Google Scholar] [CrossRef]
  64. Marinković, Z.; Crupi, G.; Caddemi, A.; Marković, V.; Schreurs, D. A review on the artificial neural network applications for small-signal modeling of microwave FETs. Int. J. Numer. Model. Electron. Netw. Devices Fields 2020, 33, e2668. [Google Scholar] [CrossRef]
  65. Jin, J.; Feng, F.; Na, W.C.; Yan, S.X.; Liu, W.Y.; Zhu, L.; Zhang, Q.J. Recent advances in neural network-based inverse modeling techniques for microwave applications. Int. J. Numer. Model. Electron. Netw. Devices Fields 2020, 33, e2732. [Google Scholar] [CrossRef]
  66. Liu, W.; Zhu, L.; Feng, F.; Zhang, W.; Zhang, Q.-J.; Lin, Q.; Liu, G. A time delay neural network based technique for nonlinear microwave device modeling. Micromachines 2020, 11, 831. [Google Scholar] [CrossRef]
  67. Lamamra, K.; Rechem, D. Artificial neural network modelling of a gas sensor for liquefied petroleum gas detection. In Proceedings of the 2016 8th International Conference on Modelling, Identification and Control (ICMIC), Algiers, Algeria, 15–17 November 2016; pp. 163–168. [Google Scholar] [CrossRef]
  68. Zhao, L.; Li, X.; Wang, J.; Yao, P.; Akbar, S.A. Detection of formaldehyde in mixed VOCs gases using sensor array with neural networks. IEEE Sens. J. 2016, 16, 6081–6086. [Google Scholar] [CrossRef]
  69. Abdolrazzaghi, M.; Hossein Zarifi, M.; Pedrycz, W.; Daneshmand, M. Robust ultra-high resolution microwave planar sensor using fuzzy neural network approach. IEEE Sens. J. 2017, 17, 323–332. [Google Scholar] [CrossRef]
  70. Peng, P.; Zhao, X.; Pan, X.; Ye, W. Gas classification using deep convolutional neural networks. Sensors 2018, 18, 157. [Google Scholar] [CrossRef] [PubMed] [Green Version]
  71. Szulczyński, B.; Armiński, K.; Namieśnik, J.; Gębicki, J. Determination of odour interactions in gaseous mixtures using electronic nose methods with artificial neural networks. Sensors 2018, 18, 519. [Google Scholar] [CrossRef] [PubMed] [Green Version]
  72. Mason, A.; Korostynska, O.; Louis, J.; Cordova-Lopez, L.E.; Abdullah, B.; Greene, J.; Connell, R.; Hopkins, J. Noninvasive in-situ measurement of blood lactate using microwave sensors. IEEE Trans. Biomed. Eng. 2018, 65, 698–705. [Google Scholar] [CrossRef] [PubMed] [Green Version]
  73. Essiet, I.; Sun, Y.; Wang, Z. Big data analysis for gas sensor using convolutional neural network and ensemble of evolutionary algorithms. Procedia Manuf. 2019, 35, 629–634. [Google Scholar] [CrossRef]
  74. Gordon Casey, J.; Collier-Oxandale, A.; Hannigan, M. Performance of artificial neural networks and linear models to quantify 4 trace gas species in an oil and gas production region with low-cost sensors. Sens. Actuators B Chem. 2019, 283, 504–514. [Google Scholar] [CrossRef]
  75. Xibilia, M.G.; Latino, M.; Marinković, Z.; Atanasković, A.; Donato, N. Soft sensors based on deep neural networks for applications in security and safety. IEEE Trans. Instrum. Meas. 2020, 69, 7869–7876. [Google Scholar] [CrossRef]
  76. Pozar, D.M. Microwave Engineering; John Wiley and Sons: New York, NY, USA, 1998; p. 211. [Google Scholar]
  77. Frickey, D.A. Conversions between S, Z, Y, H, ABCD, and T parameters which are valid for complex source and load impedances. IEEE Trans. Microw. Theory Tech. 1994, 42, 205–211. [Google Scholar] [CrossRef]
Figure 1. Illustration of the working principle of a gas sensor based on using a microwave device as a propagative structure and a sensing layer for gas detection. The two-port gas sensor is obtained by deposition of the gas sensing layer on the propagative structure and then exposure to the target gas.
Sensors 20 07150 g001
Figure 2. Illustration of the experimental characterization of the developed sensor for oxygen sensing.
Sensors 20 07150 g002
Figure 3. Photos of the sensor: (a) before and (b) after the gas sensing layer deposition.
Sensors 20 07150 g003
Figure 4. Illustration of the experimental set-up. It consists of five main blocks: (1) the controlled gas system, (2) the measurement chamber, (3) the vector network analyzer, (4) the USB/GPIB interface, and (5) the graphical user interface.
Sensors 20 07150 g004
Figure 5. Frequency dependence of the (a) real and (b) imaginary parts of the impedance parameters at 70% of oxygen (O2) concentration.
Sensors 20 07150 g005
Figure 6. Frequency dependence of the (a) real and (b) imaginary parts of the admittance parameters Y11 and Y22 at 70% of O2 concentration.
Sensors 20 07150 g006
Figure 7. Frequency dependence of the (a) real and (b) imaginary parts of the admittance parameters Y21 and Y12 at 70% of O2 concentration.
Sensors 20 07150 g007
Figure 8. Frequency dependence of the (a) real and (b) imaginary parts of Y11 at different O2 concentrations.
Sensors 20 07150 g008
Figure 9. Illustration of the proposed artificial neural network (ANN) model for reproducing the frequency dependence of the measured Y11 of the studied sensor operating at different concentrations of O2.
Sensors 20 07150 g009
Figure 10. Frequency dependence of the real and imaginary parts of Y11 at 70% of the O2 concentration: (symbols) measurements and (lines) ANN simulations.
Sensors 20 07150 g010
Figure 11. Frequency dependence of the real and imaginary parts of Y11 at two different values of the O2 concentration (symbols-measurements, lines-ANN simulations): (a) training concentration of 40%; (b) test concentration of 15%.
Sensors 20 07150 g011
Figure 12. Frequency dependence and histograms showing the distribution of absolute values of the difference between the measured Y11 and the corresponding values obtained by using the ANN model: (a) Y11 real part; (b) Y11 imaginary part.
Sensors 20 07150 g012
Figure 13. Frequency dependence of the (a) real and (b) imaginary parts of Y11 at different O2 concentrations, spanning from 0% to 100% with a step of 10%. These values are obtained by using the proposed ANN model.
Sensors 20 07150 g013
Figure 14. Comparison of the resonant frequencies determined by using the measured Y11 and the corresponding simulations based on the proposed ANN model.
Sensors 20 07150 g014
Figure 15. Comparison between measurements (symbols) and ANN simulations (lines) of the (a) absolute-absolute sensitivity and (b) absolute-relative sensitivity of the resonant frequencies to variations in the O2 concentration. The used reference value of the O2 concentration is 100%.
Sensors 20 07150 g015
Figure 16. Comparison between measurements (symbols) and ANN simulations (lines) of the relative changes of the resonant frequencies versus the O2 concentration. The used reference value of the O2 concentration is 100%.
Sensors 20 07150 g016
Publisher’s Note: MDPI stays neutral with regard to jurisdictional claims in published maps and institutional affiliations.

