Multiplexed Nanobiosensors: Current Trends in Early Diagnostics


Abstract
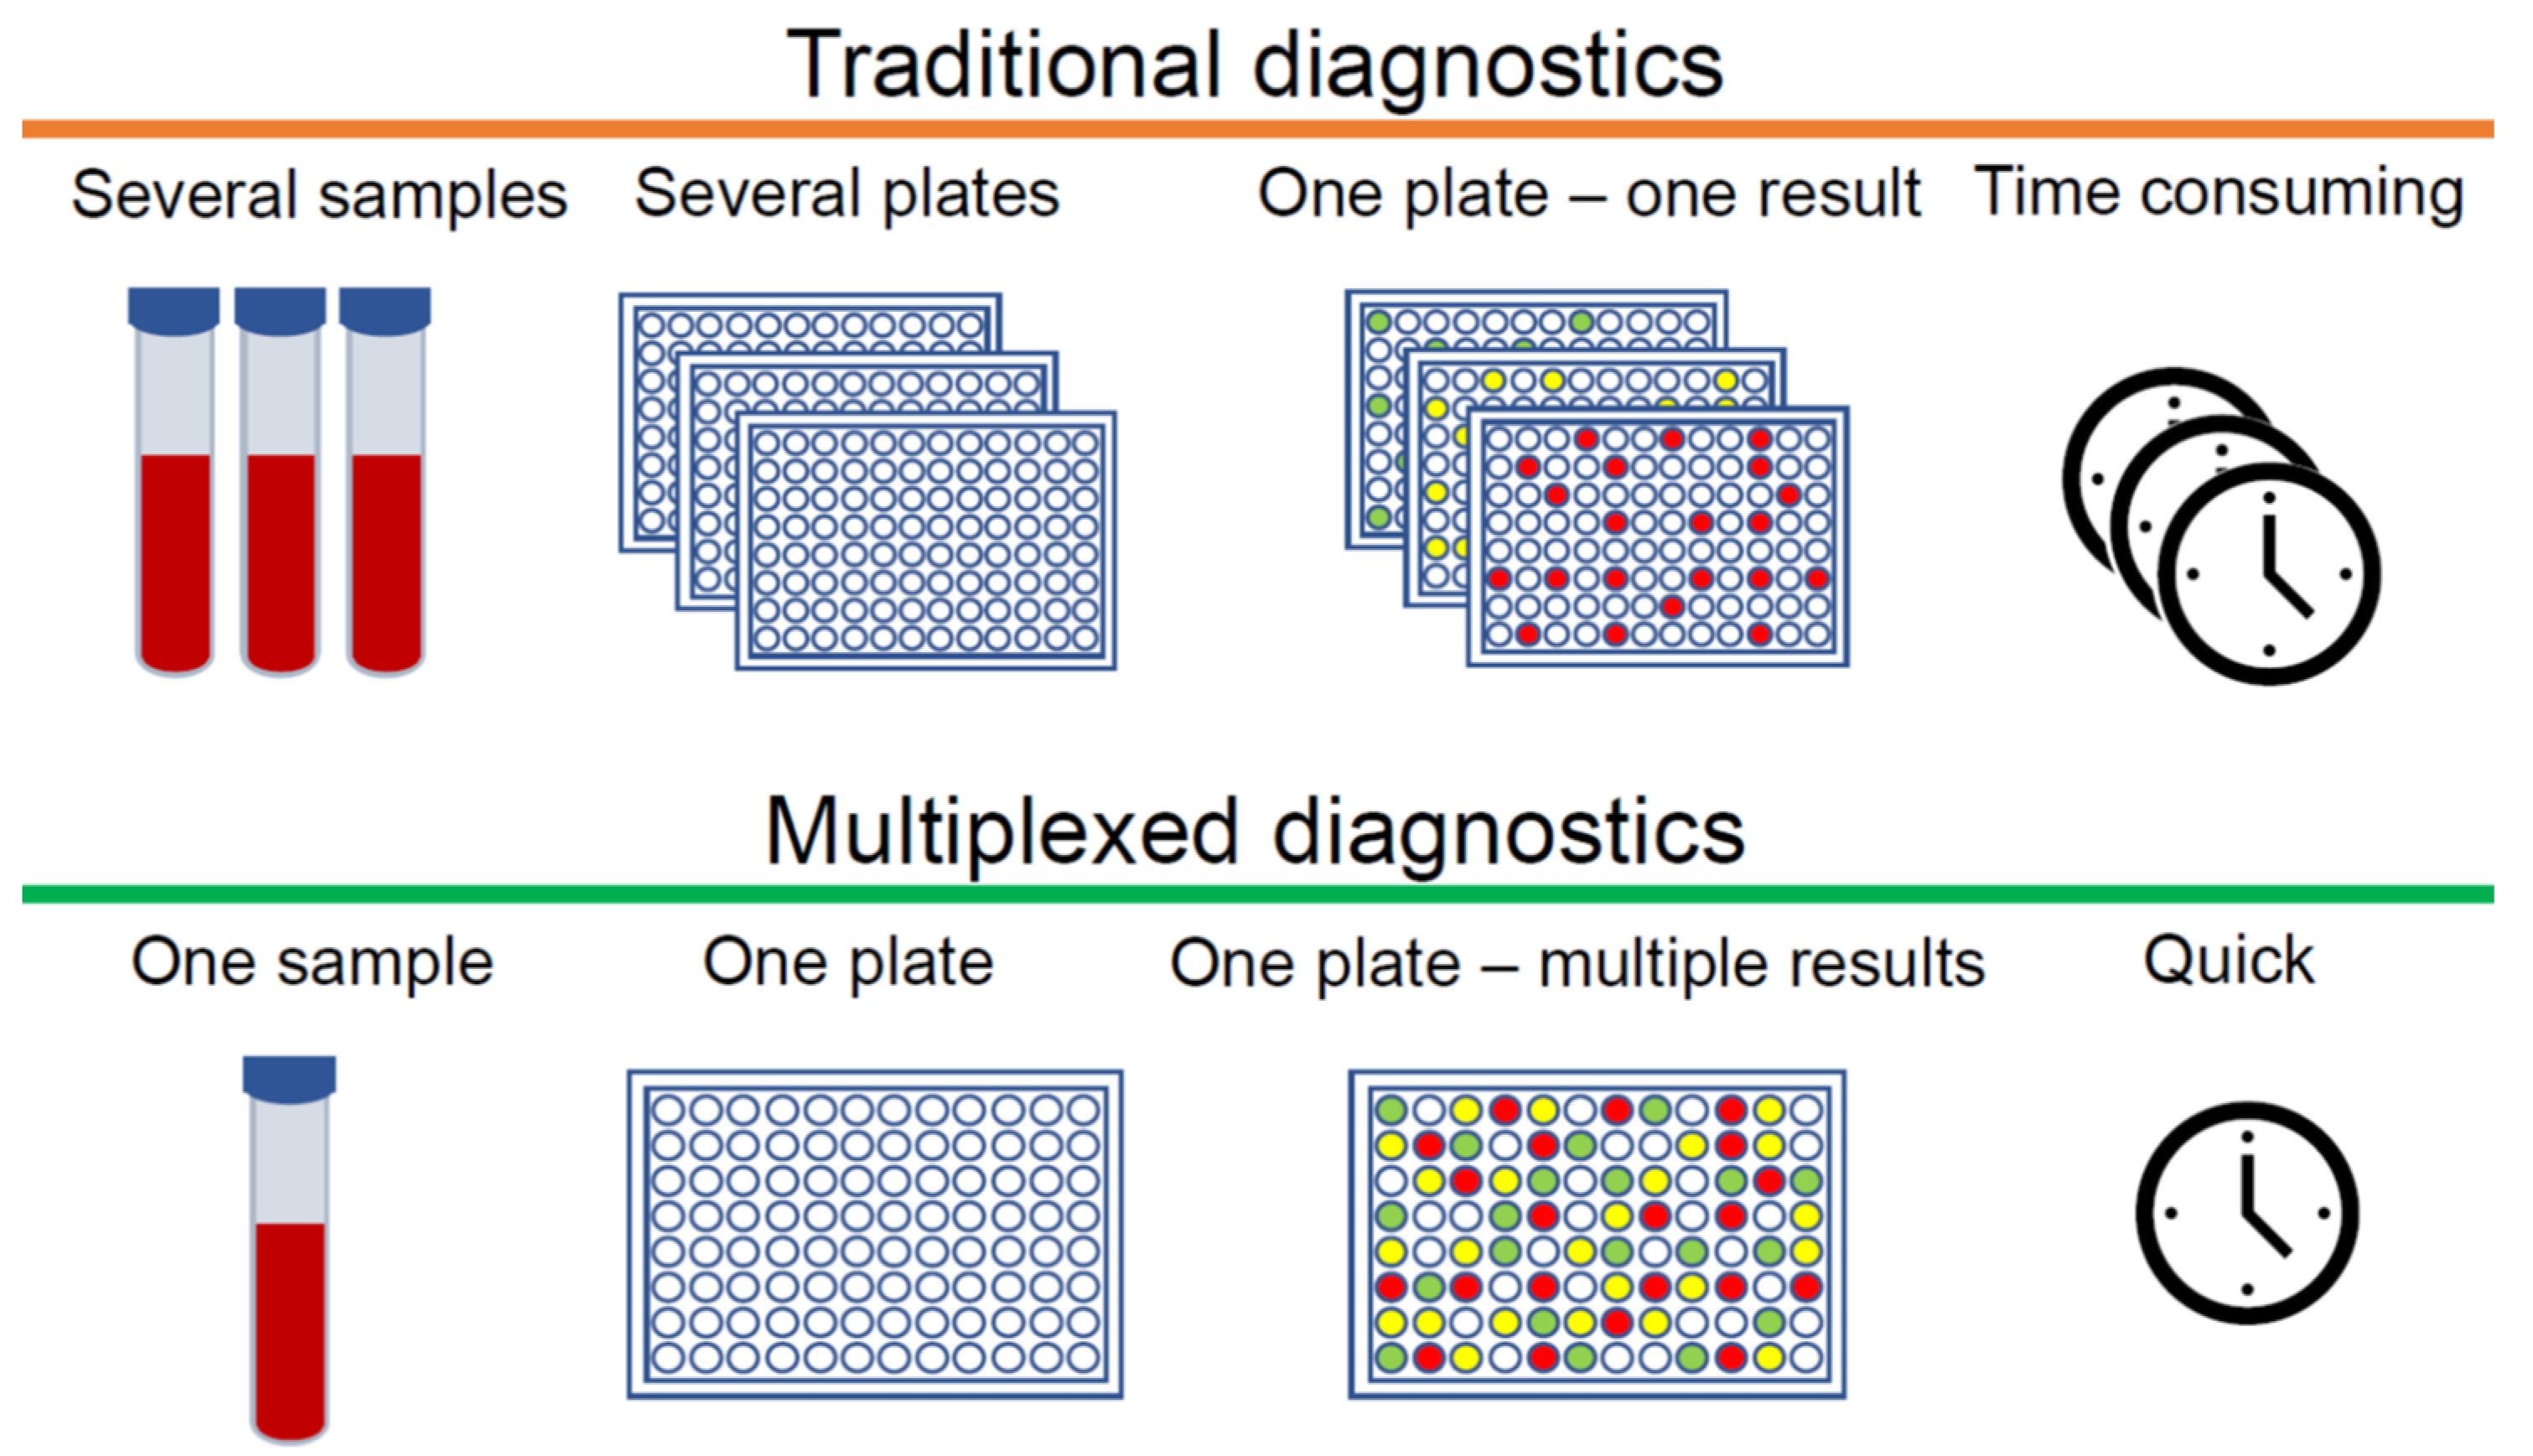
1. Introduction
2. Quantum Dots
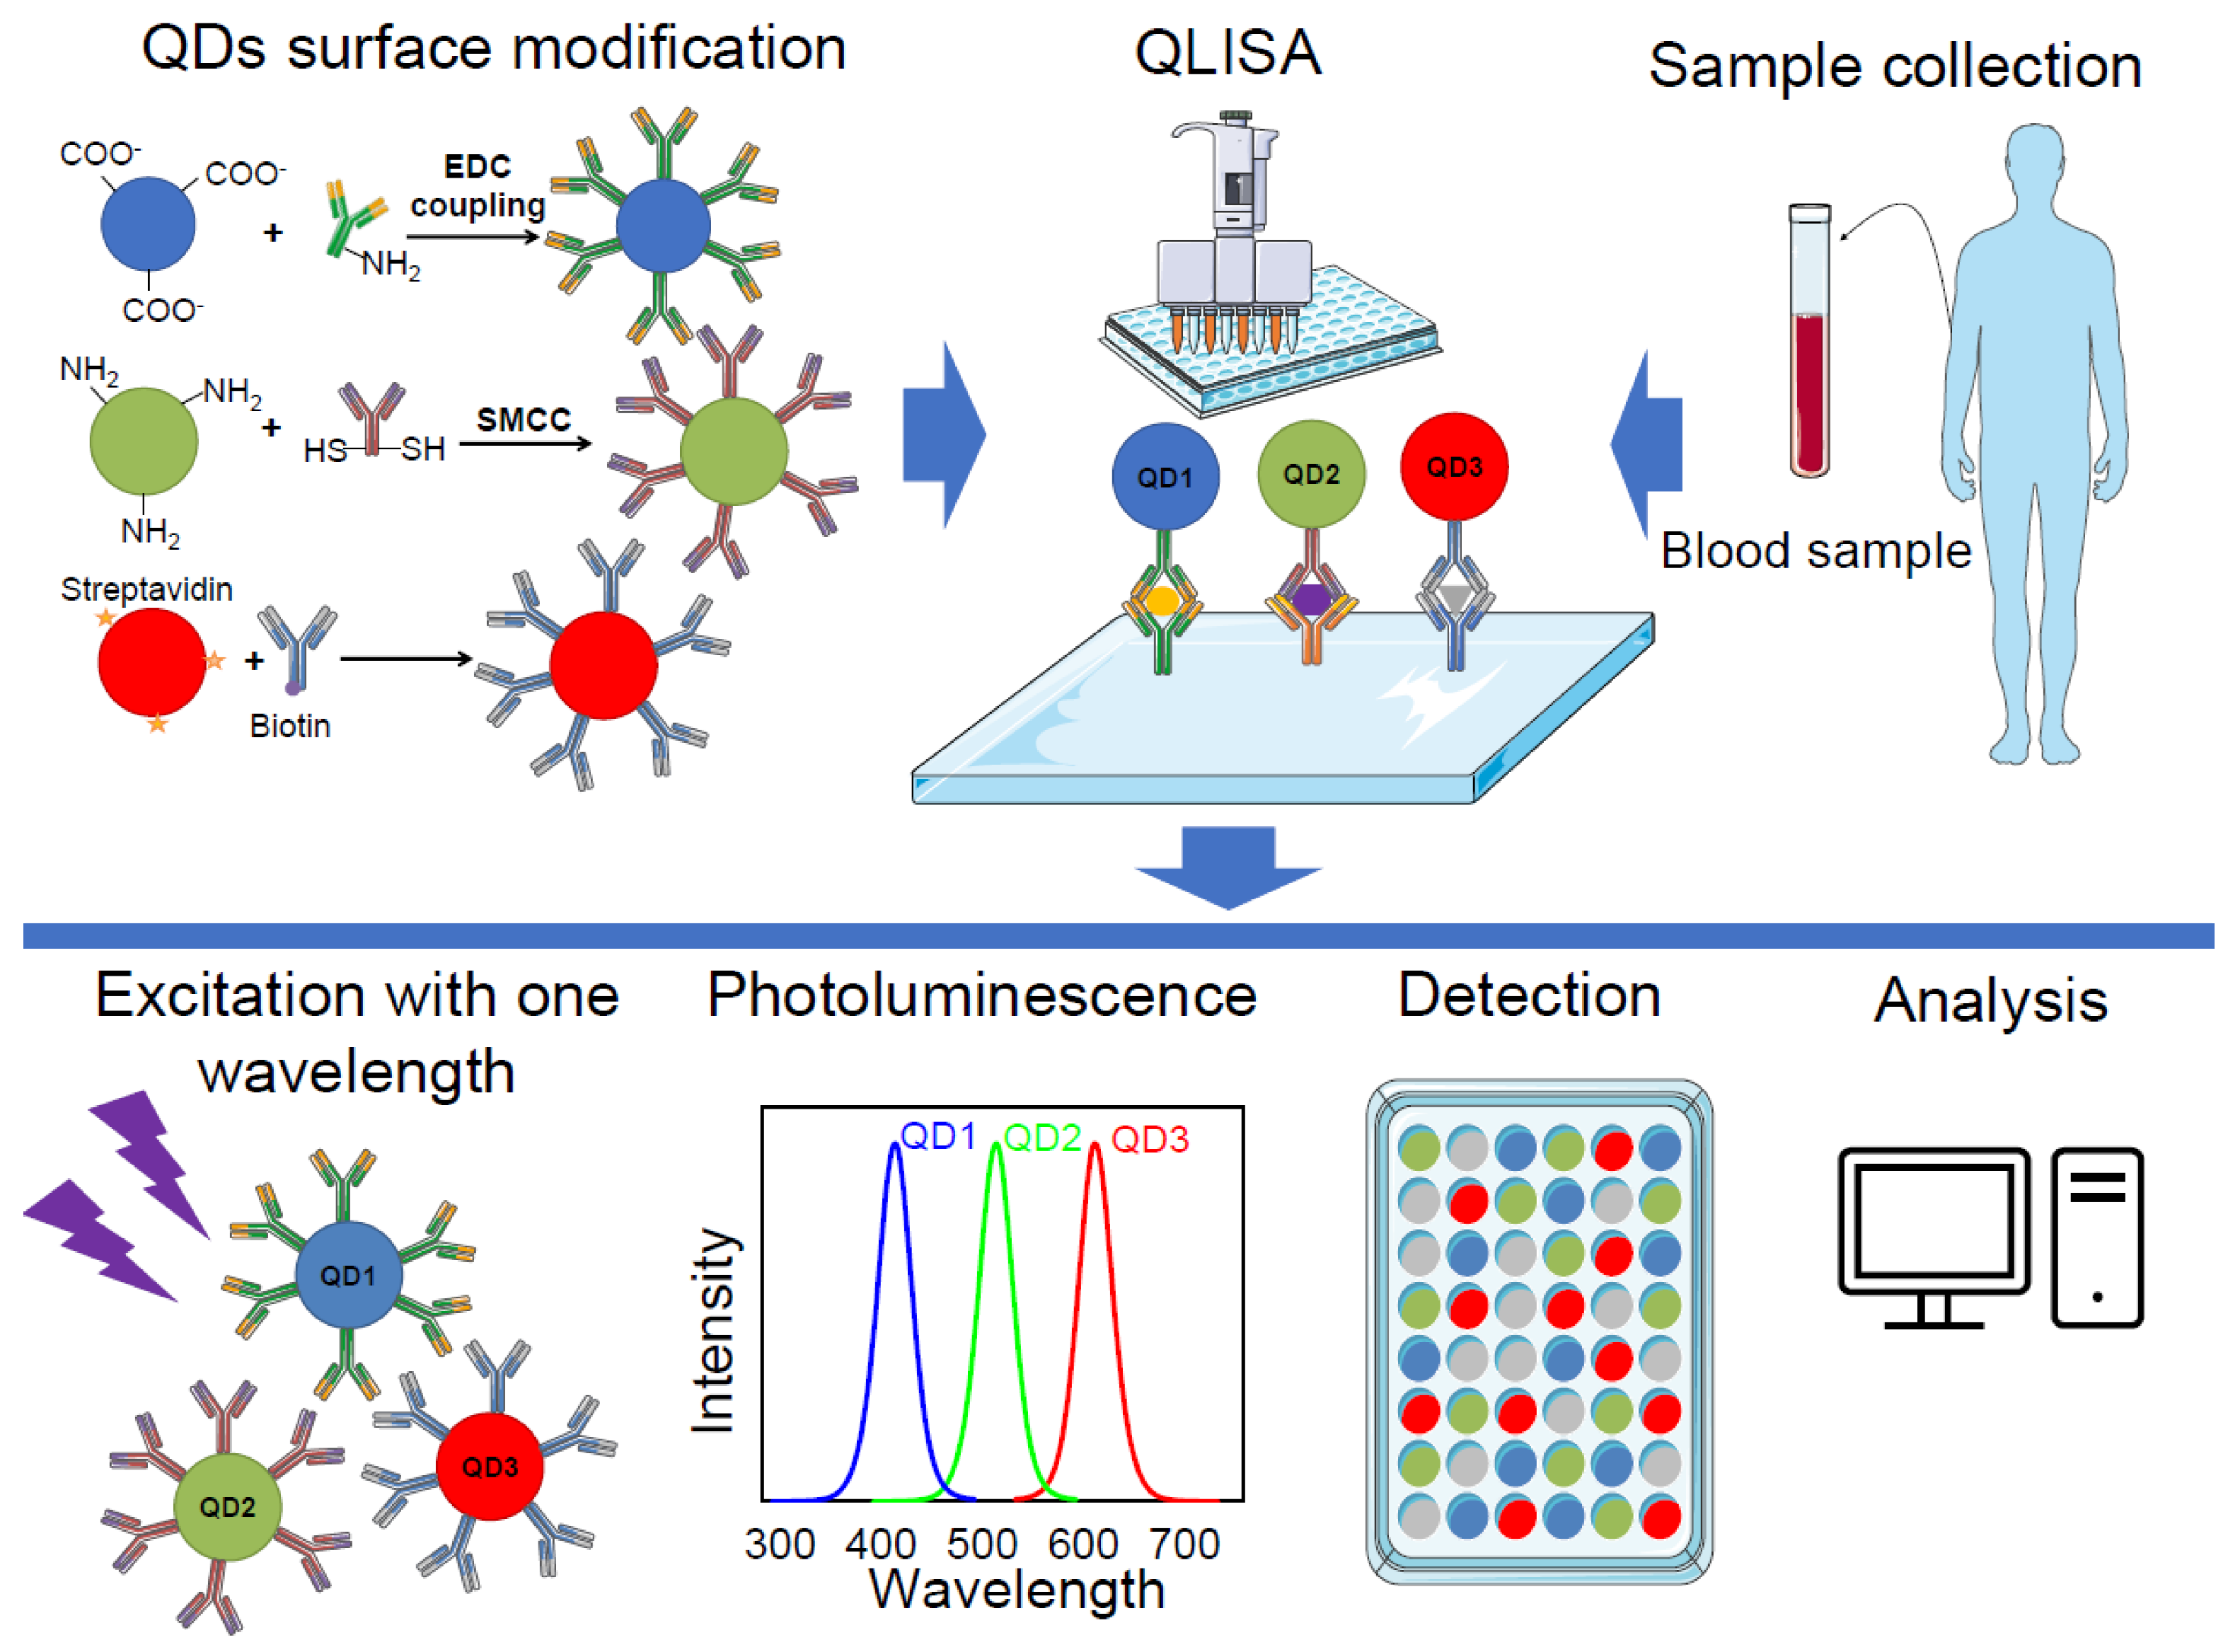
2.1. QLISA
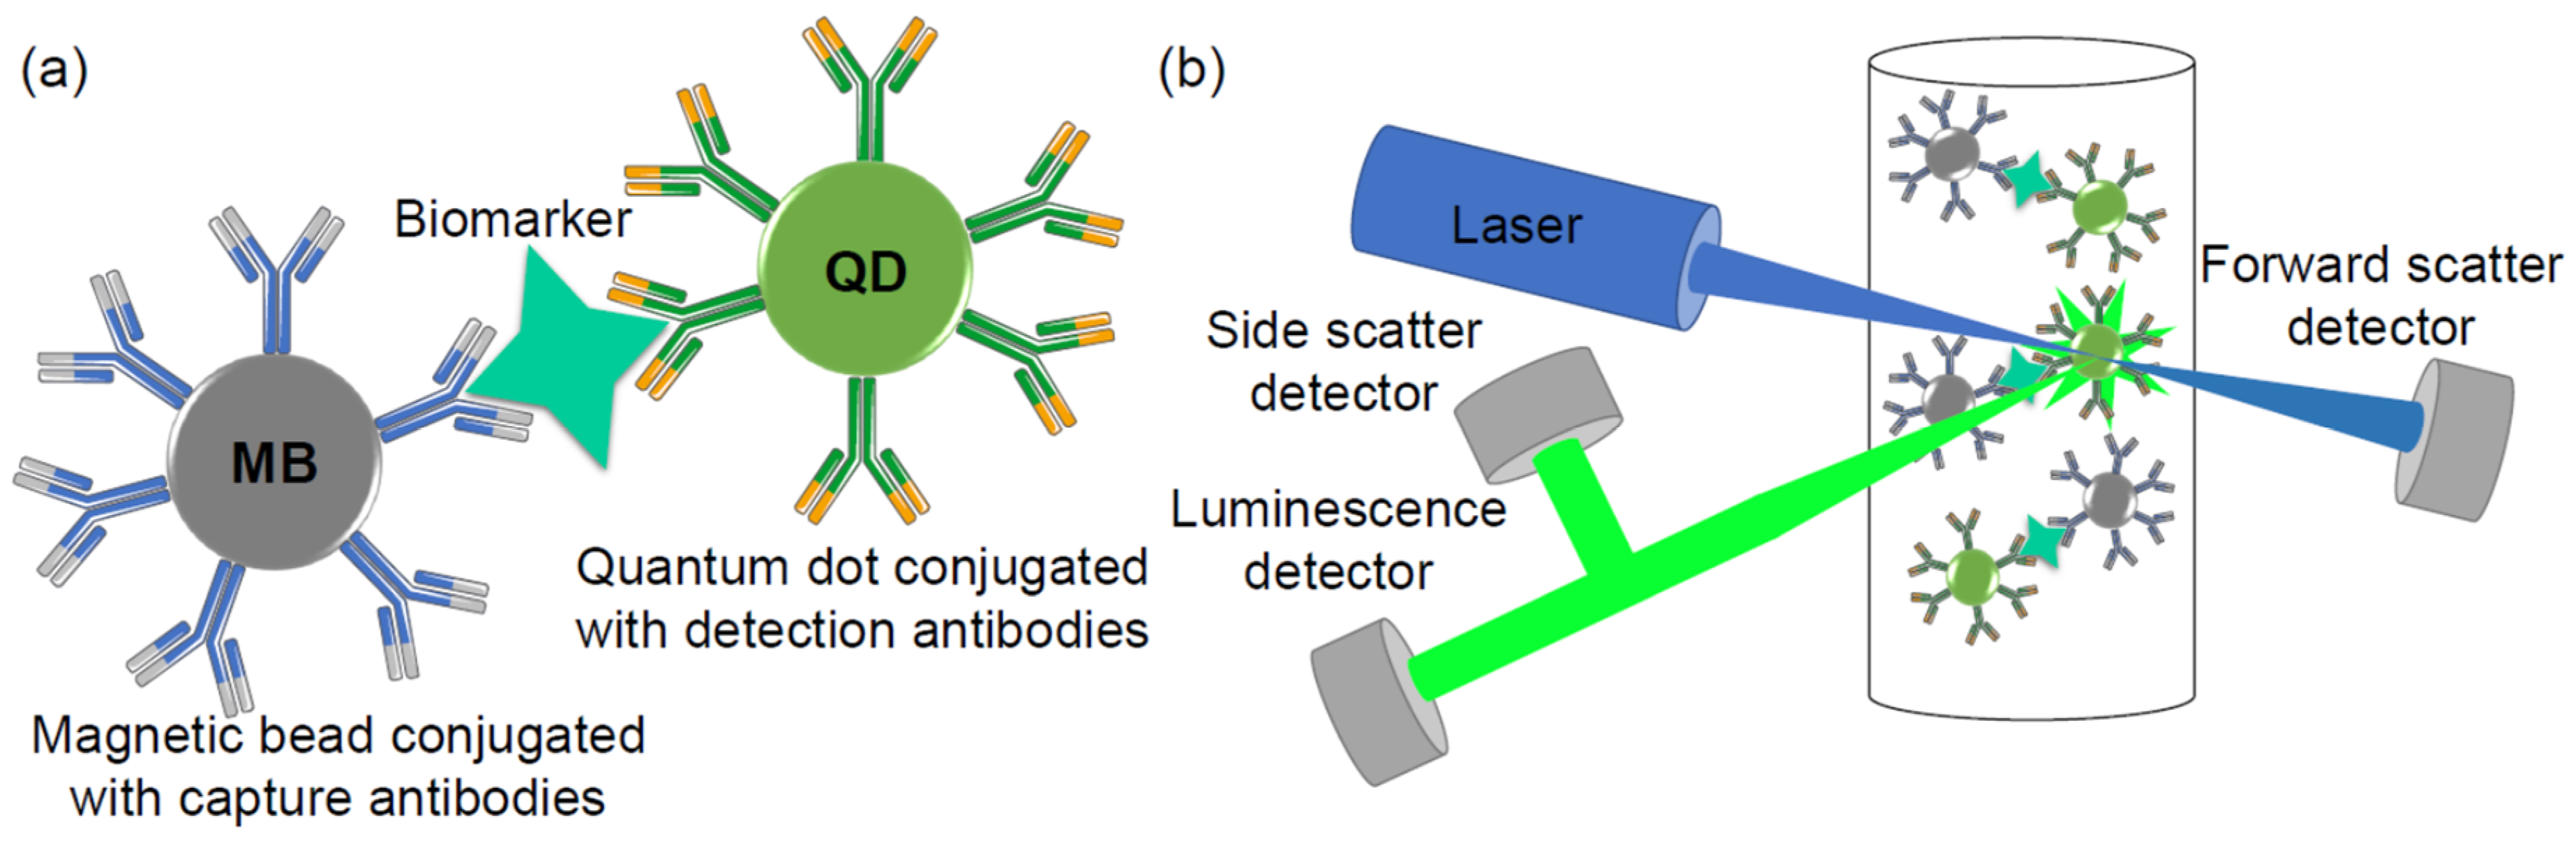
2.2. Magnetic Bead-Quantum Dot Assay
2.3. Multiplex Flow Cytometric Immunoassay
2.4. Electrochemical Immunoassay
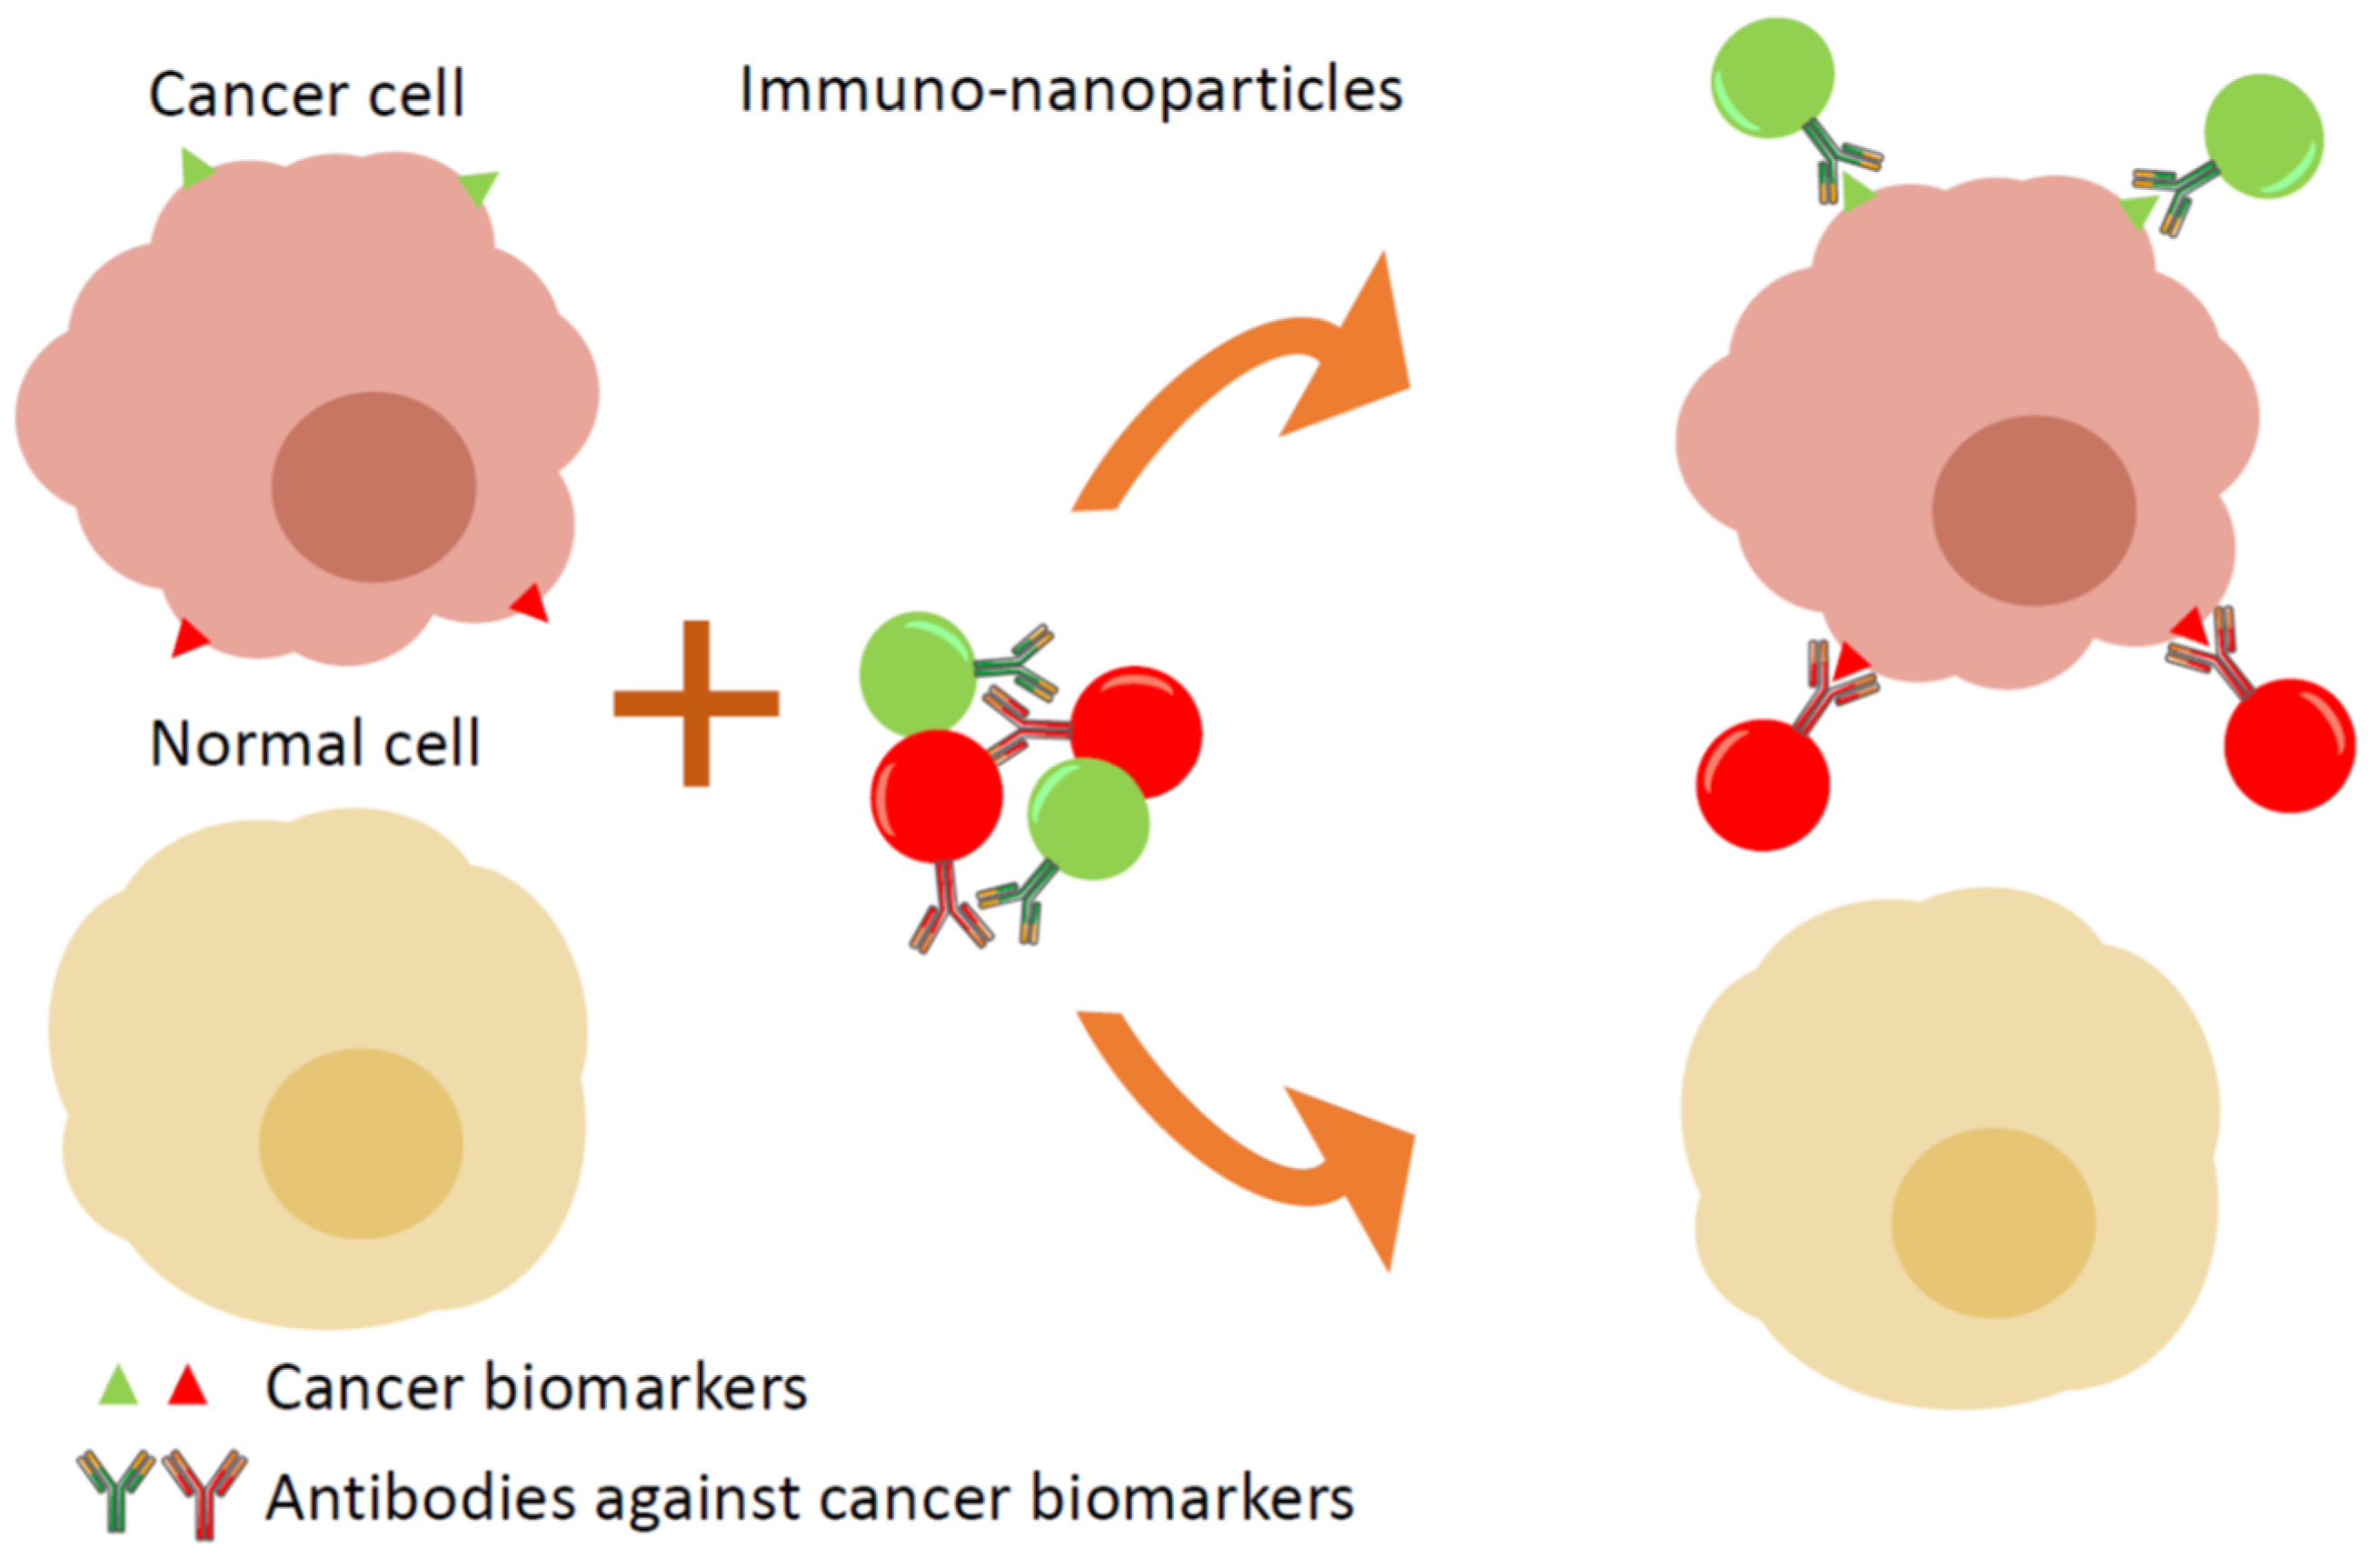
2.5. Multiplex Antigen Imaging in Cells and Tissues
2.6. Paper-Based Biosensors
3. Gold and Silver Nanoparticles
3.1. Plasmonic Multiplex Sensing
3.2. Multiplexed Colorimetric Detection
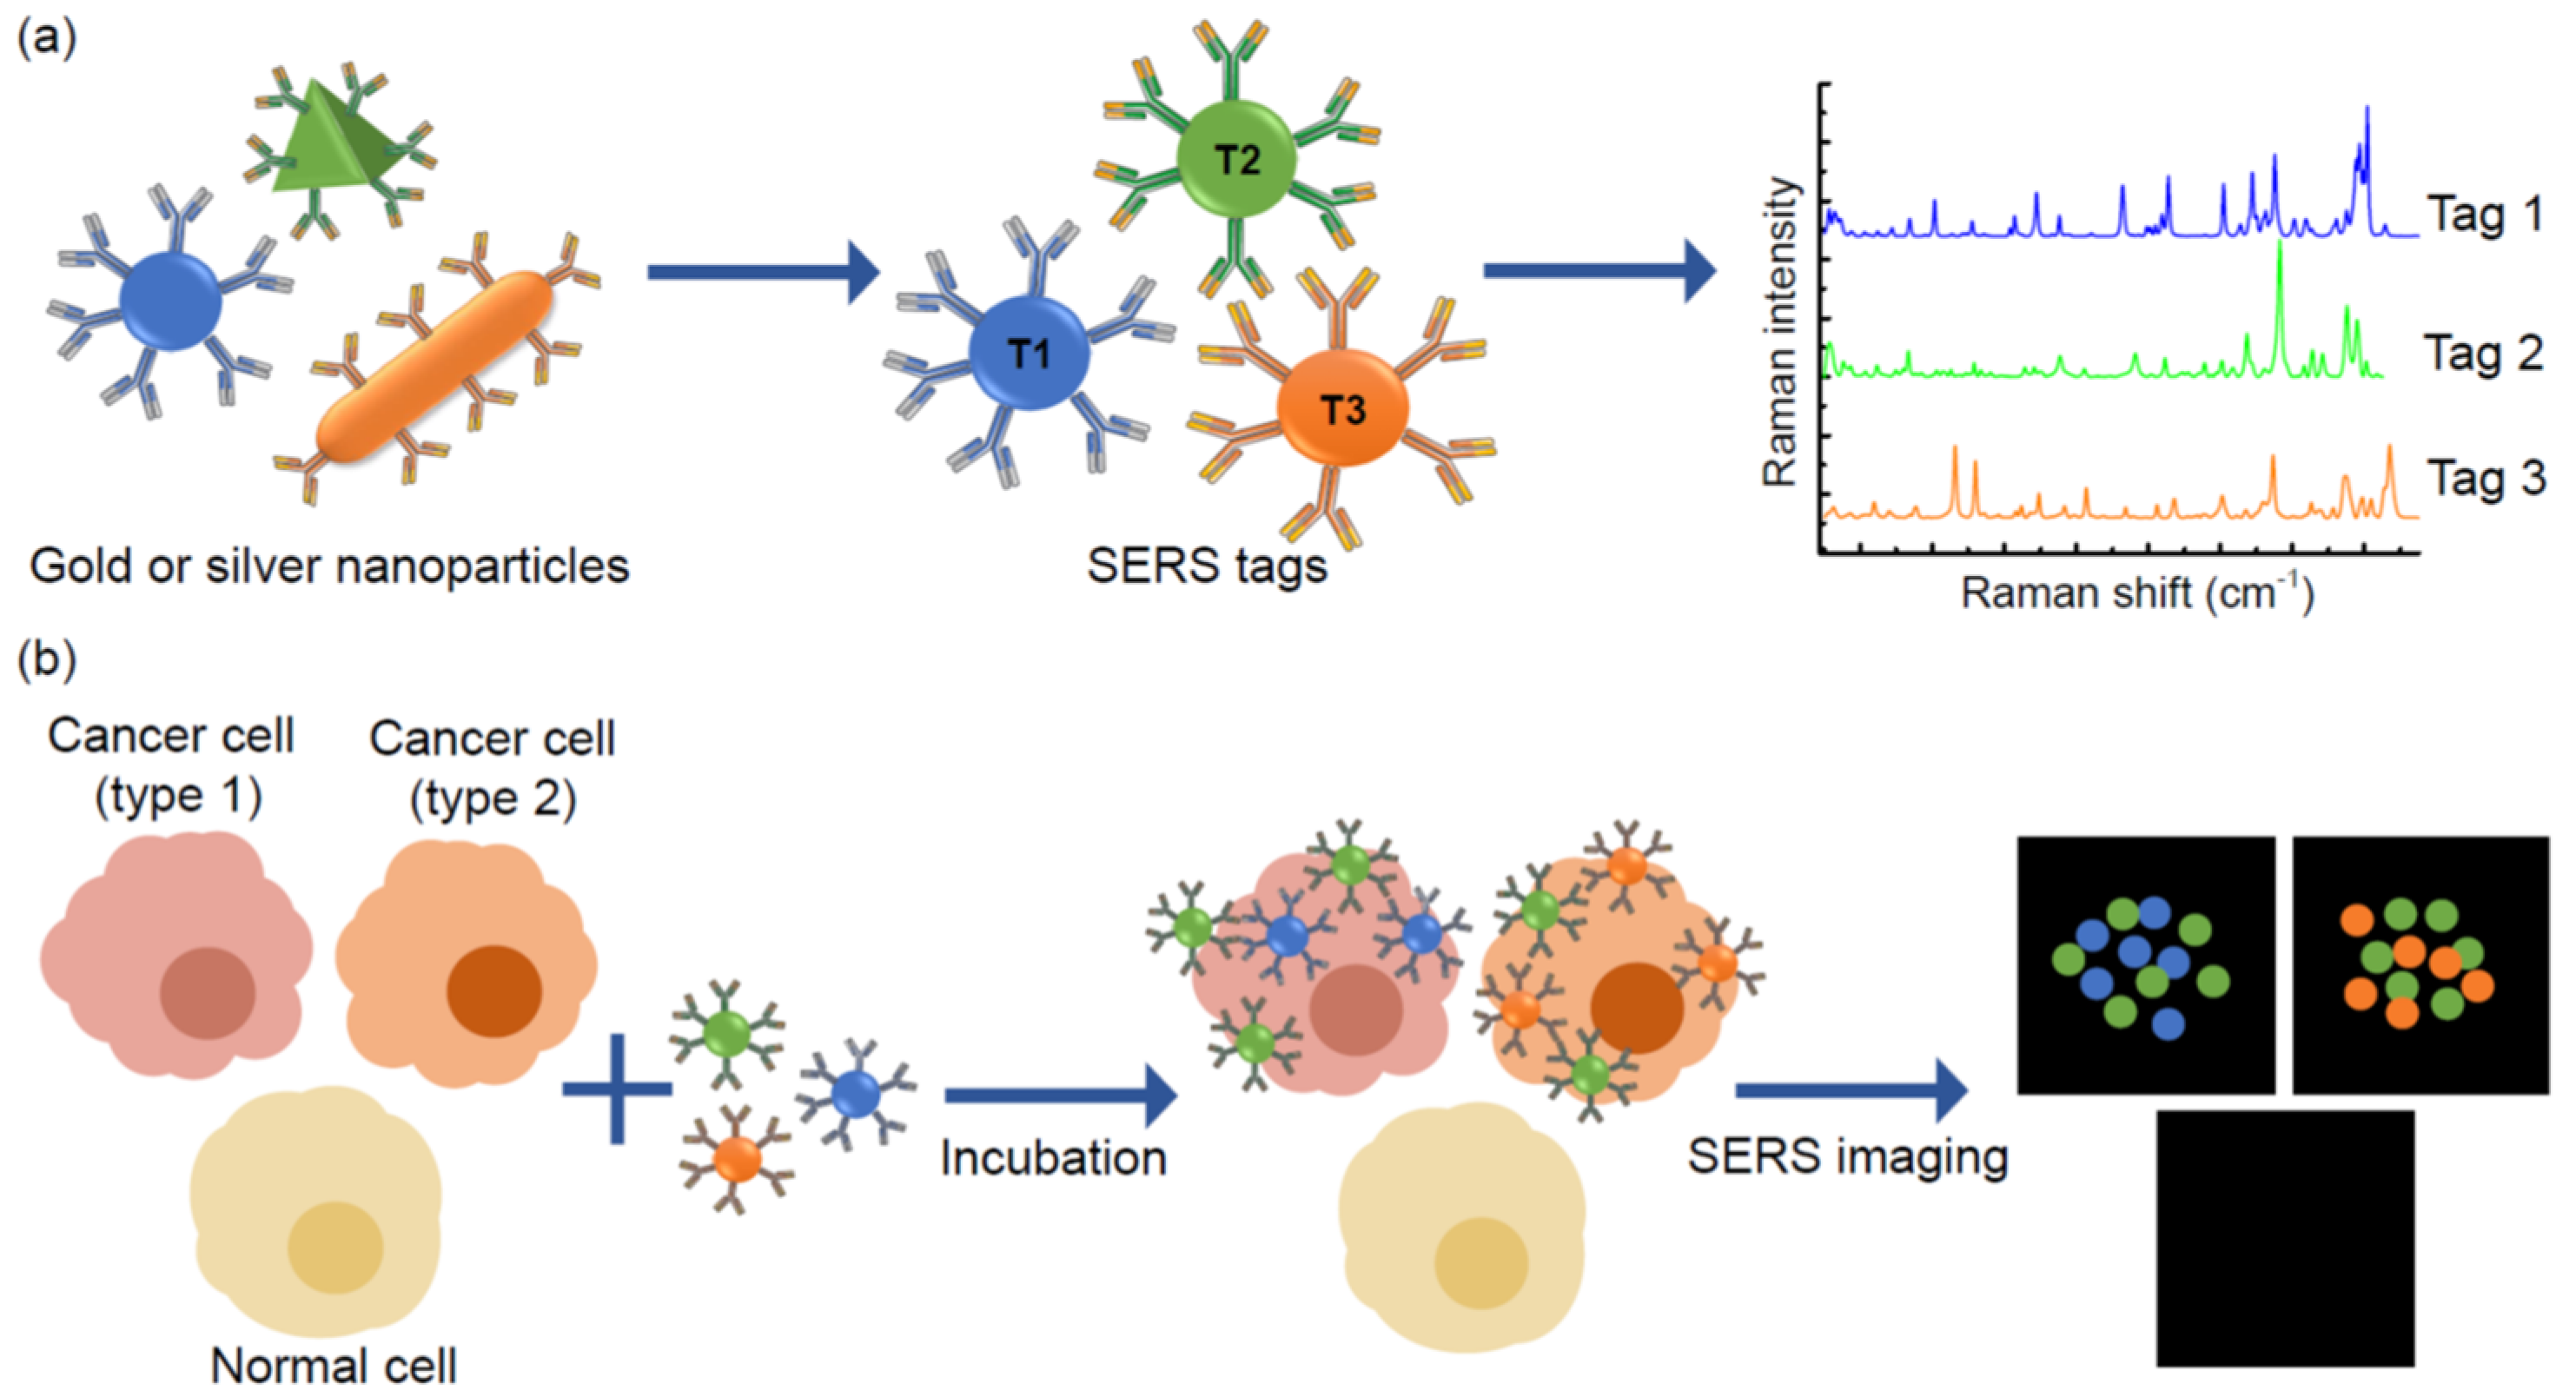
3.3. Multiplex SERS Imaging
3.4. Plasmon-Enhanced Multiplexed Biosensing
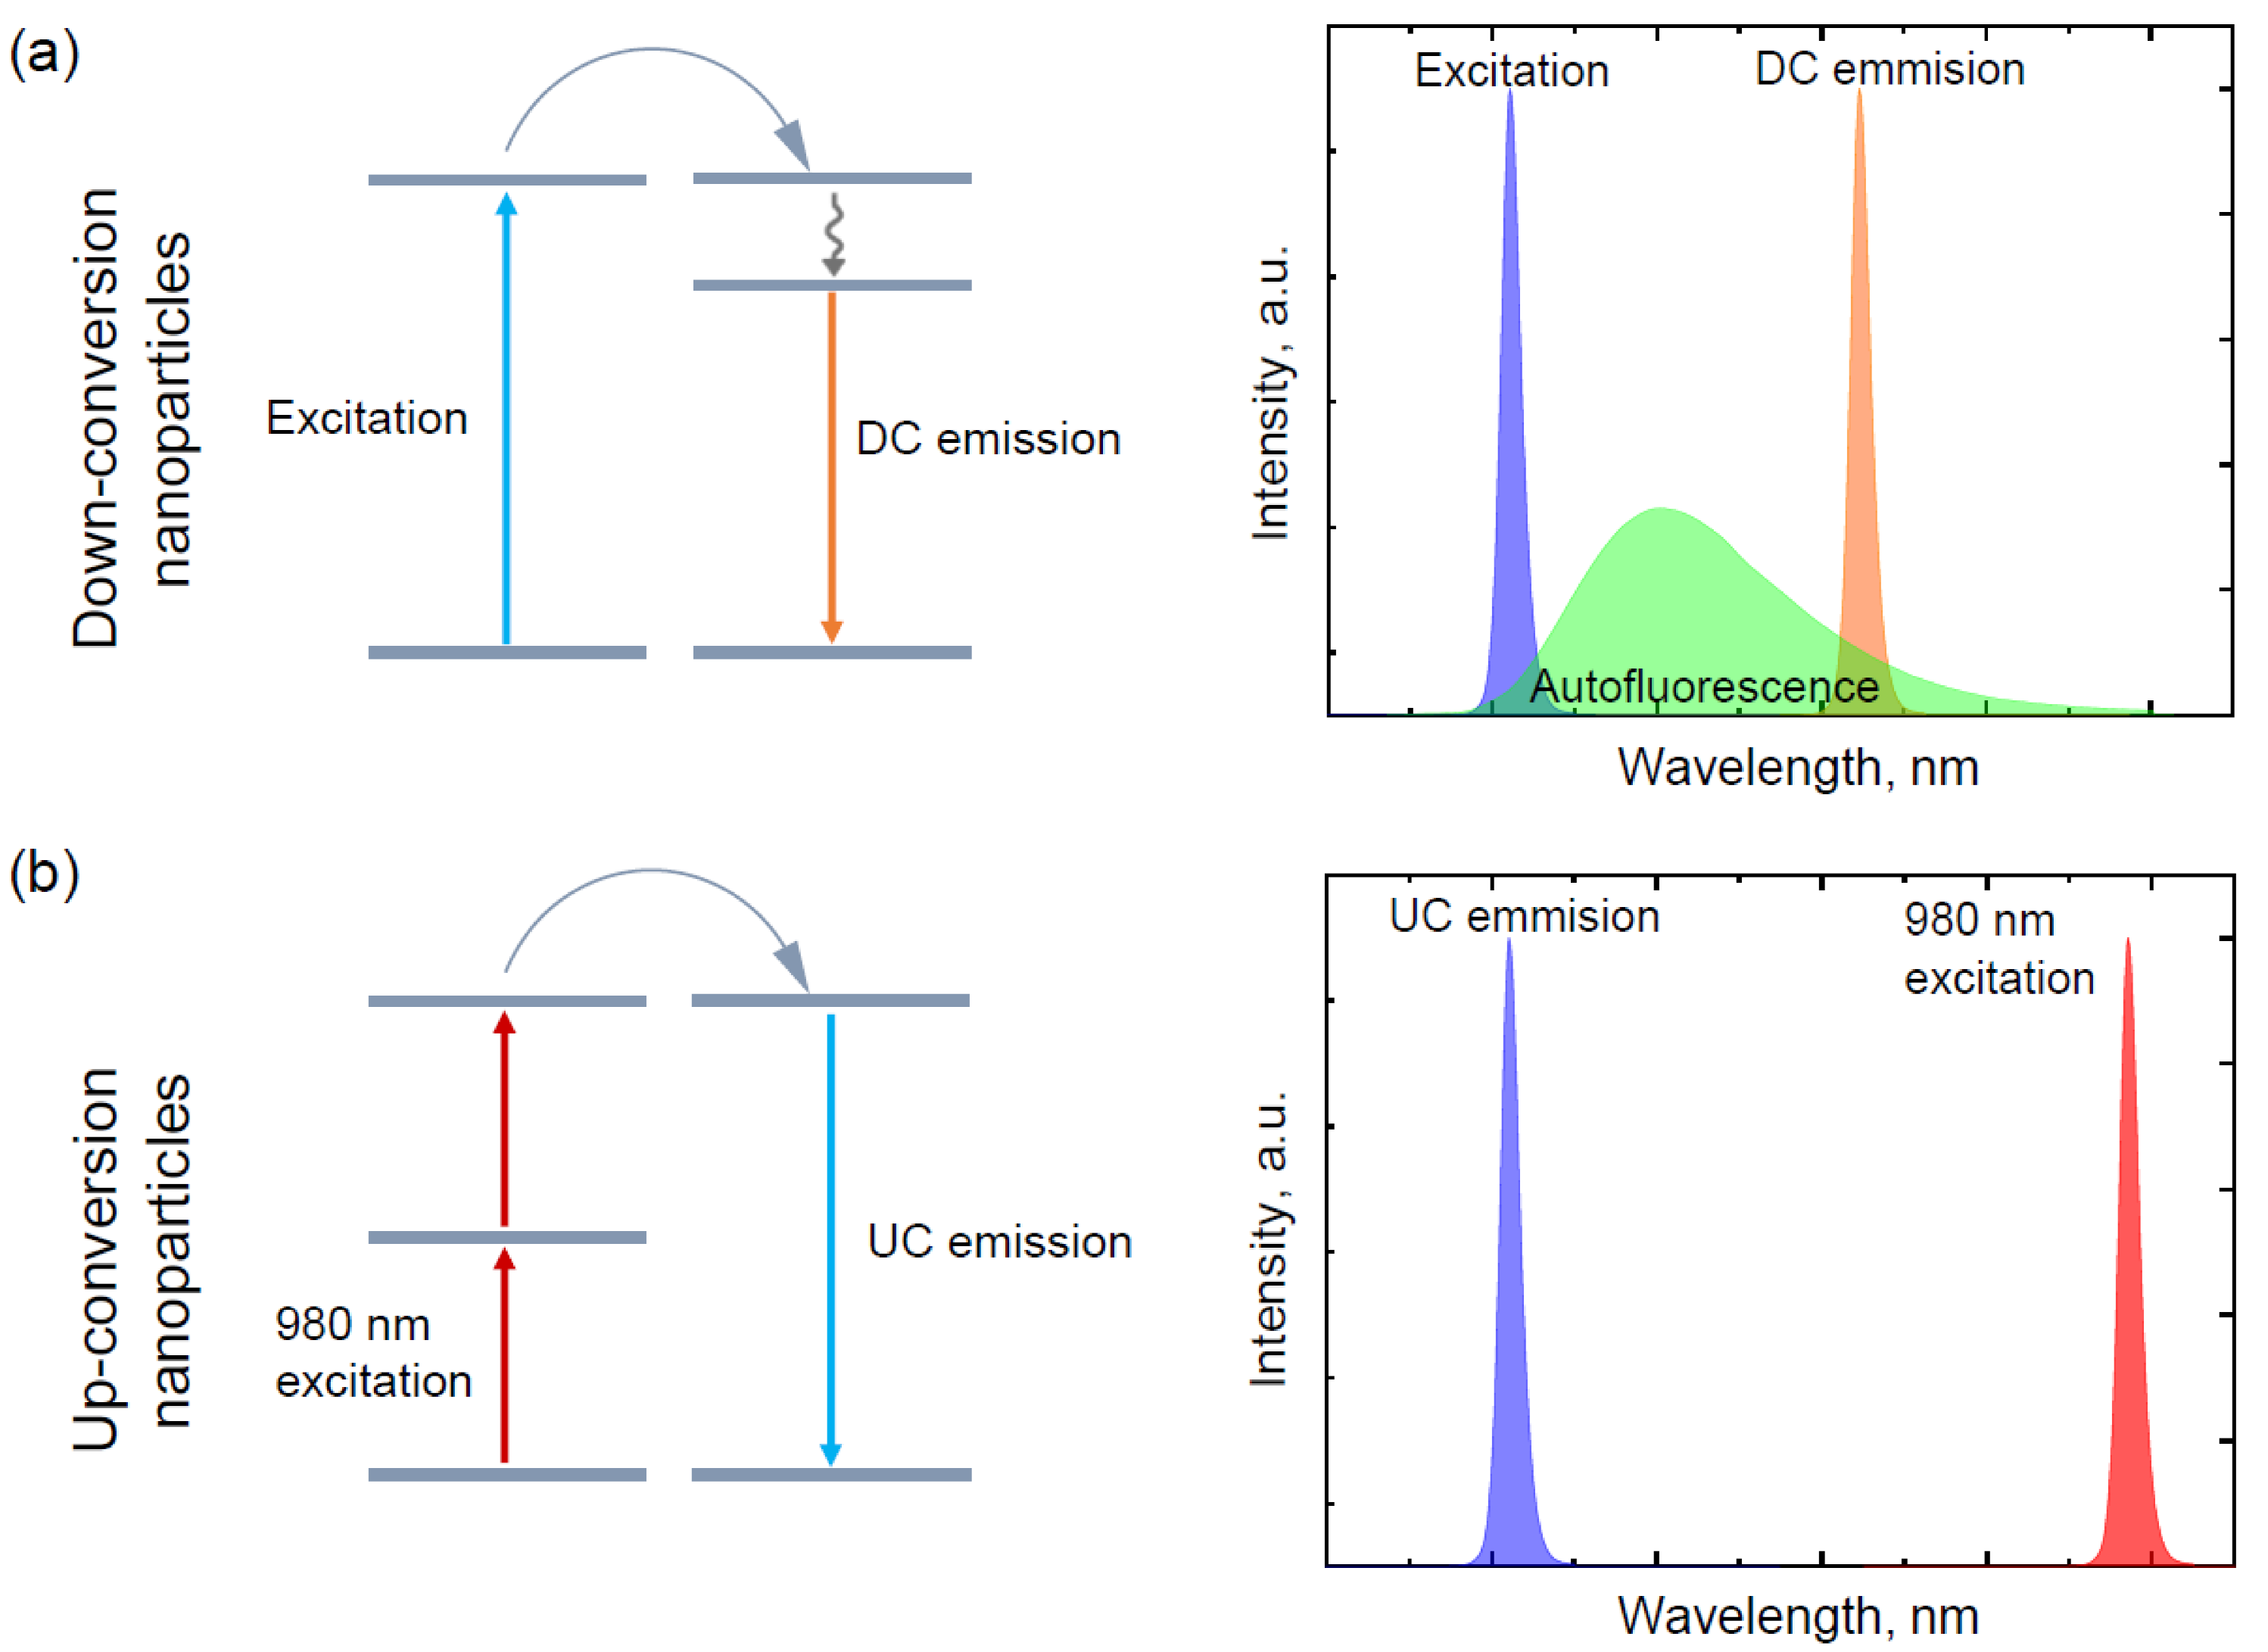
4. Upconverting Nanoparticles
5. Conclusions
Author Contributions
Funding
Conflicts of Interest
References
- Song, Y.; Huang, Y.-Y.; Liu, X.; Zhang, X.; Ferrari, M.; Qin, L. Point-of-care technologies for molecular diagnostics using a drop of blood. Trends Biotechnol. 2014, 32, 132–139. [Google Scholar] [CrossRef] [PubMed]
- Nimse, S.B.; Sonawane, M.D.; Song, K.-S.; Kim, T. Biomarker detection technologies and future directions. Analyst 2016, 141, 740–755. [Google Scholar] [CrossRef] [PubMed]
- Kosaka, N.; Kogure, A.; Yamamoto, T.; Urabe, F.; Usuba, W.; Prieto-Vila, M.; Ochiya, T. Exploiting the message from cancer: The diagnostic value of extracellular vesicles for clinical applications. Exp. Mol. Med. 2019, 51, 1–9. [Google Scholar] [CrossRef] [PubMed]
- Fan, Y.; Wang, S.; Zhang, F. Optical Multiplexed Bioassays for Improved Biomedical Diagnostics. Angew. Chem. Int. Ed. 2019, 58, 13208–13219. [Google Scholar] [CrossRef]
- Elsabahy, M.; Wooley, K.L.; Hendricksen, A.; Oh, K. Multiplexing techniques for measurement of the immunomodulatory effects of particulate materials: Precautions when testing micro- and nano-particles. Methods 2019, 158, 81–85. [Google Scholar] [CrossRef]
- Bruchez, M.; Moronne, M.; Gin, P.; Weiss, S.; Alivisatos, A.P. Semiconductor nanocrystals as fluorescent biological labels. Science 1998, 281, 2013–2016. [Google Scholar] [CrossRef]
- Alivisatos, A.P. Semiconductor Clusters, Nanocrystals, and Quantum Dots. Science 1996, 271, 933–937. [Google Scholar] [CrossRef]
- Chan, W.C.W.; Maxwell, D.J.; Gao, X.; Bailey, R.E.; Han, M.; Nie, S. Luminescent quantum dots for multiplexed biological detection and imaging. Curr. Opin. Biotechnol. 2002, 13, 40–46. [Google Scholar] [CrossRef]
- Bilan, R.; Fleury, F.; Nabiev, I.; Sukhanova, A. Quantum Dot Surface Chemistry and Functionalization for Cell Targeting and Imaging. Bioconjug. Chem. 2015, 26, 609–624. [Google Scholar] [CrossRef]
- Suzuki, M.; Udaka, H.; Fukuda, T. Quantum dot-linked immunosorbent assay (QLISA) using orientation-directed antibodies. J. Pharm. Biomed. Anal. 2017, 143, 110–115. [Google Scholar] [CrossRef]
- Powers, A.D.; Palecek, S.P. Protein analytical assays for diagnosing, monitoring, and choosing treatment for cancer patients. J. Healthc. Eng. 2012, 3, 503–534. [Google Scholar] [CrossRef] [PubMed]
- Satija, J.; Punjabi, N.; Mishra, D.; Mukherji, S. Plasmonic-ELISA: Expanding horizons. RSC Adv. 2016, 6, 85440–85456. [Google Scholar] [CrossRef]
- Thaxton, C.S.; Nam, J.-M.; Mirkin, C.A. PCR-like sensitivity for proteins with bio-bar-code amplification. Discov. Med. 2003, 3, 58–60. [Google Scholar] [PubMed]
- Elshal, M.F.; McCoy, J.P. Multiplex bead array assays: Performance evaluation and comparison of sensitivity to ELISA. Methods 2006, 38, 317–323. [Google Scholar] [CrossRef]
- Lakowicz, J.R. (Ed.) Fluorescence Sensing. In Principles of Fluorescence Spectroscopy; Springer: Boston, MA, USA, 2006; pp. 623–673. [Google Scholar]
- Grabolle, M.; Spieles, M.; Lesnyak, V.; Gaponik, N.; Eychmüller, A.; Resch-Genger, U. Determination of the Fluorescence Quantum Yield of Quantum Dots: Suitable Procedures and Achievable Uncertainties. Anal. Chem. 2009, 81, 6285–6294. [Google Scholar] [CrossRef]
- Mansur, H.S.; Mansur, A.A.P.; Soriano-Araújo, A.; Lobato, Z.I.P.; de Carvalho, S.M.; de Fatima Leite, M. Water-soluble nanoconjugates of quantum dot-chitosan-antibody for in vitro detection of cancer cells based on “enzyme-free” fluoroimmunoassay. Mater. Sci. Eng. C Mater. Biol. Appl. 2015, 52, 61–71. [Google Scholar] [CrossRef]
- Goldman, E.R.; Clapp, A.R.; Anderson, G.P.; Uyeda, H.T.; Mauro, J.M.; Medintz, I.L.; Mattoussi, H. Multiplexed toxin analysis using four colors of quantum dot fluororeagents. Anal. Chem. 2004, 76, 684–688. [Google Scholar] [CrossRef]
- Song, E.; Yu, M.; Wang, Y.; Hu, W.; Cheng, D.; Swihart, M.T.; Song, Y. Multi-color quantum dot-based fluorescence immunoassay array for simultaneous visual detection of multiple antibiotic residues in milk. Biosens. Bioelectron. 2015, 72, 320–325. [Google Scholar] [CrossRef]
- Kim, C.; Searson, P.C. Magnetic bead-quantum dot assay for detection of a biomarker for traumatic brain injury. Nanoscale 2015, 7, 17820–17826. [Google Scholar] [CrossRef]
- Horan, P.K.; Wheeless, L.L. Quantitative single cell analysis and sorting. Science 1977, 198, 149–157. [Google Scholar] [CrossRef]
- Leng, S.X.; McElhaney, J.E.; Walston, J.D.; Xie, D.; Fedarko, N.S.; Kuchel, G.A. ELISA and multiplex technologies for cytokine measurement in inflammation and aging research. J. Gerontol. A Biol. Sci. Med. Sci. 2008, 63, 879–884. [Google Scholar] [CrossRef] [PubMed]
- Kass, D.J.; Nouraie, M.; Glassberg, M.K.; Ramreddy, N.; Fernandez, K.; Harlow, L.; Zhang, Y.; Chen, J.; Kerr, G.S.; Reimold, A.M.; et al. Comparative Profiling of Serum Protein Biomarkers in Rheumatoid Arthritis–Associated Interstitial Lung Disease and Idiopathic Pulmonary Fibrosis. Arthritis Rheumatol. 2020, 72, 409–419. [Google Scholar] [CrossRef] [PubMed]
- Yu, F.; Xiong, Y.-M.; Yu, S.-C.; He, L.-L.; Niu, S.-S.; Wu, Y.-M.; Liu, J.; Qu, L.-B.; Liu, L.-E.; Wu, Y.-J. Magnetic immunoassay using CdSe/ZnS quantum dots as fluorescent probes to detect the level of DNA methyltransferase 1 in human serum sample. Int. J. Nanomed. 2018, 13, 429–437. [Google Scholar] [CrossRef] [PubMed]
- Faresjö, M. A useful guide for analysis of immune markers by fluorochrome (Luminex) technique. Methods Mol. Biol. 2014, 1172, 87–96. [Google Scholar] [CrossRef]
- Zhu, X.; Duan, D.; Publicover, N.G. Magnetic bead based assay for C-reactive protein using quantum-dot fluorescence labeling and immunoaffinity separation. Analyst 2010, 135, 381–389. [Google Scholar] [CrossRef]
- Park, H.; Hwang, M.P.; Lee, J.-W.; Choi, J.; Lee, K.H. Harnessing immunomagnetic separation and quantum dot-based quantification capacities for the enumeration of absolute levels of biomarker. Nanotechnology 2013, 24, 285103. [Google Scholar] [CrossRef]
- Park, H.; Lee, J.-W.; Hwang, M.P.; Lee, K.H. Quantification of cardiovascular disease biomarkers via functionalized magnetic beads and on-demand detachable quantum dots. Nanoscale 2013, 5, 8609–8615. [Google Scholar] [CrossRef]
- Kim, C.; Hoffmann, G.; Searson, P.C. Integrated Magnetic Bead-Quantum Dot Immunoassay for Malaria Detection. ACS Sens. 2017, 2, 766–772. [Google Scholar] [CrossRef]
- Liu, L.; Wu, S.; Jing, F.; Zhou, H.; Jia, C.; Li, G.; Cong, H.; Jin, Q.; Zhao, J. Bead-based microarray immunoassay for lung cancer biomarkers using quantum dots as labels. Biosens. Bioelectron. 2016, 80, 300–306. [Google Scholar] [CrossRef]
- Wu, S.; Liu, L.; Li, G.; Jing, F.; Mao, H.; Jin, Q.; Zhai, W.; Zhang, H.; Zhao, J.; Jia, C. Multiplexed detection of lung cancer biomarkers based on quantum dots and microbeads. Talanta 2016, 156–157, 48–54. [Google Scholar] [CrossRef]
- Bai, Y.; Lu, Y.; Wang, K.; Cheng, Z.; Qu, Y.; Qiu, S.; Zhou, L.; Wu, Z.; Liu, H.; Zhao, J.; et al. Rapid Isolation and Multiplexed Detection of Exosome Tumor Markers Via Queued Beads Combined with Quantum Dots in a Microarray. Nano-Micro Lett. 2019, 11, 59. [Google Scholar] [CrossRef]
- Leng, Y.; Wu, W.; Li, L.; Lin, K.; Sun, K.; Chen, X.; Li, W. Magnetic/Fluorescent Barcodes Based on Cadmium-Free Near-Infrared-Emitting Quantum Dots for Multiplexed Detection. Adv. Funct. Mater. 2016, 26, 7581–7589. [Google Scholar] [CrossRef]
- Wu, W.; Yu, X.; Gao, M.; Gull, S.; Shen, L.; Wang, W.; Li, L.; Yin, Y.; Li, W. Precisely Encoded Barcodes Using Tetrapod CdSe/CdS Quantum Dots with a Large Stokes Shift for Multiplexed Detection. Adv. Funct. Mater. 2020, 30, 1906707. [Google Scholar] [CrossRef]
- Yu, H.-W.; Kim, I.S.; Niessner, R.; Knopp, D. Multiplex competitive microbead-based flow cytometric immunoassay using quantum dot fluorescent labels. Anal. Chim. Acta 2012, 750, 191–198. [Google Scholar] [CrossRef] [PubMed]
- Bilan, R.; Ametzazurra, A.; Brazhnik, K.; Escorza, S.; Fernández, D.; Uríbarri, M.; Nabiev, I.; Sukhanova, A. Quantum-dot-based suspension microarray for multiplex detection of lung cancer markers: Preclinical validation and comparison with the Luminex xMAP ® system. Sci. Rep. 2017, 7, 1–10. [Google Scholar] [CrossRef] [PubMed]
- Fowler, J.M.; Wong, D.K.Y.; Halsall, H.B.; Heineman, W.R. Recent developments in electrochemical immunoassays and immunosensors. In Electrochemical Sensors, Biosensors and their Biomedical Applications; Academic Press: Amsterdam, The Netherlands; Boston, MA, USA, 2008; pp. 115–143. [Google Scholar] [CrossRef]
- Wang, J.; Liu, G.; Polsky, R.; Merkoçi, A. Electrochemical stripping detection of DNA hybridization based on cadmium sulfide nanoparticle tags. Electrochem. Commun. 2002, 4, 722–726. [Google Scholar] [CrossRef]
- Wang, J.; Liu, G.; Merkoçi, A. Electrochemical coding technology for simultaneous detection of multiple DNA targets. J. Am. Chem. Soc. 2003, 125, 3214–3215. [Google Scholar] [CrossRef]
- Guo, Z.; Hao, T.; Du, S.; Chen, B.; Wang, Z.; Li, X.; Wang, S. Multiplex electrochemiluminescence immunoassay of two tumor markers using multicolor quantum dots as labels and graphene asconductingbridge. Biosens. Bioelectron. 2013, 44, 101–107. [Google Scholar] [CrossRef]
- Babamiri, B.; Hallaj, R.; Salimi, A. Ultrasensitive electrochemiluminescence immunoassay for simultaneous determination of CA125 and CA15-3 tumor markers based on PAMAM-sulfanilic acid-Ru(bpy)32+ and PAMAM-CdTe@CdS nanocomposite. Biosens. Bioelectron. 2018, 99, 353–360. [Google Scholar] [CrossRef]
- Wu, X.; Liu, H.; Liu, J.; Haley, K.N.; Treadway, J.A.; Larson, J.P.; Ge, N.; Peale, F.; Bruchez, M.P. Immunofluorescent labeling of cancer marker Her2 and other cellular targets with semiconductor quantum dots. Nat. Biotechnol. 2003, 21, 41–46. [Google Scholar] [CrossRef]
- Yezhelyev, M.V.; Al-Hajj, A.; Morris, C.; Marcus, A.I.; Liu, T.; Lewis, M.; Cohen, C.; Zrazhevskiy, P.; Simons, J.W.; Rogatko, A.; et al. In Situ Molecular Profiling of Breast Cancer Biomarkers with Multicolor Quantum Dots. Adv. Mater. 2007, 19, 3146–3151. [Google Scholar] [CrossRef]
- Liu, J.; Lau, S.K.; Varma, V.A.; Kairdolf, B.A.; Nie, S. Multiplexed Detection and Characterization of Rare Tumor Cells in Hodgkin’s Lymphoma with Multicolor Quantum Dots. Anal. Chem. 2010, 82, 6237–6243. [Google Scholar] [CrossRef] [PubMed]
- Xu, H.; Xu, J.; Wang, X.; Wu, D.; Chen, Z.G.; Wang, A.Y. Quantum Dot-Based, Quantitative, and Multiplexed Assay for Tissue Staining. ACS Appl. Mater. Interfaces 2013, 5, 2901–2907. [Google Scholar] [CrossRef] [PubMed]
- Kuswandi, B.; Ensafi, A.A. Perspective—Paper-Based Biosensors: Trending Topic in Clinical Diagnostics Developments and Commercialization. J. Electrochem. Soc. 2019, 167, 037509. [Google Scholar] [CrossRef]
- Chinnadayyala, S.R.; Park, J.; Le, H.T.N.; Santhosh, M.; Kadam, A.N.; Cho, S. Recent advances in microfluidic paper-based electrochemiluminescence analytical devices for point-of-care testing applications. Biosens. Bioelectron. 2019, 126, 68–81. [Google Scholar] [CrossRef]
- Xiao, K.; Wang, K.; Qin, W.; Hou, Y.; Lu, W.; Xu, H.; Wo, Y.; Cui, D. Use of quantum dot beads-labeled monoclonal antibody to improve the sensitivity of a quantitative and simultaneous immunochromatographic assay for neuron specific enolase and carcinoembryonic antigen. Talanta 2017, 164, 463–469. [Google Scholar] [CrossRef]
- Chen, Z.; Liang, R.; Guo, X.; Liang, J.; Deng, Q.; Li, M.; An, T.; Liu, T.; Wu, Y. Simultaneous quantitation of cytokeratin-19 fragment and carcinoembryonic antigen in human serum via quantum dot-doped nanoparticles. Biosens. Bioelectron. 2017, 91, 60–65. [Google Scholar] [CrossRef]
- Chen, Y.; Guo, X.; Liu, W.; Zhang, L. Paper-based fluorometric immunodevice with quantum-dot labeled antibodies for simultaneous detection of carcinoembryonic antigen and prostate specific antigen. Microchim. Acta 2019, 186, 112. [Google Scholar] [CrossRef]
- Jain, P.K.; Huang, X.; El-Sayed, I.H.; El-Sayed, M.A. Noble Metals on the Nanoscale: Optical and Photothermal Properties and Some Applications in Imaging, Sensing, Biology, and Medicine. Acc. Chem. Res. 2008, 41, 1578–1586. [Google Scholar] [CrossRef]
- Tao, Y.; Li, M.; Ren, J.; Qu, X. Metal nanoclusters: Novel probes for diagnostic and therapeutic applications. Chem. Soc. Rev. 2015, 44, 8636–8663. [Google Scholar] [CrossRef]
- Elahi, N.; Kamali, M.; Baghersad, M.H. Recent biomedical applications of gold nanoparticles: A review. Talanta 2018, 184, 537–556. [Google Scholar] [CrossRef] [PubMed]
- Jeong, H.-H.; Choi, E.; Ellis, E.; Lee, T.-C. Recent advances in gold nanoparticles for biomedical applications: From hybrid structures to multi-functionality. J. Mater. Chem. B 2019, 7, 3480–3496. [Google Scholar] [CrossRef]
- Le Ouay, B.; Stellacci, F. Antibacterial activity of silver nanoparticles: A surface science insight. Nano Today 2015, 10, 339–354. [Google Scholar] [CrossRef]
- Moores, A.; Goettmann, F. The plasmon band in noble metal nanoparticles: An introduction to theory and applications. New J. Chem. 2006, 30, 1121–1132. [Google Scholar] [CrossRef]
- Huang, H.; Liu, F.; Huang, S.; Yuan, S.; Liao, B.; Yi, S.; Zeng, Y.; Chu, P.K. Sensitive and simultaneous detection of different disease markers using multiplexed gold nanorods. Anal. Chim. Acta 2012, 755, 108–114. [Google Scholar] [CrossRef]
- Liang, J.; Yao, C.; Li, X.; Wu, Z.; Huang, C.; Fu, Q.; Lan, C.; Cao, D.; Tang, Y. Silver Nanoprism Etching-Based Plasmonic ELISA for the High Sensitive Detection of Prostate-Specific Antigen. Biosens Bioelectron 2015, 69, 128–134. [Google Scholar] [CrossRef]
- Liu, D.; Yang, J.; Wang, H.-F.; Wang, Z.; Huang, X.; Wang, Z.; Niu, G.; Hight Walker, A.R.; Chen, X. Glucose oxidase-catalyzed growth of gold nanoparticles enables quantitative detection of attomolar cancer biomarkers. Anal. Chem. 2014, 86, 5800–5806. [Google Scholar] [CrossRef]
- Rodríguez-Lorenzo, L.; de la Rica, R.; Álvarez-Puebla, R.A.; Liz-Marzán, L.M.; Stevens, M.M. Plasmonic nanosensors with inverse sensitivity by means of enzyme-guided crystal growth. Nat. Mater. 2012, 11, 604–607. [Google Scholar] [CrossRef]
- Nie, X.-M.; Huang, R.; Dong, C.-X.; Tang, L.-J.; Gui, R.; Jiang, J.-H. Plasmonic ELISA for the ultrasensitive detection of Treponema pallidum. Biosens. Bioelectron. 2014, 58, 314–319. [Google Scholar] [CrossRef]
- Mohd Bakhori, N.; Yusof, N.A.; Abdullah, J.; Wasoh, H.; Md Noor, S.S.; Ahmad Raston, N.H.; Mohammad, F. Immuno Nanosensor for the Ultrasensitive Naked Eye Detection of Tuberculosis. Sensors 2018, 18, 1932. [Google Scholar] [CrossRef]
- Peng, M.-P.; Ma, W.; Long, Y.-T. Alcohol Dehydrogenase-Catalyzed Gold Nanoparticle Seed-Mediated Growth Allows Reliable Detection of Disease Biomarkers with the Naked Eye. Anal. Chem. 2015, 87, 5891–5896. [Google Scholar] [CrossRef] [PubMed]
- Cecchin, D.; de la Rica, R.; Bain, R.E.S.; Finnis, M.W.; Stevens, M.M.; Battaglia, G. Plasmonic ELISA for the detection of gp120 at ultralow concentrations with the naked eye. Nanoscale 2014, 6, 9559–9562. [Google Scholar] [CrossRef] [PubMed]
- Chang, C.-C.; Chen, C.-P.; Wu, T.-H.; Yang, C.-H.; Lin, C.-W.; Chen, C.-Y. Gold Nanoparticle-Based Colorimetric Strategies for Chemical and Biological Sensing Applications. Nanomaterials 2019, 9, 861. [Google Scholar] [CrossRef] [PubMed]
- Sabela, M.; Balme, S.; Bechelany, M.; Janot, J.-M.; Bisetty, K. A Review of Gold and Silver Nanoparticle-Based Colorimetric Sensing Assays. Adv. Eng. Mater. 2017, 19, 1700270. [Google Scholar] [CrossRef]
- Mancuso, M.; Jiang, L.; Cesarman, E.; Erickson, D. Multiplexed Colorimetric Detection of Kaposi’s Sarcoma Associated Herpesvirus and Bartonella DNA using Gold and Silver Nanoparticles. Nanoscale 2013, 5, 1678–1686. [Google Scholar] [CrossRef]
- Heo, J.H.; Yi, G.S.; Lee, B.S.; Cho, H.H.; Lee, J.W.; Lee, J.H. A significant enhancement of color transition from an on-off type achromatic colorimetric nanosensor for highly sensitive multi-analyte detection with the naked eye. Nanoscale 2016, 8, 18341–18351. [Google Scholar] [CrossRef]
- Di, H.; Mi, Z.; Sun, Y.; Liu, X.; Liu, X.; Li, A.; Jiang, Y.; Gao, H.; Rong, P.; Liu, D. Nanozyme-assisted sensitive profiling of exosomal proteins for rapid cancer diagnosis. Theranostics 2020, 10, 9303–9314. [Google Scholar] [CrossRef]
- Lee, H.; Gao, X.; Kim, Y.-P. Immuno-Nanoparticles for Multiplex Protein Imaging in Cells and Tissues. BioChip J. 2018, 12, 83–92. [Google Scholar] [CrossRef]
- Schlücker, S. Surface-enhanced Raman spectroscopy: Concepts and chemical applications. Angew. Chem. Int. Ed. 2014, 53, 4756–4795. [Google Scholar] [CrossRef]
- Lee, S.; Chon, H.; Yoon, S.-Y.; Lee, E.K.; Chang, S.-I.; Lim, D.W.; Choo, J. Fabrication of SERS-fluorescence dual modal nanoprobes and application to multiplex cancer cell imaging. Nanoscale 2012, 4, 124–129. [Google Scholar] [CrossRef]
- Lee, S.; Chon, H.; Lee, J.; Ko, J.; Chung, B.H.; Lim, D.W.; Choo, J. Rapid and sensitive phenotypic marker detection on breast cancer cells using surface-enhanced Raman scattering (SERS) imaging. Biosens. Bioelectron. 2014, 51, 238–243. [Google Scholar] [CrossRef] [PubMed]
- Sun, C.; Zhang, L.; Zhang, R.; Gao, M.; Zhang, X. Facilely synthesized polydopamine encapsulated surface-enhanced Raman scattering (SERS) probes for multiplex tumor associated cell surface antigen detection using SERS imaging. RSC Adv. 2015, 5, 72369–72372. [Google Scholar] [CrossRef]
- Li, J.; Wang, J.; Grewal, Y.S.; Howard, C.B.; Raftery, L.J.; Mahler, S.; Wang, Y.; Trau, M. Multiplexed SERS Detection of Soluble Cancer Protein Biomarkers with Gold–Silver Alloy Nanoboxes and Nanoyeast Single-Chain Variable Fragments. Anal. Chem. 2018, 90, 10377–10384. [Google Scholar] [CrossRef] [PubMed]
- Li, M.; Wu, J.; Ma, M.; Feng, Z.; Mi, Z.; Rong, P.; Liu, D. Alkyne- and Nitrile-Anchored Gold Nanoparticles for Multiplex SERS Imaging of Biomarkers in Cancer Cells and Tissues. Nanotheranostics 2019, 3, 113–119. [Google Scholar] [CrossRef] [PubMed]
- Fothergill, S.M.; Joyce, C.; Xie, F. Metal enhanced fluorescence biosensing: From ultra-violet towards second near-infrared window. Nanoscale 2018, 10, 20914–20929. [Google Scholar] [CrossRef] [PubMed]
- Della Ventura, B.; Gelzo, M.; Battista, E.; Alabastri, A.; Schirato, A.; Castaldo, G.; Corso, G.; Gentile, F.; Velotta, R. Biosensor for Point-of-Care Analysis of Immunoglobulins in Urine by Metal Enhanced Fluorescence from Gold Nanoparticles. ACS Appl. Mater. Interfaces 2019, 11, 3753–3762. [Google Scholar] [CrossRef]
- Zhang, Q.; Wu, L.; Wong, T.I.; Zhang, J.; Liu, X.; Zhou, X.; Bai, P.; Liedberg, B.; Wang, Y. Surface plasmon-enhanced fluorescence on Au nanohole array for prostate-specific antigen detection. Int. J. Nanomed. 2017, 12, 2307–2314. [Google Scholar] [CrossRef]
- Wang, Y.; Li, H.; Xu, D. Aptamers-based sandwich assay for silver-enhanced fluorescence multiplex detection. Anal. Chim. Acta 2016, 905, 149–155. [Google Scholar] [CrossRef]
- Liu, B.; Li, Y.; Wan, H.; Wang, L.; Xu, W.; Zhu, S.; Liang, Y.; Zhang, B.; Lou, J.; Dai, H.; et al. High Performance, Multiplexed Lung Cancer Biomarker Detection on a Plasmonic Gold Chip. Adv. Funct. Mater. 2016, 26, 7994–8002. [Google Scholar] [CrossRef]
- Zhang, B.; Kumar, R.B.; Dai, H.; Feldman, B.J. A plasmonic chip for biomarker discovery and diagnosis of type 1 diabetes. Nat. Med. 2014, 20, 948–953. [Google Scholar] [CrossRef]
- Zhang, B.; Pinsky, B.A.; Ananta, J.S.; Zhao, S.; Arulkumar, S.; Wan, H.; Sahoo, M.K.; Abeynayake, J.; Waggoner, J.J.; Hopes, C.; et al. Diagnosis of Zika virus infection on a nanotechnology platform. Nat. Med. 2017, 23, 548–550. [Google Scholar] [CrossRef] [PubMed]
- Min, J.; Son, T.; Hong, J.-S.; Cheah, P.S.; Wegemann, A.; Murlidharan, K.; Weissleder, R.; Lee, H.; Im, H. Plasmon-Enhanced Biosensing for Multiplexed Profiling of Extracellular Vesicles. Adv. Biosyst. 2020, 2000003. [Google Scholar] [CrossRef] [PubMed]
- Liu, T.; Hsiung, J.; Zhao, S.; Kost, J.; Sreedhar, D.; Hanson, C.V.; Olson, K.; Keare, D.; Chang, S.T.; Bliden, K.P.; et al. Quantification of antibody avidities and accurate detection of SARS-CoV-2 antibodies in serum and saliva on plasmonic substrates. Nat. Biomed. Eng. 2020, 1–9. [Google Scholar] [CrossRef] [PubMed]
- Gorris, H.H.; Wolfbeis, O.S. Photon-Upconverting Nanoparticles for Optical Encoding and Multiplexing of Cells, Biomolecules, and Microspheres. Angew. Chem. Int. Ed. 2013, 52, 3584–3600. [Google Scholar] [CrossRef] [PubMed]
- Chen, F.; Bu, W.; Cai, W.; Shi, J. Functionalized Upconversion Nanoparticles: Versatile Nanoplatforms for Translational Research. Curr. Mol. Med. 2013, 13, 1613–1632. [Google Scholar] [CrossRef] [PubMed][Green Version]
- Gorris, H.H.; Ali, R.; Saleh, S.M.; Wolfbeis, O.S. Tuning the dual emission of photon-upconverting nanoparticles for ratiometric multiplexed encoding. Adv. Mater. 2011, 23, 1652–1655. [Google Scholar] [CrossRef] [PubMed]
- Zhang, F.; Haushalter, R.C.; Haushalter, R.W.; Shi, Y.; Zhang, Y.; Ding, K.; Zhao, D.; Stucky, G.D. Rare Earth Upconverting Nanobarcodes for Multiplexed Biological Detection. Small 2011, 7, 1972–1976. [Google Scholar] [CrossRef] [PubMed]
- Zhang, Y.; Dong, C.; Su, L.; Wang, H.; Gong, X.; Wang, H.; Liu, J.; Chang, J. Multifunctional Microspheres Encoded with Upconverting Nanocrystals and Magnetic Nanoparticles for Rapid Separation and Immunoassays. ACS Appl. Mater. Interfaces 2016, 8, 745–753. [Google Scholar] [CrossRef] [PubMed]
- Kazakova, A.; Kakkola, L.; Päkkilä, H.; Teros-Jaakkola, T.; Soukka, T.; Peltola, V.; Waris, M.; Julkunen, I. Serological Array-in-Well Multiplex Assay Reveals a High Rate of Respiratory Virus Infections and Reinfections in Young Children. mSphere 2019, 4. [Google Scholar] [CrossRef] [PubMed]
- Li, H.; Tan, M.; Wang, X.; Li, F.; Zhang, Y.; Zhao, L.; Yang, C.; Chen, G. Temporal Multiplexed In Vivo Upconversion Imaging. J. Am. Chem. Soc. 2020, 142, 2023–2030. [Google Scholar] [CrossRef] [PubMed]
- Fan, Y.; Wang, P.; Lu, Y.; Wang, R.; Zhou, L.; Zheng, X.; Li, X.; Piper, J.A.; Zhang, F. Lifetime-engineered NIR-II nanoparticles unlock multiplexed in vivo imaging. Nat. Nanotechnol. 2018, 13, 941–946. [Google Scholar] [CrossRef] [PubMed]
- Zhang, H.; Fan, Y.; Pei, P.; Sun, C.; Lu, L.; Zhang, F. Tm3+-Sensitized NIR-II Fluorescent Nanocrystals for In Vivo Information Storage and Decoding. Angew. Chem. 2019, 131, 10259–10263. [Google Scholar] [CrossRef]
- Tian, R.; Ma, H.; Zhu, S.; Lau, J.; Ma, R.; Liu, Y.; Lin, L.; Chandra, S.; Wang, S.; Zhu, X.; et al. Multiplexed NIR-II Probes for Lymph Node-Invaded Cancer Detection and Imaging-Guided Surgery. Adv. Mater. 2020, 32, 1907365. [Google Scholar] [CrossRef] [PubMed]
- Li, L.; Liu, C.; Cao, X.; Tan, L.; Lu, W. Multiplexing determination of cancer-associated biomarkers by surface-enhanced Raman scattering using ordered gold nanohoneycomb arrays. Bioanalysis 2017, 9, 1561–1572. [Google Scholar] [CrossRef] [PubMed]
- Ou, Y.-C.; Webb, J.A.; O’Brien, C.M.; Pence, I.J.; Lin, E.C.; Paul, E.P.; Cole, D.; Ou, S.-H.; Lapierre-Landry, M.; DeLapp, R.C.; et al. Diagnosis of immunomarkers in vivo via multiplexed surface enhanced Raman spectroscopy with gold nanostars. Nanoscale 2018, 10, 13092–13105. [Google Scholar] [CrossRef] [PubMed]
- Li, C.; Li, G.; Liu, H.; Xiao, Z.; Jin, M.; Yuan, C. A novel gold nanoparticles decorated magnetic microbead-based molecular beacon for DNA multiplexing detection by flow cytometry. Anal. Chim. Acta 2020, 1110, 19–25. [Google Scholar] [CrossRef] [PubMed]
- Jiang, Y.; Tang, Y.; Miao, P. Polydopamine nanosphere@silver nanoclusters for fluorescence detection of multiplex tumor markers. Nanoscale 2019, 11, 8119–8123. [Google Scholar] [CrossRef]


| Nanoparticles | Method | Number of Analytes | Detection Range | Detection Limit | Reference |
|---|---|---|---|---|---|
| Quantum dots | QLISA | 3 | 30–1000 ng/mL | 30 ng/mL | [18] |
| Quantum dots | QLISA | 3 | 0.05–10 ng/mL | 5 pg/mL | [19] |
| Quantum dots | Magnetic bead–quantum dot assay | 3 | 1.03–111 ng/mL 9.26–1000 ng/mL | 0.19ng/mL 0.97ng/mL 0.37ng/mL | [30] |
| Quantum dots | Magnetic bead–quantum dot assay | 3 | 3.9–125.0 ng/mL | 364 pg/mL 38 pg/mL 370 pg/mL | [31] |
| Quantum dots | Magnetic bead–quantum dot assay | 3 | - | - | [32] |
| Quantum dots | Magnetic bead–quantum dot assay | 5 | - | 0.01–0.06 ng/mL 0.06–1.5 KU/L | [33] |
| Quantum dots | Magnetic bead–quantum dot assay | 5 | - | 0.01–0.02 IU/mL | [34] |
| Quantum dots | Flow cytometry | 2 | 0.52–30 ng/mL 0.13–10 ng/mL | - | [35] |
| Quantum dots | Flow cytometry | 3 | 7–10 ng/mL | [36] | |
| Quantum dots | Electrochemical immunoassay | 2 | 0.001–0.1 pg/mL | 0.4 fg/mL | [40] |
| Quantum dots | Electrochemical immunoassay | 2 | 10−6–1 U/mL 10−4–100 U/mL | 0.1 μU/mL 10 μU/mL | [41] |
| Quantum dots | Immunocytochemistry | 2 | - | - | [42] |
| Quantum dots | Immunocytochemistry Immunohistochemistry | 5 | - | - | [43] |
| Quantum dots | Immunohistochemistry | 4 | - | - | [44] |
| Quantum dots | Immunohistochemistry | 2 | - | - | [45] |
| Quantum dots | Immunochromatographic dipstick method | 2 | 1–50 ng/mL 5–50 ng/mL | 37.8 pg/mL 42.6 pg/mL | [48] |
| Quantum dots | Lateral flow assay | 2 | 1.3–480 ng/mL 2.8–680 ng/mL | 0.16 ng/mL 0.35 ng/mL | [49] |
| Quantum dots | Microfluidic system | 2 | 1.0–40 ng/mL | 0.3 ng/mL 0.4 ng/mL | [50] |
| Gold nanorods | LSPR spectroscopy | 2 | - | - | [57] |
| Gold and silver nanoparticles | Colorimetric Spectroscopy | 2 | - | 2 nM 1 nM | [67] |
| Gold and silver nanoparticles | Colorimetric Spectroscopy | 2 | 15–40 nM | 19 nM | [68] |
| Gold nanoparticle decorated exosomes | Colorimetric Spectroscopy | 5 | - | - | [69] |
| Silica encapsulated gold nanoparticles | SERS-based cell imaging | 2 | - | - | [72] |
| Silica encapsulated gold nanospheres | SERS-based cell imaging | 3 | - | - | [73] |
| Polydopamine encapsulated gold nanoparticles | SERS-based imaging | 3 | - | - | [74] |
| Gold-silver alloy nanoboxes | SERS | 3 | - | 6.17 pg/mL 0.68 pg/mL 69.86 pg/mL | [75] |
| Gold nanoparticles | SERS-based imaging | 3 | - | - | [76] |
| Gold nanoparticles | SERS | 2 | 0.5–100 ng/mL | 0.41 ng/mL 0.35 ng/mL | [96] |
| Gold nanoparticles | SERS | 2 | - | - | [97] |
| Silver nanoparticles | PEF-based immunoassay | 2 | 0.0556–13.5 nM 0.625–20 nM | 6.2 pM 156 pM | [80] |
| Gold nanoislands | PEF-based immunoassay | 3 | 0.1–100 ng/mL | 0.05 ng/mL 0.15 ng/mL 0.19 ng/mL | [96] |
| Gold nanoholes | PEF-based fluorescence microscopy | 4 | - | - | [84] |
| Upconverting nanoparticles | Spectroscopy | 2 | - | - | [88] |
| Upconverting nanoparticles | Confocal luminescence imaging | 6 | - | - | [89] |
| Upconverting nanocrystals encoded magnetic microspheres | Fluorescence microscopy Flow cytometry | Shown 2 Potentially 6 | - | 0.01 ng/mL | [90] |
| Upconverting nanoparticles | Microarray immunoassay | 7 | - | - | [91] |
| Upconverting nanoparticles | UCL intensity and lifetime imaging | 3 | - | - | [92] |
| RENPs | Lifetime imaging | 3 | - | - | [93] |
| Gold nanoparticles | Flow cytometry | 3 | 0.2–20 nM | 0.4 nM 0.1 nM 0.2 nM | [98] |
| Silver nanoclusters | Spectroscopy | 2 | 10–100 nM | 2.4 nM 5.6 nM | [99] |
Publisher’s Note: MDPI stays neutral with regard to jurisdictional claims in published maps and institutional affiliations. |
© 2020 by the authors. Licensee MDPI, Basel, Switzerland. This article is an open access article distributed under the terms and conditions of the Creative Commons Attribution (CC BY) license (http://creativecommons.org/licenses/by/4.0/).
Share and Cite
Jarockyte, G.; Karabanovas, V.; Rotomskis, R.; Mobasheri, A. Multiplexed Nanobiosensors: Current Trends in Early Diagnostics. Sensors 2020, 20, 6890. https://doi.org/10.3390/s20236890
Jarockyte G, Karabanovas V, Rotomskis R, Mobasheri A. Multiplexed Nanobiosensors: Current Trends in Early Diagnostics. Sensors. 2020; 20(23):6890. https://doi.org/10.3390/s20236890
Chicago/Turabian StyleJarockyte, Greta, Vitalijus Karabanovas, Ricardas Rotomskis, and Ali Mobasheri. 2020. "Multiplexed Nanobiosensors: Current Trends in Early Diagnostics" Sensors 20, no. 23: 6890. https://doi.org/10.3390/s20236890
APA StyleJarockyte, G., Karabanovas, V., Rotomskis, R., & Mobasheri, A. (2020). Multiplexed Nanobiosensors: Current Trends in Early Diagnostics. Sensors, 20(23), 6890. https://doi.org/10.3390/s20236890