Computational Diagnostic Techniques for Electrocardiogram Signal Analysis


Abstract
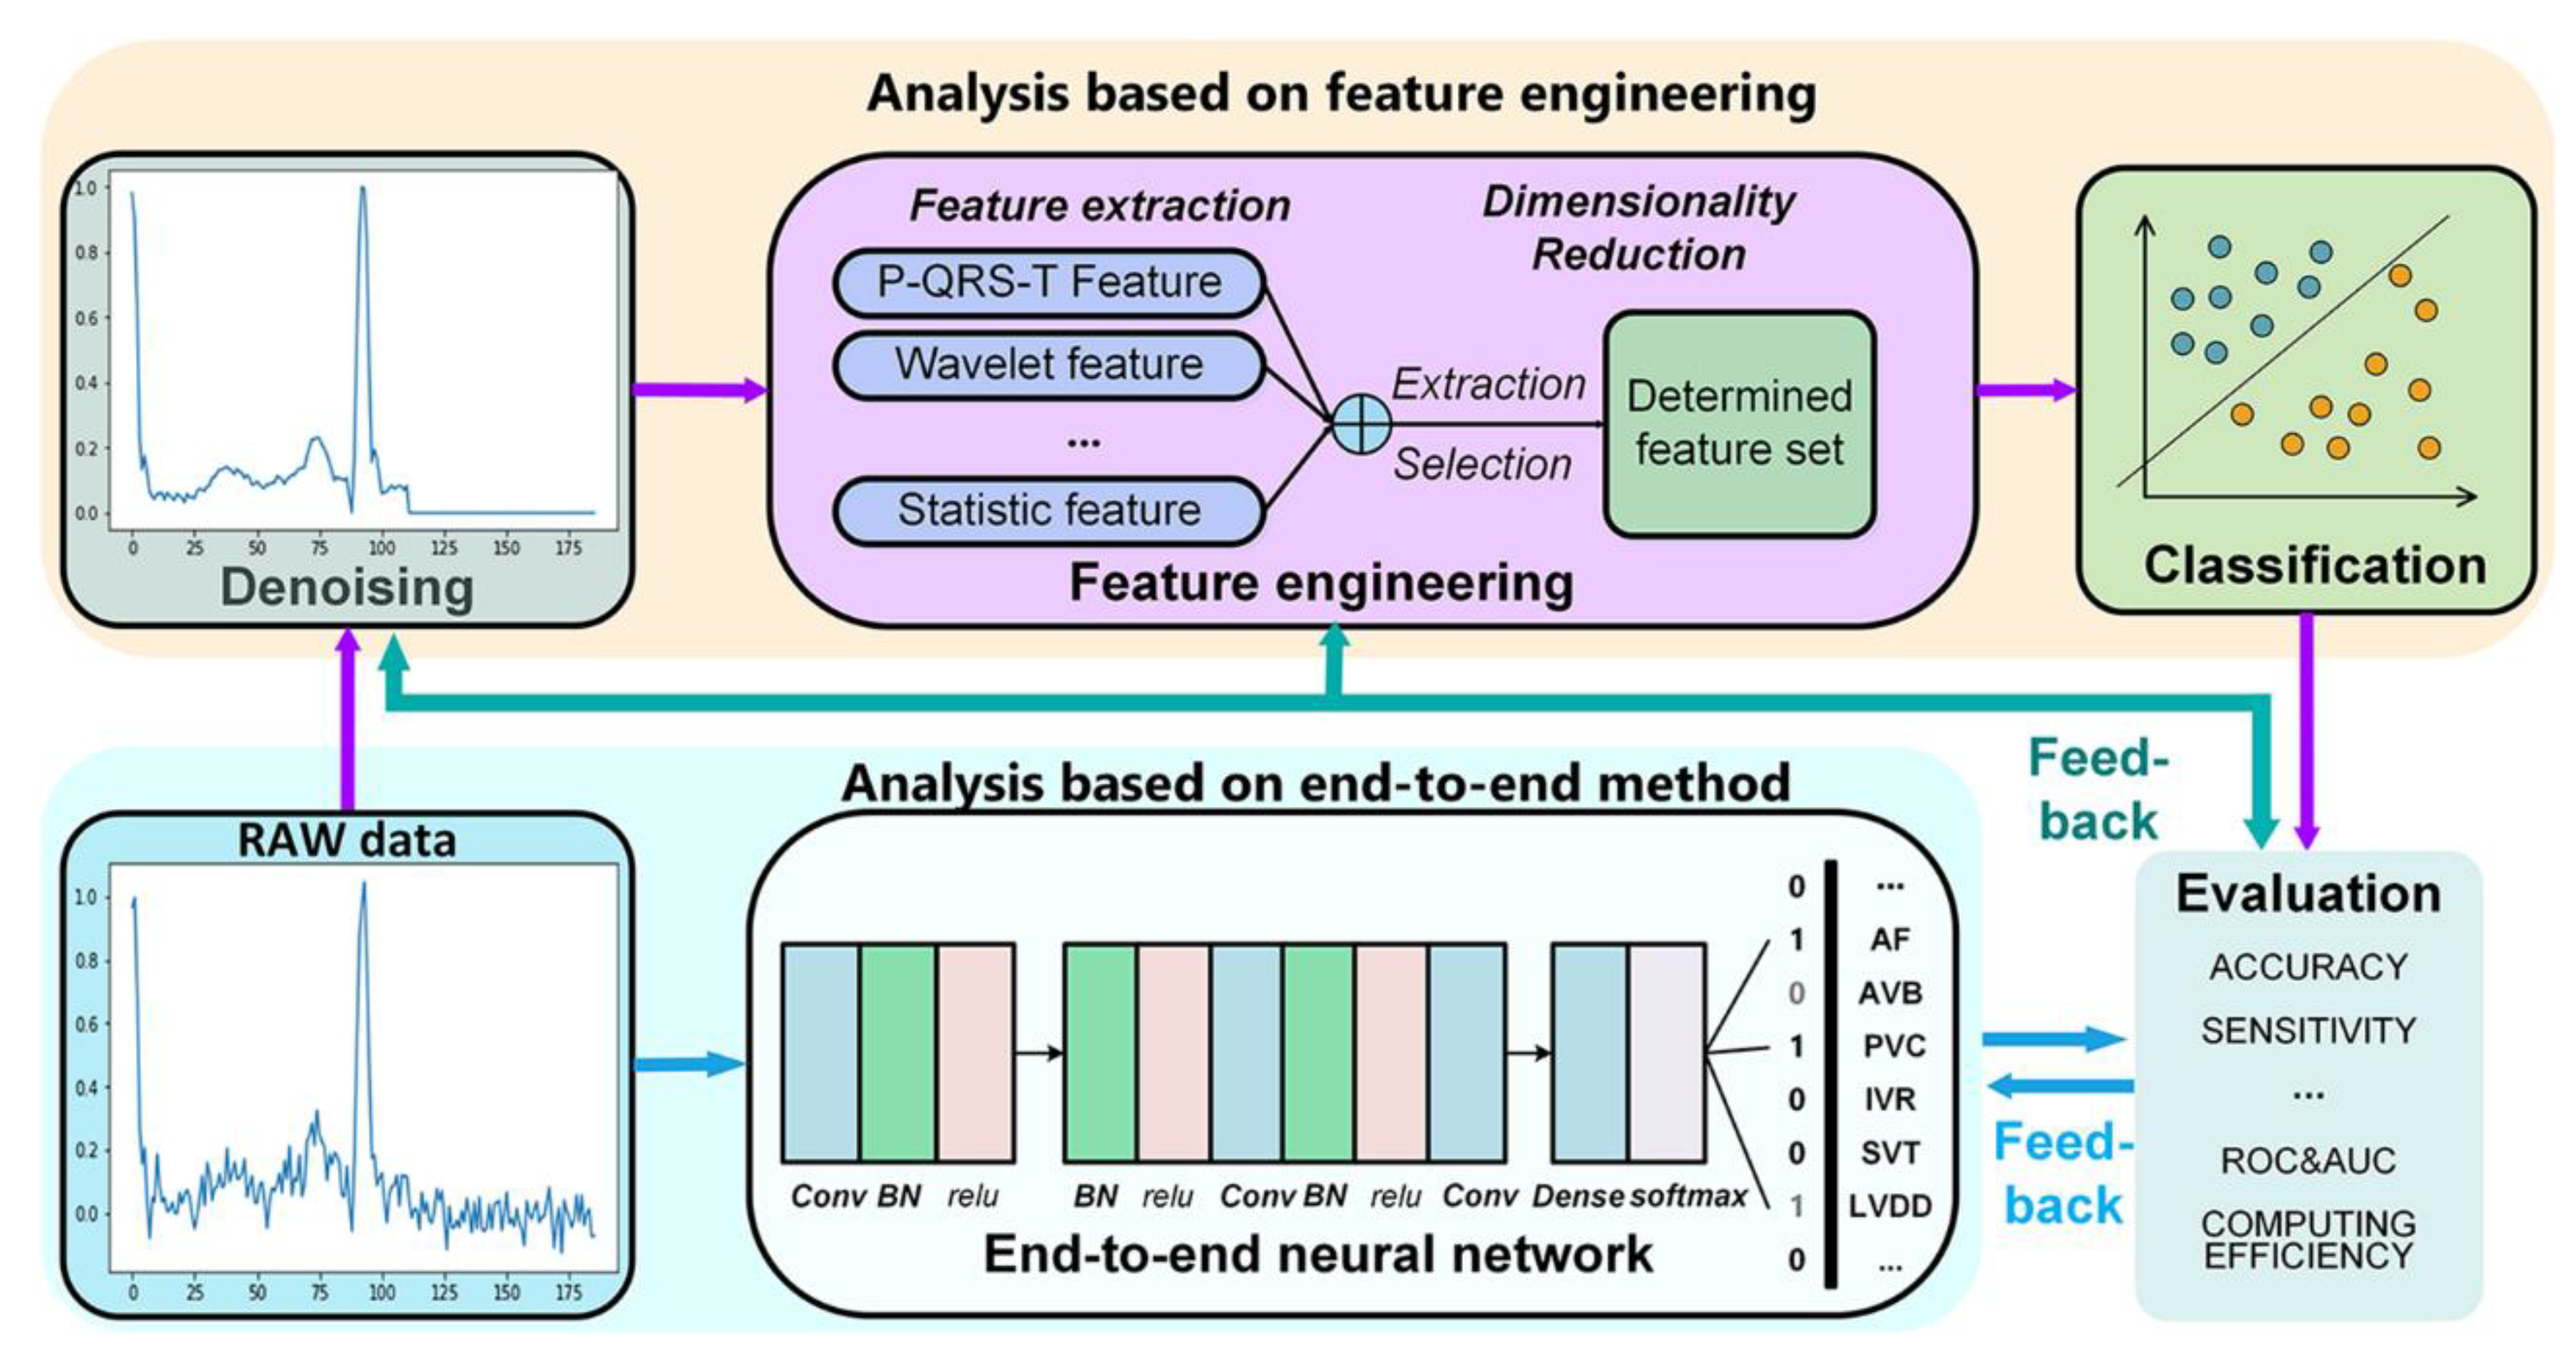
1. Introduction
2. Data Preprocessing
2.1. Noise in Electrocardiogram (ECG)
2.2. Methods of ECG Denoising
3. Feature Engineering
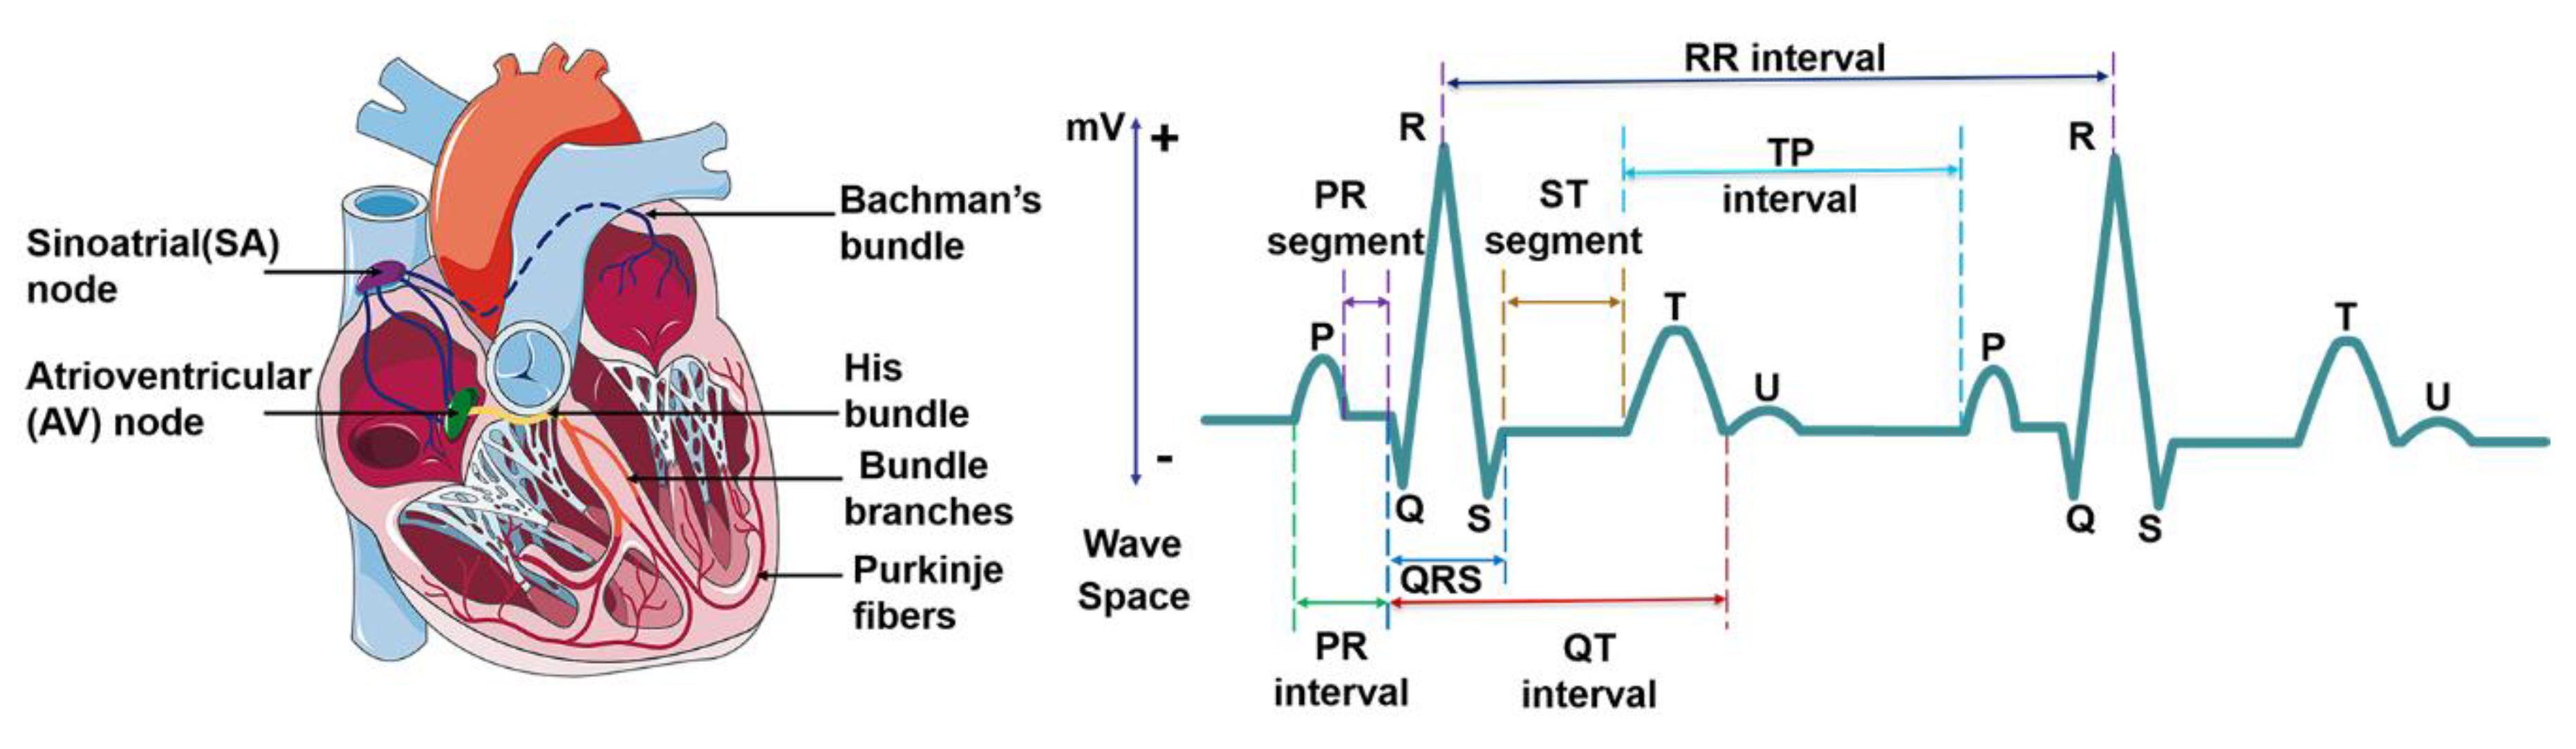
3.1. Features for Disease Diagnosis
3.1.1. P-QRS-T Complex Feature
3.1.2. Fourier Transform Feature
3.1.3. Wavelet Feature
3.1.4. Statistical and Morphological Features
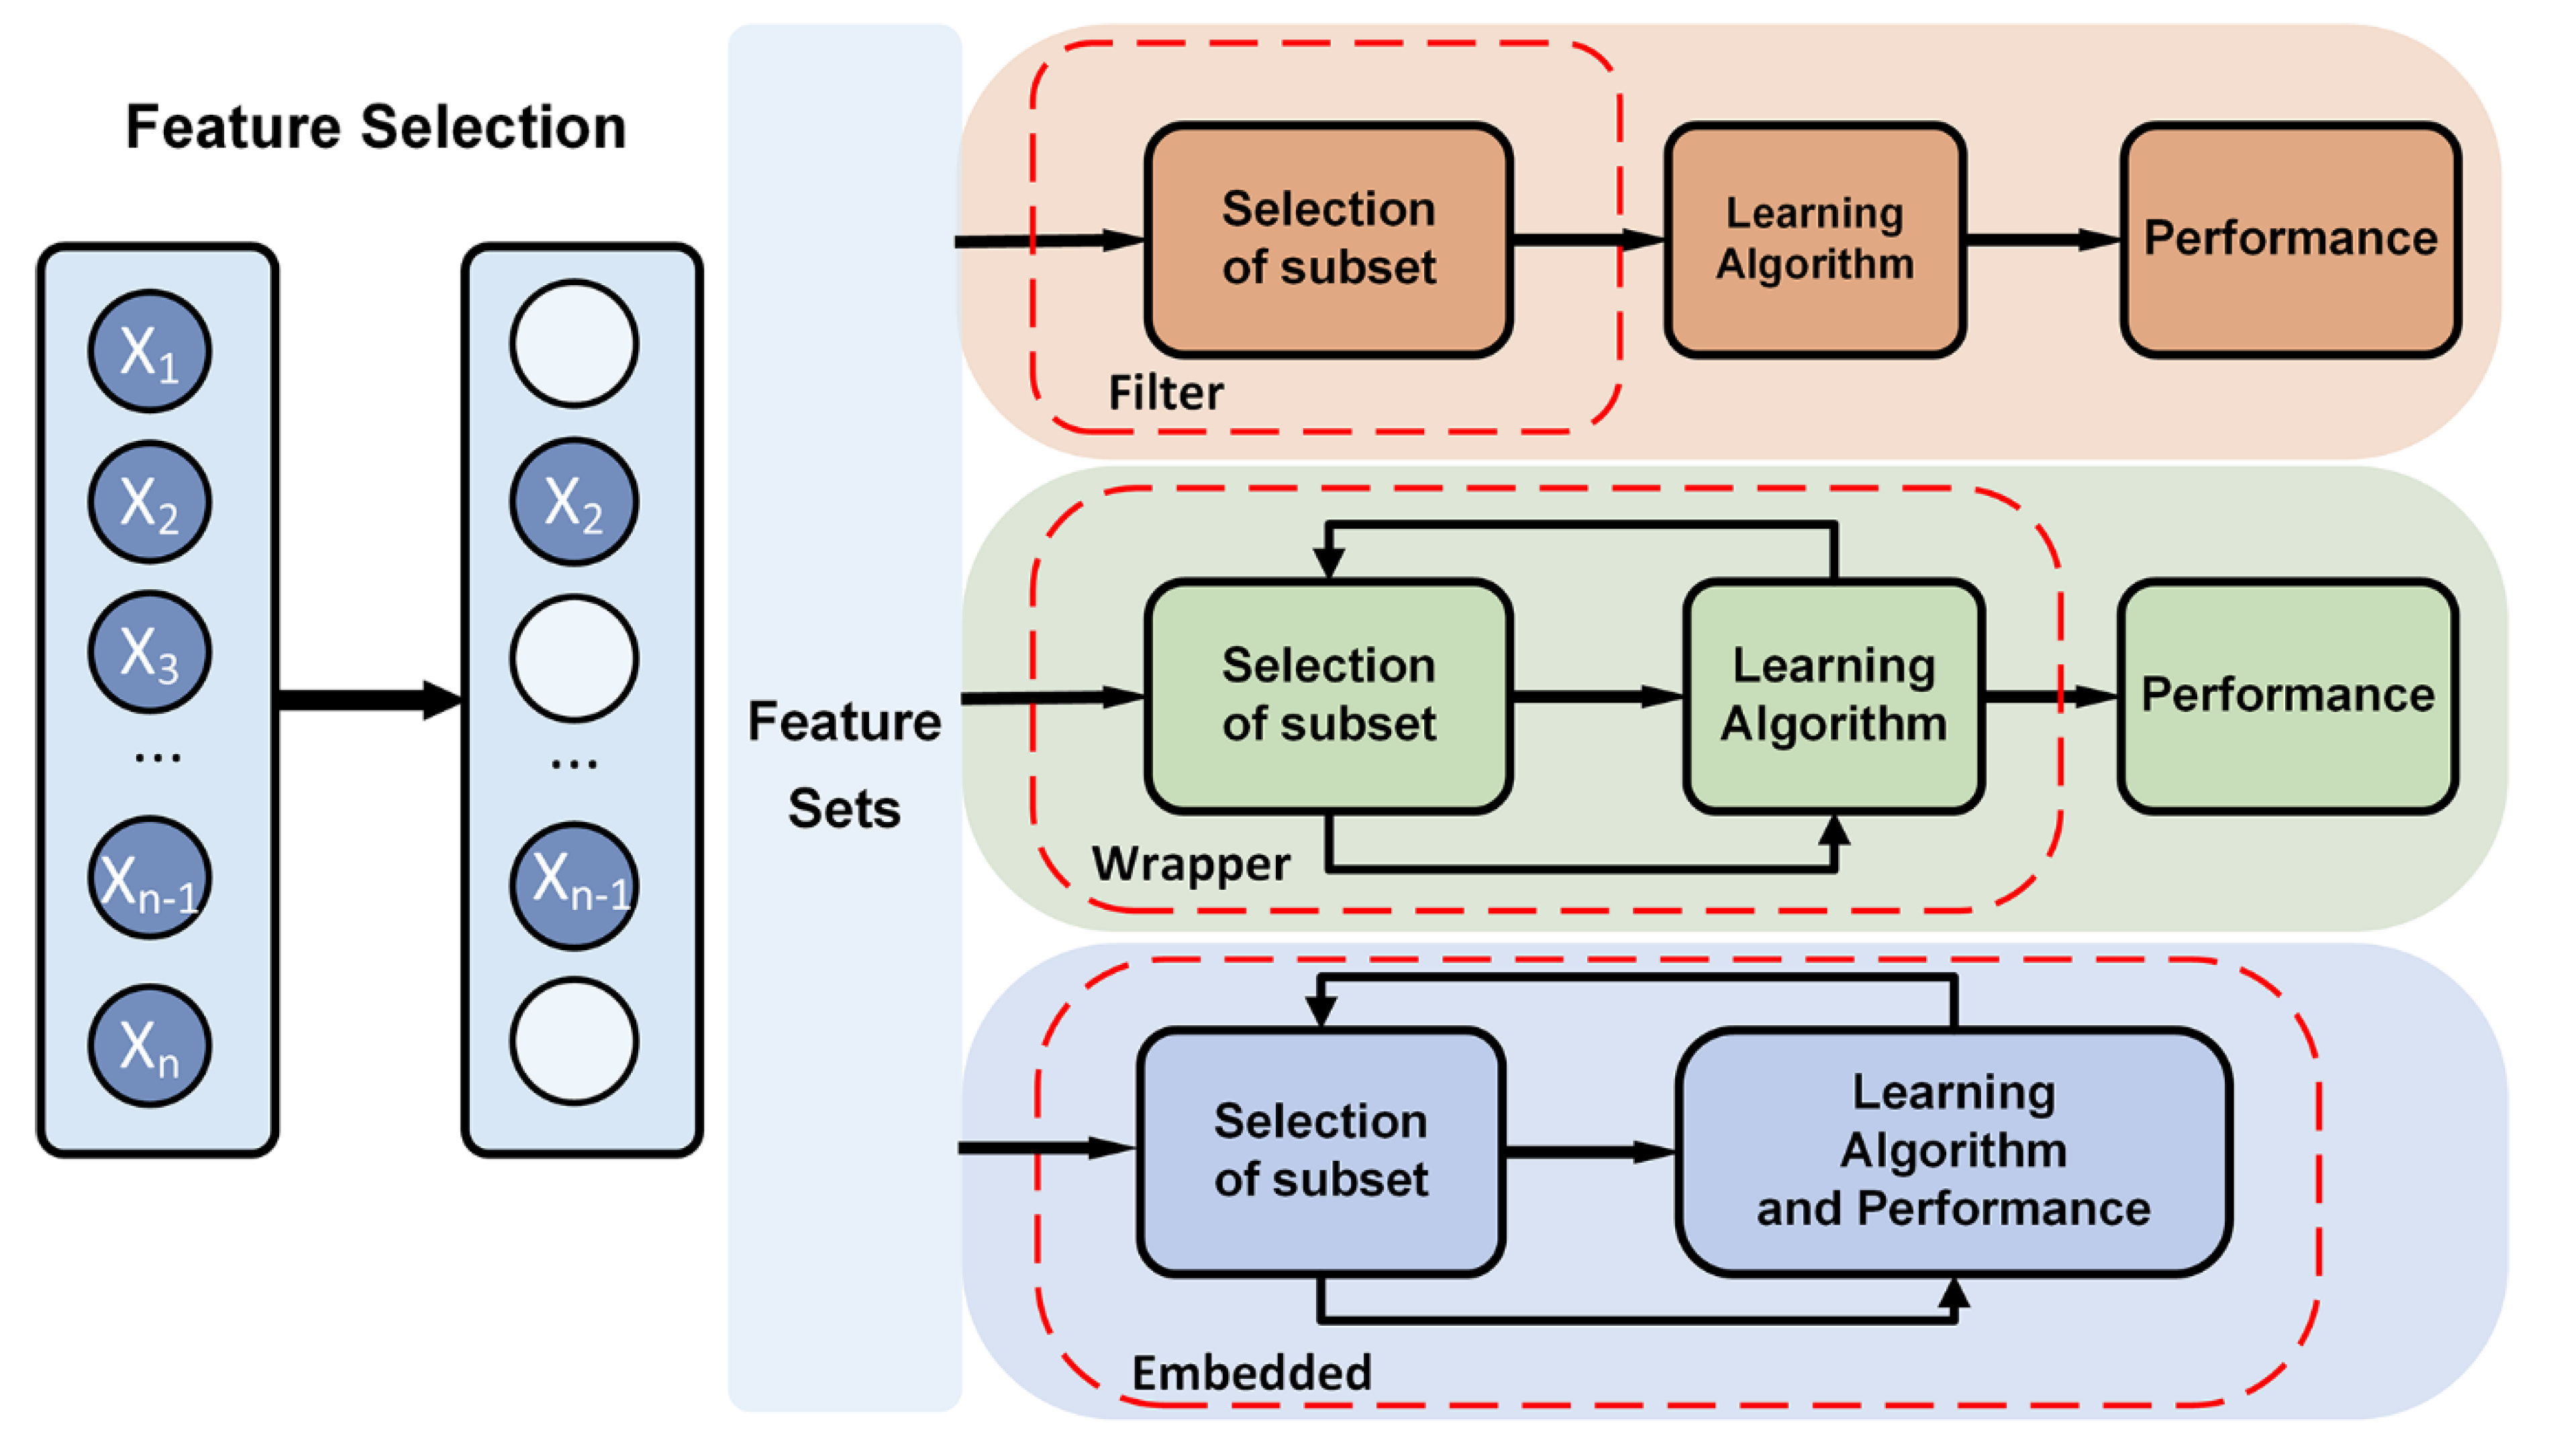
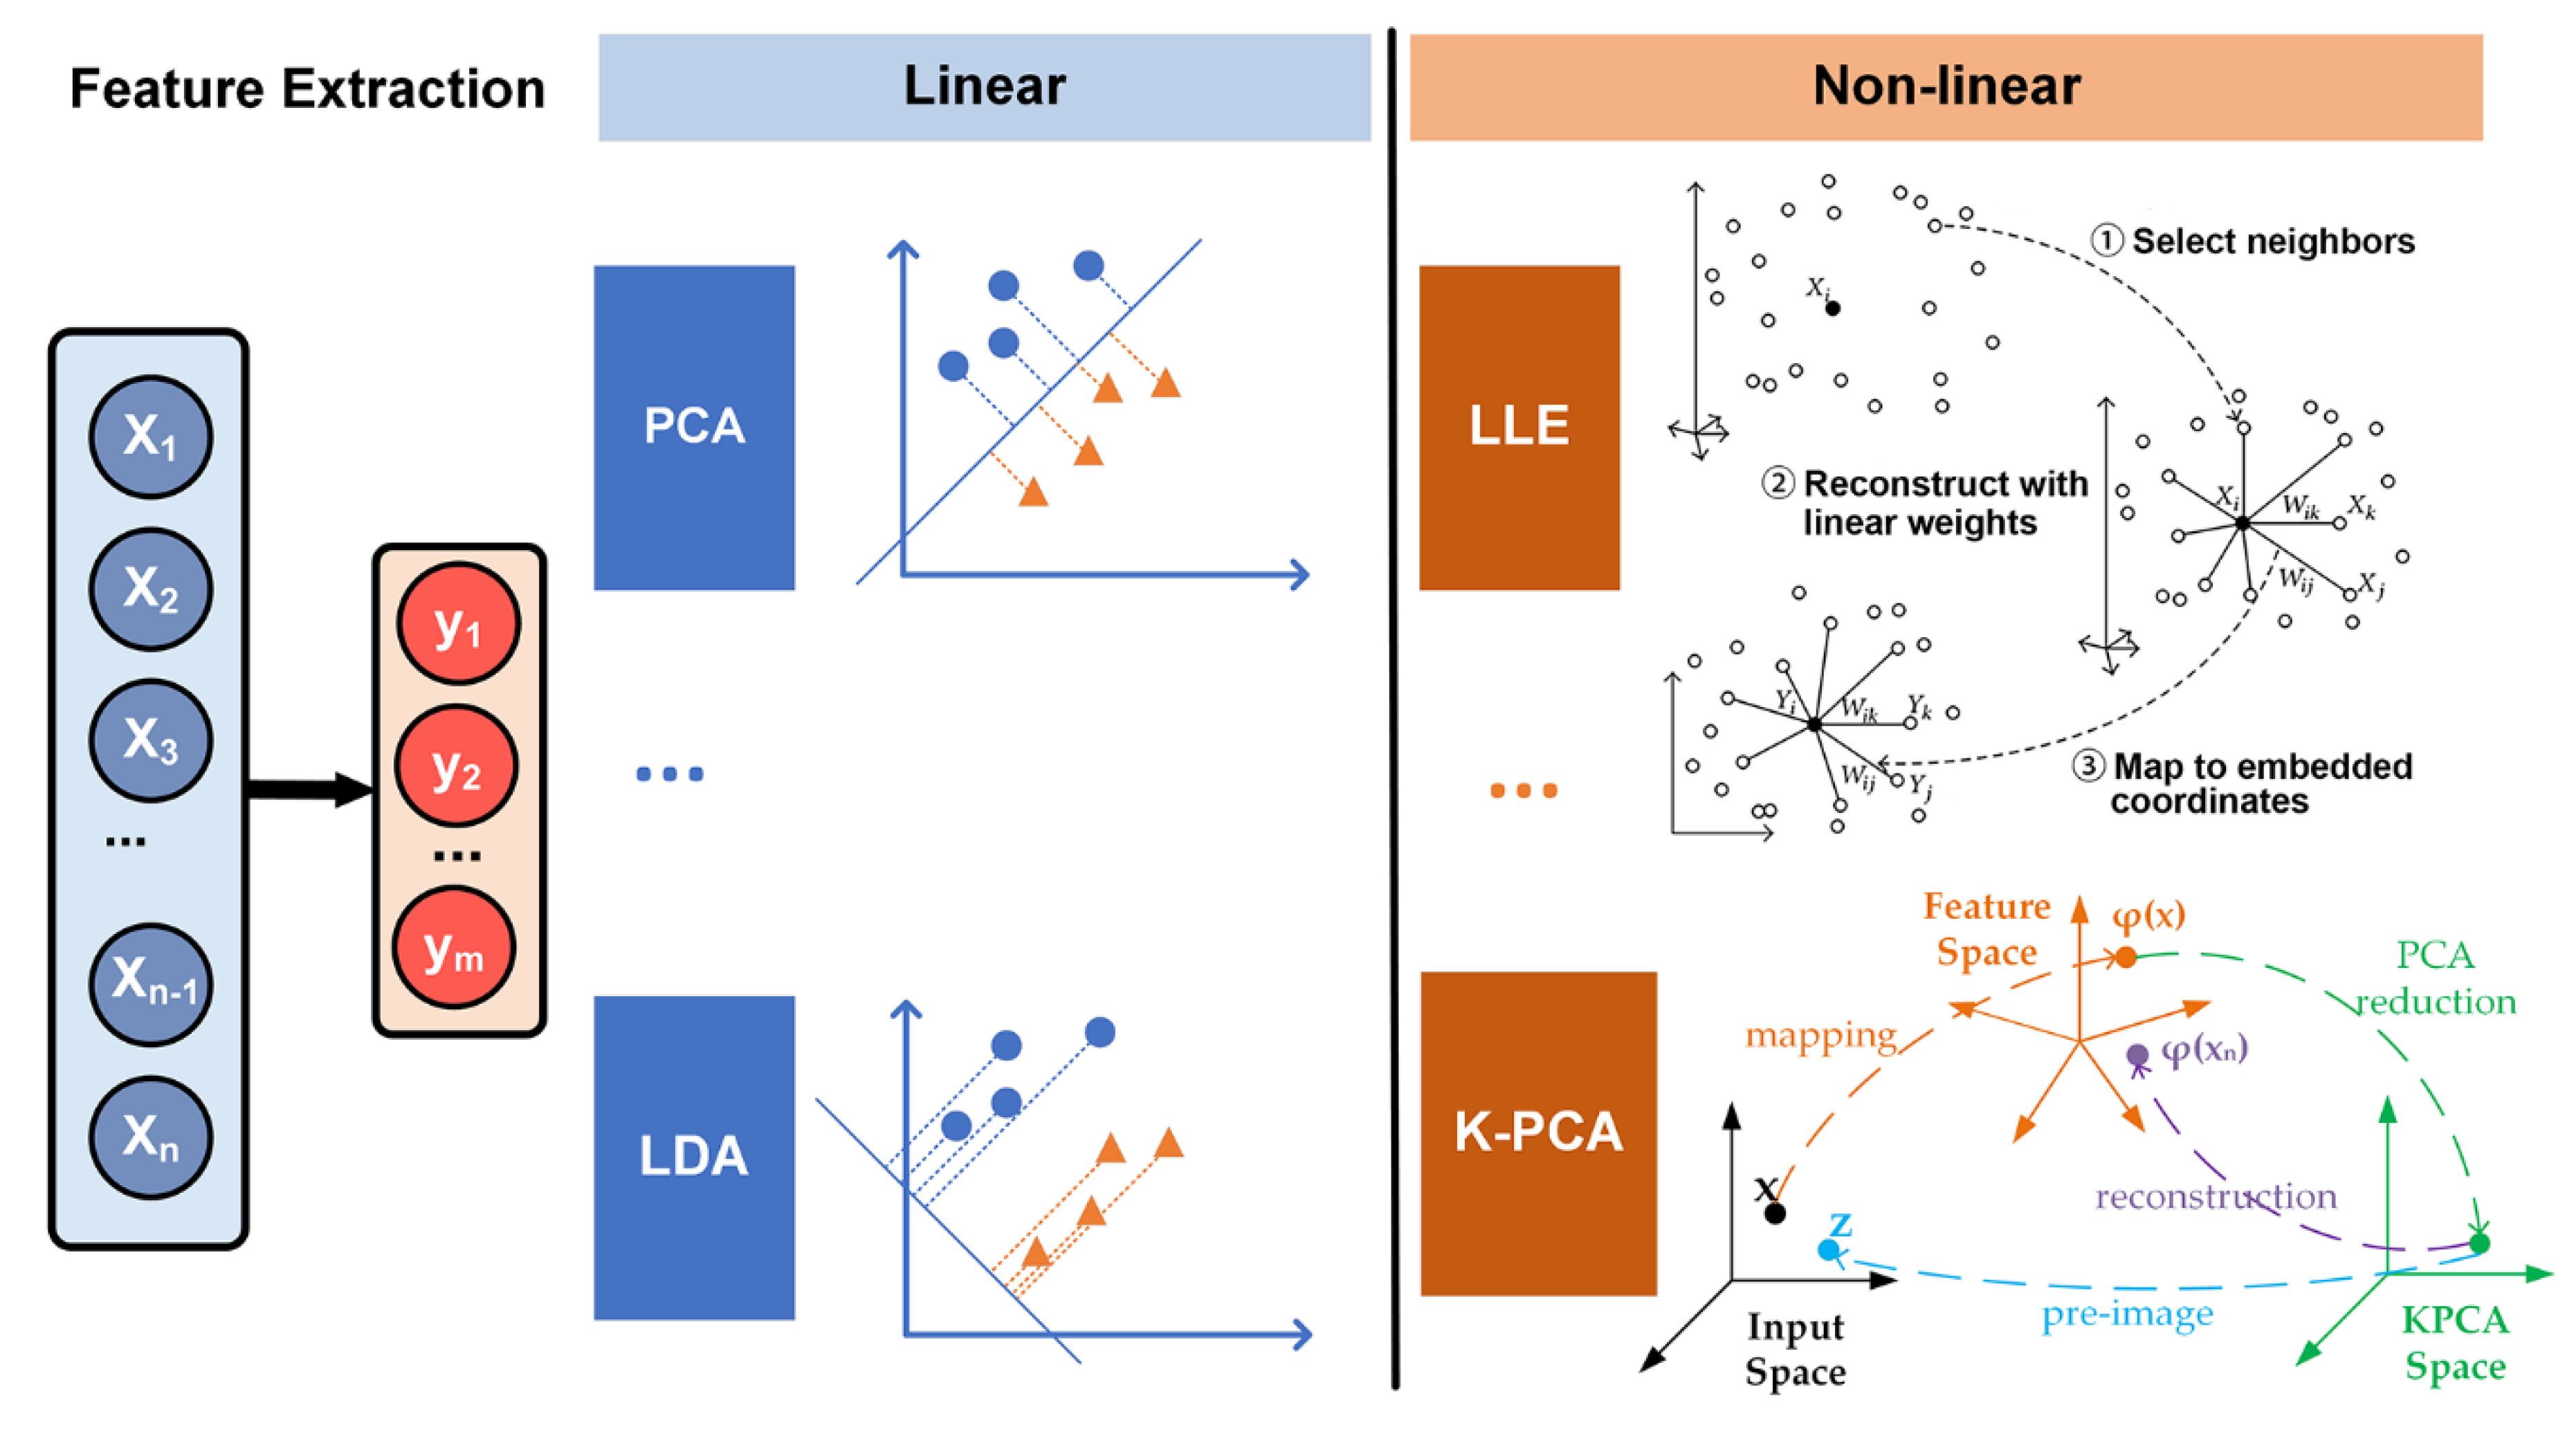
3.2. Dimensionality Reduction
3.2.1. Feature selection
3.2.2. Feature Extraction
4. Classification
4.1. Machine Learning Classifier
4.2. End-To-End Model
5. Electrocardiogram (ECG) Databases
6. Applications
6.1. Disease Diagnosis
6.2. Prediction of Cardiovascular Disease
6.3. The Trend of Portability and the Eise of Photoplethysmography(PPG)
7. Conclusions
Author Contributions
Funding
Conflicts of Interest
References
- Emelia, J.; Benjamin, S.S.V.; Clifton, W.; Callaway, A.M.C.; Alexander, R.; Chang, S.C.; Stephanie, E.; Chiuve, M.C.; Francesca, N.; Delling, R.D.; et al. Heart Disease and Stroke Statistics—2018 Update: A Report from the American Heart Association. Circulation 2018, 137, e67–e492. [Google Scholar]
- Luz, E.J.D.S.; Schwartz, W.R.; Cámara-Chávez, G.; Menotti, D. ECG-based heartbeat classification for arrhythmia detection: A survey. Comput. Meth. Prog. Biomed. 2016, 127, 144–164. [Google Scholar] [CrossRef] [PubMed]
- Kaplan Berkaya, S.; Uysal, A.K.; Sora Gunal, E.; Ergin, S.; Gunal, S.; Gulmezoglu, M.B. A survey on ECG analysis. Biomed. Signal Process. 2018, 43, 216–235. [Google Scholar] [CrossRef]
- Besterman, E.; Creese, R. Waller—pioneer of electrocardiography. Heart 1979, 42, 61–64. [Google Scholar] [CrossRef][Green Version]
- Schijvenaars, B.J.A.; Kors, J.A.; van Herpen, G.; Kornreich, F.; van Bemmel, J.H. Effect of electrode positioning on ECG interpretation by computer. J. Electrocardiol. 1997, 30, 247–256. [Google Scholar] [CrossRef]
- Attia, Z.I.; Noseworthy, P.A.; Lopez-Jimenez, F.; Asirvatham, S.J.; Deshmukh, A.J.; Gersh, B.J.; Carter, R.E.; Yao, X.; Rabinstein, A.A.; Erickson, B.J.; et al. An artificial intelligence-enabled ECG algorithm for the identification of patients with atrial fibrillation during sinus rhythm: A retrospective analysis of outcome prediction. Lancet 2019, 394, 861–867. [Google Scholar] [CrossRef]
- Robert, C.; Schlant, M.C.; Robert, J.; Adolph, M.; John, P.; DiMarco, M.P.; Leonard, S.; Dreifus, M.; Marvin, I.; Dunn, M.; et al. Guidelines for electrocardiography: A report of the American College of Cardiology/American Heart Association Task Force on assessment of diagnostic and therapeutic cardiovascular procedures (Committee on Electrocardiography). J. Am. Coll. Cardiol. 1992, 19, 473–481. [Google Scholar]
- Schnabel, R.B.; Yin, X.; Gona, P.; Larson, M.G.; Beiser, A.S.; McManus, D.D.; Newton-Cheh, C.; Lubitz, S.A.; Magnani, J.W.; Ellinor, P.T.; et al. 50 year trends in atrial fibrillation prevalence, incidence, risk factors, and mortality in the Framingham Heart Study: A cohort study. Lancet 2015, 386, 154–162. [Google Scholar] [CrossRef]
- Morrison, W.G.; Swann, I.J. Electrocardiograph interpretation by junior doctors. Emerg. Med. J. 1990, 7, 108–110. [Google Scholar] [CrossRef][Green Version]
- Acharya, U.R.; Fujita, H.; Adam, M.; Lih, O.S.; Sudarshan, V.K.; Hong, T.J.; Koh, J.E.; Hagiwara, Y.; Chua, C.K.; Poo, C.K.; et al. Automated characterization and classification of coronary artery disease and myocardial infarction by decomposition of ECG signals: A comparative study. Inf. Sci. 2017, 377, 17–29. [Google Scholar] [CrossRef]
- Pinho, A.; Pombo, N.; Silva, B.M.C.; Bousson, K.; Garcia, N. Towards an accurate sleep apnea detection based on ECG signal: The quintessential of a wise feature selection. Appl. Soft Comput. 2019, 83, 105568. [Google Scholar] [CrossRef]
- Ebrahimzadeh, A.; Shakiba, B.; Khazaee, A. Detection of electrocardiogram signals using an efficient method. Appl. Soft Comput. 2014, 22, 108–117. [Google Scholar] [CrossRef]
- Al Aref, S.J.; Anchouche, K.; Singh, G.; Slomka, P.J.; Kolli, K.K.; Kumar, A.; Pandey, M.; Maliakal, G.; van Rosendael, A.R.; Beecy, A.N.; et al. Clinical applications of machine learning in cardiovascular disease and its relevance to cardiac imaging. Eur. Heart J. 2019, 40, 1975–1986. [Google Scholar] [CrossRef]
- Hannun, A.Y.; Rajpurkar, P.; Haghpanahi, M.; Tison, G.H.; Bourn, C.; Turakhia, M.P.; Ng, A.Y. Cardiologist-level arrhythmia detection and classification in ambulatory electrocardiograms using a deep neural network. Nat. Med. 2019, 25, 65–69. [Google Scholar] [CrossRef]
- Isakadze, N.; Martin, S.S. How useful is the smartwatch ECG? Trends Cardiovas. Med. 2019, 30, 442–448. [Google Scholar] [CrossRef]
- Yang, C.; Veiga, C.; Rodriguez-Andina, J.J.; Farina, J.; Iniguez, A.; Yin, S. Using PPG Signals and Wearable Devices for Atrial Fibrillation Screening. IEEE Trans. Ind. Electron. 2019, 66, 8832–8842. [Google Scholar] [CrossRef]
- Lyon, A.; Mincholé, A.; Martínez, J.P.; Laguna, P.; Rodriguez, B. Computational techniques for ECG analysis and interpretation in light of their contribution to medical advances. J. R. Soc. Interface 2018, 15, 20170821. [Google Scholar] [CrossRef]
- Singh, B.N.; Tiwari, A.K. Optimal selection of wavelet basis function applied to ECG signal denoising. Digit. Signal Process. 2006, 16, 275–287. [Google Scholar] [CrossRef]
- Friesen, G.M.; Jannett, T.C.; Jadallah, M.A.; Yates, S.L.; Quint, S.R.; Nagle, H.T. A comparison of the noise sensitivity of nine QRS detection algorithms. IEEE Trans. Biomed. Eng. 1990, 37, 85–98. [Google Scholar] [CrossRef]
- Van Alste And, T.S.; Schilder, J.A. Removal of base-line wander and power-line interference from the ECG by an efficient FIR filter with a reduced number of taps. IEEE Trans. Biomed. Eng. 1985, BME-32, 1052–1060. [Google Scholar] [CrossRef]
- Oster, J.; Behar, J.; Sayadi, O.; Nemati, S.; Johnson, A.E.W.; Clifford, G.D. Semisupervised ECG Ventricular Beat Classification with Novelty Detection Based on Switching Kalman Filters. IEEE Trans. Biomed. Eng. 2015, 62, 2125–2134. [Google Scholar] [CrossRef]
- Appathurai, A.; Jerusalin Carol, J.; Raja, C.; Kumar, S.N.; Daniel, A.V.; Jasmine Gnana Malar, A.; Fred, A.L.; Krishnamoorthy, S. A study on ECG signal characterization and practical implementation of some ECG characterization techniques. Measurement 2019, 147, 106384. [Google Scholar] [CrossRef]
- Dalin Tang, Z.T.; Canton, G.; Hatsukami, T.S.; Dong, L.; Yuan, X.H.A.C. Local critical stress correlates better than global maximum stress with plaque morphological features linked to atherosclerotic plaque vulnerability: An in vivo multi-patient study. Biomed. Eng. Online 2009, 8, 15. [Google Scholar] [CrossRef]
- Frolich, L.; Dowding, I. Removal of muscular artifacts in EEG signals: A comparison of linear decomposition methods. Brain Inf. 2018, 5, 13–22. [Google Scholar] [CrossRef] [PubMed]
- Blanco-Velasco, M.; Weng, B.; Barner, K.E. ECG signal denoising and baseline wander correction based on the empirical mode decomposition. Comput. Biol. Med. 2008, 38, 1–13. [Google Scholar] [CrossRef]
- Alfaouri, M.; Daqrouq, K. ECG Signal Denoising By Wavelet Transform Thresholding. Am. J. Appl. Sci. 2008, 5, 276–281. [Google Scholar] [CrossRef]
- Xu, Y.; Luo, M.; Li, T.; Song, G. ECG Signal De-noising and Baseline Wander Correction Based on CEEMDAN and Wavelet Threshold. Sensors 2017, 17, 2754. [Google Scholar] [CrossRef] [PubMed]
- Han, G.; Xu, Z. Electrocardiogram signal denoising based on a new improved wavelet thresholding. Rev. Sci. Instrum. 2016, 87, 084303. [Google Scholar] [CrossRef]
- Üstündağ, M.; Gökbulut, M.; Şengür, A.; Ata, F. Denoising of weak ECG signals by using wavelet analysis and fuzzy thresholding. Netw. Modeling Anal. Health Inform. Bioinform. 2012, 1, 135–140. [Google Scholar] [CrossRef]
- Singh, P.; Pradhan, G.; Shahnawazuddin, S. Denoising of ECG signal by non-local estimation of approximation coefficients in DWT. Biocybern. Biomed. Eng. 2017, 37, 599–610. [Google Scholar] [CrossRef]
- Al-Betar, M.A. β-Hill climbing: An exploratory local search. Neural Comput. Appl. 2017, 28, 153–168. [Google Scholar] [CrossRef]
- Alyasseri, Z.A.A.; Khader, A.T.; Al-Betar, M.A.; Awadallah, M.A. Hybridizing β-hill climbing with wavelet transform for denoising ECG signals. Inf. Sci. 2018, 429, 229–246. [Google Scholar] [CrossRef]
- Huang, N.E.; Shen, Z.; Long, S.R.; Wu, M.C.; Shih, H.H.; Zheng, Q.; Yen, N.; Tung, C.C.; Liu, H.H. The empirical mode decomposition and the Hilbert spectrum for nonlinear and non-stationary time series analysis. Proc. R. Soc. Lond. Ser. A Math. Phys. Eng. Sci. 1998, 454, 903–995. [Google Scholar] [CrossRef]
- Satija, U.; Ramkumar, B.; Manikandan, M.S. Automated ECG Noise Detection and Classification System for Unsupervised Healthcare Monitoring. IEEE J. Biomed. Health 2018, 22, 722–732. [Google Scholar] [CrossRef]
- Hasan, N.I.; Bhattacharjee, A. Deep Learning Approach to Cardiovascular Disease Classification Employing Modified ECG Signal from Empirical Mode Decomposition. Biomed. Signal Process. 2019, 52, 128–140. [Google Scholar] [CrossRef]
- Wu, Z.; Huang, N.E. Ensemble empirical mode decomposition: A noise-assisted data analysis method. Adv. Adapt. Data. Anal. 2009, 1, 1–41. [Google Scholar] [CrossRef]
- Chang, K. Arrhythmia ECG Noise Reduction by Ensemble Empirical Mode Decomposition. Sensors 2010, 10, 6063–6080. [Google Scholar] [CrossRef]
- Kopsinis, Y.; McLaughlin, S. Development of EMD-Based Denoising Methods Inspired by Wavelet Thresholding. IEEE Trans. Signal Process. 2009, 57, 1351–1362. [Google Scholar] [CrossRef]
- Arumugam, R.; Jebaraj, J. Ensemble empirical mode decomposition-based optimised power line interference removal algorithm for electrocardiogram signal. IET Signal Process. 2016, 10, 583–591. [Google Scholar]
- Liu, S.; Hsieh, C.; Chen, W.; Tan, T. ECG Noise Cancellation Based on Grey Spectral Noise Estimation. Sensors 2019, 19, 798. [Google Scholar] [CrossRef]
- Montalvo, M.; Tadi, P.; Merkler, A.; Gialdini, G.; Martin-Schild, S.; Navalkele, D.; Samai, A.; Nouh, A.; Hussain, M.; Goldblatt, S.; et al. PR Interval Prolongation and Cryptogenic Stroke: A Multicenter Retrospective Study. J. Stroke Cerebrovasc. Dis. 2017, 26, 2416–2420. [Google Scholar] [CrossRef]
- Merone, M.; Soda, P.; Sansone, M.; Sansone, C. ECG databases for biometric systems: A systematic review. Expert Syst. Appl. 2017, 67, 189–202. [Google Scholar] [CrossRef]
- Marcinkevics, R.O.; Neill, J.; Law, H.; Pervolaraki, E.; Hogarth, A.; Russell, C.; Stegemann, B.; Holden, A.V.; Tayebjee, M.H. Multichannel electrocardiogram diagnostics for the diagnosis of arrhythmogenic right ventricular dysplasia. EP Eur. 2018, 20, f13–f19. [Google Scholar]
- Pérez-Riera, A.; Ferreira, C.; Filho, C.; Ferreira, M.; Meneghini, A.; Uchida, A.; Schapachnik, E.; Dubner, S.; Zhang, L. The enigmatic sixth wave of the electrocardiogram: The U wave. Cardiol. J. 2008, 15, 408–421. [Google Scholar]
- Adami, A.; Gentile, C.; Hepp, T.; Molon, G.; Gigli, G.L.; Valente, M.; Thijs, V. Electrocardiographic RR Interval Dynamic Analysis to Identify Acute Stroke Patients at High Risk for Atrial Fibrillation Episodes during Stroke Unit Admission. Transl. Stroke Res. 2019, 10, 273–278. [Google Scholar] [CrossRef]
- Liu, C.; Gao, R. Multiscale Entropy Analysis of the Differential RR Interval Time Series Signal and Its Application in Detecting Congestive Heart Failure. Entropy 2017, 19, 251. [Google Scholar]
- Pürerfellner, H.; Pokushalov, E.; Sarkar, S.; Koehler, J.; Zhou, R.; Urban, L.; Hindricks, G. P-wave evidence as a method for improving algorithm to detect atrial fibrillation in insertable cardiac monitors. Heart Rhythm 2014, 11, 1575–1583. [Google Scholar] [CrossRef] [PubMed]
- Bax, J.J.; Delgado, V.; Sogaard, P.; Singh, J.P.; Abraham, W.T.; Borer, J.S.; Dickstein, K.; Gras, D.; Brugada, J.; Robertson, M.; et al. Prognostic implications of left ventricular global longitudinal strain in heart failure patients with narrow QRS complex treated with cardiac resynchronization therapy: A subanalysis of the randomized EchoCRT trial. Eur. Heart J. 2016, 38, 720–726. [Google Scholar] [CrossRef]
- Brady, W.J.; Mattu, A.; Tabas, J.; Ferguson, J.D. The differential diagnosis of wide QRS complex tachycardia. Am. J. Emerg. Med. 2017, 35, 1525–1529. [Google Scholar] [CrossRef]
- Ibrahim Radwan, H.; Saad Mansour, K.; Mustafa Al-Daydamony, M.; Saed Mohammed, R. Fragmented QRS Complex as a Predictor of High Risk in Acute Coronary Syndrome. Cardiol. Cardiovasc. Res. 2019, 3, 71. [Google Scholar] [CrossRef]
- Hausenloy, D.J.; Botker, H.E.; Engstrom, T.; Erlinge, D.; Heusch, G.; Ibanez, B.; Kloner, R.A.; Ovize, M.; Yellon, D.M.; Garcia-Dorado, D. Targeting reperfusion injury in patients with ST-segment elevation myocardial infarction: Trials and tribulations. Eur. Heart J. 2016, 38, 935–941. [Google Scholar] [CrossRef]
- Onur, I.; Emet, S.; Onur, S.T.; Kara, K.; Surmen, S.; Bilge, A.K.; Adalet, K. PM299 A Novel Parameter for the Diagnosis of Acute Pulmonary Embolism: T Wave Peak to End Interval. Glob. Heart 2016, 11, e121–e122. [Google Scholar] [CrossRef]
- Nakagawa, T.; Yagi, T.; Ishida, A.; Mibiki, Y.; Yamashina, Y.; Sato, H.; Sato, E.; Komatsu, J.; Saijo, Y. Differences between cardiac memory T wave changes after idiopathic left ventricular tachycardia and ischemic T wave inversion induced by acute coronary syndrome. J. Electrocardiol. 2016, 49, 596–602. [Google Scholar] [CrossRef]
- Hermans, B.J.M.; Bennis, F.C.; Vink, A.S.; Koopsen, T.; Lyon, A.; Wilde, A.A.M.; Nuyens, D.; Robyns, T.; Pison, L.; Postema, P.G.; et al. Improving long QT syndrome diagnosis by a polynomial-based T-wave morphology characterization. Heart Rhythm 2020, 17, 752–758. [Google Scholar] [CrossRef] [PubMed]
- DeChazal, P.; O’Dwyer, M.; Reilly, R.B. Automatic Classification of Heartbeats Using ECG Morphology and Heartbeat Interval Features. IEEE Trans. Biomed. Eng. 2004, 51, 1196–1206. [Google Scholar] [CrossRef]
- Gothwal, H.; Kedawat, S.; Kumar, R. Cardiac arrhythmias detection in an ECG beat signal using fast fourier transform and artificial neural network. J. Biomed. Sci. Eng. 2011, 4, 289–296. [Google Scholar] [CrossRef]
- Minami, K.; Nakajima, H.; Toyoshima, T. Real-time discrimination of ventricular tachyarrhythmia with Fourier-transform neural network. IEEE Trans. Biomed. Eng. 1999, 46, 179–185. [Google Scholar] [CrossRef] [PubMed]
- Huang, J.; Chen, B.; Yao, B.; He, W. ECG Arrhythmia Classification Using STFT-Based Spectrogram and Convolutional Neural Network. IEEE Access 2019, 7, 92871–92880. [Google Scholar] [CrossRef]
- Cohen, L. Time-frequency distributions—A review. Proc. IEEE 1989, 77, 941–981. [Google Scholar] [CrossRef]
- Malfait, M.; Roose, D. Wavelet-based image denoising using a Markov random field a priori model. IEEE Trans. Image Process. 1997, 6, 549–565. [Google Scholar] [CrossRef]
- Torrence, C.; Compo, G.P. A Practical Guide to Wavelet Analysis. Bull. Am. Meteorol. Soc. 1998, 79, 61–78. [Google Scholar] [CrossRef]
- Manikandan, M.S.; Dandapat, S. Wavelet-based electrocardiogram signal compression methods and their performances: A prospective review. Biomed. Signal Process. 2014, 14, 73–107. [Google Scholar] [CrossRef]
- Castillo, E.; Morales, D.P.; Botella, G.; García, A.; Parrilla, L.; Palma, A.J. Efficient wavelet-based ECG processing for single-lead FHR extraction. Digit. Signal Process. 2013, 23, 1897–1909. [Google Scholar] [CrossRef]
- Enamamu, T.; Otebolaku, A.; Marchang, J.; Dany, J. Continuous m-Health Data Authentication Using Wavelet Decomposition for Feature Extraction. Sensors 2020, 20, 5690. [Google Scholar] [CrossRef]
- Li, H.; Yuan, D.; Ma, X.; Cui, D.; Cao, L. Genetic algorithm for the optimization of features and neural networks in ECG signals classification. Sci. Rep. 2017, 7, 41011. [Google Scholar] [CrossRef]
- Chan, H.; Siao, Y.; Chen, S.; Yu, S. Wavelet-based ECG compression by bit-field preserving and running length encoding. Comput. Meth. Prog. Biomed. 2008, 90, 1–8. [Google Scholar] [CrossRef]
- Mazomenos, E.B.; Biswas, D.; Acharyya, A.; Chen, T.; Maharatna, K.; Rosengarten, J.; Morgan, J.; Curzen, N. A Low-Complexity ECG Feature Extraction Algorithm for Mobile Healthcare Applications. IEEE J. Biomed. Health 2013, 17, 459–469. [Google Scholar] [CrossRef]
- Martis, R.J.; Acharya, U.R.; Min, L.C. ECG beat classification using PCA, LDA, ICA and Discrete Wavelet Transform. Biomed. Signal Process. 2013, 8, 437–448. [Google Scholar] [CrossRef]
- Liu, J.; Zhang, C.; Zhu, Y.; Ristaniemi, T.; Parviainen, T.; Cong, F. Automated detection and localization system of myocardial infarction in single-beat ECG using Dual-Q TQWT and wavelet packet tensor decomposition. Comput. Meth. Prog. Biomed. 2020, 184, 105120. [Google Scholar] [CrossRef]
- Yildirim, Ö. A novel wavelet sequence based on deep bidirectional LSTM network model for ECG signal classification. Comput. Biol. Med. 2018, 96, 189–202. [Google Scholar] [CrossRef] [PubMed]
- Jayachandran, E.S.; Joseph, K.P.; Acharya, U.R. Analysis of Myocardial Infarction Using Discrete Wavelet Transform. J. Med. Syst. 2010, 34, 985–992. [Google Scholar] [CrossRef]
- He, H.; Tan, Y.; Xing, J. Unsupervised classification of 12-lead ECG signals using wavelet tensor decomposition and two-dimensional Gaussian spectral clustering. Knowl. Based Syst. 2019, 163, 392–403. [Google Scholar] [CrossRef]
- Kumar, M.; Pachori, R.B.; Acharya, U.R. Characterization of coronary artery disease using flexible analytic wavelet transform applied on ECG signals. Biomed. Signal Process. 2017, 31, 301–308. [Google Scholar] [CrossRef]
- Javadi, M.; Arani, S.A.A.A.; Sajedin, A.; Ebrahimpour, R. Classification of ECG arrhythmia by a modular neural network based on Mixture of Experts and Negatively Correlated Learning. Biomed. Signal Process. 2013, 8, 289–296. [Google Scholar] [CrossRef]
- Dilmac, S.; Korurek, M. ECG heart beat classification method based on modified ABC algorithm. Appl. Soft Comput. 2015, 36, 641–655. [Google Scholar] [CrossRef]
- Dima, S.; Panagiotou, C.; Mazomenos, E.B.; Rosengarten, J.A.; Maharatna, K.; Gialelis, J.V.; Curzen, N.; Morgan, J. On the Detection of Myocadial Scar Based on ECG/VCG Analysis. IEEE Trans. Biomed. Eng. 2013, 60, 3399–3409. [Google Scholar] [CrossRef]
- Kutlu, Y.; Kuntalp, D. Feature extraction for ECG heartbeats using higher order statistics of WPD coefficients. Comput. Meth. Prog. Biomed. 2012, 105, 257–267. [Google Scholar] [CrossRef] [PubMed]
- Tantawi, M.M.; Revett, K.; Salem, A.; Tolba, M.F. Fiducial feature reduction analysis for electrocardiogram (ECG) based biometric recognition. J. Intell. Inf. Syst. 2013, 40, 17–39. [Google Scholar] [CrossRef]
- Lee, J.; McManus, D.D.; Merchant, S.; Chon, K.H. Automatic motion and noise artifact detection in Holter ECG data using empirical mode decomposition and statistical approaches. IEEE Trans. Biomed. Eng. 2012, 59, 1499–1506. [Google Scholar]
- Ince, T.; Kiranyaz, S.; Gabbouj, M. A Generic and Robust System for Automated Patient-Specific Classification of ECG Signals. IEEE Trans. Biomed. Eng. 2009, 56, 1415–1426. [Google Scholar] [CrossRef]
- Mar, T.; Zaunseder, S.; Martinez, J.P.; Llamedo, M.; Poll, R. Optimization of ECG Classification by Means of Feature Selection. IEEE Trans. Biomed. Eng. 2011, 58, 2168–2177. [Google Scholar] [CrossRef]
- de Chazal, P.; Reilly, R.B. A Patient-Adapting Heartbeat Classifier Using ECG Morphology and Heartbeat Interval Features. IEEE Trans. Biomed. Eng. 2006, 53, 2535–2543. [Google Scholar] [CrossRef]
- Hu, Y.H.; Palreddy, S.; Tompkins, W.J. A patient-adaptable ECG beat classifier using a mixture of experts approach. IEEE Trans. Biomed. Eng. 1997, 44, 891–900. [Google Scholar]
- Lee, M.; Song, T.; Lee, J. Heartbeat classification using local transform pattern feature and hybrid neural fuzzy-logic system based on self-organizing map. Biomed. Signal Process. 2020, 57, 101690. [Google Scholar] [CrossRef]
- Manikandan, M.S.; Soman, K.P. A novel method for detecting R-peaks in electrocardiogram (ECG) signal. Biomed. Signal Process. 2012, 7, 118–128. [Google Scholar] [CrossRef]
- Zhang, Z.; Dong, J.; Luo, X.; Choi, K.; Wu, X. Heartbeat classification using disease-specific feature selection. Comput. Biol. Med. 2014, 46, 79–89. [Google Scholar] [CrossRef]
- Rodríguez-Sotelo, J.L.; Cuesta-Frau, D.; Castellanos-Dominguez, G. Unsupervised classification of atrial heartbeats using a prematurity index and wave morphology features. Med. Biol. Eng. Comput. 2009, 47, 731–741. [Google Scholar] [CrossRef]
- Inan, O.T.; Giovangrandi, L.; Kovacs, G.T.A. Robust Neural-Network-Based Classification of Premature Ventricular Contractions Using Wavelet Transform and Timing Interval Features. IEEE Trans. Biomed. Eng. 2006, 53, 2507–2515. [Google Scholar] [CrossRef]
- Maršánová, L.; Ronzhina, M.; Smíšek, R.; Vítek, M.; Němcová, A.; Smital, L.; Nováková, M. ECG features and methods for automatic classification of ventricular premature and ischemic heartbeats: A comprehensive experimental study. Sci. Rep. 2017, 7, 1–11. [Google Scholar] [CrossRef]
- Elhaj, F.A.; Salim, N.; Harris, A.R.; Swee, T.T.; Ahmed, T. Arrhythmia recognition and classification using combined linear and nonlinear features of ECG signals. Comput. Meth. Prog. Biomed. 2016, 127, 52–63. [Google Scholar] [CrossRef]
- Raj, S.; Ray, K.C. Sparse representation of ECG signals for automated recognition of cardiac arrhythmias. Exp. Syst. Appl. 2018, 105, 49–64. [Google Scholar] [CrossRef]
- Marinho, L.B.; Nascimento, N.D.M.M.; Souza, J.W.M.; Gurgel, M.V.; Rebouças Filho, P.P.; de Albuquerque, V.H.C. A novel electrocardiogram feature extraction approach for cardiac arrhythmia classification. Future Gener. Comput. Syst. 2019, 97, 564–577. [Google Scholar] [CrossRef]
- Qin, Q.; Li, J.; Zhang, L.; Yue, Y.; Liu, C. Combining Low-dimensional Wavelet Features and Support Vector Machine for Arrhythmia Beat Classification. Sci. Rep. 2017, 7, 1–12. [Google Scholar] [CrossRef]
- Blum, A.L.; Langley, P. Selection of relevant features and examples in machine learning. Artif. Intell. 1997, 97, 245–271. [Google Scholar] [CrossRef]
- Chandrashekar, G.; Sahin, F. A survey on feature selection methods. Comput. Electr. Eng. 2014, 40, 16–28. [Google Scholar] [CrossRef]
- Sufi, F.; Khalil, I. Faster person identification using compressed ECG in time critical wireless telecardiology applications. J. Netw. Comput. Appl. 2011, 34, 282–293. [Google Scholar] [CrossRef]
- Khalaf, A.F.; Owis, M.I.; Yassine, I.A. A novel technique for cardiac arrhythmia classification using spectral correlation and support vector machines. Expert Syst. Appl. 2015, 42, 8361–8368. [Google Scholar] [CrossRef]
- Yu, S.; Chen, Y. Noise-tolerant electrocardiogram beat classification based on higher order statistics of subband components. Artif. Intell. Med. 2009, 46, 165–178. [Google Scholar] [CrossRef]
- Llamedo, M.; Martínez, J.P. Heartbeat Classification Using Feature Selection Driven by Database Generalization Criteria. IEEE Trans. Biomed. Eng. 2011, 58, 616–625. [Google Scholar] [CrossRef]
- Kudo, M.; Sklansky, J. Comparison of algorithms that select features for pattern classifiers. Pattern Recogn. 2000, 33, 25–41. [Google Scholar] [CrossRef]
- Wang, A.; An, N.; Chen, G.; Li, L.; Alterovitz, G. Accelerating wrapper-based feature selection with K-nearest-neighbor. Knowl. Based Syst. 2015, 83, 81–91. [Google Scholar] [CrossRef]
- Song, C.; Liu, K.; Zhang, X.; Chen, L.; Xian, X. An Obstructive Sleep Apnea Detection Approach Using a Discriminative Hidden Markov Model from ECG Signals. IEEE Trans. Biomed. Eng. 2016, 63, 1532–1542. [Google Scholar] [CrossRef]
- Lu, M. Embedded feature selection accounting for unknown data heterogeneity. Exp. Syst. Appl. 2019, 119, 350–361. [Google Scholar] [CrossRef]
- Ye, C.; Kumar, B.V.; Coimbra, M.T. Heartbeat classification using morphological and dynamic features of ECG signals. IEEE Trans. Biomed. Eng. 2012, 59, 2930–2941. [Google Scholar]
- He, H.; Tan, Y. Automatic pattern recognition of ECG signals using entropy-based adaptive dimensionality reduction and clustering. Appl. Soft Comput. 2017, 55, 238–252. [Google Scholar] [CrossRef]
- Varatharajan, R.; Manogaran, G.; Priyan, M.K. A big data classification approach using LDA with an enhanced SVM method for ECG signals in cloud computing. Multimed. Tools Appl. 2018, 77, 10195–10215. [Google Scholar] [CrossRef]
- Bollmann, A.; Kanuru, N.; McTeague, K.; Walter, P.; DeLurgio, D.; Langberg, J. Frequency Analysis of Human Atrial Fibrillation Using the Surface Electrocardiogram and Its Response to Ibutilide. Am. J. Cardiol. 1998, 81, 1439–1445. [Google Scholar] [CrossRef]
- Rieta, J.J.; Castells, F.; Sanchez, C.; Zarzoso, V.; Millet, J. Atrial Activity Extraction for Atrial Fibrillation Analysis Using Blind Source Separation. IEEE Trans. Biomed. Eng. 2004, 51, 1176–1186. [Google Scholar] [CrossRef]
- Adam, M.; Oh, S.L.; Sudarshan, V.K.; Koh, J.E.; Hagiwara, Y.; Tan, J.H.; San Tan, R.; Acharya, U.R. Automated characterization of cardiovascular diseases using relative wavelet nonlinear features extracted from ECG signals. Comput. Meth. Prog. Biomed. 2018, 161, 133–143. [Google Scholar] [CrossRef]
- Zamani, B.; Akbari, A.; Nasersharif, B. Evolutionary combination of kernels for nonlinear feature transformation. Inf. Sci. 2014, 274, 95–107. [Google Scholar] [CrossRef]
- Liu, F.; Zhang, W.; Gu, S. Local linear Laplacian eigenmaps: A direct extension of LLE. Patt. Recogn. Lett. 2016, 75, 30–35. [Google Scholar] [CrossRef]
- Li, X.; Shu, L.; Hu, H. Kernel-based nonlinear dimensionality reduction for electrocardiogram recognition. Neural Comput. Appl. 2008, 18, 1013. [Google Scholar] [CrossRef]
- Ayesha, S.; Hanif, M.K.; Talib, R. Overview and comparative study of dimensionality reduction techniques for high dimensional data. Inf. Fusion 2020, 59, 44–58. [Google Scholar] [CrossRef]
- Lee, J.; Reyes, B.A.; McManus, D.D.; Maitas, O.; Chon, K.H. Atrial Fibrillation Detection Using an iPhone 4S. IEEE Trans. Biomed. Eng. 2013, 60, 203–206. [Google Scholar] [CrossRef] [PubMed]
- Chen, W.; Shih, J. A study of Taiwan’s issuer credit rating systems using support vector machines. Exp.Syst. Appl. 2006, 30, 427–435. [Google Scholar] [CrossRef]
- Pławiak, P. Novel methodology of cardiac health recognition based on ECG signals and evolutionary-neural system. Exp. Syst. Appl. 2018, 92, 334–349. [Google Scholar] [CrossRef]
- Venkatesan, C.; Karthigaikumar, P.; Paul, A.; Satheeskumaran, S.; Kumar, R. ECG Signal Preprocessing and SVM Classifier-Based Abnormality Detection in Remote Healthcare Applications. IEEE Access 2018, 6, 9767–9773. [Google Scholar] [CrossRef]
- Raj, S.; Ray, K.C. ECG Signal Analysis Using DCT-Based DOST and PSO Optimized SVM. IEEE Trans. Instrum. Meas. 2017, 66, 470–478. [Google Scholar] [CrossRef]
- Polat, K.; Güneş, S. Detection of ECG Arrhythmia using a differential expert system approach based on principal component analysis and least square support vector machine. Appl. Math. Comput. 2007, 186, 898–906. [Google Scholar] [CrossRef]
- Osowski, S.; Hoai, L.T.; Markiewicz, T. Support Vector Machine-Based Expert System for Reliable Heartbeat Recognition. IEEE Trans. Biomed. Eng. 2004, 51, 582–589. [Google Scholar] [CrossRef] [PubMed]
- Moavenian, M.; Khorrami, H. A qualitative comparison of Artificial Neural Networks and Support Vector Machines in ECG arrhythmias classification. Expert Syst. Appl. 2010, 37, 3088–3093. [Google Scholar] [CrossRef]
- Sannino, G.; De Pietro, G. A deep learning approach for ECG-based heartbeat classification for arrhythmia detection. Future Gener. Comput. Syst. 2018, 86, 446–455. [Google Scholar] [CrossRef]
- Goldberger, A.L.; Amaral, L.A.N.; Glass, L.; Hausdorff, J.M.; Ivanov, P.C.; Mark, R.G.; Mietus, J.E.; Moody, G.B.; Peng, C.-K.; Stanley, H.E. PhysioBank, PhysioToolkit, and PhysioNet: Components of a new research resource for complex physiologic signals. Circulation 2000, 101, e215–e220. [Google Scholar] [CrossRef]
- Kiranyaz, S.; Ince, T.; Gabbouj, M. Real-Time Patient-Specific ECG Classification by 1-D Convolutional Neural Networks. IEEE Trans. Biomed. Eng. 2016, 63, 664–675. [Google Scholar] [CrossRef]
- Zhai, X.; Tin, C. Automated ECG Classification Using Dual Heartbeat Coupling Based on Convolutional Neural Network. IEEE Access 2018, 6, 27465–27472. [Google Scholar] [CrossRef]
- Tan, J.H.; Hagiwara, Y.; Pang, W.; Lim, I.; Oh, S.L.; Adam, M.; Tan, R.S.; Chen, M.; Acharya, U.R. Application of stacked convolutional and long short-term memory network for accurate identification of CAD ECG signals. Comput. Biol. Med. 2018, 94, 19–26. [Google Scholar] [CrossRef]
- Acharya, U.R.; Fujita, H.; Lih, O.S.; Adam, M.; Tan, J.H.; Chua, C.K. Automated detection of coronary artery disease using different durations of ECG segments with convolutional neural network. Knowl. Based Syst. 2017, 132, 62–71. [Google Scholar] [CrossRef]
- Yildirim, O.; Baloglu, U.B.; Tan, R.; Ciaccio, E.J.; Acharya, U.R. A new approach for arrhythmia classification using deep coded features and LSTM networks. Comput. Meth. Prog. Biomed. 2019, 176, 121–133. [Google Scholar] [CrossRef]
- Andersen, R.S.; Peimankar, A.; Puthusserypady, S. A deep learning approach for real-time detection of atrial fibrillation. Expert Syst. Appl. 2019, 115, 465–473. [Google Scholar] [CrossRef]
- Acharya, U.R.; Fujita, H.; Oh, S.L.; Hagiwara, Y.; Tan, J.H.; Adam, M. Application of deep convolutional neural network for automated detection of myocardial infarction using ECG signals. Inf. Sci. 2017, 415–416, 190–198. [Google Scholar] [CrossRef]
- Acharya, U.R.; Fujita, H.; Lih, O.S.; Hagiwara, Y.; Tan, J.H.; Adam, M. Automated detection of arrhythmias using different intervals of tachycardia ECG segments with convolutional neural network. Inf. Sci. 2017, 405, 81–90. [Google Scholar] [CrossRef]
- Rahhal, M.M.A.; Bazi, Y.; AlHichri, H.; Alajlan, N.; Melgani, F.; Yager, R.R. Deep learning approach for active classification of electrocardiogram signals. Inf. Sci. 2016, 345, 340–354. [Google Scholar] [CrossRef]
- Shadmand, S.; Mashoufi, B. A new personalized ECG signal classification algorithm using Block-based Neural Network and Particle Swarm Optimization. Biomed. Signal Process. 2016, 25, 12–23. [Google Scholar] [CrossRef]
- Butun, E.; Yildirim, O.; Talo, M.; Tan, R.; Rajendra Acharya, U. 1D-CADCapsNet: One dimensional deep capsule networks for coronary artery disease detection using ECG signals. Phys. Med. 2020, 70, 39–48. [Google Scholar] [CrossRef]
- Baloglu, U.B.; Talo, M.; Yildirim, O.; Tan, R.S.; Acharya, U.R. Classification of myocardial infarction with multi-lead ECG signals and deep CNN. Pattern Recogn. Lett. 2019, 122, 23–30. [Google Scholar] [CrossRef]
- Zhang, J.; Tian, J.; Cao, Y.; Yang, Y.; Xu, X. Deep time–frequency representation and progressive decision fusion for ECG classification. Knowl. Based Syst. 2020, 190, 105402. [Google Scholar] [CrossRef]
- Poh, M.; Poh, Y.C.; Chan, P.; Wong, C.; Pun, L.; Leung, W.W.; Wong, Y.; Wong, M.M.; Chu, D.W.; Siu, C. Diagnostic assessment of a deep learning system for detecting atrial fibrillation in pulse waveforms. Heart 2018, 104, 1921–1928. [Google Scholar] [CrossRef]
- Ribeiro, A.H.; Ribeiro, M.H.; Paixão, G.M.M.; Oliveira, D.M.; Gomes, P.R.; Canazart, J.A.; Ferreira, M.P.S.; Andersson, C.R.; Macfarlane, P.W.; Meira, W., Jr.; et al. Automatic diagnosis of the 12-lead ECG using a deep neural network. Nat. Commun. 2020, 11, 1760. [Google Scholar] [CrossRef] [PubMed]
- Xu, S.S.; Mak, M.; Cheung, C. Towards End-to-End ECG Classification with Raw Signal Extraction and Deep Neural Networks. IEEE J. Biomed. Health 2019, 23, 1574–1584. [Google Scholar] [CrossRef] [PubMed]
- Mahmud, T.; Fattah, S.A.; Saquib, M. DeepArrNet: An Efficient Deep CNN Architecture for Automatic Arrhythmia Detection and Classification From Denoised ECG Beats. IEEE Access 2020, 8, 104788–104800. [Google Scholar] [CrossRef]
- Han, C.; Shi, L. ML–ResNet: A novel network to detect and locate myocardial infarction using 12 leads ECG. Comput. Meth. Prog. Biomed. 2020, 185, 105138. [Google Scholar] [CrossRef]
- Yıldırım, Ö.; Pławiak, P.; Tan, R.; Acharya, U.R. Arrhythmia detection using deep convolutional neural network with long duration ECG signals. Comput. Biol. Med. 2018, 102, 411–420. [Google Scholar] [CrossRef] [PubMed]
- Carrera, D.; Rossi, B.; Fragneto, P.; Boracchi, G. Online anomaly detection for long-term ECG monitoring using wearable devices. Pattern Recogn. 2019, 88, 482–492. [Google Scholar] [CrossRef]
- Attia, Z.I.; Kapa, S.; Lopez-Jimenez, F.; McKie, P.M.; Ladewig, D.J.; Satam, G.; Pellikka, P.A.; Enriquez-Sarano, M.; Noseworthy, P.A.; Munger, T.M.; et al. Screening for cardiac contractile dysfunction using an artificial intelligence–enabled electrocardiogram. Nat. Med. 2019, 25, 70–74. [Google Scholar] [CrossRef] [PubMed]
- Buja, L.M. Coronary Artery Disease: Pathological Anatomy and Pathogenesis. In Coronary Artery Disease; Springer: London, UK, 2015; pp. 1–20. [Google Scholar]
- Acharya, U.R.; Sudarshan, V.K.; Koh, J.E.W.; Martis, R.J.; Tan, J.H.; Oh, S.L.; Muhammad, A.; Hagiwara, Y.; Mookiah, M.R.K.; Chua, K.P.; et al. Application of higher-order spectra for the characterization of Coronary artery disease using electrocardiogram signals. Biomed. Signal Process. 2017, 31, 31–43. [Google Scholar] [CrossRef]
- Patidar, S.; Pachori, R.B.; Rajendra Acharya, U. Automated diagnosis of coronary artery disease using tunable-Q wavelet transform applied on heart rate signals. Knowl. Based Syst. 2015, 82, 1–10. [Google Scholar] [CrossRef]
- Acharya, U.R.; Fujita, H.; Sudarshan, V.K.; Oh, S.L.; Adam, M.; Tan, J.H.; Koo, J.H.; Jain, A.; Lim, C.M.; Chua, K.C. Automated characterization of coronary artery disease, myocardial infarction, and congestive heart failure using contourlet and shearlet transforms of electrocardiogram signal. Knowl. Based Syst. 2017, 132, 156–166. [Google Scholar] [CrossRef]
- De Albuquerque, V.H.C.; Nunes, T.M.; Pereira, D.R.; Luz, E.J.D.S.; Menotti, D.; Papa, J.P.; Tavares, J.M.R.S. Robust automated cardiac arrhythmia detection in ECG beat signals. Neural Comput. Appl. 2018, 29, 679–693. [Google Scholar] [CrossRef]
- Sangaiah, A.K.; Arumugam, M.; Bian, G. An intelligent learning approach for improving ECG signal classification and arrhythmia analysis. Artif. Intell. Med. 2020, 103, 101788. [Google Scholar] [CrossRef] [PubMed]
- Romdhane, T.F.; Alhichri, H.; Ouni, R.; Atri, M. Electrocardiogram heartbeat classification based on a deep convolutional neural network and focal loss. Comput. Biol. Med. 2020, 123, 103866. [Google Scholar] [CrossRef] [PubMed]
- Stern, S.; Sclarowsky, S. The ECG in Diabetes Mellitus. Circulation 2009, 120, 1633–1636. [Google Scholar] [CrossRef]
- Ben Halima, M.; Boudiche, S.; Sammoud, K.; Ben Amar, J.; Rekik, B.; Larbi, N.; Ouali, S.; Farhati, A.; Aouina, H.; Mghaieth, F.; et al. Severe obstructive sleep apnea in Tunisian population with atrial fibrillation: Prevalence and predictive factors. Arch. Cardiovasc. Dis. Suppl. 2020, 12, 123–124. [Google Scholar] [CrossRef]
- Goldman, A.; Hod, H.; Chetrit, A.; Dankner, R. Incidental abnormal ECG findings and long-term cardiovascular morbidity and all-cause mortality: A population based prospective study. Int. J. Cardiol. 2019, 295, 36–41. [Google Scholar] [CrossRef]
- Sengupta, P.P.; Kulkarni, H.; Narula, J. Prediction of Abnormal Myocardial Relaxation from Signal Processed Surface ECG. J. Am. Coll. Cardiol. 2018, 71, 1650–1660. [Google Scholar] [CrossRef]
- Cui, X.; Chang, H.; Lin, L.; Yu, C.; Hsieh, W.; Li, W.; Peng, C.; Lin, J.; Lo, M. Prediction of atrial fibrillation recurrence before catheter ablation using an adaptive nonlinear and non-stationary surface ECG analysis. Phys. A Stat. Mech. ITS Appl. 2019, 514, 9–19. [Google Scholar] [CrossRef]
- Liao, Y.; Chung, F.; Lin, Y.; Chang, S.; Lo, L.; Hu, Y.; Tuan, T.; Chao, T.; Liao, J.; Lin, C.; et al. The application of signal average ECG in the prediction of recurrences after catheter ablation of ventricular arrhythmias in arrhythmogenic right ventricular dysplasia/cardiomyopathy. Int. J. Cardiol. 2017, 236, 168–173. [Google Scholar] [CrossRef]
- Vafaie, M.H.; Ataei, M.; Koofigar, H.R. Heart diseases prediction based on ECG signals’ classification using a genetic-fuzzy system and dynamical model of ECG signals. Biomed. Signal Process. 2014, 14, 291–296. [Google Scholar] [CrossRef]
- Venkatesan, C.; Karthigaikumar, P.; Satheeskumaran, S. Mobile cloud computing for ECG telemonitoring and real-time coronary heart disease risk detection. Biomed. Signal Process. 2018, 44, 138–145. [Google Scholar] [CrossRef]
- Piwek, L.; Ellis, D.A.; Andrews, S.; Joinson, A. The Rise of Consumer Health Wearables: Promises and Barriers. PLoS Med. 2016, 13, e1001953. [Google Scholar] [CrossRef]
- Friberg, L.; Bergfeldt, L. Atrial fibrillation prevalence revisited. J. Intern. Med. 2013, 274, 461–468. [Google Scholar] [CrossRef]
- Camm, A.J.; Corbucci, G.; Padeletti, L. Usefulness of Continuous Electrocardiographic Monitoring for Atrial Fibrillation. Am. J. Cardiol. 2012, 110, 270–276. [Google Scholar] [CrossRef] [PubMed]
- Aronsson, M.; Svennberg, E.; Rosenqvist, M.; Engdahl, J.; Al-Khalili, F.; Friberg, L.; Frykman-Kull, V.; Levin, L. Cost-effectiveness of mass screening for untreated atrial fibrillation using intermittent ECG recording. Europace 2015, 17, 1023–1029. [Google Scholar] [CrossRef] [PubMed]
- Svennberg, E.; Engdahl, J.; Al-Khalili, F.; Friberg, L.; Frykman, V.; Rosenqvist, M. Mass Screening for Untreated Atrial Fibrillation. Circulation 2015, 131, 2176–2184. [Google Scholar] [CrossRef]
- Elgendi, M.; Eskofier, B.; Dokos, S.; Abbott, D. Revisiting QRS Detection Methodologies for Portable, Wearable, Battery-Operated, and Wireless ECG Systems. PLoS ONE 2014, 9, e84018. [Google Scholar] [CrossRef]
- Elgendi, M.; Mohamed, A.; Ward, R. Efficient ECG Compression and QRS Detection for E-Health Applications. Sci. Rep. 2017, 7, 1–16. [Google Scholar] [CrossRef] [PubMed]
- Majumder, S.; Chen, L.; Marinov, O.; Chen, C.; Mondal, T.; Deen, M.J. Noncontact Wearable Wireless ECG Systems for Long-Term Monitoring. IEEE Rev. Biomed. Eng. 2018, 11, 306–321. [Google Scholar] [CrossRef]
- Lee, J.S.; Lee, S.J.; Choi, M.; Seo, M.; Kim, S.W. QRS detection method based on fully convolutional networks for capacitive electrocardiogram. Exp. Syst. Appl. 2019, 134, 66–78. [Google Scholar] [CrossRef]
- Yousefi, R.; Nourani, M.; Ostadabbas, S.; Panahi, I. A Motion-Tolerant Adaptive Algorithm for Wearable Photoplethysmographic Biosensors. IEEE J. Biomed. Health 2014, 18, 670–681. [Google Scholar] [CrossRef]
- Pereira, T.; Tran, N.; Gadhoumi, K.; Pelter, M.M.; Do, D.H.; Lee, R.J.; Colorado, R.; Meisel, K.; Hu, X. Photoplethysmography based atrial fibrillation detection: A review. NPJ Digit. Med. 2020, 3, 3. [Google Scholar] [CrossRef]
- Zhu, Q.; Tian, X.; Wong, C.; Wu, M. Learning Your Heart Actions From Pulse: ECG Waveform Reconstruction From PPG. bioRxiv 2019. [Google Scholar] [CrossRef]
- Vandenberk, T.; Stans, J.; Mortelmans, C.; Van Haelst, R.; Van Schelvergem, G.; Pelckmans, C.; Smeets, C.J.; Lanssens, D.; De Cannière, H.; Storms, V.; et al. Clinical Validation of Heart Rate Apps: Mixed-Methods Evaluation Study. JMIR Mhealth Uhealth 2017, 5, e129. [Google Scholar] [CrossRef] [PubMed]
- Rundo, F.; Conoci, S.; Ortis, A.; Battiato, S. An Advanced Bio-Inspired PhotoPlethysmoGraphy (PPG) and ECG Pattern Recognition System for Medical Assessment. Sensors 2018, 18, 405. [Google Scholar] [CrossRef]
- Elgendi, M.; Fletcher, R.; Liang, Y.; Howard, N.; Lovell, N.H.; Abbott, D.; Lim, K.; Ward, R. The use of photoplethysmography for assessing hypertension. NPJ Digit. Med. 2019, 2, 60. [Google Scholar] [CrossRef] [PubMed]
- Bumgarner, J.M.; Lambert, C.T.; Hussein, A.A.; Cantillon, D.J.; Baranowski, B.; Wolski, K.; Lindsay, B.D.; Wazni, O.M.; Tarakji, K.G. Smartwatch Algorithm for Automated Detection of Atrial Fibrillation. J. Am. Coll. Cardiol. 2018, 71, 2381–2388. [Google Scholar] [CrossRef]
- Lau, J.K.; Lowres, N.; Neubeck, L.; Brieger, D.B.; Sy, R.W.; Galloway, C.D.; Albert, D.E.; Freedman, S.B. iPhone ECG application for community screening to detect silent atrial fibrillation: A novel technology to prevent stroke. Int. J. Cardiol. 2013, 165, 193–194. [Google Scholar] [CrossRef]
- Chon, K.H.; McManus, D.D. Detection of atrial fibrillation using a smartwatch. Nat. Rev. Cardiol. 2018, 15, 657–658. [Google Scholar] [CrossRef]
- Ganesan, A.N.; Chew, D.P.; Hartshorne, T.; Selvanayagam, J.B.; Aylward, P.E.; Sanders, P.; McGavigan, A.D. The impact of atrial fibrillation type on the risk of thromboembolism, mortality, and bleeding: A systematic review and meta-analysis. Eur. Heart J. 2016, 37, 1591–1602. [Google Scholar] [CrossRef]
- Walch, O.; Huang, Y.; Forger, D.; Goldstein, C. Sleep stage prediction with raw acceleration and photoplethysmography heart rate data derived from a consumer wearable device. Sleep 2019, 42, zsz180. [Google Scholar] [CrossRef] [PubMed]
- Zubair, M.; Yoon, C. Multilevel mental stress detection using ultra-short pulse rate variability series. Biomed. Signal Process. 2020, 57, 101736. [Google Scholar] [CrossRef]


| Features | Description | Amplitude | Duration | Disease Diagnosis | References |
|---|---|---|---|---|---|
| R-R interval | The interval between two successive R-waves of the QRS complex ventricular rate | 0.6–1.2 s | Paroxysmal atrial fibrillation Congestive heart failure | [45,46] | |
| P wave | Atrial depolarization | 0.25 mV | 0.08–0.11 s | Atrial fibrillation Atrial hypertrophy | [47] |
| P-R interval | The time between the onset of atrial depolarization and the onset of ventricular depolarization | 0.12–0.2 s | Stroke | [41] | |
| QRS complex | Ventricular depolarization | 1.60 mV for R peak | 0.06–0.1 s | Ventricular enlargement Heart failure Tachycardia Acute Coronary Syndrome | [48,49,50] |
| ST-segment | The interval between ventricular depolarization and repolarization | 0.05–0.155 s | Myocardial ischemia or infarction | [51] | |
| T wave | Ventricular repolarization | 0.1–0.8 mV | 0.05–0.25 s | Myocardial infarction Pulmonary embolism | [46,52,53] |
| U wave | The last phase of ventricular repolarization | May not be observed because of its small size | Unknown | Unknown | [44] |
| QT interval | The time is taken for ventricular depolarisation and repolarisation | 0.35–0.44 s | Hypokalemia ventricular arrhythmias | [54] |
| Tasks | Database | Model | Signal | Performance (%) | References |
|---|---|---|---|---|---|
| AF detection | MIT-BIH | CNN and RNN | 250 samples | Acc = 97.10 Sen = 98.98 Spe = 96.95 | [129] |
| Myocardial infarction detection | PTB | CNN | 651 samples | Acc = 93.53 Sen = 93.71 Spe = 92.83 | [130] |
| CVD detection | INCART | 1D-CapsNet | 514 samples | Acc = 99.44 Sen = 99.7 Spe = 98.1 | [134] |
| MI classification | PTB | CNN | 651 samples | Acc = 99.78 Sen:above 99 Spe:above 99 | [135] |
| Arrhythmia detection | MIT-BIH | CNN | 500 samples | Acc = 92.50 Sen = 98.09 Spe = 93.13 | [131] |
| Classification of ECG signal | MIT-BIH | DNN | 300 samples | Acc = 98.6 Sen = 92.4 Spe = 99.29 | [132] |
| Classification of ECG signal | MIT-BIH | 1D-CNN | 128 samples | Acc = 99 Sen = 93.9 Spe = 98.9 | [124] |
| Classification of ECG signal | A synthetic dataset by using an ECG simulator | Short-Time Fourier Transform and CNN | 2426 samples | Acc = 99.2 | [136] |
| AF detection | IEEE-TBME | CNN | 512 samples | Acc = 96.1 Sen = 97.0 Spe = 100.0 | [137] |
| Classification of ECG signal | TNMG | DNN | 2800 samples | Spe:above 99 | [138] |
| AF detection | iRhythm Technologies | DNN | 256 samples | AUC:above 97 Sen:above 90 Spe:above 90 | [14] |
| Classification of ECG signal | MIT-BIH | DNN | 360 samples | AUC = 0.999 Acc = 98.97 Sen = 97.68 Spe = 99.89 | [139] |
| AF detection | MIT-BIH | CNN | 360 samples | Acc = 99.45 Sen = 99.29 | [140] |
| MI detection | PTB | CNN | 800 samples | Acc = 95.49 Sen = 94.85 Spe = 97.37 | [141] |
| AF detection | MIT-BIH | CNN | 3600 samples | Acc = 91.33 Sen = 83.91 Spe:above 99 | [142] |
| Database | Subjects | Records | Duration (min) | Frequency (Hz) | Leads | Resolution (bit) |
|---|---|---|---|---|---|---|
| MIT-BIH Arrhythmia | 47 | 48 | 30 | 360 | 12 | 11 |
| MIT-BIH AF | 25 | 25 | 10 h | 250 | 2 | 12 |
| MIT-BIH ST Change | 28 | 28 | 13–67 | 360 | 1–2 | N/A |
| MIT-BIH Long Term | 7 | 7 | 14–22h | 128 | 2lead:12 1lead:10 | 2lead:6 1lead:3 |
| MIT-BIH SUPRA | N/A | 78 | 30 | 128 | 10 | 2 |
| PTB | 290 | 549 | N/A | 1k | 12 + 3 Frank-lead | 16 |
| AHA | N/A | 10 | 30 | 250 | 2 | 12 |
| INCART | 32 | 75 | 30 | 257 | N/A | 12 |
| UofTDB | 1020 | 1020+ | 2 to 5 | 200 | 1 | 12 |
| Fantasia | 40 | 40 | 120 | 250 | N/A | N/A |
Publisher’s Note: MDPI stays neutral with regard to jurisdictional claims in published maps and institutional affiliations. |
© 2020 by the authors. Licensee MDPI, Basel, Switzerland. This article is an open access article distributed under the terms and conditions of the Creative Commons Attribution (CC BY) license (http://creativecommons.org/licenses/by/4.0/).
Share and Cite
Xie, L.; Li, Z.; Zhou, Y.; He, Y.; Zhu, J. Computational Diagnostic Techniques for Electrocardiogram Signal Analysis. Sensors 2020, 20, 6318. https://doi.org/10.3390/s20216318
Xie L, Li Z, Zhou Y, He Y, Zhu J. Computational Diagnostic Techniques for Electrocardiogram Signal Analysis. Sensors. 2020; 20(21):6318. https://doi.org/10.3390/s20216318
Chicago/Turabian StyleXie, Liping, Zilong Li, Yihan Zhou, Yiliu He, and Jiaxin Zhu. 2020. "Computational Diagnostic Techniques for Electrocardiogram Signal Analysis" Sensors 20, no. 21: 6318. https://doi.org/10.3390/s20216318
APA StyleXie, L., Li, Z., Zhou, Y., He, Y., & Zhu, J. (2020). Computational Diagnostic Techniques for Electrocardiogram Signal Analysis. Sensors, 20(21), 6318. https://doi.org/10.3390/s20216318